Article

Extraction of Pavement Texture–Friction Surface Density Index Using High-Precision Three-Dimensional Images

1
School of Architecture and Civil Engineering, Chengdu University, Chengdu 610106, China
2
College of Civil Engineering, Southwest Jiaotong University, Chengdu 610031, China
*
Author to whom correspondence should be addressed.
Lubricants 2025, 13(7), 288; https://doi.org/10.3390/lubricants13070288
Submission received: 24 May 2025 / Revised: 20 June 2025 / Accepted: 24 June 2025 / Published: 27 June 2025
(This article belongs to the Special Issue Tire/Road Interface and Road Surface Textures)

Abstract

Pavement surface texture significantly affects its skid resistance. To characterize pavement surface texture and analyze its correlation with skid resistance, this paper proposes a novel three-dimensional (3D) texture evaluation index: mean texture surface area density (MTSAD). First, field tests were conducted on Chengdu Greenway pavement using a portable laser scanner to collect high-precision texture data, while a pendulum friction tester was employed to measure the British Pendulum Number (BPN). Subsequently, digital image processing technology was employed for the 3D reconstruction of pavement texture. Leveraging the high-resolution data characteristics and incorporating the concept of infinite subdivision, an innovative method for calculating the pavement texture surface area was developed, ultimately yielding the MTSAD. Finally, polynomial regression analysis was performed to examine the correlation between MTSAD and BPN, revealing a coefficient of determination (R2) of 0.8302. The results demonstrate a close relationship between MTSAD and pavement friction, while proving that texture indices that are easy to promote can be obtained through high-precision 3D point cloud images, and validating the potential of non-contact texture measurement as a viable alternative to conventional contact-based friction testing methods.

1. Introduction

To satisfy traffic safety requirements, pavements should provide sufficient skid resistance to vehicle tires [1]. The skid resistance between tires and the pavement is a highly complex phenomenon influenced by numerous factors. Tire tribology examines friction, wear, and lubrication at the contact interface between tires and pavement during relative motion. The application of the solid friction theory to analyze tire–pavement friction involves four key aspects [2]: (1) van der Waals forces between the tire and pavement, (2) adhesion between the tire and pavement, (3) elastic deformation of the tread rubber, and (4) micro-cutting by small pavement asperities. A greater tire–pavement contact area enhances adhesion [3], and this area is closely related to the surface area of the pavement texture. From the perspective of the entire contact system, pavement skid resistance is primarily affected by three aspects: the pavement, tires, and the contact environment [4,5,6]. In terms of the pavement, the main factors influencing skid resistance include pavement surface texture, geometric alignment, and structural stiffness. For tires, the key factors affecting skid resistance include vehicle characteristics and tire characteristics. Among them, the tire slip ratio directly impacts the friction coefficient, typically with a peak slip ratio ranging from 7% to 25%, which varies with speed [7]. The influencing factors in the tire–pavement contact environment exhibit greater diversity. For example, automobile tire rubber is a viscoelastic material, whose properties are significantly affected by temperature changes and other thermal properties (such as thermal conductivity and specific heat). Additionally, water, which can exist in various forms as a lubricant, significantly reduces the friction between tires and the pavement. Surface texture plays a critical role in understanding the complex mechanisms of tire–road friction and has become a focal point of the research. Pavement texture is defined as the deviation in amplitude from a true plane and was classified by the Permanent International Association of Road Congresses (PIARC) in 1987 into four categories based on surface construction wavelength and amplitude: micro-texture, macrotexture, megatexture, and unevenness [8]. Studies [9,10,11] have indicated that road friction safety is primarily influenced by macrotexture and micro-texture, whereas megatexture and unevenness are more associated with noise, rolling resistance, and tire wall vibration. Micro-texture refers to the surface roughness of coarse aggregates with wavelengths ≤ 0.5 mm. It is determined by the angularity and texture of aggregate particles, enabling tires to cut through water films and ensuring skid resistance, particularly under dry and low-speed conditions. Macrotextures with wavelengths between 0.5 and 50 mm are influenced by the size, shape, spacing, and arrangement of aggregate particles. It plays a significant role in enhancing pavement friction performance under wet and high-speed conditions [4,11,12].
Current evaluations of pavement skid resistance, both domestically and internationally, focus on pavement friction factors and texture depth [3]. The volume index is traditionally used to characterize pavement texture, whereas the texture depth quantitatively represents the volume of the surface texture [13]. It is far from sufficient to evaluate pavement skid resistance only by the texture structure depth. Therefore, the researchers have started to explore many other alternatives related to texture shape. Sabey [14] investigated the effect of asperity shapes on friction and found that conical asperities generated greater friction than spherical asperities. Forster [15] highlighted the importance of asperity sharpness and observed that smaller asperity angles led to higher friction. Do [16] introduced the concept of an indentor for texture characterization, defining three parameters: indentor shape associated with asperity tip angle, convexity linked to height differences among asperities, and density reflecting the number of asperities per unit distance. Despite these advances, the parameters derived from these methods do not exhibit a strong correlation with friction force parameters.
Advancements in non-contact 3D measurement technology and enhanced computational power have facilitated the analysis of 2D and 3D pavement texture profiles, enabling the development of new texture indicators and their correlation with pavement friction. Techniques such as wavelet analysis, Hilbert–Huang Transform (HHT), fractal analysis, power spectral density (PSD), and neural networks have been employed to characterize pavement texture and its impact on friction performance [17,18,19]. Lanruo Zhao [20] et al. obtained the 3D texture information and corresponding PSDs of each pavement, and introduced the pavement’s texture into the friction model. Kane [21] utilized the HHT method to examine the texture–friction relationship, identifying specific parameters derived from texture profile functions as significantly related to friction, thereby endorsing HHT as a viable alternative to traditional methods. Ahmed S. El-Ashwah [22] provides a comprehensive analysis of the HHT technique and compares several texture parameters computed from the decomposed texture profile. B. Kogbara [23] applied close-range photogrammetry (CRP) to measure asphalt pavement texture, focusing on the top 2 mm layer, which demonstrated a stronger correlation with friction. He identified the peak density and peak material volume, particularly Spd, as critical indicators of friction throughout the pavement lifecycle. Kanafi [24] conducted field tests on existing pavements, characterized the changes in macro- and micro-textures under real road conditions, and confirmed their relationship with friction values. Several statistical texture indicators, spectral analysis, and optical simulation images of texture surface height maps were utilized to analyze the macro- and micro-texture evolution and investigate the related physical phenomena. Kanafi concluded that the fractal index Hurst was unsuitable as a pavement texture indicator but identified the top 20% of the PSD as having a stronger correlation with friction [25]. Hu [26] reconstructed 3D macrotexture images using measured data, characterized their 3D features using eight parameters, and statistically analyzed their influence on the dynamic friction coefficient. He discovered that the peak density and arithmetic peak curvature significantly enhanced the dynamic friction coefficient and recommended improving the skid resistance by increasing exposed aggregates and using angular aggregates. Qiang (Joshua) Li [27] evaluated five types of 3D surface parameters to characterize pavement texture properties and established a relationship between friction and these parameters, identifying core material volume and peak density as the most influential factors for both high-speed and low-speed wet conditions. Guoping Qian [28] collected the high-precision texture data of different types of asphalt pavements with different degrees of abrasion. The macro- and microtexture evaluation indexes were obtained after data filtering and separation, and correlation analysis was conducted with anti-skid performance indexes. In summary, the core analytical framework of the statistical model based on texture characteristic parameters can be systematically summarized as illustrated in Figure 1 [29]. The pavement texture evaluation system is categorized, according to the assessment subjects, into 2D evaluation indices derived from profile contours and 3D evaluation indices constructed based on surface texture morphology [30]. Compared with 2D evaluation indices, 3D evaluation indices can more comprehensively characterize the three-dimensional features of pavement texture, and the evaluation results have higher stability. Although the current relevant research achievements can quantitatively analyze the texture of asphalt pavement from different aspects and provide a certain theoretical basis for qualitatively evaluating the surface function of asphalt pavement, there are still problems, such as poor universality and difficulty in the promotion and application of evaluation indices [31]. Therefore, how to solve the universality problem of 3D evaluation indices is the key to promoting the application of 3D evaluation indices for asphalt pavement.
To address the issues of poor universality and difficult promotion in existing texture evaluation indices [30], the overall objective of this study is to propose an intuitive and easily promotable 3D texture evaluation index based on high-precision 3D structure images, by calculating the surface area of the texture, and to explore the correlation between the texture surface area index and friction. Therefore, this study collects high-precision pavement texture data through 3D laser measurement technology and uses digital image processing technology to preprocess and reconstruct 3D texture images. According to the characteristics of high-precision data, combined with the concept of infinite subdivision, the 3D structure of pavement texture is subdivided into numerous spatial triangles to calculate the surface area of pavement texture, finally completing the calculation of the mean texture surface area density (MTSAD).
Compared with the previous research, this research proposes a 3D evaluation index based on the high-precision 3D structure images of pavement texture, considering the contact area between tires and pavement. Unlike traditional texture indices, such as MTD (Mean Texture Depth) and MPD (Mean Profile Depth), the MTSAD index contains 3D texture structure information, enabling a more accurate evaluation of pavement skid resistance. In contrast to 3D texture evaluation indices calculated by methods such as fractal dimension, Fourier transform, and wavelet transform, the 3D index proposed in this study is more intuitive and easier to popularize. This research conducts a correlation analysis between MTSAD and BPN values, and the results show a high correlation. Therefore, this research demonstrates certain value for the research on pavement texture–friction relationships.

2. Three-Dimensional Point Cloud Data Acquisition and Area Calculation

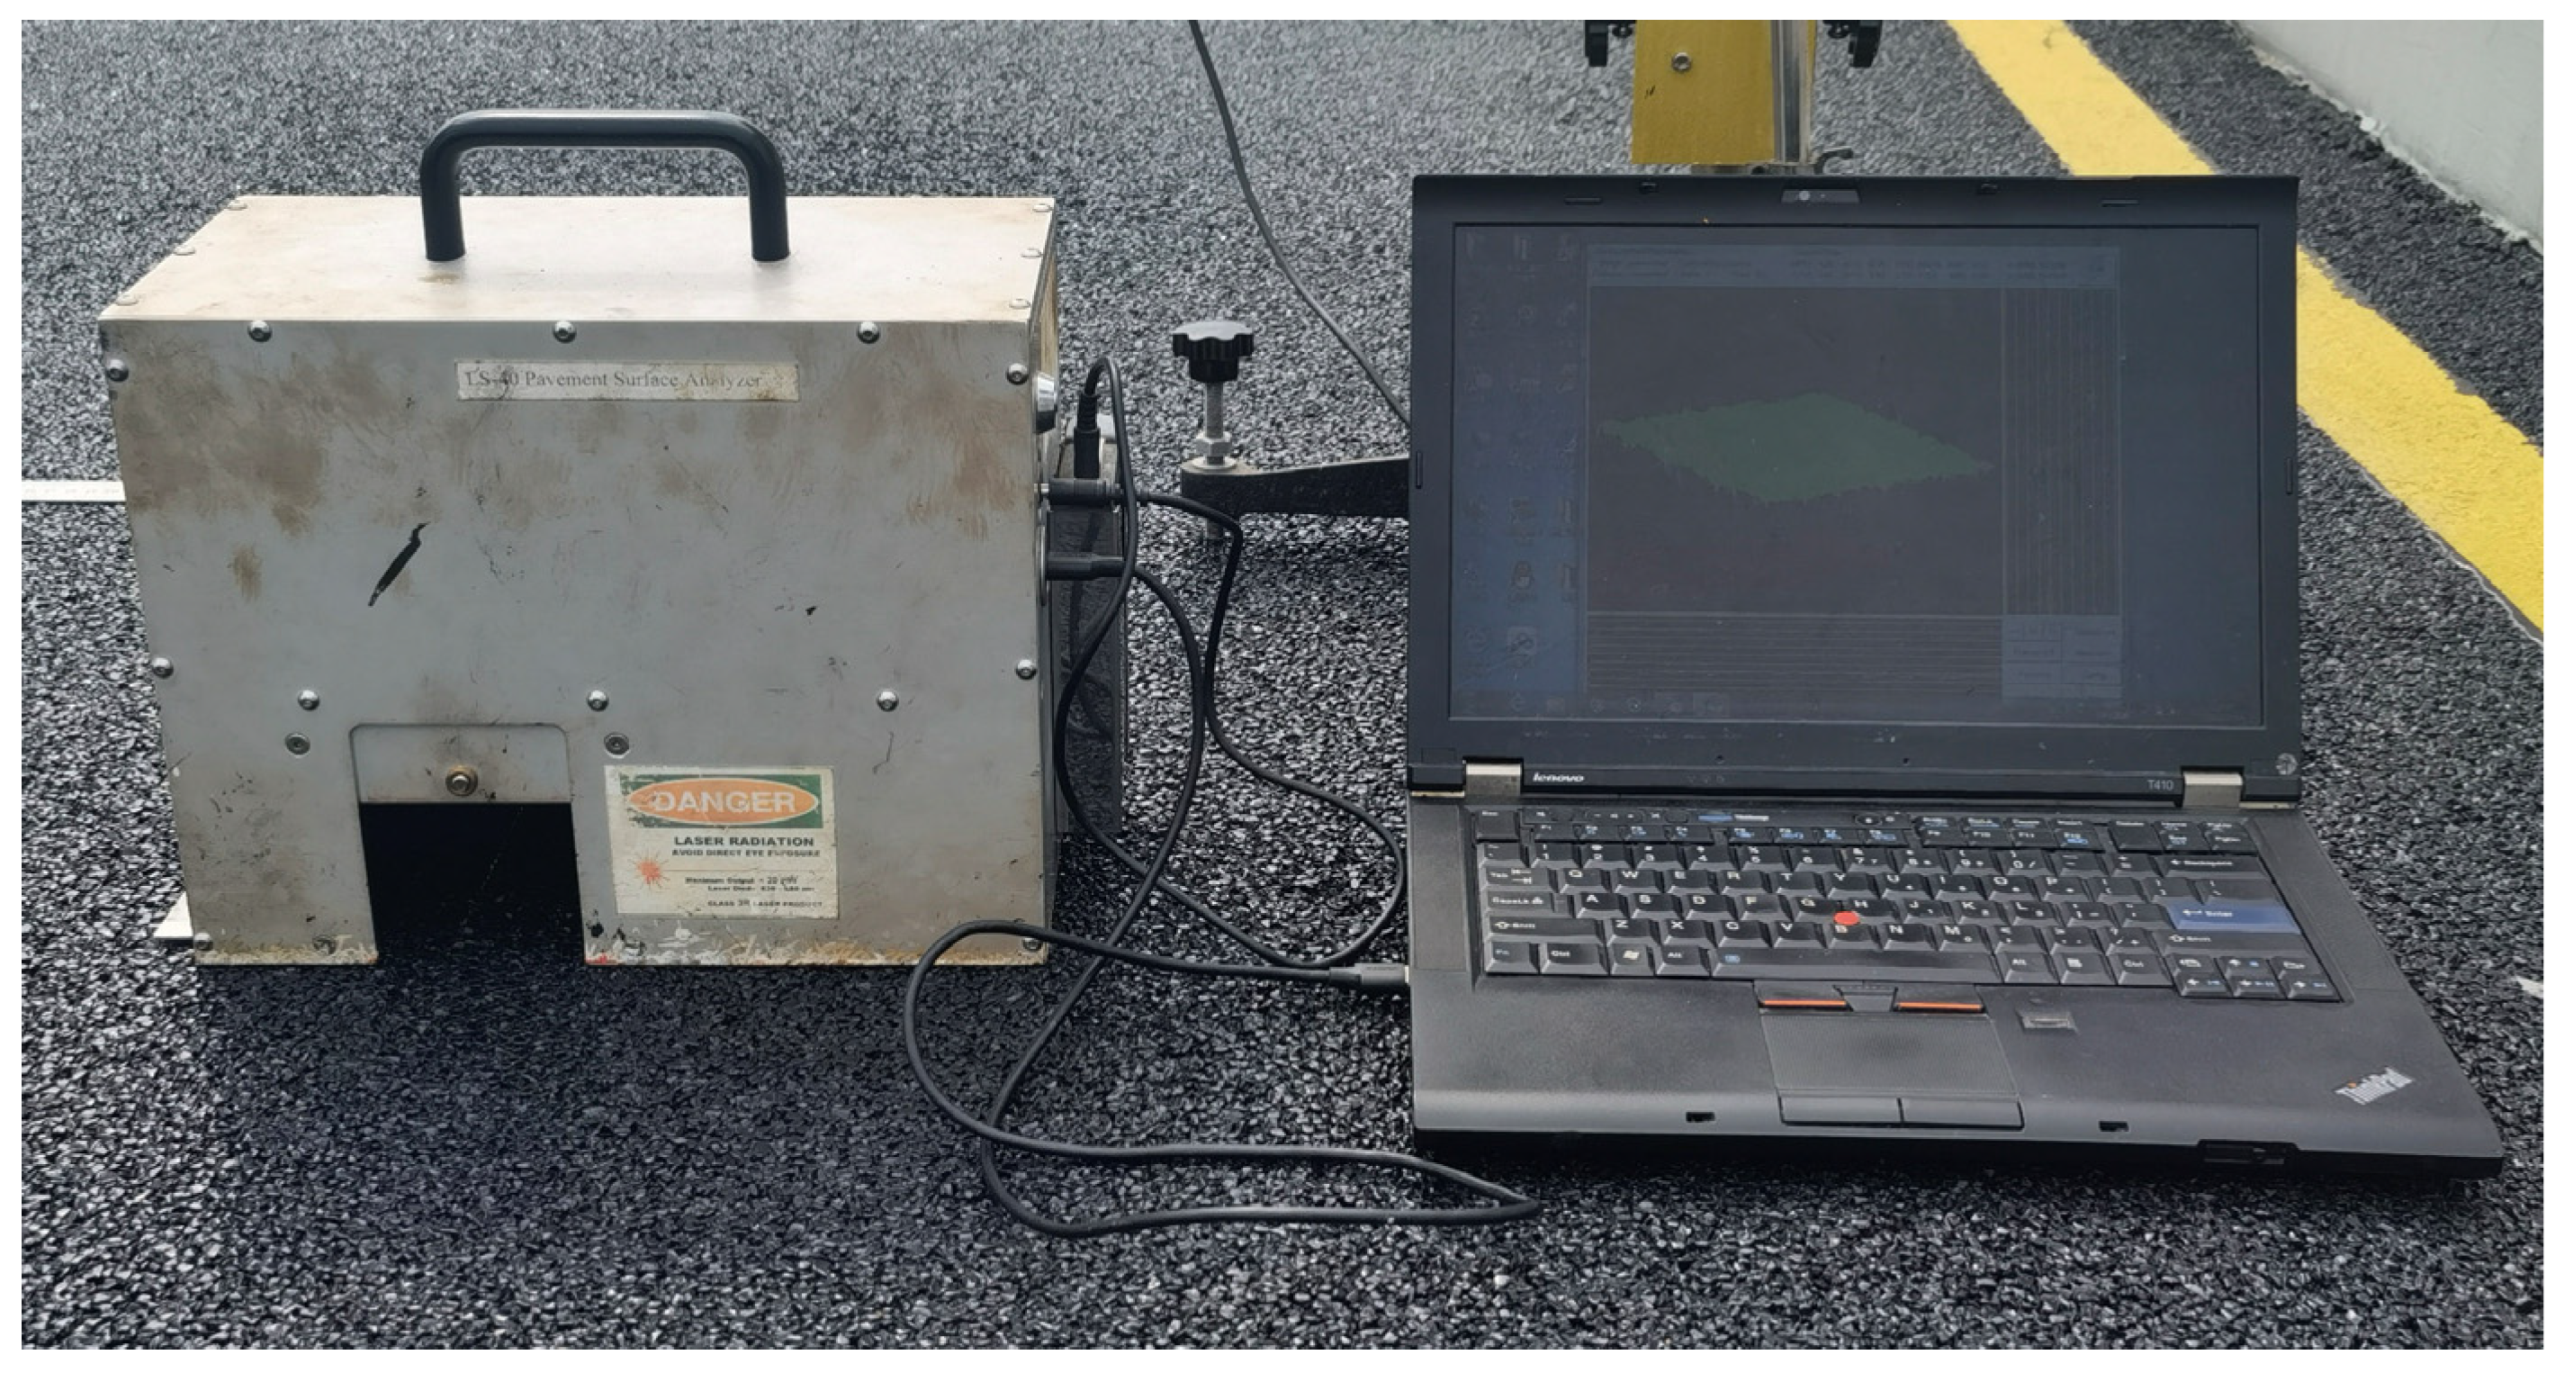
This chapter mainly introduces 3D point cloud data acquisition and area calculation. This research used an LS-40 Pavement Analyzer to collect high-precision 3D texture structure point cloud data on the Chengdu Ring Road Greenway. Based on the spatial structural characteristics of high-precision 3D point cloud data, this chapter investigates the area calculation of irregular shapes in 3D space, describes the existing irregular surface area image measurement method proposed in this paper, and presents an area calculation method based on high-precision pixel-level spatial construction.

2.1. Testing Equipment

2.1.1. Pendulum Friction Tester

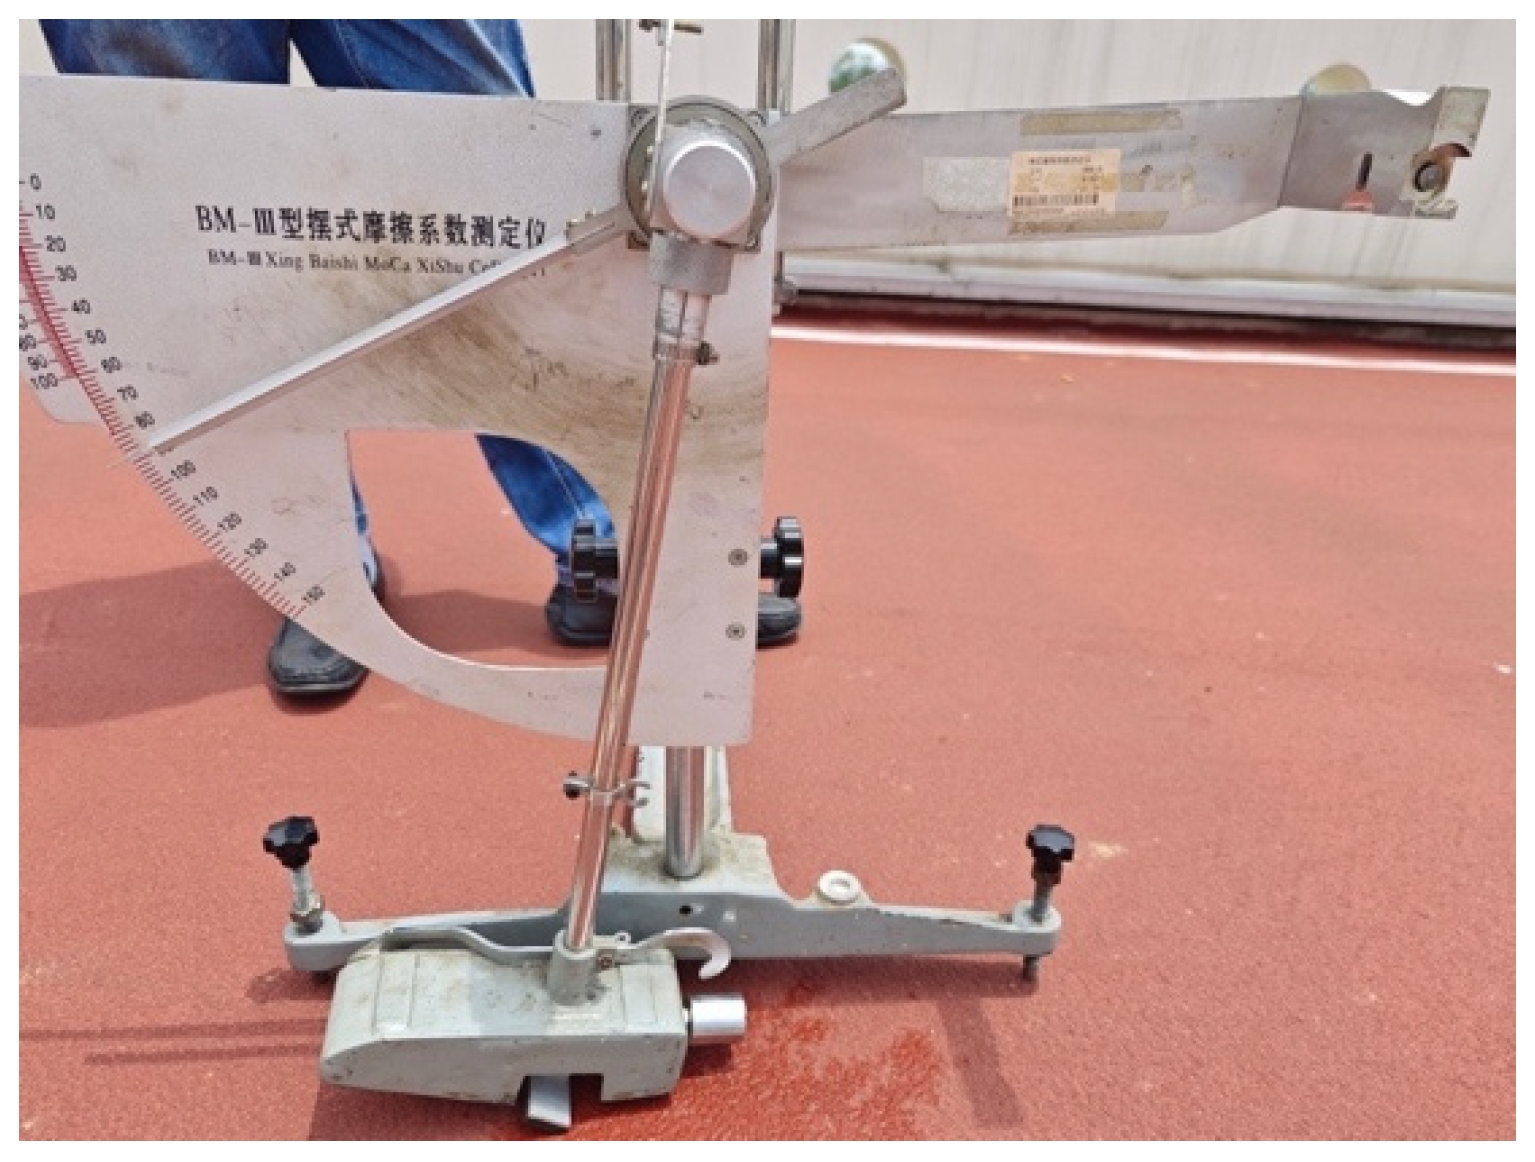
A portable pendulum tester developed by the UK Transport and Pavement Research Laboratory (TRRL) for measuring pavement surface skid resistance has gained global adoption. The BPN obtained using this device serves as a comprehensive indicator of the pavement surface skid resistance (Figure 2).

2.1.2. LS-40 Pavement Analyzer

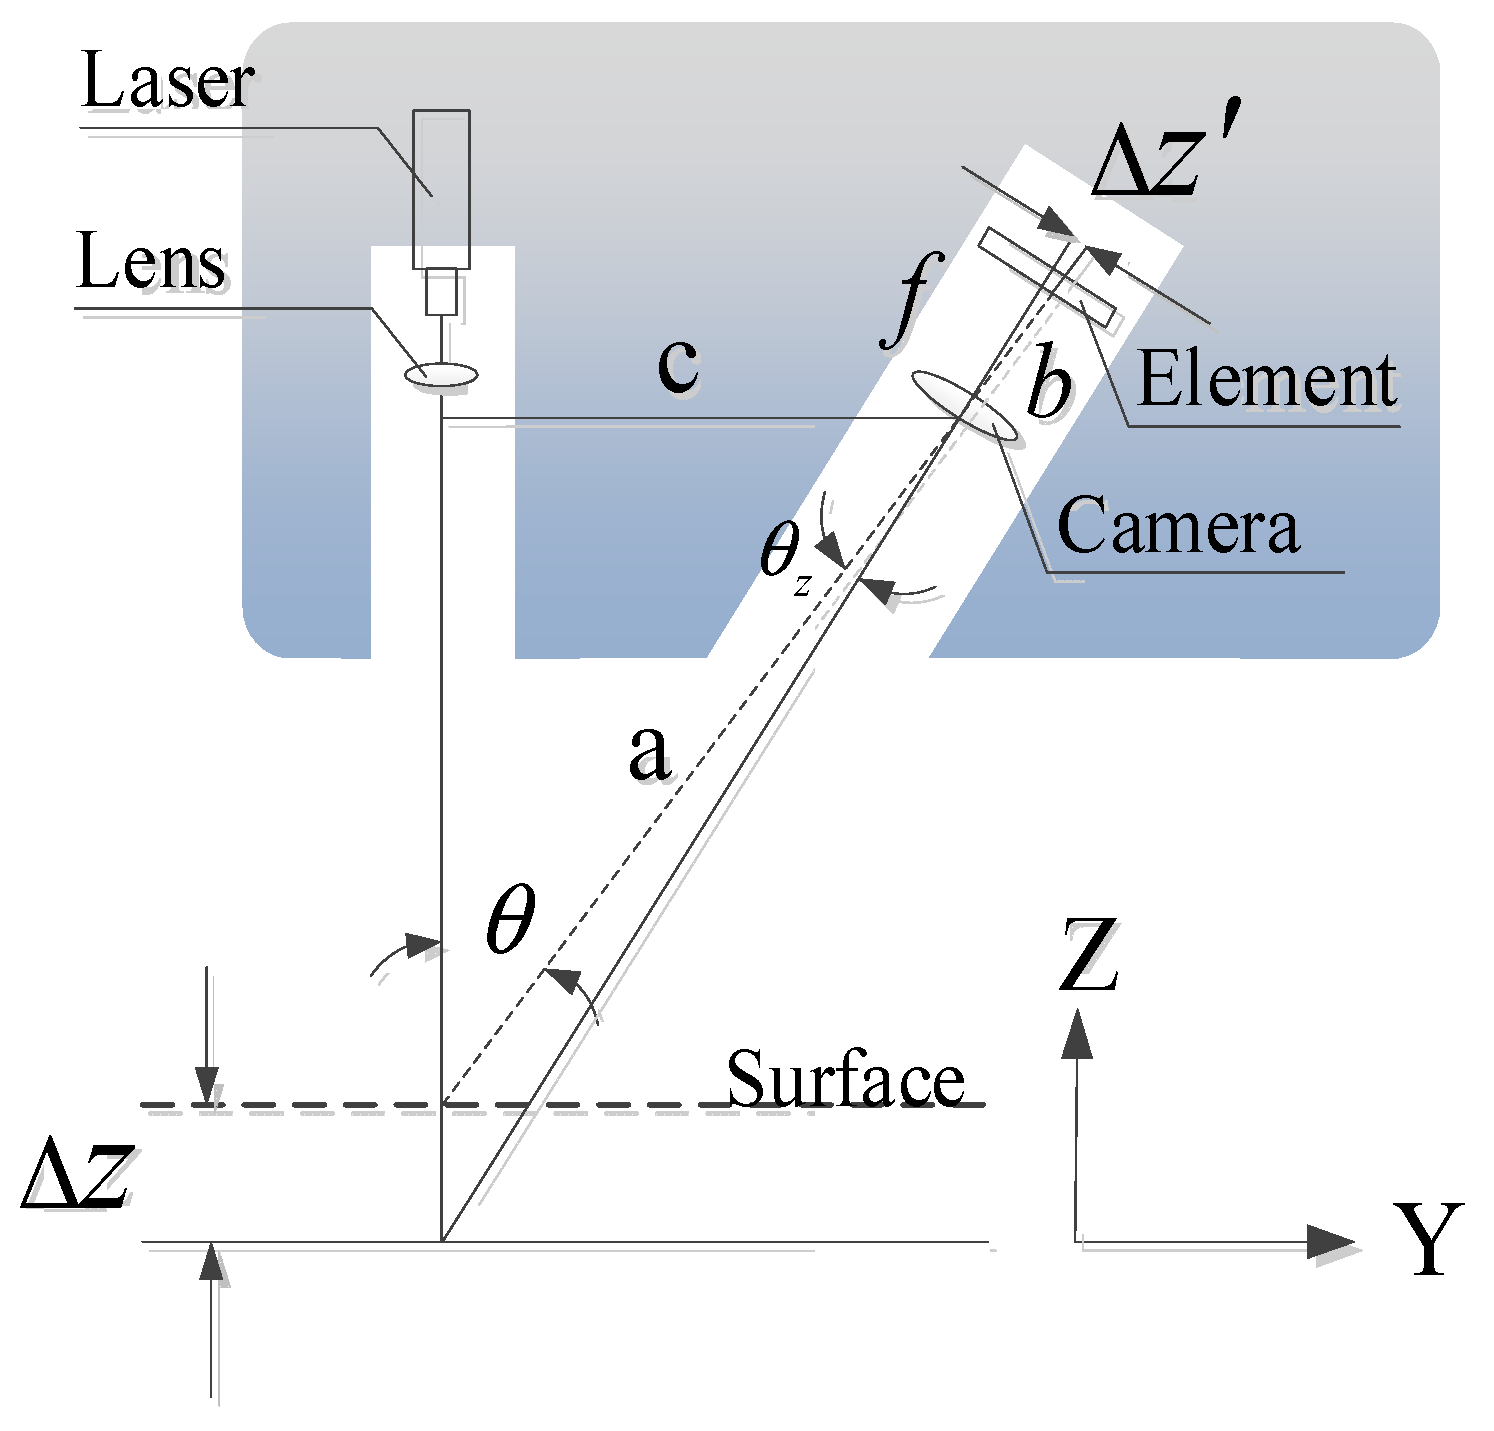
The LS-40 pavement analyzer (Figure 3) is an advanced instrument for texture data acquisition and analysis that incorporates a laser camera module with a line laser and a camera powered by a battery. As shown in Figure 4, the internal motorized table moves the acquisition unit at a predefined speed, utilizing the direct laser triangulation method. The system projects a line laser onto the pavement, scans the selected area, and collects surface data based on the laser triangulation principle. The results are displayed as numerical data and 2D/3D visualizations. The LS-40 captures the high-precision 3D pavement texture data, scanning an area of 10 × 11.5 cm with the lateral resolution of approximately 0.05 mm and a height measurement range of 25 mm. This enables the measurement of features 12.5 mm above and below the surface, with the longitudinal resolution of approximately 0.01 mm. The original data included intensity and range data arrays, each comprising 2448 × 2048 16 bit data points. Notably, LS-40 data collection was unaffected by ambient light sources.

2.2. Test Subject

This study assessed the skid-resistance performance of a first-level greenway bridge deck in the Ring City Ecological Park. The evaluation included measurements of the pavement friction coefficient and micro-texture structure. The sampled sections comprised the greenway bridge pavements from Cheng’an-Yu (Ginkgo Bridge), Shaxi Line Bridge (Shaxi·Woye Bridge), Jin Fenghuang Avenue (Xindu·Jin Fenghuang Bridge), and Chengyu (Yurui Bridge), as shown in Figure 5. The field-tested road is a cycling lane, and the pavement material is colored anti-slip mortar paved on an asphalt base course.
The tests for the detected sections were conducted in accordance with the “Field Test Methods of Highway Subgrade and Pavement (JTG 3450-2019) [32]”, following the guidelines outlined in the “Method for Measuring Pavement Friction Coefficient with Pendulum Instrument” and the “Technical Specifications for Ground 3D Laser Scanning Engineering Applications”.

2.3. Calculation of Area for Irregular Shapes in 3D Space

2.3.1. Existing Image Measurement Methods for Irregular Surface Areas

The traditional approach to measuring areas involves determining the length and width of an object and applying basic mathematical formulas that are effective for regular planar areas owing to their simplicity and accuracy. However, Calculating the areas of irregularly shaped objects using traditional methods can be challenging. The current research on calculating the area of irregular surfaces primarily focuses on surface area determination. Methods for calculating the area of a 3D surface include unfolding, integral, and projection methods [33,34,35,36]. The unfolding method is generally applicable to developable or approximately developable surfaces [33]. The integral method is suitable for relatively regular surface shapes but presents challenges when solving equations for irregular shapes [35]. The projection method designed for irregular surface shapes [36] operates by projecting discrete spatial data points onto xoy, yoz, and zox planes. However, determining the angle between the surface normal and the coordinate axes limits its practicality [33].
(1)
Integration method
The integration method involves determining the surface equation using surface integrals, selecting an appropriate integration formula, determining the partial derivatives of the surface equation, and calculating the double definite integral within the specified surface boundaries. For a surface equation of the form z = f(x, y), when the angle between the normal of the tangent plane T and coordinate axis is acute, the surface area can be calculated using the following integration formula:
s = D x y 1 + z x 2 + z y 2 d x d y s = D x z 1 + y x 2 + y z 2 d x d y s = D y z 1 + x y 2 + x z 2 d y d z
where D x y , D x z , and D y z are the projection areas of the surface on the xoy, xoz, and yoz coordinate planes, respectively.
Obtaining an accurate surface equation for irregular shapes is challenging when the integration method is typically effective for regular surface shapes. In addition, if the antiderivative of the integrand is not an elementary function, solving the double integral becomes complex, making this method less suitable for irregular surfaces.
(2)
Perturbation method
The perturbation method can be used to overcome the challenge of solving double integrals when the anti-derivative of the integrand is not an elementary function. This method approximates the solution by expanding small parameters in the analytical expression, thereby providing an approximate analytical solution. First, we write the surface equation z = f(x, y) and select an appropriate area integral formula s = D x y 1 + z x 2 + z y 2 d x d y . Next, the partial derivatives of the surface equation are taken, and the small parameters in the equation are expanded as a series, with integration performed term by term.
However, the perturbation method still encounters challenges in obtaining the surface equation and may experience issues with non-convergence during series expansion.
(3)
Projection method
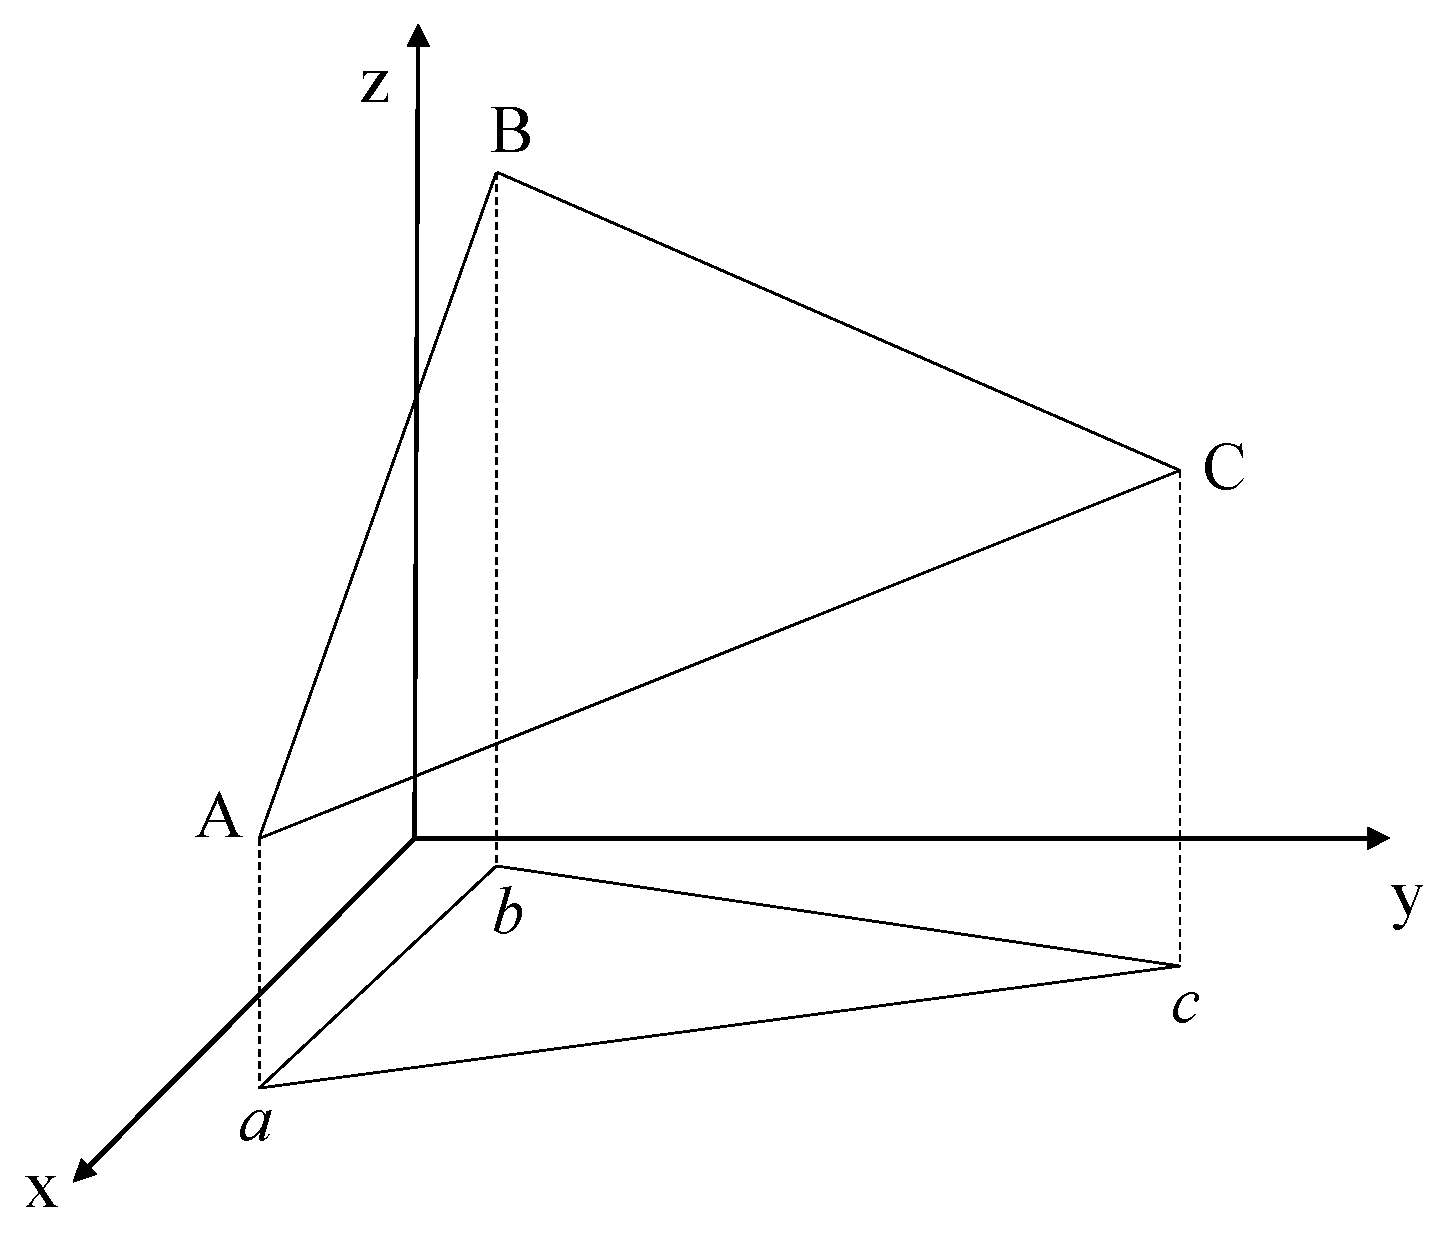
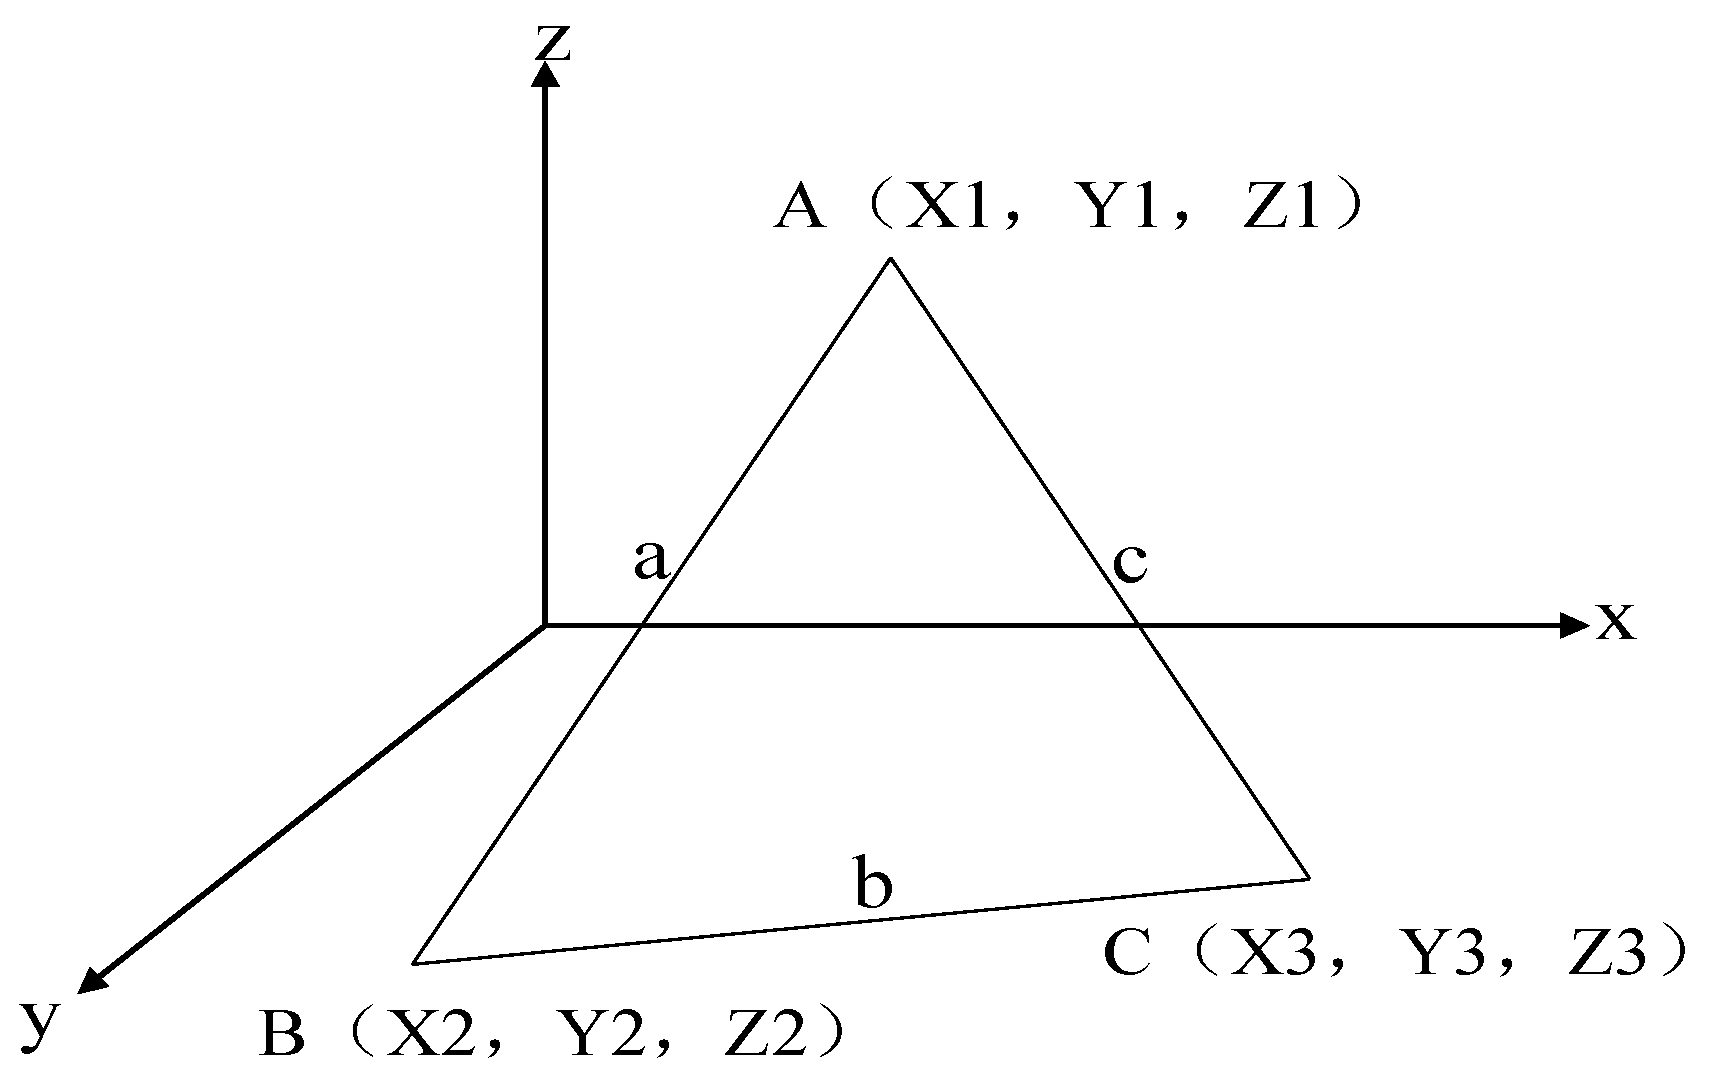
As shown in Figure 6, the projection of spatial triangle ΔABC onto the xoy plane results in triangle Δabc. Assuming the projection planes are the yoz and xoz planes, the respective projections are Δabc′ and Δabc″. The size relationship between ΔABC and its projections is as follows:
Δ   A   B   C = Δ   a   b   c cos α = Δ   a b c cos β = Δ   a b c cos γ
where α, β, and γ are the angles of inclination of the projection planes of ΔABC onto the xoy, yoz, and xoz planes, respectively. They are also the angles between the normal of the plane ΔABC and the z-, x-, and y-axes.
The angles between the triangle and the xoy, yoz, and zox planes can demonstrate the following relationship, as shown in the following formula:
cos 2   α + cos 2   β + cos 2   γ = 1
Assuming the total area of triangle ΔABC is S, the areas of its projected triangles Δabc, Δa′b′c′, and Δa″b″c″ are Sxoy, Syoz, and Sxoz, respectively, it can be concluded that:
S xoy = S cos α S yoz = S cos β S xoz = S cos γ
By combining Equations (3) and (4), we obtained:
S 2 = S xoy 2 + S yoz 2 + S xoz 2
To solve for the surface area, the surface fitting method was applied to the obtained discrete point space, which underwent orthogonal partitioning and interpolation, resulting in n small grids. The area of each small grid, Si (i = 1, 2, 3,…, n), was calculated using Equation (5), and their sum yielded the total surface area, S.
The projection method offers advantages, such as good intuitiveness and high accuracy. However, it requires an angle between the surface normal and coordinate axis, as well as orthogonal partitioning and the interpolation of the discrete space, which can lead to lower algorithm efficiency and limited practicality.
The previously discussed surface area calculation method is typically suited to relatively simple surface equations or more regular surface shapes, offering moderate practicality. However, with advancements in sensor and digital image processing technologies, the researchers have begun to explore area measurements through computer vision.

2.3.2. An Area Calculation Method Based on High-Precision Pixel-Level Spatial Construction

This study utilized LS-40 to acquire high-precision 3D texture data and introduced a pixel-level surface area calculation method based on the precise 3D reconstruction of pavement textures. This method subdivides the 3D surface into n small planes, each defined by three points, taking advantage of the high data accuracy. The surface area of each small plane was calculated, and the total 3D surface area was determined by summing the individual areas.
  • Calculation of the Area of a Spatial Triangle
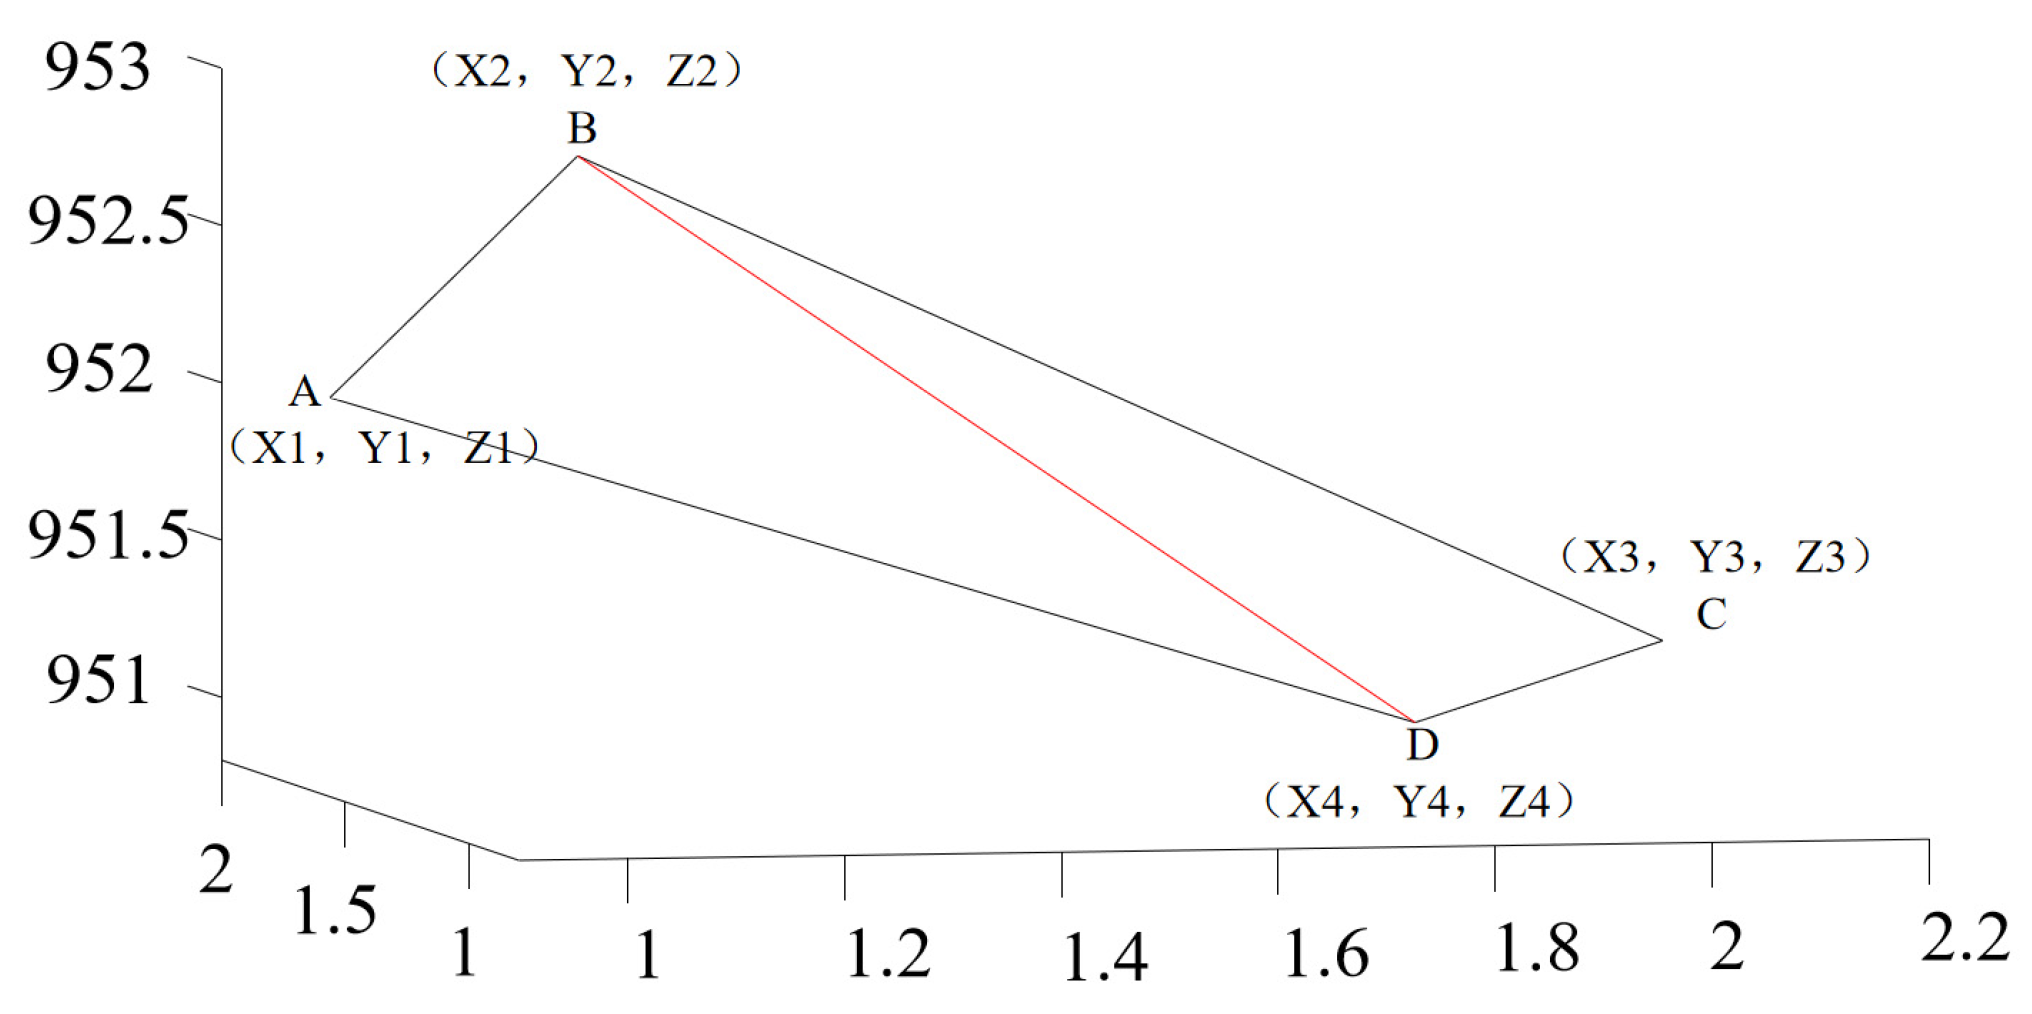
In a 3D space, three points define a plane, and the area of the triangle formed by these points represents the area of the plane. Figure 7 illustrates a spatial plane triangle with sides a, b, and c, and the coordinates of points A, B, and C are (X1, Y1, Z1), (X2, Y2, Z2), and (X3, Y3, Z3), respectively.
The area of a spatial triangle can be calculated using Heron’s formula. Let the semi-perimeter be p = (a + b + c)/2, and the area of the triangle is given by the following formula:
S = p ( p a ) ( p b ) ( p c )
According to the Pythagorean theorem, the lengths of the three sides a, b, and c of a spatial triangle can be determined using the distance formula between points in a 3D space. The specific formula is as follows:
a = ( X 2 X 1 ) + ( Y 2 Y 1 ) + ( Z 2 Z 1 )
b = ( X 3 X 2 ) + ( Y 3 Y 2 ) + ( Z 3 Z 2 )
c = ( X 3 X 1 ) + ( Y 3 Y 1 ) + ( Z 3 Z 1 )
Substituting Formulas (7), (9), and (10) into the semi-perimeter equation p = (a + b + c)/2, we obtained the following formula for semi-perimeter p:
p = ( X 2 X 1 ) + ( Y 2 Y 1 ) + ( Z 2 Z 1 ) + ( X 3 X 2 ) + ( Y 3 Y 2 ) + ( Z 3 Z 2 ) + ( X 3 X 1 ) + ( Y 3 Y 1 ) + ( Z 3 Z 1 ) 2
By combining Formulas (6) and (10), the area S of the spatial triangle can be expressed as a function of the spatial points.
S = f ( X 1 , Y 1 , Z 1 , X 2 , Y 2 , Z 2 , X 3 , Y 3 , Z 3 )
where f( ) is a function of the 3D spatial coordinates.
2
Solving for the Surface Area of a 3D Surface
Using high-precision 3D texture data and the concept of integration, the 3D surface was subdivided into n spatial triangles. The area Sj (j = 1, 2, 3,…, n) of each triangle was calculated, and the total surface area S was obtained by summing these areas, expressed through the 3D spatial coordinates X, Y, and Z:
S = i = 1 n S j = f ( X , Y , Z )

3. Mean Texture Surface Area Density

MTD is a key indicator for evaluating pavement skid resistance, as it characterizes surface roughness through the calculation of pavement texture volume and is highly correlated with anti-sliding performance. High-precision 3D texture images can capture detailed surface information, using high-precision 3D images, the texture surface area of the pavement can be calculated to explore the correlation between surface area indicators and friction, thereby overcoming the limitations of traditional volume indicators. Therefore, this study introduced MTSAD as a novel indicator for evaluating skid resistance; MTSAD is quantitatively defined as the ratio of the texture surface area to the scanned area.
M T S A D = S / S H = S / a × b
where MTSAD is the average surface area density of the pavement texture, S is the total surface area of the scanned region, measured in mm2, and SH is the planar area of the scanned region (i.e., the horizontal projection area), which can be calculated from the side lengths a and b of the measured region, measured in mm2.
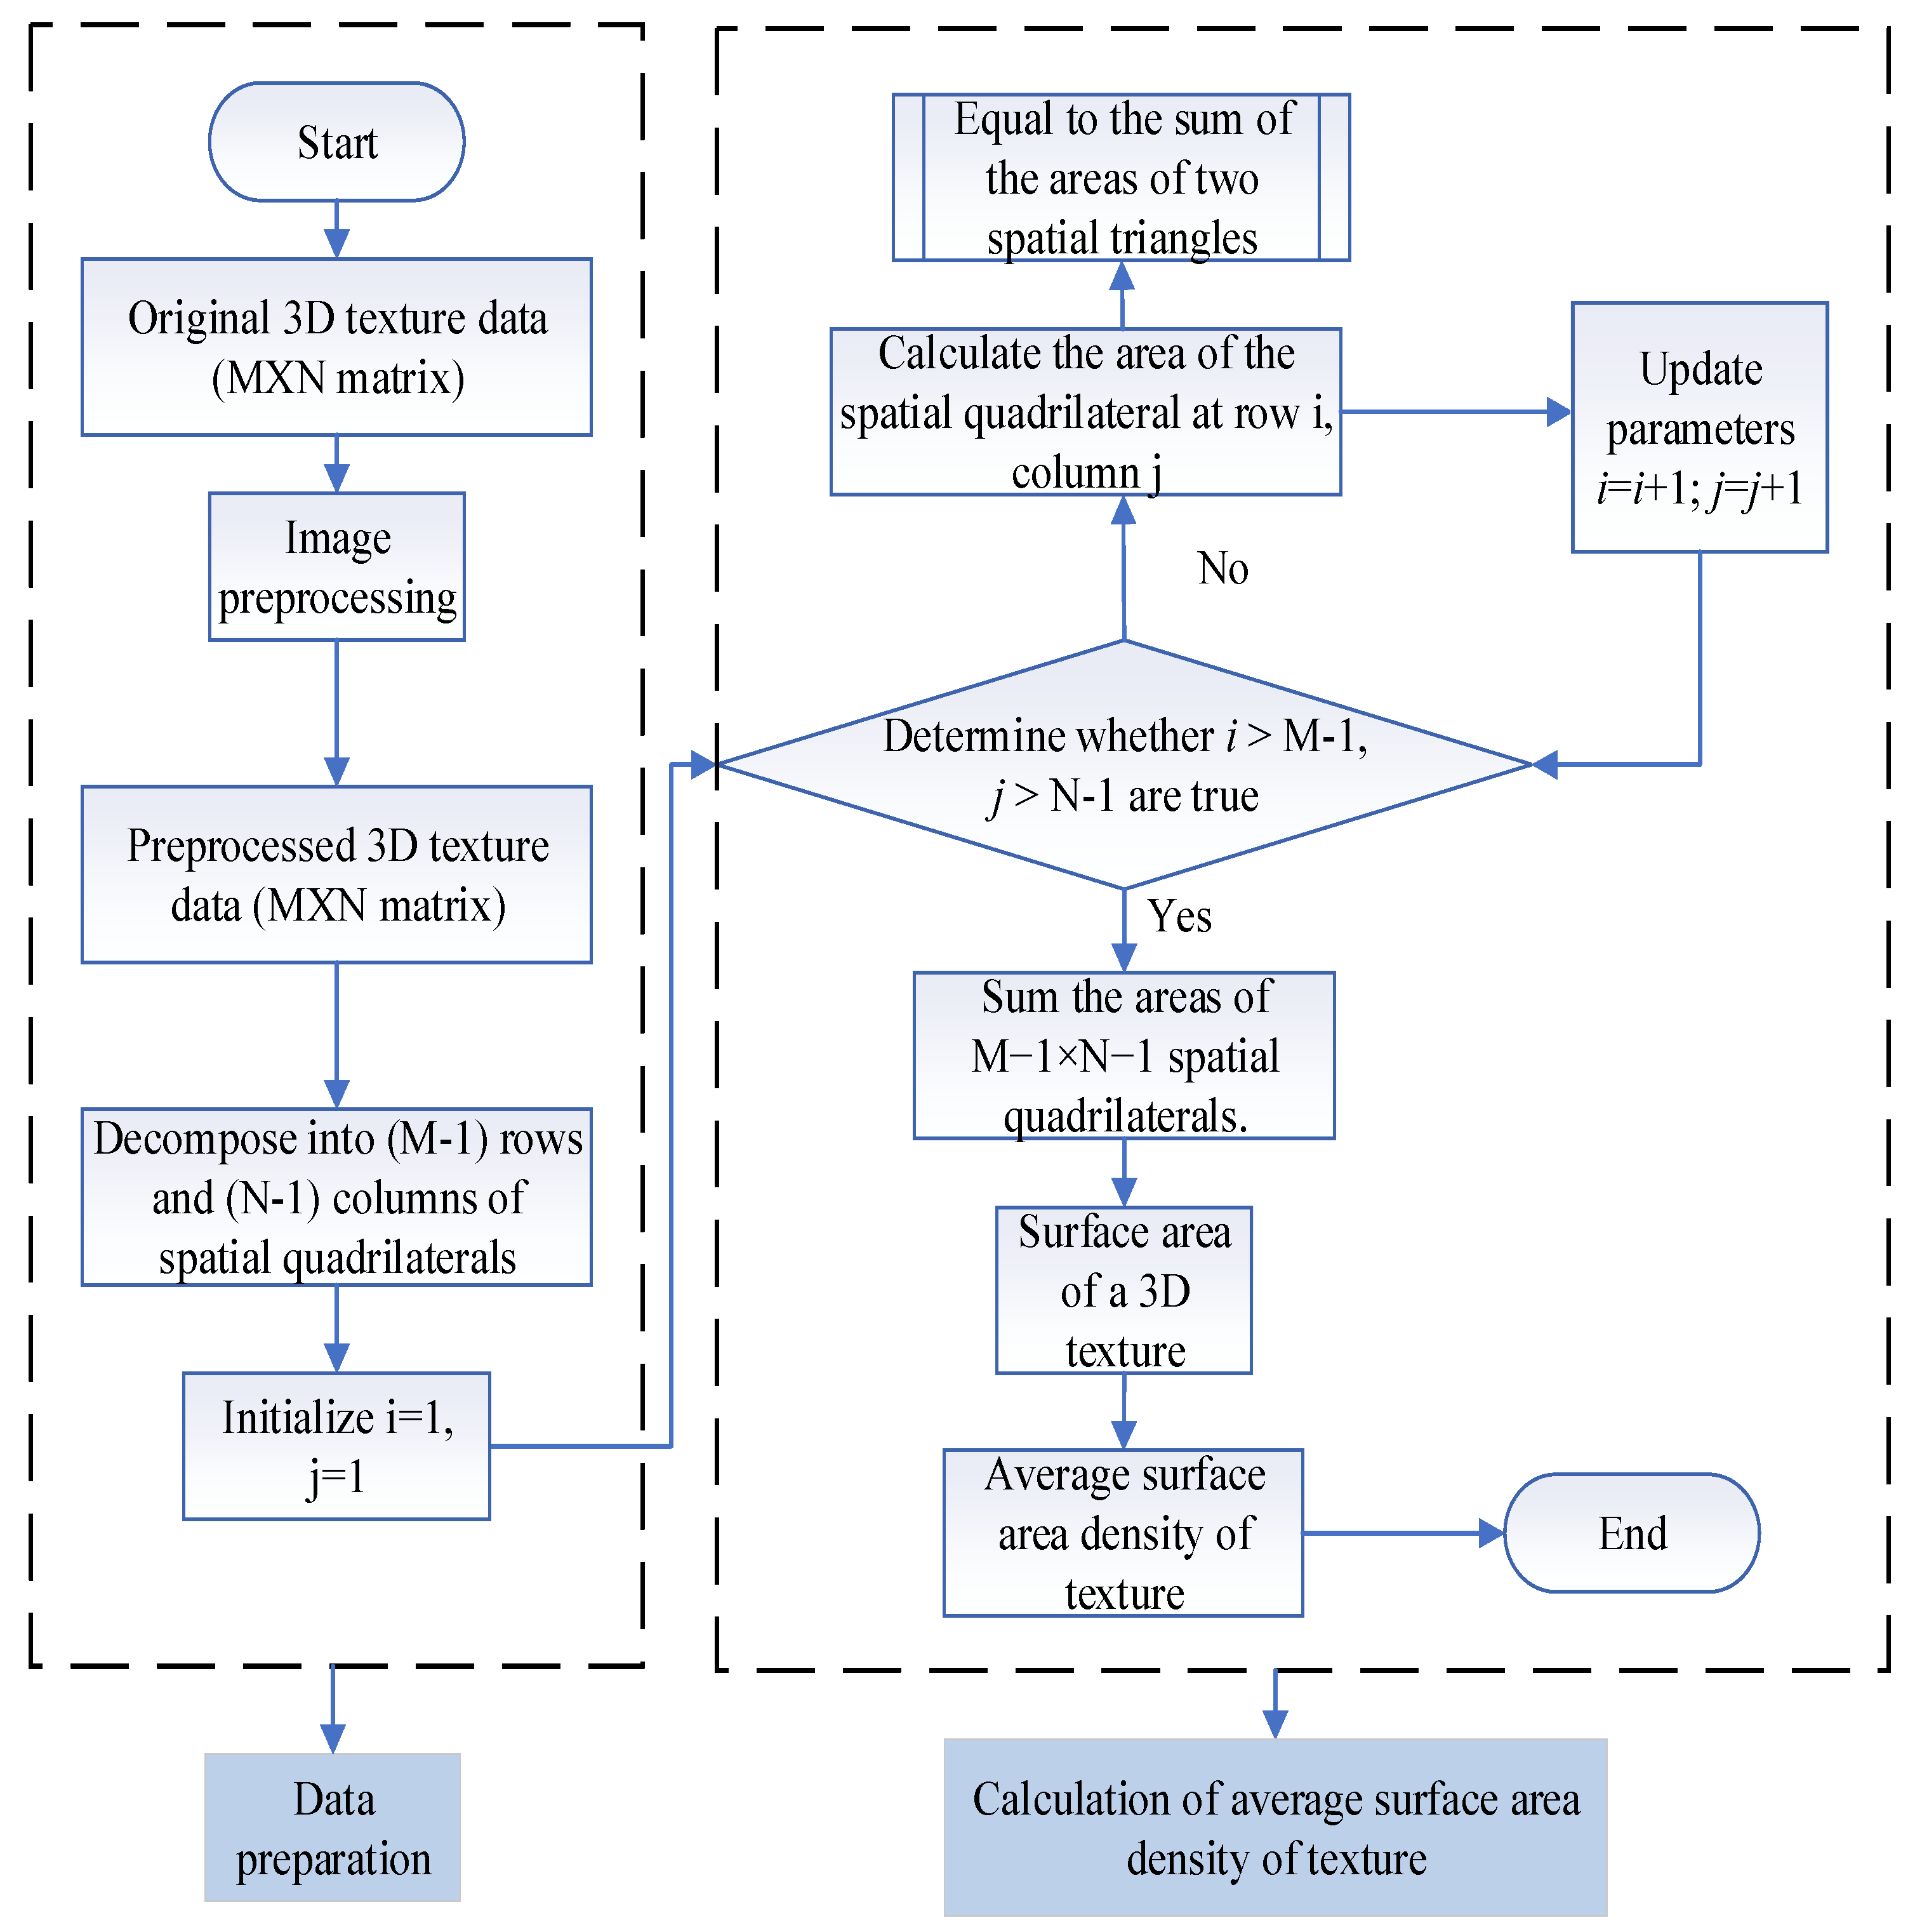
In this study, 3D pavement texture data were acquired using the LS-40 system, and the texture structure was decomposed into numerous spatial quadrilaterals based on data precision. The surface area of the pavement texture was then obtained by solving and summing the areas of spatial planar triangles. Finally, the MTSAD of the texture was calculated. The calculation process is illustrated in Figure 8.

3.1. Image Preprocessing

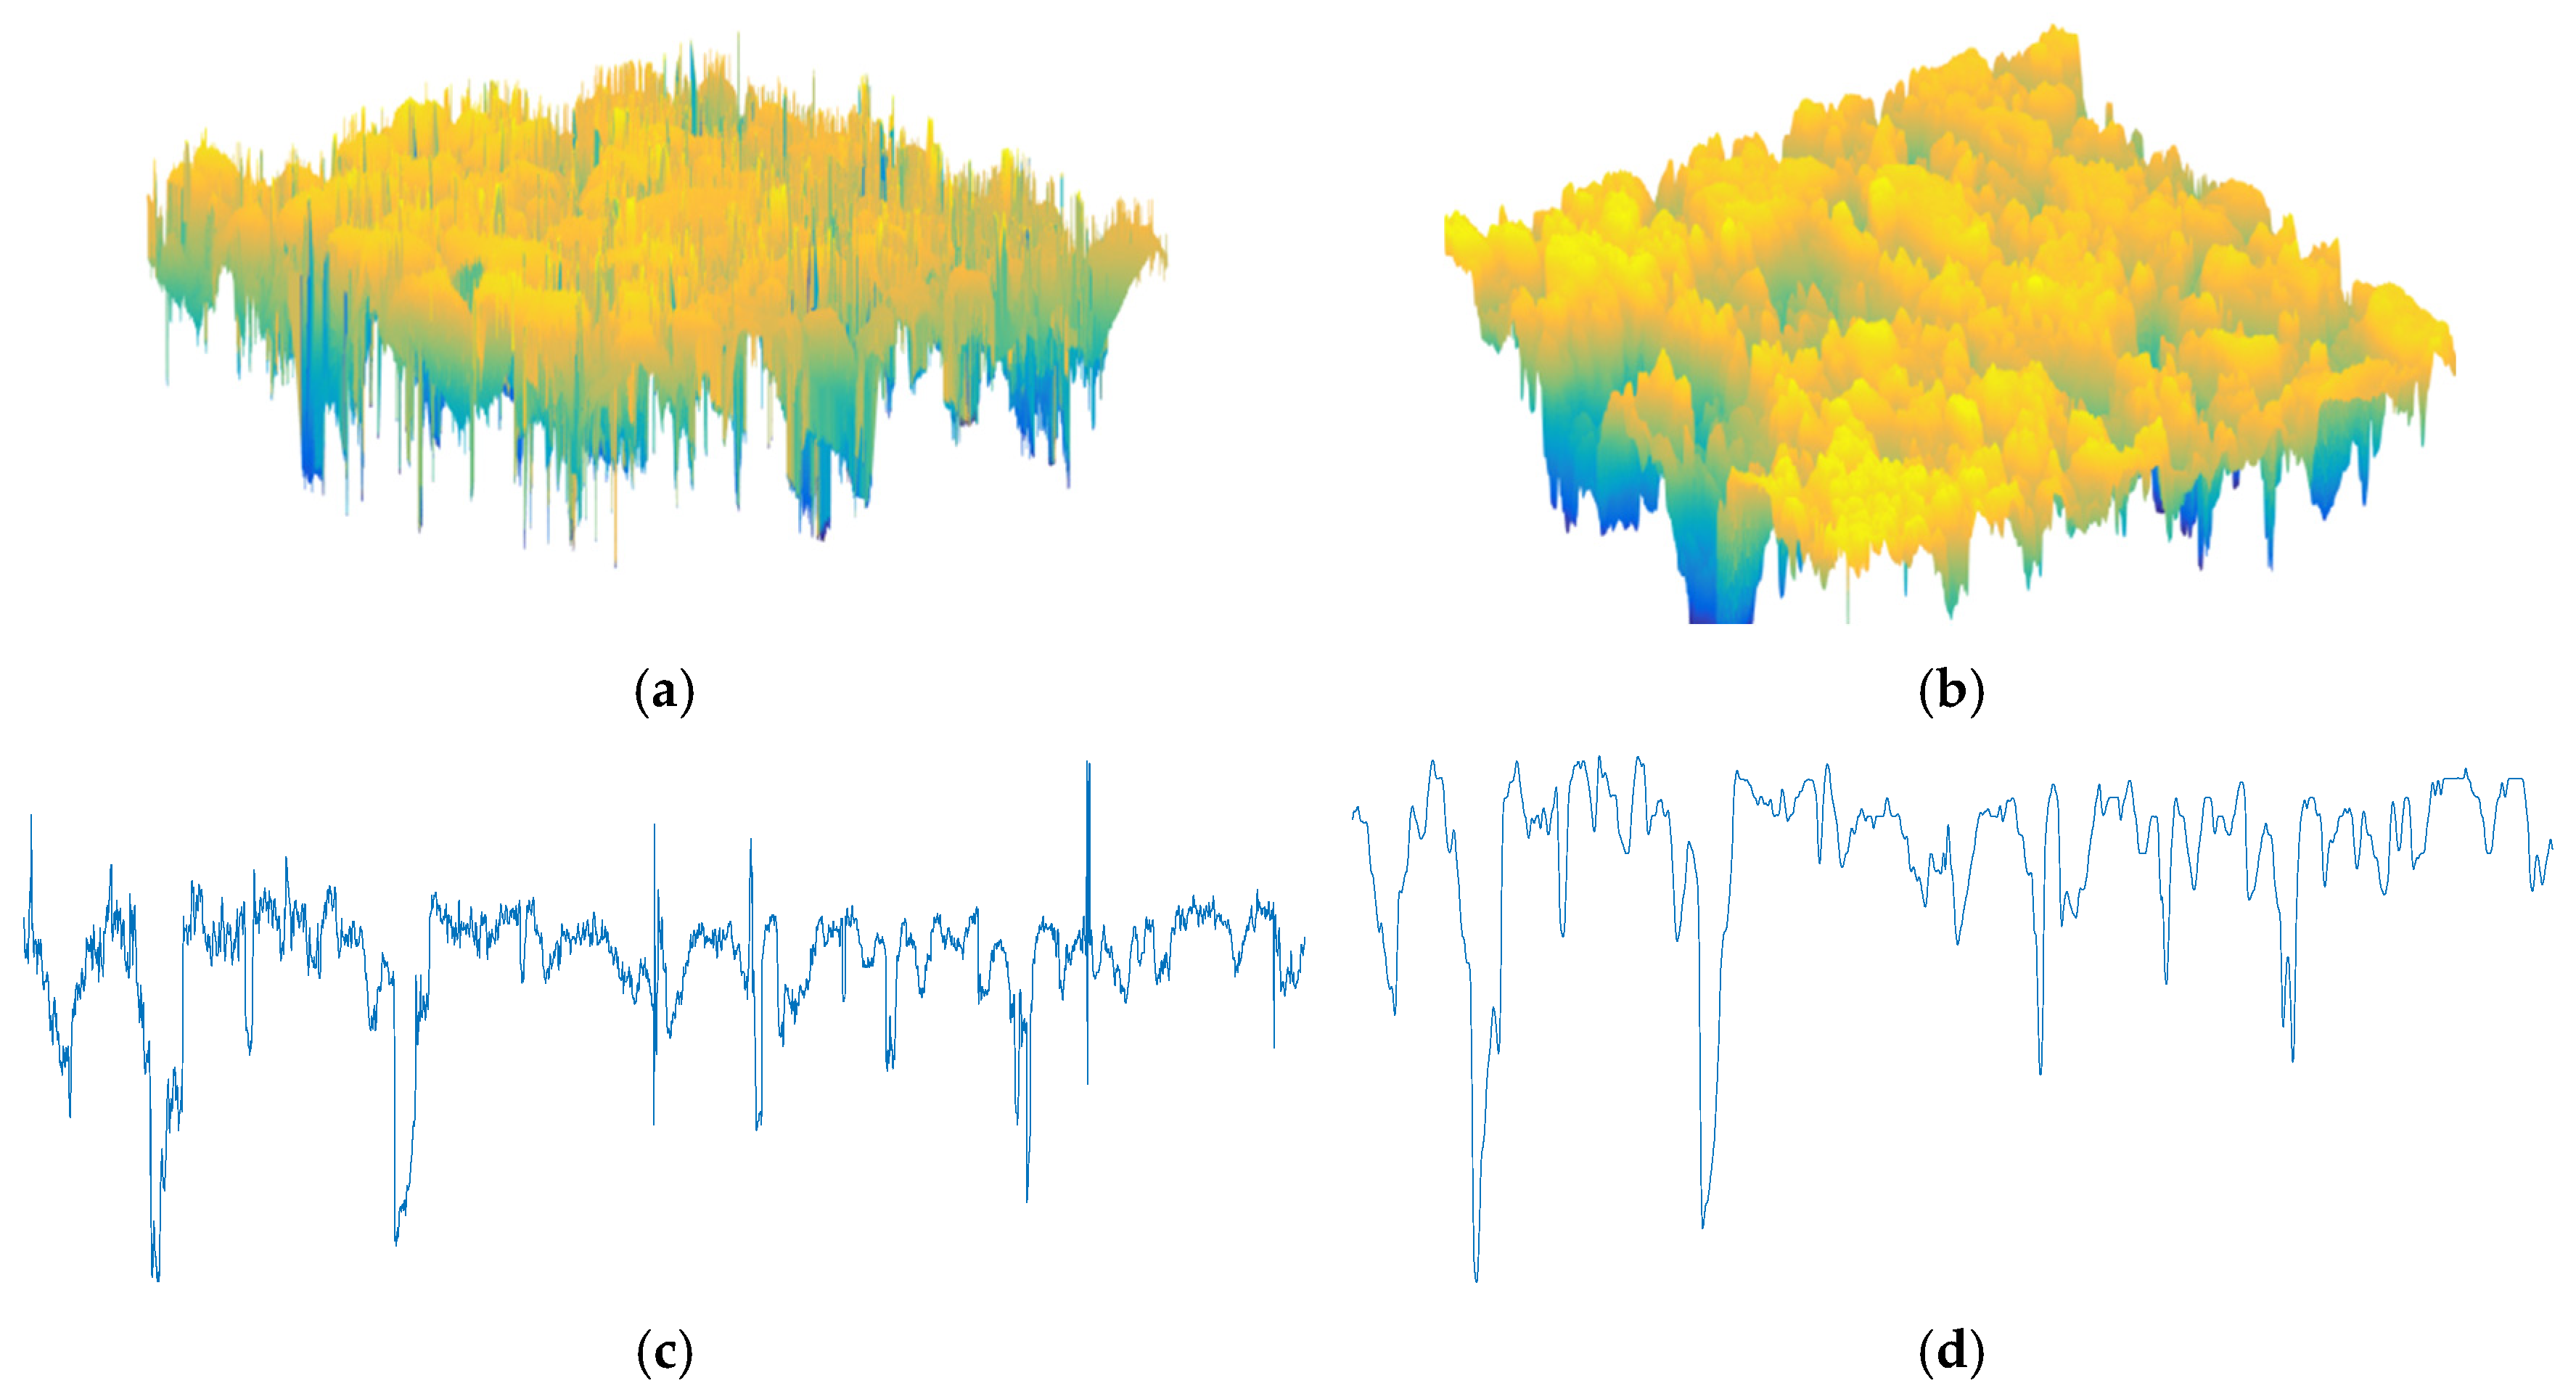
The 3D pavement texture data collected by the LS-40 system were imported into MATLAB R2019a software for the reconstruction of the pavement texture (Figure 9a). However, noise, including specular reflection from the pavement surface sheen and interference from high-frequency electronic equipment, was introduced during data collection. This noise appears as burrs within the red circles in Figure 9a and affected the accuracy of the data, thereby compromising the precision of the image analysis. Consequently, the filtering of the 3D images is necessary to enhance data accuracy.
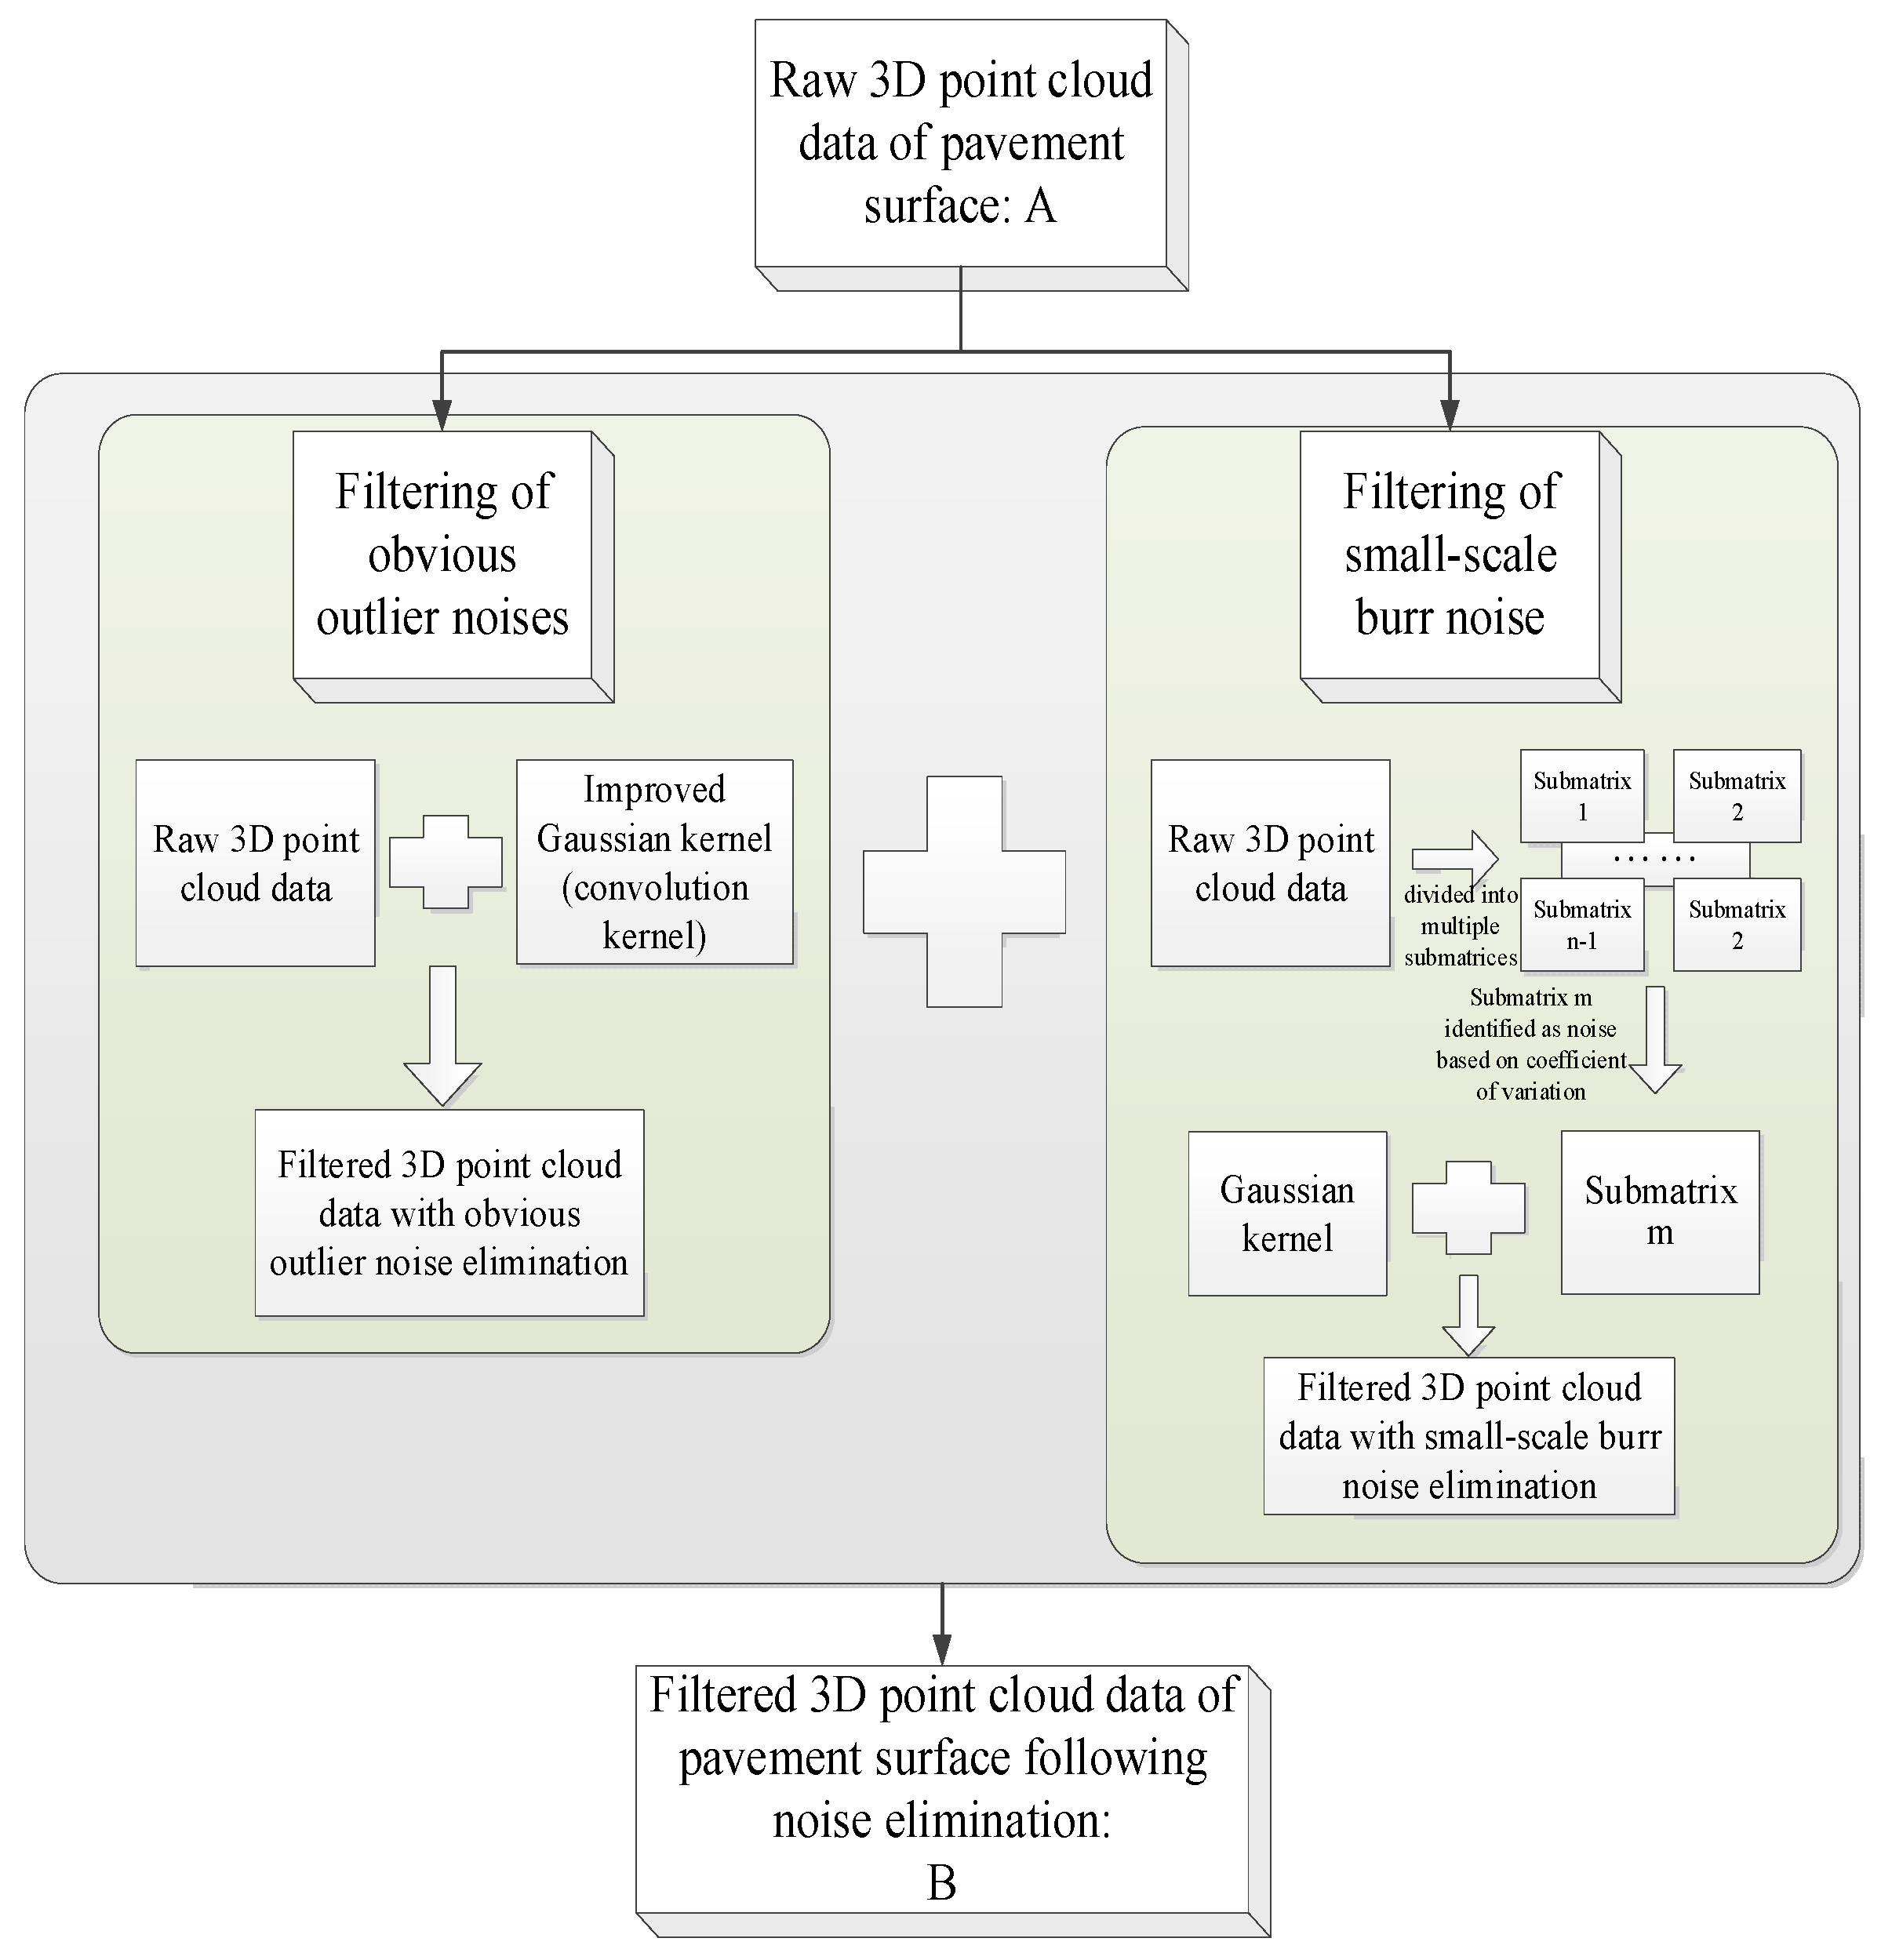
General detection algorithms often prioritize image quality enhancement as a key preprocessing step [37]. As shown in Figure 9a, the original 3D image contains substantial outliers and impulse noise. To address this, the study drew on the method in Reference [37], applied threshold filtering, combining the advantages of median and Gaussian filtering, to process the original image and improve its quality. The specific flowchart of the filtering technique is shown in Figure 10. A comparison of the pavement texture images before and after preprocessing demonstrates that the noise within the red circles in Figure 9a is eliminated, whereas the detailed texture information is preserved.

3.2. Calculation of Average Surface Area Density of Pavement Texture

The surface texture structure is a 3D spatial structure composed of irregular planes and curved surfaces, and the details of its surface texture structure are shown in Figure 11. Determining the texture surface area requires calculating the combined area of irregular surfaces in 3D space. By locally magnifying the filtered 3D image of the pavement texture, a 3D surface (Figure 12) was observed. Microscopic examination revealed that the pavement surface texture approximated a 3D surface composed of numerous spatial quadrilaterals. Although spatial quadrilaterals were typically non-planar and could not be directly calculated, the high data precision allowed these quadrilaterals to be approximated as two spatial triangles. Because the three points determine a plane, the area of a spatial quadrilateral can be calculated by determining the areas of the two planar triangles (Figure 13). The higher the data precision, the more detailed the microscopic image and the more accurate the approximation. With a transverse resolution of 0.05 mm and a longitudinal resolution of 0.01 mm, the LS-40 system provides sufficient data precision, allowing the pavement texture surface area to be approximated by calculating the area of planar triangles in space.
In the data preprocessing stage, this study employed a comprehensive approach combining threshold filtering, median filtering, Gaussian filtering, and dynamic image adjustment with extremum correction to enhance image quality. The 3D pavement texture image represented as an M × N matrix was decomposed into (M − 1) × (N − 1) spatial quadrilaterals because of the high precision of the 3D data collected by LS-40. These quadrilaterals were organized into M − 1 rows and N − 1 columns according to the data characteristics. From a microscopic perspective, the pavement surface texture approximates a 3D spatial surface. Using integration, the area of the 3D surface was approximately the sum of infinitely many small plane areas. Because the three points determine a plane, each quadrilateral can be decomposed into two spatial triangles. Thus, with high-precision data from LS-40, the calculation of the pavement texture surface area can be reduced to solve for the areas of spatial triangles.
Once the data were fully prepared, the surface area calculation could be performed by sequentially calculating the area of each spatial quadrilateral. The areas of all the computational unit quadrilaterals were then summed to obtain the total surface area of the pavement texture. The specific calculation steps are as follows.
(1)
First, the spatial quadrilateral of the smallest computational unit was divided into two spatial triangles. Then, we calculated the areas of these two triangles, Sij1 and Sij2, using the following formulas:
S i j 1 = f ( X i , Y j , Z X i , Y j , X i + 1 , Y j , Z X i + 1 , Y j , X i , Y j + 1 , Z X i , Y j + 1 )
S i j 2 = f ( X i , Y j + 1 , Z X i , Y j + 1 , X i + 1 , Y j , Z X i + 1 , Y j , X i + 1 , Y j + 1 , Z X i + 1 , Y j + 1 )
where i represents the i-th collected laser profile line, which is the i-th data point in the X-axis direction; and j represents the j-th data point on the laser profile line, which is the j-th data point in the Y-axis direction.
(2)
The areas of the two spatial triangles are then added to obtain the area of the spatial quadrilateral computational unit Sij as follows:
S i j = S i j 1 + S i j 2
(3)
The total surface area, S, of the pavement texture is calculated by summing the areas of the M spatial quadrilateral computational units as follows:
S = i = 1 , j = 1 M 1 , N 1 S i j
(4)
MTSAD of the pavement texture is the ratio of the textured surface area of the scanned region (S) to the area of the scanned region (SH) as follows:
M T S A D = S / S H = S / a × b

4. Experimental Results and Analysis

4.1. Results of the Pendulum Friction Coefficient Test

A BM-III pendulum friction coefficient tester was used to assess the skid resistance of the pavement. In each section, at least five representative areas were selected for testing, including uphill, flat, and downhill segments. Within each area, five measurement points were designated, spaced 3–5 m apart. The test positions were located on the wheel tracks of the lane’s cross-section, no less than 1 m from the pavement edge, ensuring that the pendulum’s swing direction was aligned with the driving direction.
Because the test section was a sloped and curved pavement, the surface was not horizontal in either the transverse or the longitudinal direction. During the test, measurement points were selected in both directions whenever possible. The pendulum friction tester was leveled using empirical methods to ensure that the friction path was correctly positioned with a length of 126 mm to minimize the experimental deviation. The test data for pendulum friction coefficients across different pavement areas on the four bridges are summarized in Table 1, Table 2, Table 3 and Table 4.

4.2. Test Results of LS-40 Pavement Micro-Texture Structure

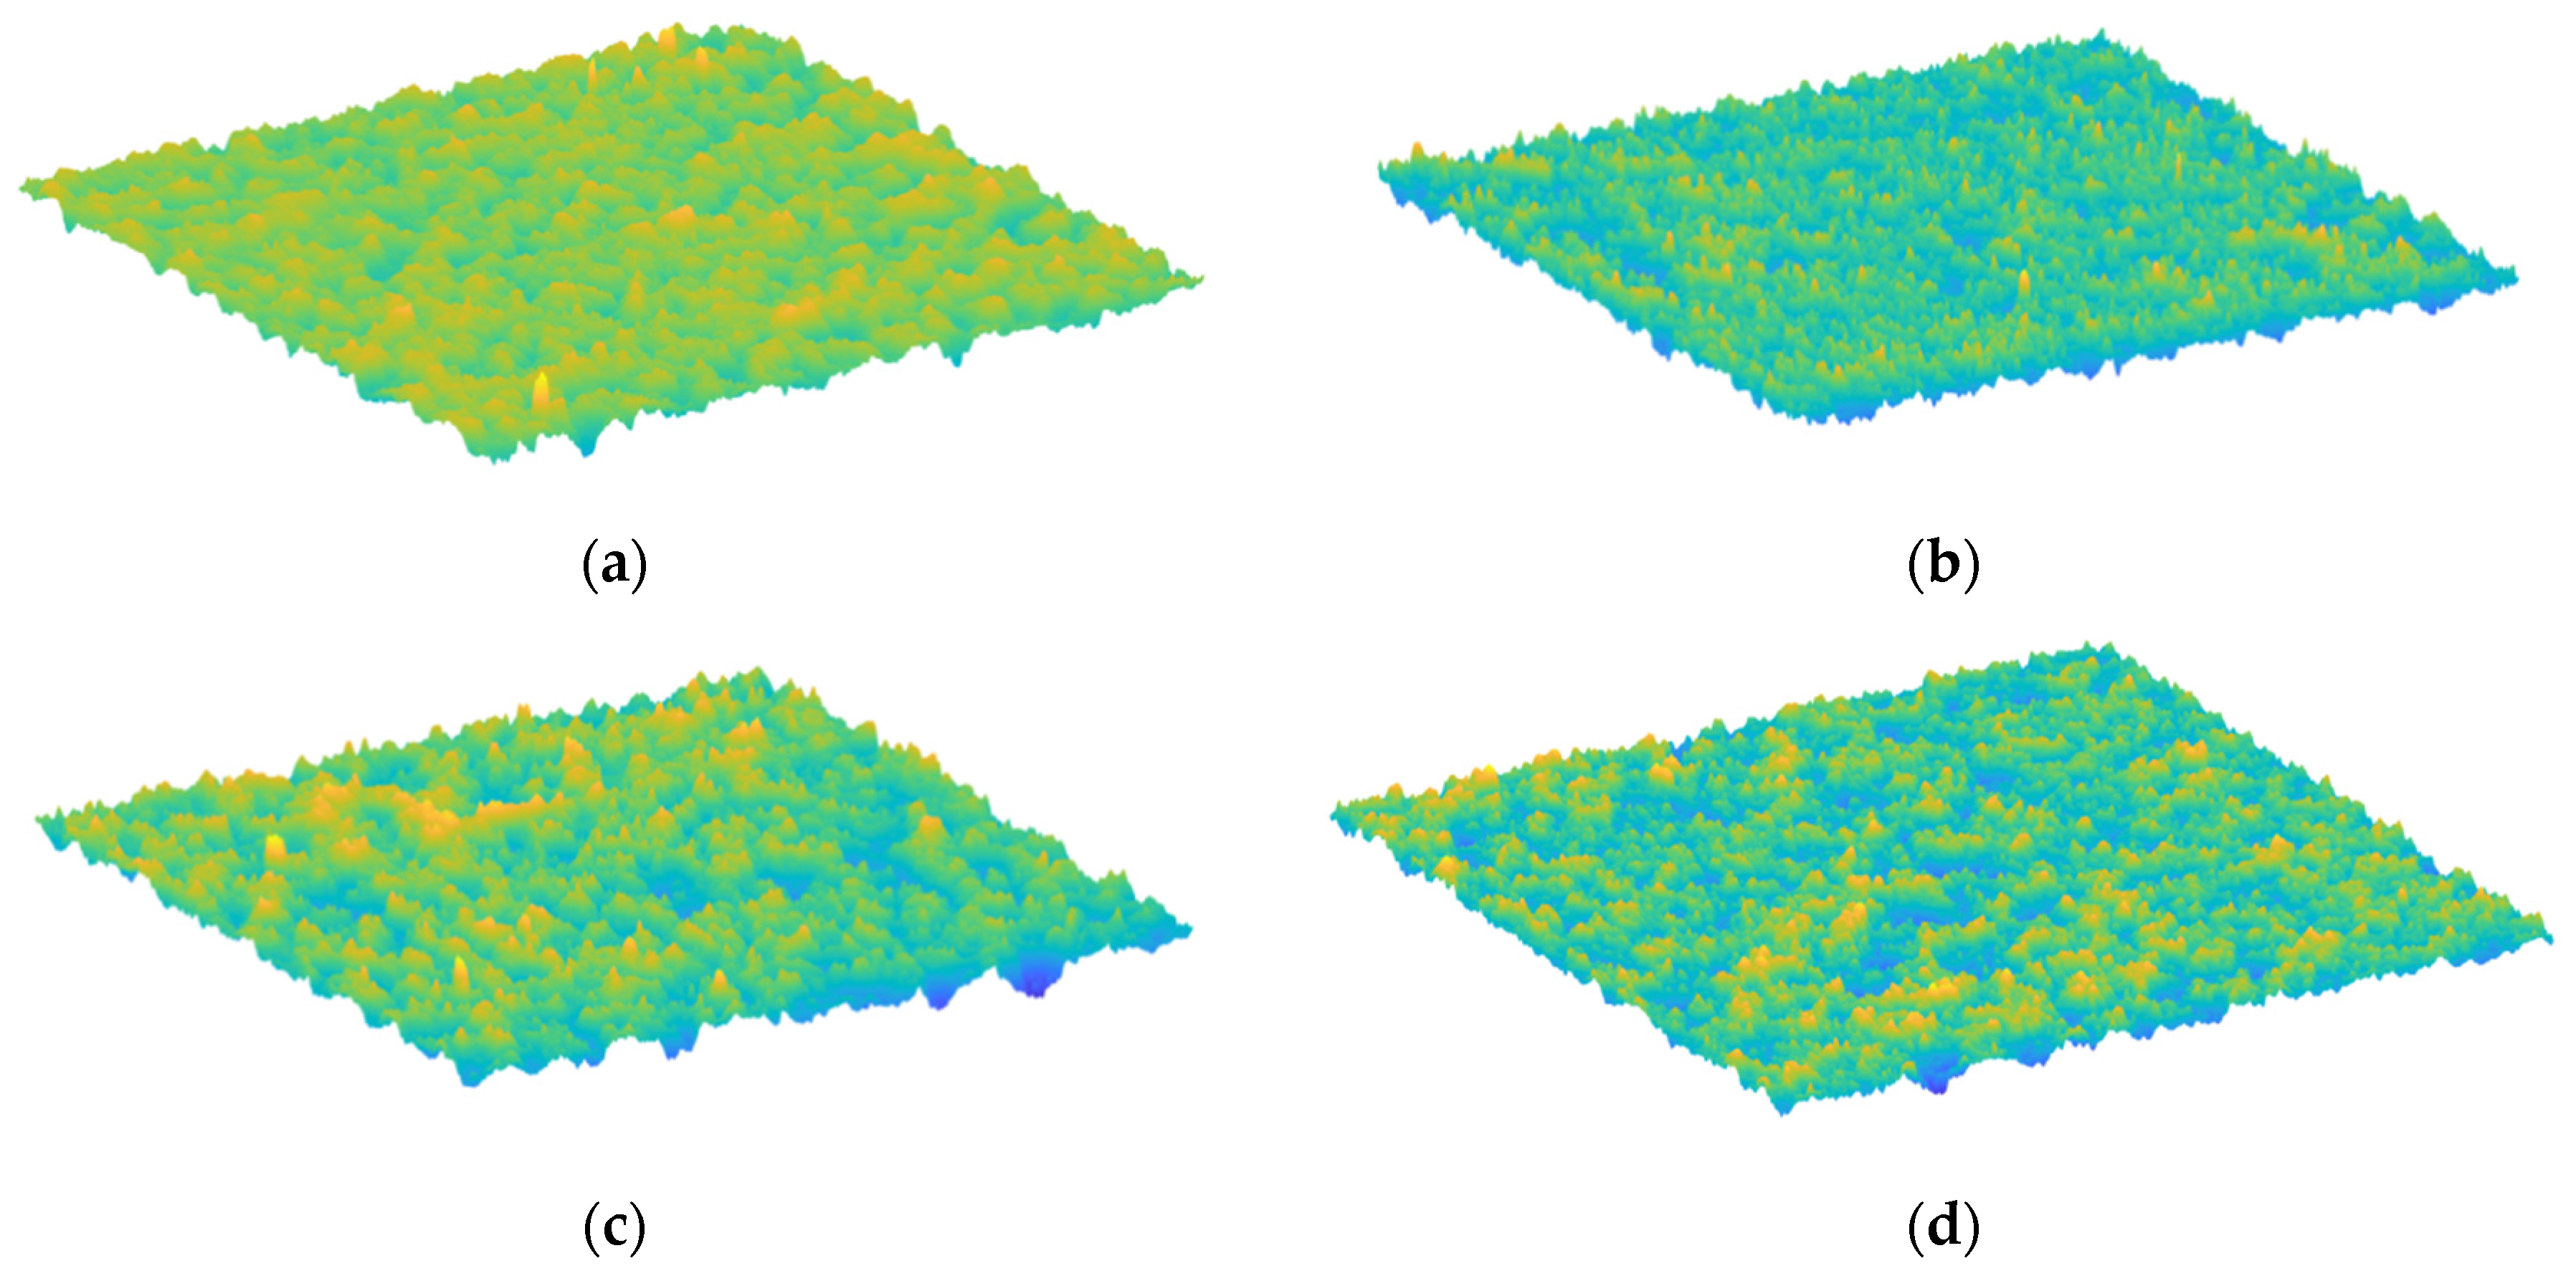
LS-40 applied laser triangulation principles to capture 3D pavement texture data. Representative test points were selected for each section, spaced 3–5 m apart, and positioned along the wheel tracks in the cross-section of the lane, with a minimum distance of 1 m from the pavement edge. Using digital image processing technology, LS-40’s 3D texture data were reconstructed to generate 3D images of the pavement texture (Figure 14).
Using the collected 3D data, algorithm [38] was applied to calculate the MTD and the MPD of the pavement texture. Subsequently, the MTSAD was determined using the method proposed in this study. The test calculation results are presented in Table 5.

4.3. LS-40 Correlation Analysis

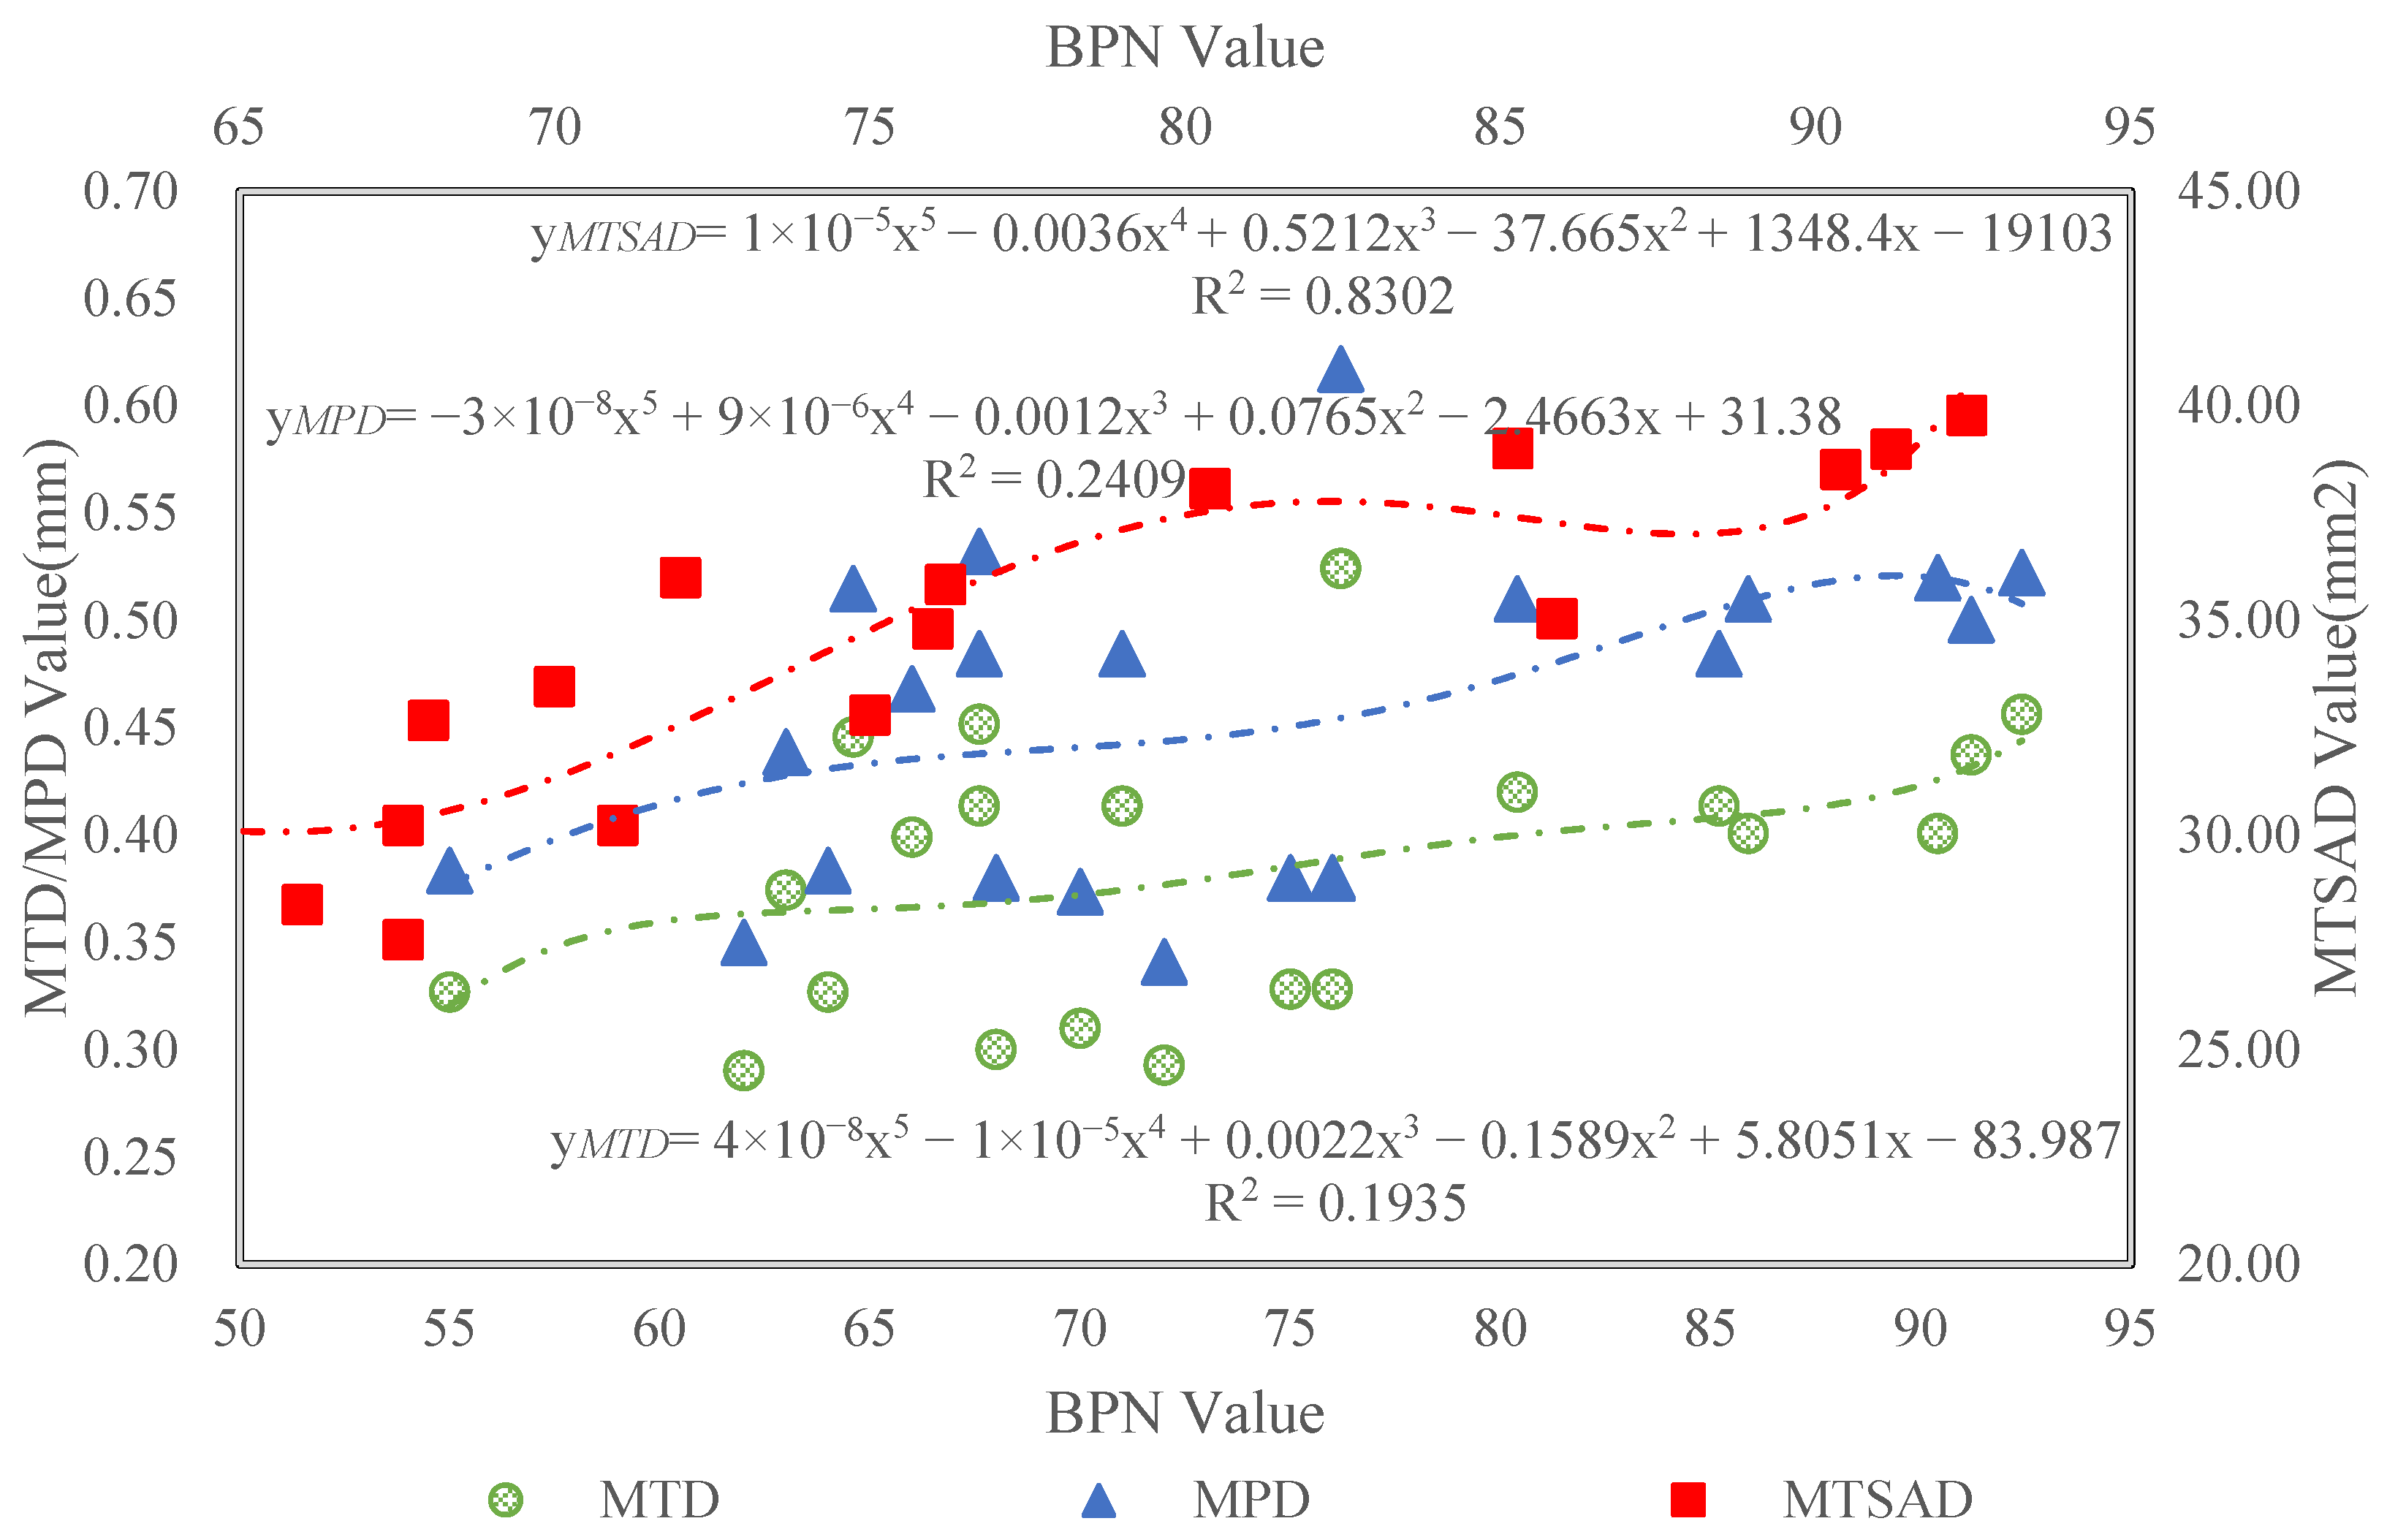
This study investigated the relationship between pavement texture indices and pavement friction by conducting a correlation analysis between the BPN and texture indices of the same areas. The correlation coefficient (r), commonly adopted to evaluate the relationship between two variables, was calculated by the study between BPN and MTD, MPD, and MTSAD. This research employed a quintic polynomial to derive these correlation coefficient values, r, with detailed results presented in Figure 15.
The analysis of the data in Table 5 revealed that the MTSAD of the pavement surfaces for Cheng’an-Yu Ginkgo Bridge (white), Sha-Xi-Wo Field Bridge (green), and Xindu Golden Phoenix Bridge (green) were relatively similar. In contrast, the MTSAD for Yu-Rui Bridge (red) was significantly larger than that of the other three pavement surfaces. The skid-resistance value of Yu-Rui Bridge (red) was 88.1, which was notably higher than that of the other three pavement surfaces. Correlation analysis indicated that the MTD and MPD of the pavement textures had a minimal correlation with skid resistance, with correlation coefficients of 0.1935 and 0.2409, respectively. However, the MTSAD proposed in this study demonstrated a strong correlation with skid resistance, yielding a correlation coefficient of 0.8302.

5. Conclusions and Recommendations for Future Research

This paper collected high-precision pavement texture data using 3D laser measurement technology and performed the 3D image preprocessing and reconstruction of textures through digital image processing technology. Starting from the contact area between tires and pavement, a method for calculating the surface area of pavement texture was developed based on the characteristics of high-precision data and the idea of infinite subdivision. Finally, a 3D evaluation index of MTSAD was proposed. The specific conclusions are as follows:
(1)
Based on high-precision 3D point cloud data, a novel method for calculating the area of irregular shapes in 3D space is proposed using the mathematical concept of integration, which is applied to calculate the surface area of pavement textures.
(2)
Through polynomial fitting analysis of MTD, MPD, and MTSA with pavement friction coefficients BPN, the correlation coefficient between MTSAD and BPN is 0.8302, significantly superior to traditional indices (MTD, MPD). The results show that the novel 3D texture evaluation index MTSAD proposed in this study better characterizes the anti-skid performance of pavements.
(3)
Compared with traditional texture indices (MTD, MPD), the MTSAD contains 3D texture structure information and more accurately evaluates pavement anti-skid performance.
(4)
This paper uses 3D laser technology to obtain 3D point cloud data of pavements in a non-contact manner, indicating that non-contact methods can be used to detect pavement anti-skid performance in the future.
Although certain progress has been made, there are still limitations, and many future works can be anticipated.
(1)
Deeply investigate whether the pigmentation of red/white/green pavements will change the physical properties of the surface, analyze the independent impact of pigmentation on texture or friction, and examine whether it may lead to data confounding risks.
(2)
Conduct extensive experiments on different gradations of asphalt mixture types (including pavements with high macrotexture) to further verify the applicability of the proposed approach and explore whether parameter and method adjustments are required for different material types.
(3)
Based on high-precision 3D pavement texture images, comprehensive evaluations and the research on 3D texture evaluation indices capable of characterizing anti-skid performance should be conducted in the future.
(4)
Three-dimensional laser detection technology can realize non-contact pavement detection. Therefore, intelligent evaluation methods for pavement inspection can be developed based on non-contact detection techniques in the future.

Author Contributions

Conceptualization, N.M. and S.D.; methodology, S.D.; software, N.M.; validation, S.D. and H.Y.; formal analysis, C.A.; investigation, J.W.; resources, X.C.; data curation, N.M.; writing—original draft preparation, S.D.; writing—review and editing, X.C.; visualization, N.M.; supervision, C.A.; project administration, H.Y.; funding acquisition, S.D. All authors have read and agreed to the published version of the manuscript.

Funding

The open fund project of the State Key Laboratory of High-speed Railway Track Technology, China Academy of Railway Sciences [grant number 2022YJ121], Science and technology project fund of Huzhou Science and Technology Bureau [grant number 2023GZ41], Mechanism of Aged Asphalt Regeneration Using Liquefaction Products of Straw in Supercritical Fluids, and Sichuan Provincial Natural Science Foundation Project [grant number 2024NSFSC0930].

Data Availability Statement

The datasets used and/or analyzed during the current study are available from the corresponding authors upon reasonable request.

Acknowledgments

We sincerely thank Changfa Ai for his theoretical guidance and initial experimental support, Xiaoping Chen for her project coordination, Huaping Yang for his technical assistance in experiments, and Jiayu Wang for her project support and experimental contributions.

Conflicts of Interest

The authors declare that they have no known competing financial interests or personal relationships that could have appeared to influence the work reported in this paper.

Abbreviations

The following abbreviations are used in this manuscript:
MTSADMean Texture Surface Area Density
MTDMean Texture Depth
MPDMean Profile Depth
PIARCPermanent International Association of Road Congresses
HHTHilbert–Huang Transform
3DThree-Dimensional
2DTwo-Dimensional
PSDPower Spectral Density
CRPClose-Range Photogrammetry

References

  1. Hall, J.W.; Smith, K.L.; Titus-Glover, L.; Wambold, J.C.; Yager, T.J.; Rado, Z. Guide for Pavement Friction: Final Report for National Cooperative Highway Research Program (NCHRP) Project 01-43; Transportation Research Board of the National Academies: Washington, DC, USA, 2009. [Google Scholar]
  2. Zhu, H.-Z.; Liao, Y.-Y. Present Situations of Research on Anti-skid Property of Asphalt Pavement. Highway 2018, 1, 35–46. [Google Scholar]
  3. Huang, X.; Zheng, B. Research Status and Progress for Skid Resistance Performance of Asphalt Pavements. China J. Highw. Transp. 2019, 32, 32–49. [Google Scholar]
  4. Kogbara, R.B.; Masad, E.A.; Kassem, E.; Scarpas, A.; Anupam, K. A state-of-the-art review of parameters influencing measurement and modeling of skid resistance of asphalt pavements. Constr. Build. Mater. 2016, 114, 602–617. [Google Scholar] [CrossRef]
  5. Mataei, B.; Zakeri, H.; Zahedi, M.; Nejad, F.M. Pavement friction and skid resistance measurement methods: A literature review. Open J. Civ. Eng. 2016, 6, 537–565. [Google Scholar] [CrossRef]
  6. Lei, Y.; Hu, X.; Wang, H.; You, Z.; Zhou, Y.; Yang, X. Effects of vehicle speeds on the hydrodynamic pressure of pavement surface: Measurement with a designed device. Measurement 2017, 98, 1–9. [Google Scholar] [CrossRef]
  7. De Luca, M.; Abbondati, F.; Pirozzi, M.; Žilionienė, D. Preliminary study on runway pavement friction decay using data mining. Transp. Res. Procedia 2016, 14, 3751–3760. [Google Scholar] [CrossRef]
  8. Technical Committee on Surface Characteristics. Report of Technical Committee on Surface Characteristics; World Road Association (PIARC): Mrrakesh, Morocco, 1991; pp. 287–305. [Google Scholar]
  9. Dunford, A.M. Measuring Skid Resistance Without Contact: 2009–2010 Progress Report; TRL: Crowthorne, UK, 2010. [Google Scholar]
  10. Henry, J.J. Evaluation of pavement friction characteristics. In NCHRP Synthesis291; Transportation Research Board: Washington, DC, USA, 2000. [Google Scholar]
  11. Roe, P.G.; Sinhal, R. The Polished Stone Value of Aggregates and In-ServiceSkidding Resistance; TRL: Crowthorne, UK, 1998. [Google Scholar]
  12. PIARC. Report of the Committee on Surface Characteristics; Permanent International Association of Road Congress (PIARC) XVIII World Road Congress: Brussels, Belgium, 1987. [Google Scholar]
  13. ASTM. ASTM E965—15 Standard Test Method for Measuring Pavement Macro-Texture Depth Using a Volumetric Technique; American Society of Testing an d Material: West Conshohocken, PA, USA, 2019. [Google Scholar]
  14. Sabey, B.E. Pressure distribution beneath spherical and conical shapes pressed into a rubber plane, and their bearing on coefficient of friction under wet conditions. Proc. Phys. R. Soc. 1958, 71, 979–988. [Google Scholar] [CrossRef]
  15. Forster, S.W. Aggregate Microtexture: Profile Measurement and Related Frictional Levels; Report FHWA/RD-81/107; Federal Highway Administration: Washington, DC, USA, 1981. [Google Scholar]
  16. Do, M.T.; Tang, Z.; Kane, M.; de Larrard, F. Evolution of road surface skid-resistance and texture due to polishing. Wear 2009, 266, 574–577. [Google Scholar] [CrossRef]
  17. Zelelew, H.M.; Khasawneh, M.; Abbas, A. Wavelet-Based Characterisation of Asphalt Pavement Surface Macro-Texture. Road Mater. Pavement Des. 2014, 15, 622–641. [Google Scholar] [CrossRef]
  18. Villani, M.M.; Scarpas, A.; de Bondt, A.; Khedoe, R.; Artamendi, I. Application of Fractal Analysis for Measuring the Effects of Rubber Polishing on the Friction of Asphalt Concrete Mixtures. Wear 2014, 320, 179–188. [Google Scholar] [CrossRef]
  19. Hartikainen, L.; Petry, F.; Westermann, S. Frequency-wise Correlation of the Power Spectral Density of Asphalt Surface Roughness and Tire Wet Friction. Wear 2014, 317, 111–119. [Google Scholar] [CrossRef]
  20. Zhao, L.; Zhao, H.; Cai, J. Tire-pavement friction modeling considering pavement texture and water film. Int. J. Transp. Sci. Technol. 2024, 14, 99–109. [Google Scholar] [CrossRef]
  21. Kane, M.; Rado, Z.; Timmons, A. Exploring the Texture-Friction Relationship: From Texture Empirical Decomposition to Pavement Friction. Int. J. Pavement Eng. 2015, 16, 919–928. [Google Scholar] [CrossRef]
  22. El-Ashwah, A.S.; Abdelrahman, M. Comparative analysis of empirical decomposition algorithms in predicting tire-pavement friction from asphalt surface textures: A Hilbert–Huang transform (HHT) analysis. Discov. Civ. Eng. 2024, 1, 89. [Google Scholar] [CrossRef]
  23. Kogbara, R.B.; Masad, E.A.; Woodward, D.; Millar, P. Relating surface texture parameters from close range photogrammetry to Grip-Tester pavement friction measurements. Constr. Build. Mater. 2018, 166, 227–240. [Google Scholar] [CrossRef]
  24. Kanafi, M.M.; Kuosmanen, A.; Pellinen, T.K.; Tuononen, A.J. Macro- and micro-texture evolution of road pavements and correlation with friction. Int. J. Pavement Eng. 2015, 16, 168–179. [Google Scholar] [CrossRef]
  25. Kanafi, M.M.; Tuononen, A.J. Top topography surface roughness power spectrum for pavement friction evaluation. Tribol. Int. 2017, 107, 240–249. [Google Scholar] [CrossRef]
  26. Hu, L.; Yun, D.; Liu, Z.; Du, S.; Zhang, Z.; Bao, Y. Effect of three-dimensional macrotexture characteristics on dynamic frictional coefficient of asphalt pavement surface. Constr. Build. Mater. 2016, 126, 720–729. [Google Scholar] [CrossRef]
  27. Li, Q.; Yang, G.; Wang, K.C.P.; Zhan, Y.; Wang, C. Novel Macro- and Microtexture Indicators for Pavement Friction by Using High-Resolution Three-Dimensional Surface Data. Transp. Res. Rec. J. Transp. Res. Board 2017, 2641, 164–176. [Google Scholar] [CrossRef]
  28. Qian, G.; Wang, Z.; Yu, H.; Shi, C.; Zhang, C.; Ge, J.; Dai, W. Research on surface texture and skid resistance of asphalt pavement considering abrasion effect. Case Stud. Constr. Mater. 2024, 20, e02949. [Google Scholar] [CrossRef]
  29. Tan, Y.; Xiao, S.; Xiong, X. Review on detection and prediction methods for pavement skid resistance. J. Traffic Transp. Eng. 2021, 21, 32–47. [Google Scholar]
  30. Dong, S.; Han, S.; Zhang, Q.; Han, X.; Zhang, Z.; Yao, T. Three-dimensional evaluation method for asphalt pavement texture characteristics. Constr. Build. Mater. 2021, 287, 122966. [Google Scholar]
  31. Dong, S.; Han, S.; Su, J.; Han, X. Three-dimensional evaluation method for asphalt pavement surface texture and analysis of its calculating boundary conditions. Mater. Rep. 2023, 287, 1–20. [Google Scholar]
  32. JTG 3450—2019; Field Test Methods of Highway Subgrade and Pavement. Ministry of Transport of the People’s Republic of China: Beijing, China, 2019.
  33. Lin, D.-J. Study on solution of area of curved surface. J. Zhejiang Univ. Technol. 2000, 28, 10–14. [Google Scholar]
  34. Chen, J. Research on land Mapping Technology Based on GPS and Land Management Information system. Master’s Thesis, Zhejiang University, Hangzhou, China, 2013. [Google Scholar]
  35. Cao, J. Research on Surface Area Image Measurement Technology. Master’s Thesis, Southwest Petroleum University, Chengdu, China, 2012. [Google Scholar]
  36. Liu, B.-Z. Design of Three-Dimensional Surface Land Area Measurement System Based on GPS. Master’s Thesis, Southwest University, Chongqing, China, 2017. [Google Scholar]
  37. Ding, S.; Yang, E.; Wang, C.; Ji, Y.; Lei, K.; Zhang, X. Three-Dimensional High-Precision Laser Non-contact Detection of Asphalt Pavement Surface Texture. J. Southwest Jiaotong Univ. 2020, 55, 758–764. [Google Scholar]
  38. Ding, S.; Yang, G.; Wang, K.C.P.; Yang, E.; Zhan, A. 3D Imaging based pavement texture evaluation. Int. J. Pavement Eng. 2023, 24, 2077942. [Google Scholar]
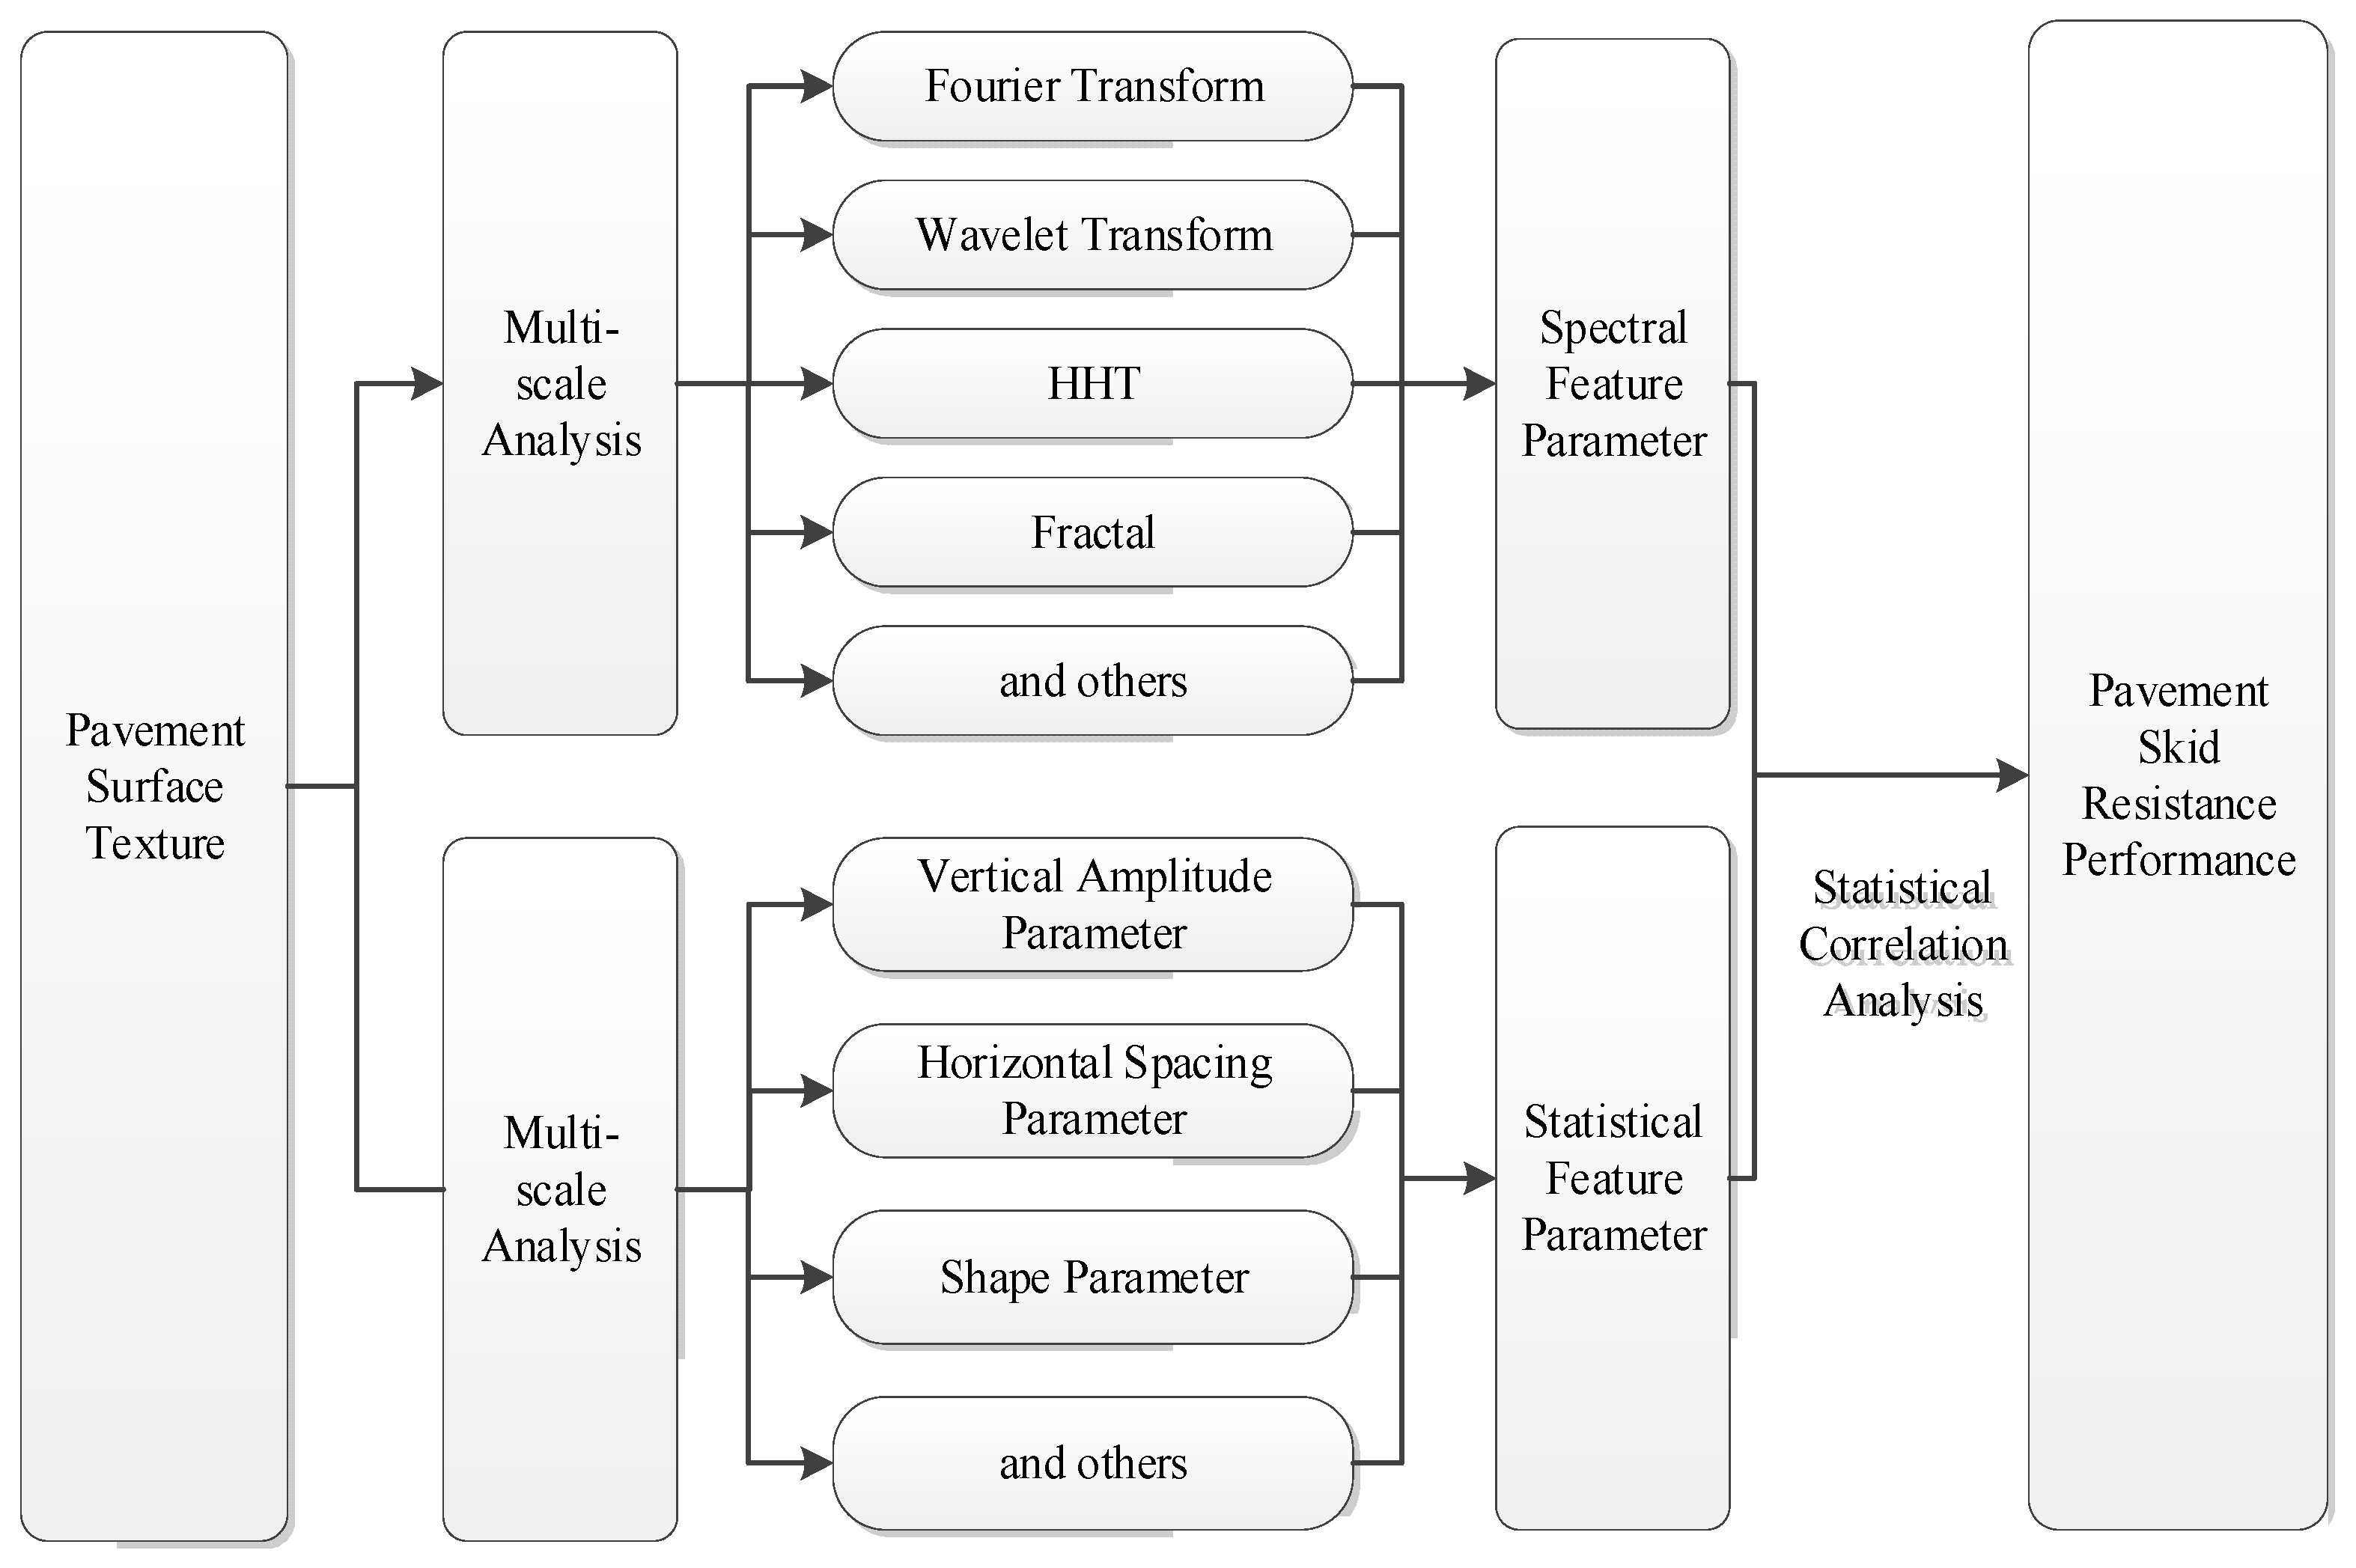
Figure 1. Prediction methods of skid resistance performance based on pavement surface texture [29].
Lubricants 13 00288 g001
Figure 2. Pendulum friction tester.
Lubricants 13 00288 g002
Figure 3. Data acquisition of LS-40.
Lubricants 13 00288 g003
Figure 4. Internal components of LS-40.
Lubricants 13 00288 g004
Figure 5. Data collection segment: (a) Cheng’an-Yu Ginkgo Bridge; (b) Shaxi·Woye Bridge; (c) Xindu·Jin Fenghuang Bridge; (d) Yurui Bridge.
Lubricants 13 00288 g005
Figure 6. Schematic diagram of the projection of a spatial triangle.
Lubricants 13 00288 g006
Figure 7. Spatial plane triangle.
Lubricants 13 00288 g007
Figure 8. Calculation process for the average surface area density of the texture.
Lubricants 13 00288 g008
Figure 9. Comparison of image preprocessing effects: (a) original 3D images; (b) preprocessed 3D images; (c) original 2D images; (d) preprocessed 2D images.
Lubricants 13 00288 g009
Figure 10. Filtering technical flowchart [37].
Lubricants 13 00288 g010
Figure 11. Texture construction details.
Lubricants 13 00288 g011
Figure 12. Texture 3D surface.
Lubricants 13 00288 g012
Figure 13. Spatial quadrilateral division.
Lubricants 13 00288 g013
Figure 14. Three-dimensional image of pavement texture construction: (a) Cheng’an-Yu Ginkgo Bridge; (b) Shaxi Woye Bridge; (c) Xindu Golden Phoenix Bridge; (d) Yurui Bridge.
Lubricants 13 00288 g014
Figure 15. Correlation coefficient plot.
Lubricants 13 00288 g015
Table 1. Test results of pendulum friction coefficient for Cheng’an-Yu (Ginkgo Bridge).
IndexRegion 1Region 2Region 3Region 4Region 5
Temperature (°C)2829282828
Temperature Correction Factor2.83.22.82.82.8
Friction Coefficient BPN2078.871.260.864.872.8
78.869.260.866.874.8
74.869.260.866.874.8
76.869.262.868.874.8
72.871.264.870.876.8
Mean7670626875
Standard Deviation2.611.101.792.281.41
Coefficient of Variation0.030.020.030.030.02
Table 2. Test results of pendulum friction coefficient for Shaxi (Woye Bridge).
IndexRegion 1Region 2Region 3Region 4Region 5 *
Temperature (°C)3132323233
Temperature Correction Factor3.84.14.14.14.4
Friction Coefficient BPN2063.870.164.164.170.4
65.872.164.164.170.4
61.872.166.164.172.4
61.874.164.164.172.4
61.874.168.164.170.4
Mean6372656471
Standard Deviation1.791.671.790.001.10
Coefficient of Variation0.030.020.030.000.02
Note: Area 5 * represents the dark-blue area.
Table 3. Test results of pendulum friction coefficient for Xindu Golden Phoenix Bridge.
IndexRegion 1Region 2Region 3Region 4 *Region 5Region 6
Temperature (°C)313133302833
Temperature Correction Factor3.83.84.43.52.84.4
Friction Coefficient BPN2065.875.866.455.584.868.4
63.875.866.453.586.866.4
63.875.868.453.582.866.4
63.877.868.453.584.868.4
65.875.868.453.586.868.4
Mean64.676.267.653.985.267.6
Standard Deviation1.100.891.100.891.671.10
Coefficient of Variation0.020.010.020.020.020.02
Note: Area 4 * represents a white marking-painted area.
Table 4. Test results of pendulum friction coefficient for Yurui Bridge.
IndexRegion 1Region 2Region 3Region 4Region 5
Temperature (°C)3433332833
Temperature Correction Factor3.84.14.14.14.4
Friction Coefficient BPN2086.788.492.490.878.4
84.790.492.492.882.4
86.790.490.490.880.4
86.790.488.492.878.4
84.792.492.494.882.4
Mean85.990.491.292.480.4
Standard Deviation1.101.411.791.672.00
Coefficient of Variation0.010.020.020.020.02
Table 5. Texture structure test calculation results.
Bridge Deck PavementIndexMTD of Pavement TextureMPD of Pavement TextureMTSAD of Pavement TextureBPN20
Cheng’an-Yu Ginkgo Bridge (White)Region 10.330.3834.8076
Region 20.310.3733.4670
Region 30.290.3532.2362
Region 40.300.3832.6768
Region 50.330.3832.8075
Shaxi Woye Bridge (Green)Region 10.370.4431.1363
Region 20.290.3436.0072
Region 30.400.4728.3765
Region 40.330.3829.1764
Region 50.410.4830.2271
Xindu Golden Phoenix Bridge (Green)Region 10.450.5129.7464.6
Region 20.520.6235.8476.2
Region 30.450.5327.5667.6
Region 40.330.3829.1753.9
Region 50.410.4839.0085.2
Region 60.410.4830.2267.6
Yurui Bridge (Red)Region 10.400.5135.0485.9
Region 20.400.5238.5290.4
Region 30.440.5038.9991.2
Region 40.460.5239.7892.4
Region 50.420.5138.0780.4
Disclaimer/Publisher’s Note: The statements, opinions and data contained in all publications are solely those of the individual author(s) and contributor(s) and not of MDPI and/or the editor(s). MDPI and/or the editor(s) disclaim responsibility for any injury to people or property resulting from any ideas, methods, instructions or products referred to in the content.