Abstract
In the context of sustainable manufacturing practices, minimum quantity lubrication (MQL) has been extensively employed in machining operations involving hard-to-cut materials. While substantial experimental and numerical investigations on MQL-assisted machining have been conducted, existing simulation approaches remain inadequate for modeling the dynamic flow field variations inherent to MQL processes, significantly compromising the predictive reliability of current models. This study introduced an innovative bidirectional iterative coupling framework integrating finite element (FE) analysis and computational fluid dynamics (CFD) to enhance simulation accuracy. Since fluid flow characteristics critically influence tribological and thermal management at the tool–workpiece interface during machining, CFD simulations were initially performed to evaluate how MQL parameters govern fluid flow behavior. Subsequently, an integrated FE-CFD modeling approach was developed to simulate Ti-6Al-4V alloy turning under MQL conditions with varying feed rates. The novel methodology involved transferring thermal flux data from FE simulations to CFD’s heat source domain, followed by incorporating CFD-derived convective heat transfer coefficients back into FE computations. This repetitive feedback process continued until the thermal exchange parameters reached convergence. Validation experiments demonstrated that the proposed method achieved improved alignment between the simulated and experimental results for both cutting temperature profiles and principal force components across different feed conditions, confirming the enhanced predictive capability of this coupled simulation strategy.
1. Introduction
The material removal operation constitutes a highly intricate dynamic process involving intense thermal–mechanical interactions. Elevated thermal loads arise predominantly from plastic deformation within the shear zone combined with interfacial friction phenomena occurring between cutting tool surfaces and both chip/workpiece components. Such thermal accumulation frequently induces critical temperature thresholds that substantially compromise cutting tool integrity. This thermal degradation mechanism manifests most severely during the processing of hard-to-machine metallic systems like titanium-based alloys, where excessive heat generation directly correlates with accelerated tool wear patterns. To mitigate this issue, both academic and industrial communities have implemented diverse strategies, including surface coating technology [1,2,3], surface texturing technology [4,5,6], flood cooling lubrication [7,8,9], minimum quantity lubrication (MQL) [10,11,12], etc. Given the dual requirements of the effective reduction in cutting temperature and the eco-friendly low-carbon machining process, minimum quantity lubrication (MQL) technology has emerged as a widely favored solution [13].
Revuru et al. [14] performed rotational machining trials on AISI 1080 steel under anhydrous and MQL conditions, employing a canola-based lubricant. Their comparative analysis demonstrated enhanced performance metrics including reduced mechanical loads, decreased energy expenditure per unit material removal, and extended tool longevity when employing MQL technology, relative to conventional dry machining operations. Srinivasarao et al. [15] executed a parametric investigation on AISI 304 steel under MQL-assisted rotational machining, evaluating the interactions between process variables and lubrication parameters on thermal generation, mechanical resistance, and surface topography. Parametric analysis revealed that thermal generation showed primary dependence on axial engagement depth, material feed velocity, and cutting speed. Mechanical load magnitude exhibited the strongest correlation with depth of cut, while surface quality was predominantly determined by cutting velocity, lubricant delivery rate, and feed parameters. Extending beyond conventional machining, Aslantas et al. [16] conducted comparative micro-milling investigations on Ti6Al4V alloy across multiple cooling strategies (flood cooling, MQL, cryogenic air, and dry conditions), identifying MQL implementation as the optimal configuration for minimizing process-induced forces. Contrastingly, Cönger et al. [17] examined the nozzle configuration effects during Al6061-T651 alloy milling operations under varied cooling approaches. Their findings documented significant improvements in mechanical efficiency and surface integrity when implementing MQL strategies compared to anhydrous machining conditions, particularly regarding force reduction, energy optimization, and roughness mitigation. Moreover, the dual-nozzle MQL system performed better at reducing cutting forces, energy consumption, and surface roughness than the MQL environment with a singular nozzle. The aforementioned studies primarily employed experimental methodologies to investigate the MQL machining process.
However, the experimental method is characterized by being time-consuming and low-cost. Therefore, numerical methods are increasingly favored by scholars. Carvalho et al. [18] established the 2D cutting model for Ti6Al4V orthogonal turning under dry, flood cooling, and MQL environments using the ThirdWave AdvantEdge software, in which the effect of different environments was reflected by assigning convective heat flux to the corresponding surfaces of the tool and the workpiece. Differently, the ABAQUS/Explicit software was employed by Esmaeili et al. [19] to establish the finite element model for cutting nickel-based superalloy Inconel 718 in the MQL environment. In addition to the two pieces of finite element cutting simulation software mentioned above, DEFORM software is widely used in cutting process simulation with various cutting environments due to its automatic mesh re-meshing function [20]. Jamil et al. [21] predicted the cutting temperature produced in the MQL milling process of Ti-6Al-4V alloy with coated carbide-cutting inserts through DEFORM 2D software. The thermal exchange parameters and tribological coefficients were incorporated into FE modeling frameworks to computationally analyze the cooling/lubrication performance of diverse cutting fluids under varying machining parameters. Numerical results revealed the progressive elevation of thermal profiles in two-dimensional simulations corresponding to speed increments, aligning with the thermal evolution patterns observed during actual machining operations under analogous conditions. Extending this methodology, Laakso et al. [22] employed the DEFORM 3D platform for the three-dimensional modeling of powder metallurgy Cr-Mo-V tool steel processing under MQL conditions, where fluid-mediated thermal management and friction modulation were incorporated through convective heat transfer parameters and interfacial friction coefficients. These collective findings demonstrate that FE-based computational approaches can effectively model MQL-assisted material removal processes.
While finite element (FE) methodologies demonstrate proficiency in modeling intricate material removal dynamics, their inability to resolve dynamic variations within fluid flow fields during processing severely constrains the explanatory capacity regarding flow-dependent thermomechanical interactions. Such fluid-mediated transport phenomena can be rigorously characterized through computational fluid dynamics (CFD)-based numerical frameworks [23,24]. Applying CFD techniques, Qiao et al. [25] systematically evaluated how MQL operational parameters (fluid delivery rate, pneumatic pressure, nozzle standoff distance, and spray orientation) govern flow field evolution during aluminum alloy 7050 milling under MQL conditions. Their simulations identified the optimal MQL configurations (40 mL/h flow rate, 0.4–0.5 MPa pressure, 35 mm nozzle distance, 30° spray angle) that maximized atomization efficiency and interfacial penetration. Complementarily, Du et al. [26] employed CFD modeling to quantify spray geometry influences (nozzle angular alignment and spatial positioning) on fluid flow behavior during 316L stainless steel milling operations under MQL regimes. Furthermore, Singh and Sharma [27] employed ANSYS FLUENT 19.0 software to simulate the flow field characteristics under varying inlet pressures and flow velocities when water was utilized as the cutting fluid during titanium alloy machining. They further investigated the temperature rise of a fixed heat source at the tooltip (with a heat flux of 6.3 × 10⁷ W/m2) under the effect of different flow field properties. However, the effect of the chip on the flow field was not considered in the CFD model.
To achieve a more comprehensive understanding of how fluid flow field variations influence cutting processes, it is imperative to adopt a coupled approach combining finite element (FE) and computational fluid dynamics (CFD) models for analyzing machining operations. Pervaiz et al. [28] adopted DEFORM 3D to simulate the dry cutting process of titanium alloys and took the cutting temperature as the heat source of the tool in the CFD model. Then, with the help of ANSYS CFX software, they investigated the flow field characteristics under varying ambient air flow velocities and their effects on cutting temperature. Salame and Bejjani [29] used the temperature distribution obtained from the FE model as the heat source in the CFD model, thereby linking the FE model with the CFD model. The convective heat transfer coefficient was calculated by Hegab et al. [30] using the 2D CFD model, and it was used as the boundary film effect caused by the nano-additive minimum quantity lubrication environment in the 2D FE model. Nouzil et al. [31] calculated the convective heat transfer coefficient in the process of turning titanium alloy by the 3D CFD model and applied it to the 2D FE model. The numerical model was verified by the cutting temperature obtained from the experiment.
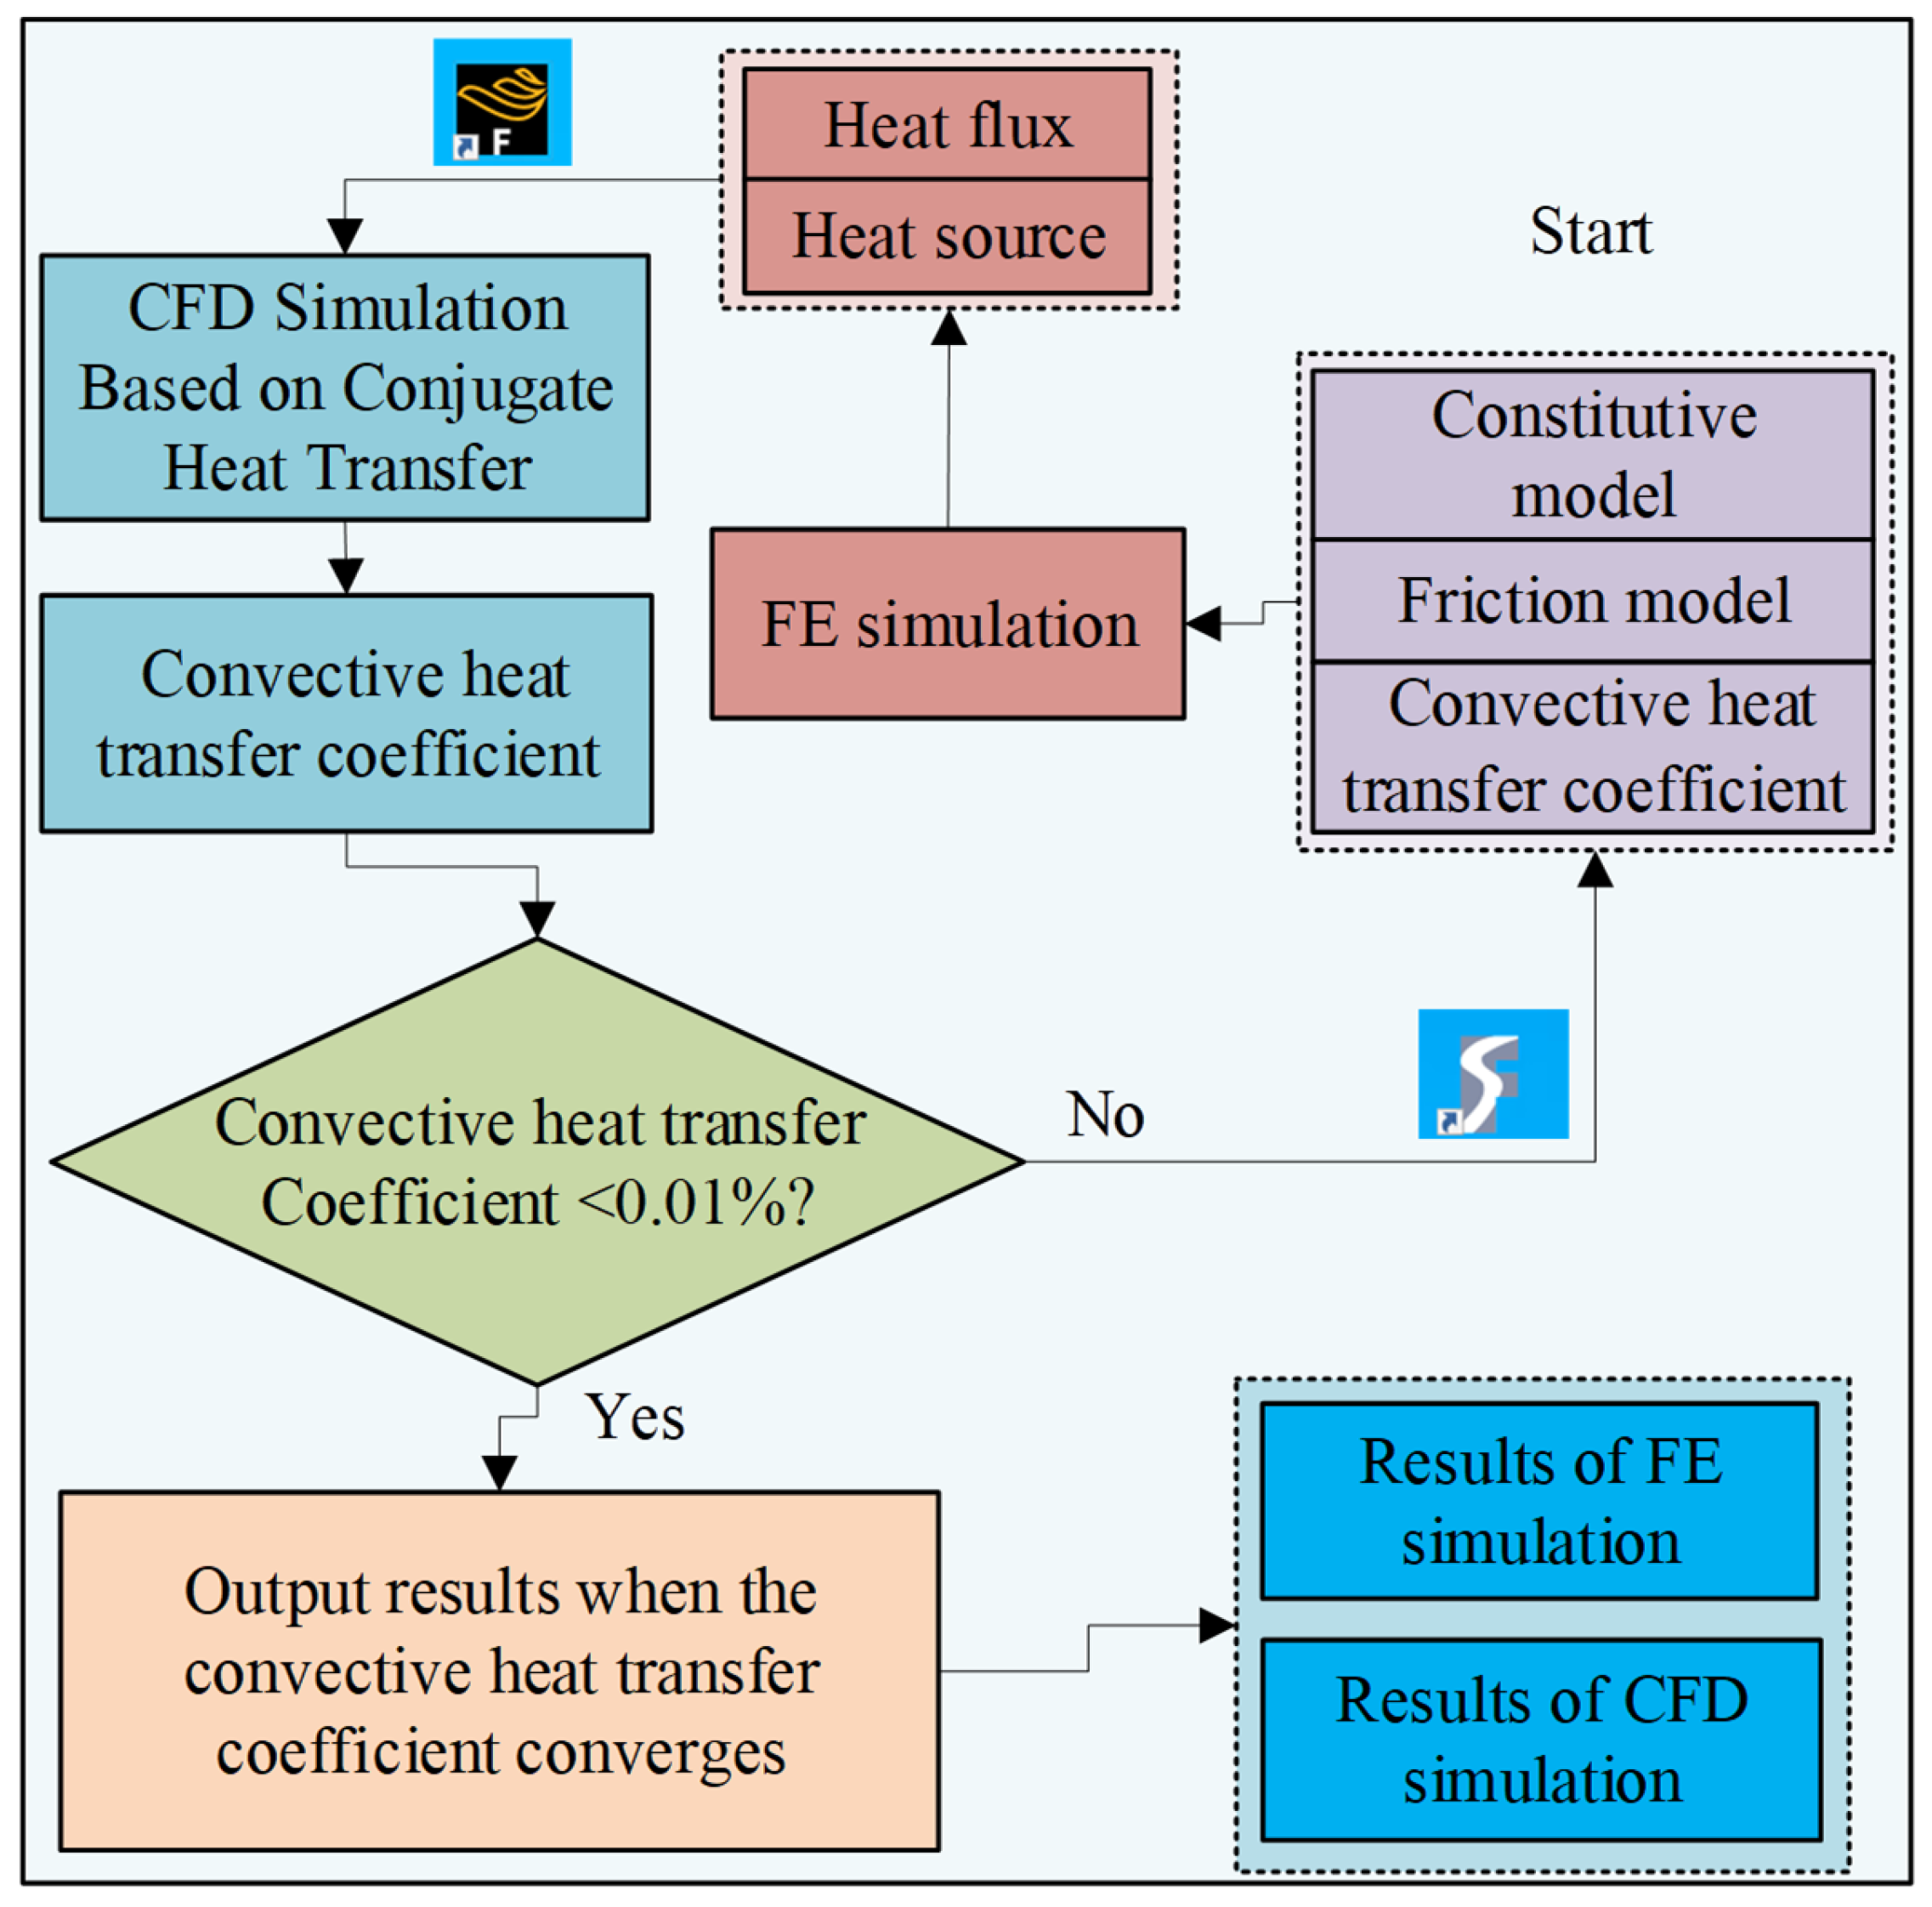
However, the aforementioned studies all employed a unidirectional sequential coupling approach (either from FE to CFD models or vice versa), without implementing cyclic iteration. This lack of bidirectional data feedback inherently compromises the credibility of simulation results to some extent. To fill this gap and achieve the precise prediction of tool cutting temperatures under MQL conditions, this paper innovatively proposed a bidirectionally coupled FE-CFD simulation methodology specifically designed for MQL environments. To maximize cooling/lubrication efficacy across all machining stages, CFD-based numerical analysis was employed to examine how MQL operational parameters govern lubricant flow dynamics. Following parameter optimization, a three-dimensional finite element (3D-FE) machining model incorporating localized thermal transfer zones was developed, from which thermal flux data were extracted post-simulation. These FE-derived thermal boundary conditions were subsequently implemented as the input for a multiphysics CFD framework that accounted for the dynamic interactions between workpiece morphology, chip formation patterns, and tool geometry within the fluid domain. Then, the average convective heat transfer coefficient acquired by CFD simulation was considered as the input parameter in the local heat transfer windows of the FE model. The iterative cycles were repeated until the convective heat transfer coefficient reached a steady state. The distinctive advancement of this proposed approach lies in its evolution from conventional sequential coupling to an iterative coupling mechanism between FE and CFD analyses under MQL conditions. This methodological enhancement will significantly improve the numerical simulation reliability for cutting processes involving variable flow fields, such as MQL applications.
2. Experiment and Simulation Procedures
2.1. FE Simulation Settings
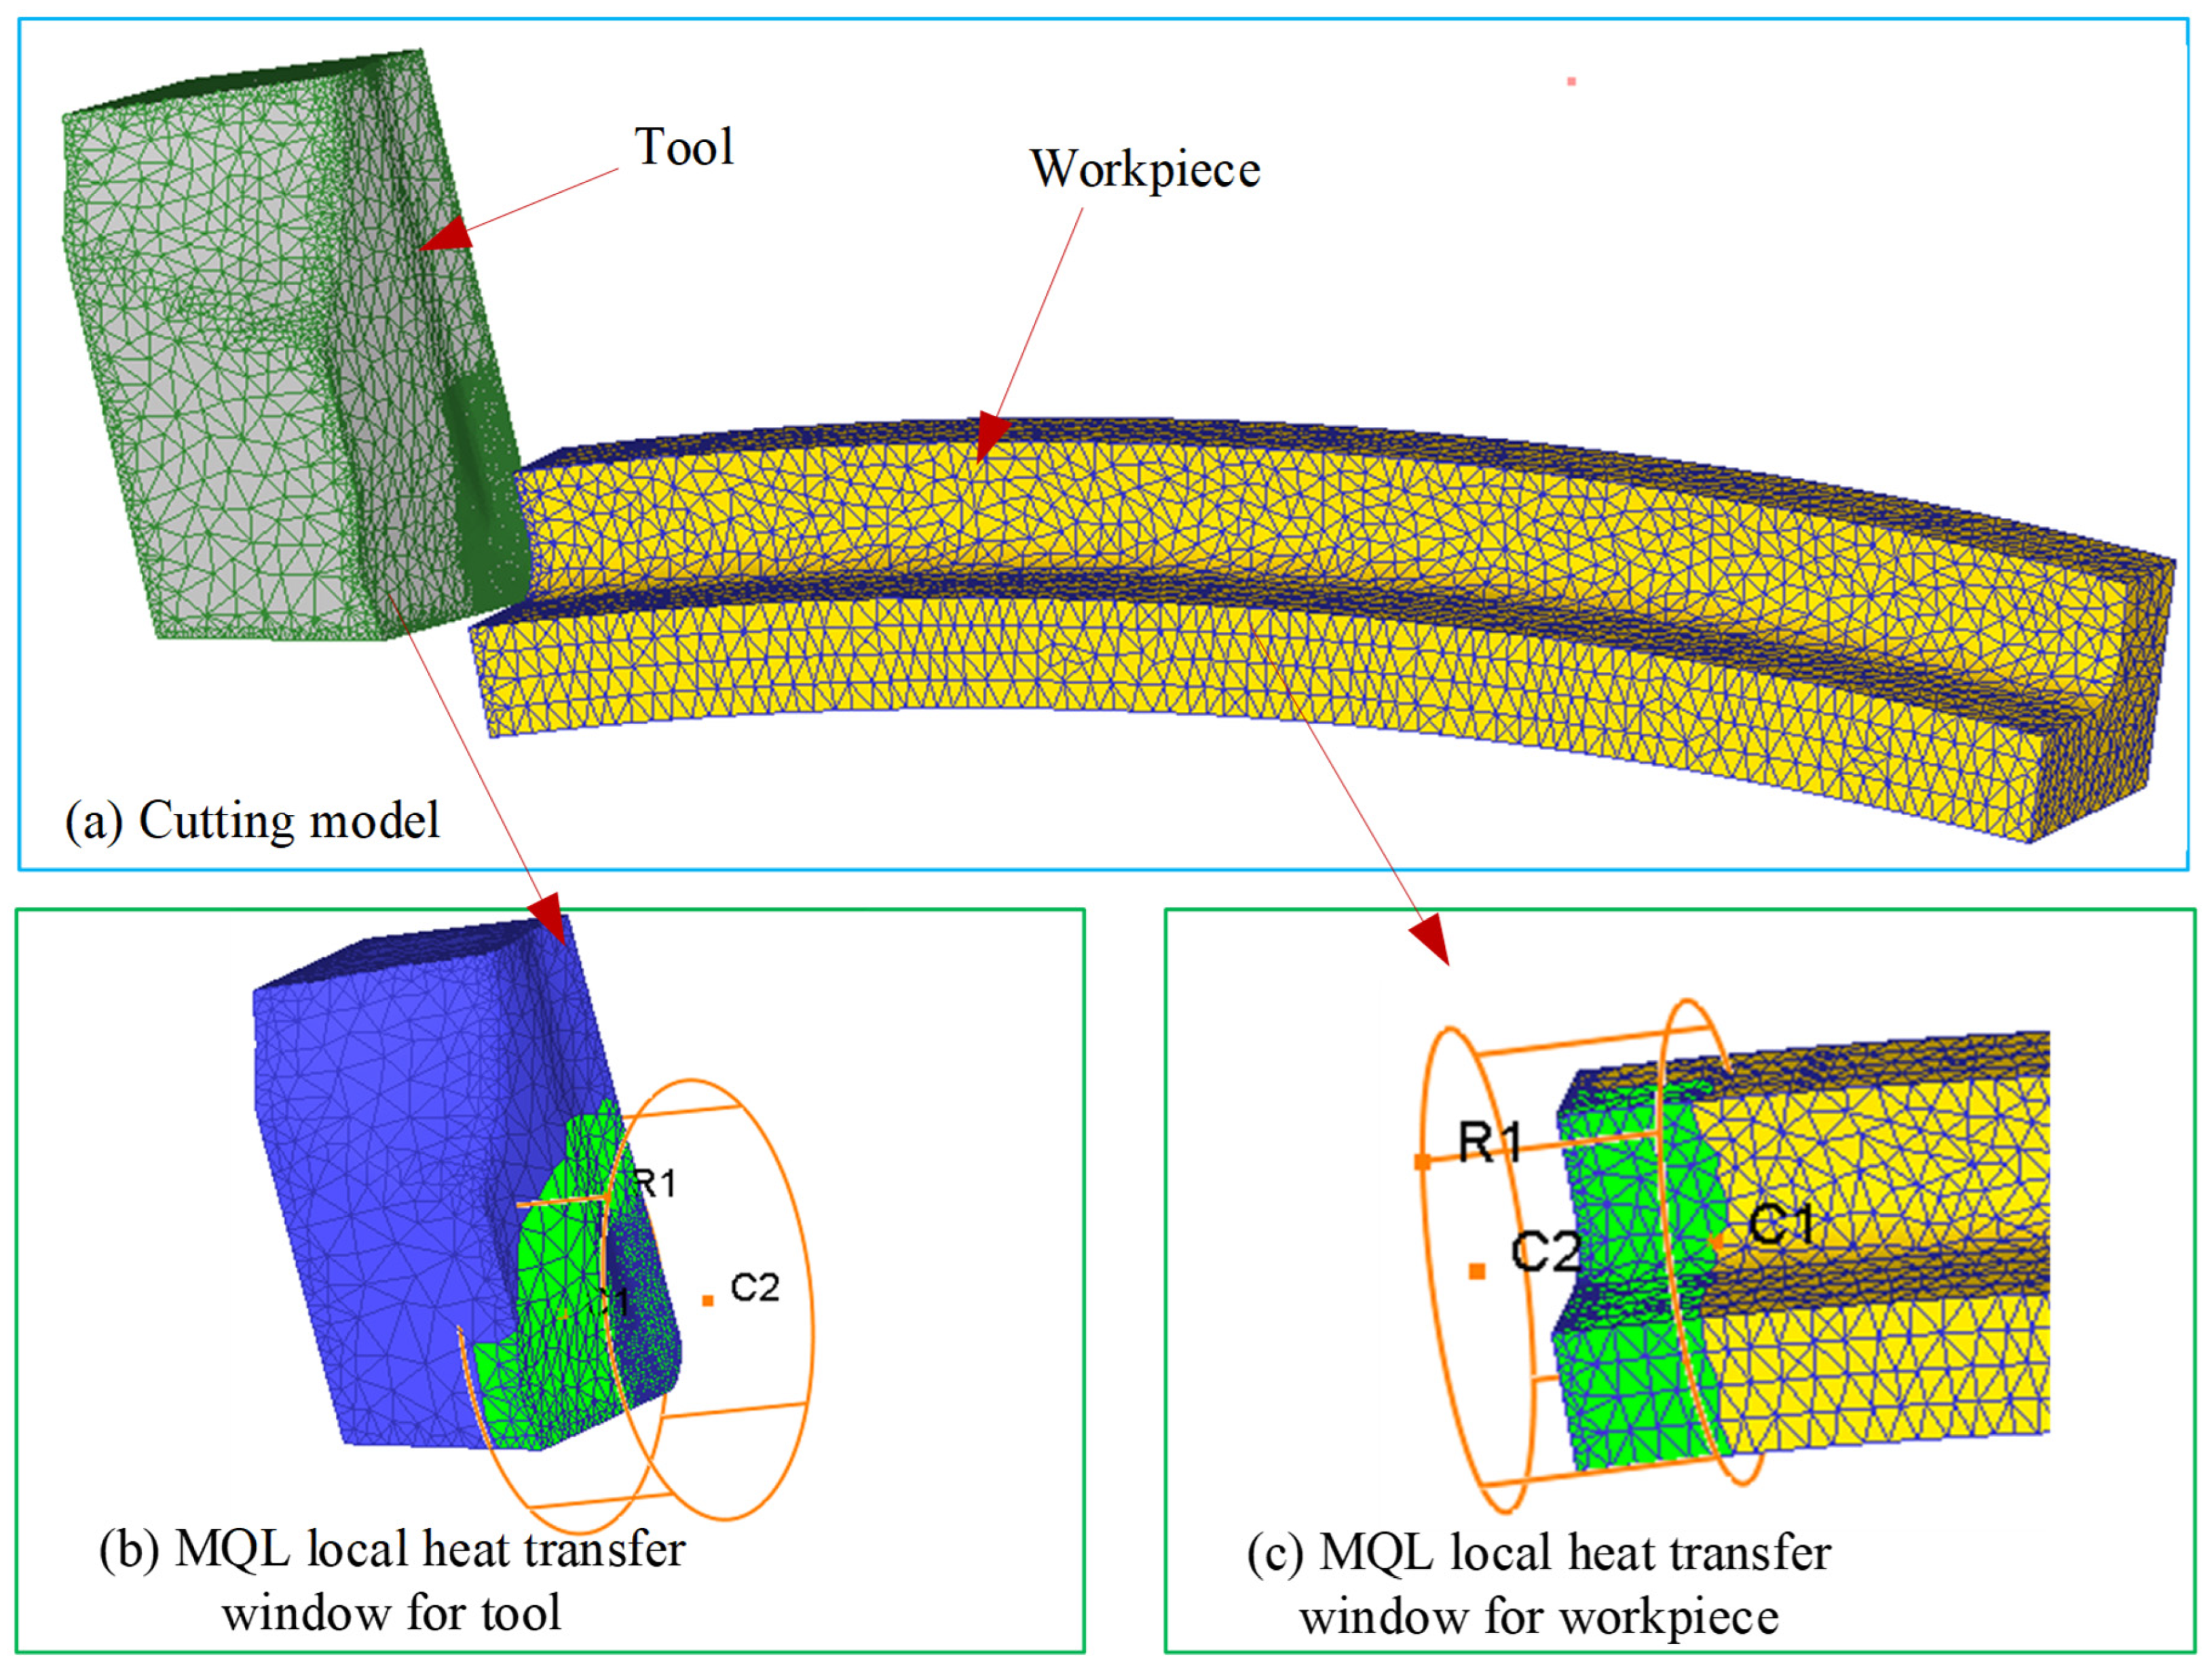
The 3D FE model in the MQL environment was established by DEFORM 3D 11.0 software (Figure 1). The workpiece used in the turning experiment was a bar with a cylindrical shape and a diameter of 80 mm. Therefore, the model for the workpiece used in the 3D cutting simulation was established as the curved model with an arc angle of 20° and a diameter of 80 mm, considering both simulation accuracy and computational cost. The workpiece and the tool were simulated as plastic and rigid bodies, respectively. The workpiece material was titanium alloy Ti-6Al-4V, and its material properties are listed in Table 1, where T denotes cutting temperature. The geometric model, material, and angles for the cutting tool used in the simulation were kept the same as those in the turning experiment (see Section 2.3). In the FE cutting process, the heat generated in the three deformation zones was transferred to the tool, chip, and workpiece through thermal conduction. Meanwhile, the tool, chip, and workpiece dissipated heat by convective heat exchange with the surrounding cutting fluid. To accurately model thermal interactions at the tool–chip interface during machining, a heat transfer coefficient of 2000 kW/(m2·K) was implemented. Simultaneously, the convective heat transfer coefficient governing environmental thermal dissipation was specified as 0.02 kW/(m2·K). To simulate MQL-mediated thermal effects, dynamically adaptive convective windows, tracking the tool’s kinematic path, were integrated into thermal boundary conditions for both the tool and workpiece, as depicted in Figure 1b,c. These transient zones were initialized with a baseline convective heat transfer coefficient of 10 kW/(m2·K), consistent with the methodologies documented in references [22,32]. To reduce the impact of grid differences and time sensitivity on the simulation results, multiple trial cutting simulations were conducted before the formal iterative simulation. Ultimately, the workpiece and tool were meshed with 34,804 elements and 16,954 elements, respectively, and the simulation time step was determined to be 9 × 10⁻⁶ s/step.

Figure 1.
FE model in the environment.

Table 1.
Thermal and mechanical properties of titanium alloy Ti-6Al-4V.
Interfacial phenomena at the tool–workpiece contact zone were characterized using a hybrid friction modeling approach. This tribological framework [33,34] was mathematically represented by the following formula:
where is the friction stress; represents the normal stress on the rake face of the tool; indicates the shear friction factor with a value of 1; k denotes shear flow stress; and is the Coulomb friction coefficient, of which the value can be calculated as follows [35]:
where is rake angle of the tool, and Fc and Ff mean the main cutting force and the feed force obtained by the turning experiments in the MQL environment, respectively.
The modified Johnson and Cook (JC) constitutive model [36] was used to capture the strain softening occurring in the cutting process. Its expression is given as follows:
During the cutting process, materials undergo elastic–plastic deformation and damage. The material above the dead zone forms chips, while the material below the dead zone forms the machined surface. The plastic energy dissipation-based fracture model proposed by Cockcroft and Latham [37], which explicitly addresses adiabatic shear band development mechanisms, provides enhanced simulation fidelity for machining operations involving hard-to-machine metallic systems such as Ti-6Al-4V alloy. This constitutive formulation was consequently adopted as the primary failure criterion in the current investigation, mathematically defined through the following relationship:
2.2. CFD Simulation Procedures
The Fluent module of Ansys Workbench was selected for CFD simulation. The geometric model was established using NX 12.0 software. Then the completed geometric model was imported into the pre-processing software SpaceClaim 2022 R1 within the Fluent module to perform pre-processing tasks such as naming. After the geometric model was processed, we proceeded to mesh the model. While balancing computational accuracy and efficiency, the mesh type was set to tetrahedral. The mesh size was controlled through global and local mesh controls, with local refinement applied to microstructural regions. Moreover, curvature and small-size feature capture were enabled to improve mesh quality. To ensure the accuracy of the Fluent simulation results, skewness was used as an evaluation index for mesh quality. The meshing parameters were iteratively adjusted until the value of skewness fell below 0.73. To minimize disparities arising from mesh discrepancies and temporal sensitivity, a series of preliminary CFD trials were executed preceding the formal iterative process. Ultimately, the CFD model was meshed with 7,498,819 elements, and the step size was determined to be 1 × 10⁻⁶ s/step. In the CFD simulation process, the computational domain included both the fluid and solid domains. The materials of the fluid and solid domains were air and carbide, respectively. The inlet boundary condition was set as a pressure inlet, while the outlet boundary condition was defined as a pressure outlet. In the nozzle, the fluid comprised air and cutting fluid. The air was defined by a pressure inlet boundary condition for the continuous phase, while the cutting fluid was modeled as a discrete phase. The Eulerian–Lagrangian-based discrete phase model (DPM) was activated to simulate the trajectory of cutting fluid droplets in the MQL injection process. As a typical green vegetable oil, rapeseed oil was used as a cutting fluid, of which the relative characteristic parameters are presented in Table 2.
Table 2.
Relative characteristic parameters of cutting fluid.
In the DPM, the continuous phase was air, and the discrete phase was cutting fluid droplet particles. The interphase interaction functions between the continuous and discrete phases were activated to more accurately simulate the mass, momentum, and energy exchange occurring during the mixing of cutting fluid and air. The fundamental mathematical framework governing continuous phase dynamics comprised three principal balance equations: mass continuity, momentum preservation, and thermal energy equilibrium, mathematically formulated through the following system of expressions [38]
where V is the velocity vector, denotes density, indicates time, p stands for pressure, refers to the second derivative stress tensor, k denotes turbulent kinetic energy, T corresponds to temperature, and expresses the viscous dissipation function.
The turbulence model is commonly employed to simulate the flow of fluids under MQL conditions [39]. Consequently, the flow characteristics of MQL fluids were modeled using a turbulence-based framework. These governing equations comprise formulations for the turbulent kinetic energy and turbulent energy dissipation rate, mathematically represented as follows:
where is the turbulent kinetic energy dissipation rate; , , , and are constants, with values of 1.00, 1.30, 1.44, and 1.92, respectively; and denotes turbulent viscosity, for which the expression is as follows:
where denotes Laminar viscosity and is a constant, with a value of 0.99.
The governing equation for the droplet particle phase is expressed as follows:
where f is the particle distribution function; denotes particle velocity; indicates particle position; and A represents the acceleration caused by hydrodynamic resistance, dynamic pressure gradient, net buoyancy, and inter-particle gradient stress, and its expression is as follows:
where is drag function, expresses particle density, and indicates particle volume fraction.
To reflect the refinement and coarsening phenomena that occur after collisions among MQL-injected droplets, the droplet random collision, droplet coalescence, and breakage models were activated. The breakup model selected here was the KHRT model, the momentum exchange model was the dynamic drag model, and the turbulent diffusion model was the particle random trajectory model. Then, CFD simulation was carried out by setting parameters such as the material properties and boundary conditions of the continuous and discrete phases. Before this, the component delivery model needed to be activated to make the cutting fluid act in the form of droplets rather than inert particles.
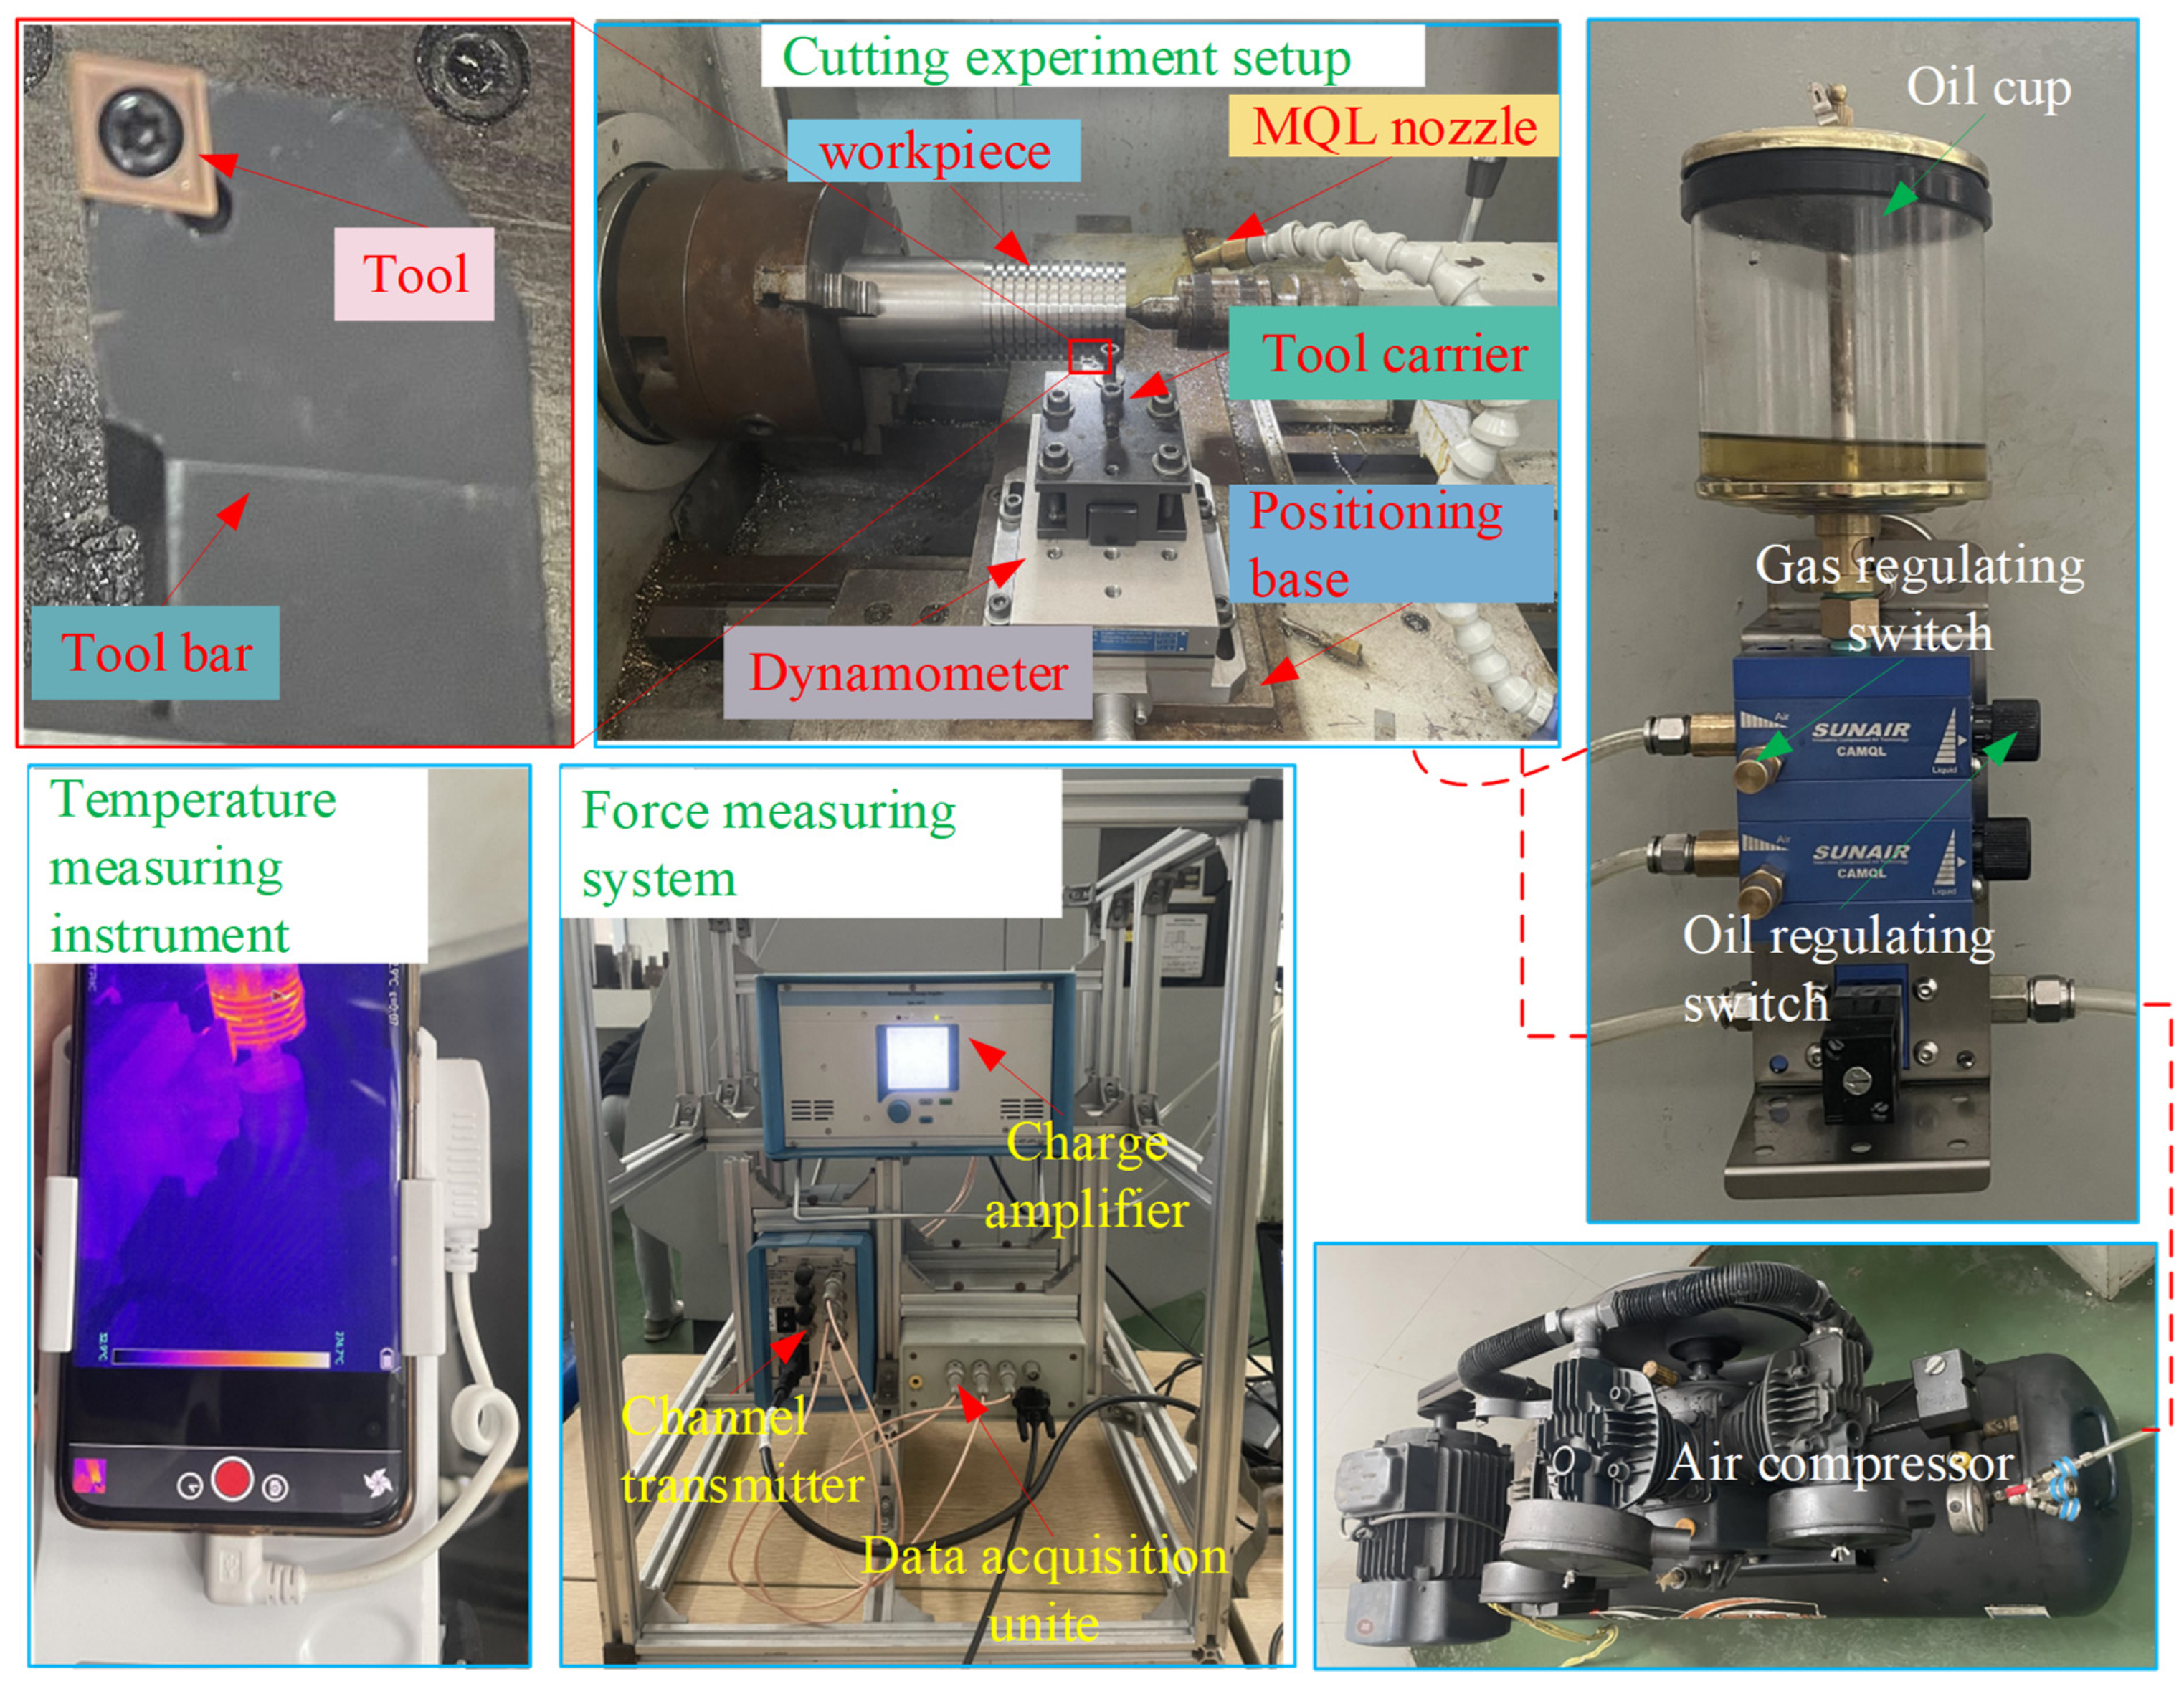
2.3. The Procedures of the MQL Cutting Experiment
Three repeated turning experiments were implemented under different machining parameters (45 m/min velocity, 0.15 mm/rev and 0.20 mm/rev feed rates, 1 mm axial depth) to validate the FE-CFD co-simulation framework. The experimental setup employed a TiAlN-coated carbide insert (3 μm coating thickness, CCGT09T304 geometry) mounted on an SCLCR2020K09 tool holder, configured with a 7° rake angle, 0° inclination angle, 7° clearance angle, and 95° cutting edge orientation. The workpiece comprised a Ti-6Al-4V cylindrical billet (Ø80 × 200 mm). As illustrated in Figure 2, the MQL experimental configuration integrated a Kistler 9257B dynamometer (Kistler, Winterthur, Switzerland) for continuous force monitoring and an FOTRIC infrared thermal camera (FOTRIC, Shanghai, China) for real-time temperature mapping. The average main cutting force and peak cutting temperature measured in the cutting stability stage were taken as the measurement results of each turning experiment. The average values of the three measurements were taken as the final results, and the results were then compared with the simulation results obtained by the coupled FE-CFD method to verify its reliability. Pre-experimental procedures included multiple dry-run trials to establish measurement consistency and the removal of 1 mm of surface material to eliminate oxidation effects. Operational parameters were standardized at 50 mL/h lubricant flow and 5 bar air pressure based on the Section 3.1 findings. According to the research in Section 3.2, the nozzle pose (including nozzle distance, nozzle pitch angle, and nozzle deflection angle) was adjusted to a nozzle distance of 10 mm, a nozzle pitch angle of 45°, and a nozzle deflection angle of 65°.

Figure 2.
The platform of the MQL cutting experiment.
3. Results and Discussion
During MQL-assisted machining operations, the MQL parameters governing minimum-quantity lubrication predominantly determine fluid flow dynamics, consequently influencing tool performance characteristics. These parameters can be categorized into MQL injection parameters and nozzle pose parameters. To optimize fluid-mediated thermal management and tribological effects throughout material removal processes, the present study initially examined the parametric dependence of lubricant flow behavior on MQL variables. This investigation enabled the determination of optimal process parameters for subsequent analysis. Building upon these findings, an integrated FE-CFD co-simulation framework was developed to enhance the predictive fidelity of numerical simulations in MQL machining scenarios. The computational methodology’s validity was systematically confirmed through experimental validation protocols.
3.1. Effects of MQL Injection Parameters on the Flow Characteristics
3.1.1. Establishment of 2D Calculation Model
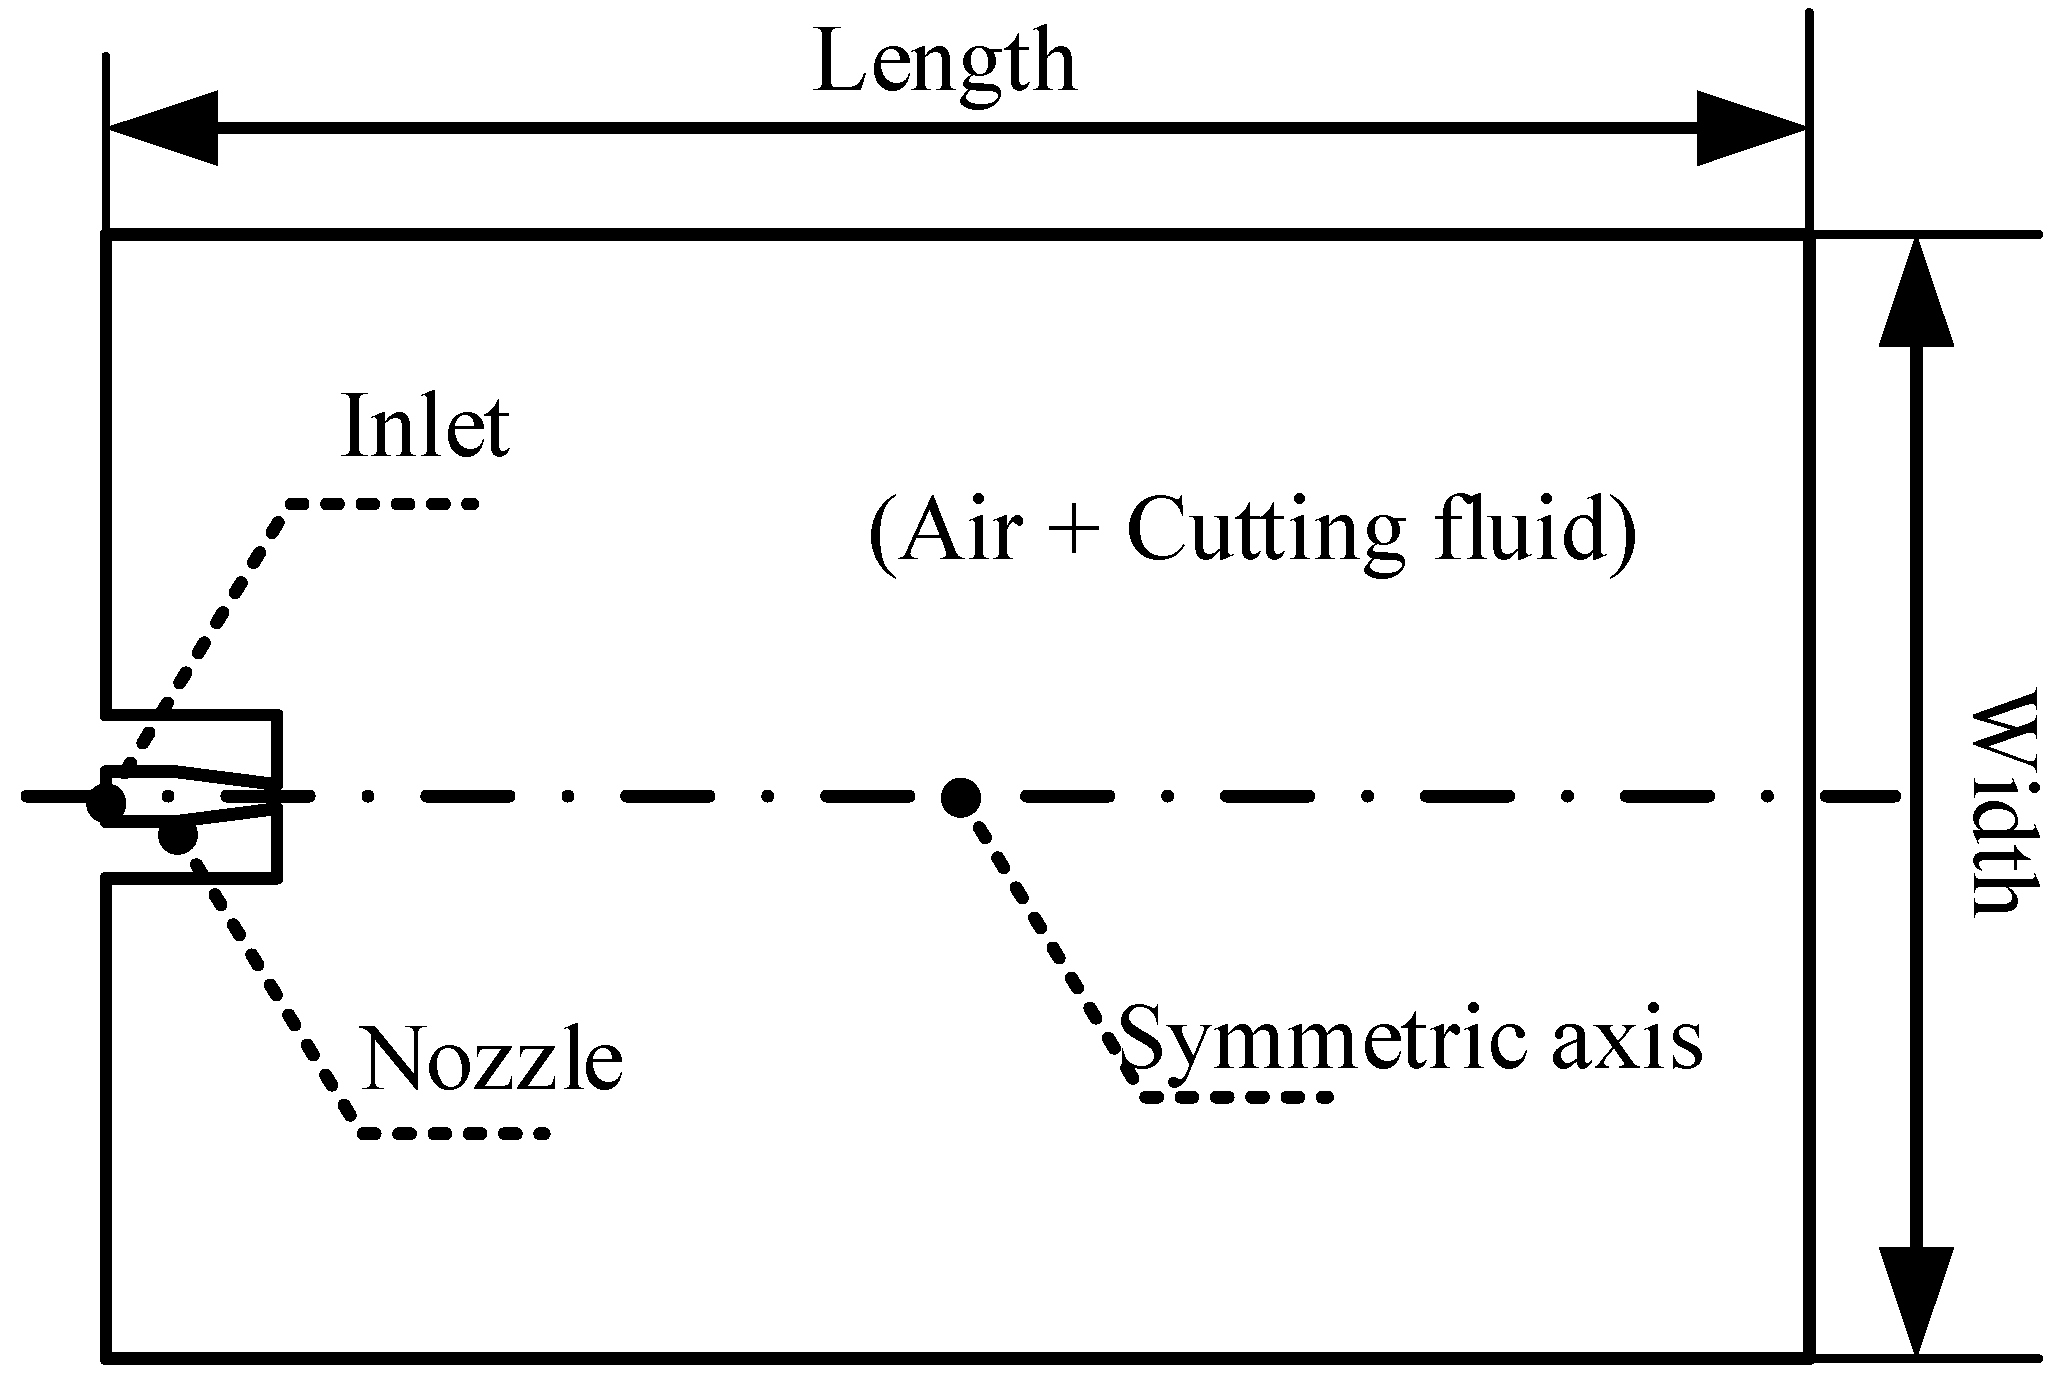
MQL injection parameters primarily encompass injection pressure and flow rate, which critically govern fluid flow dynamics within MQL delivery systems and substantially determine coolant-lubricant performance. During material removal operations, the quantity of atomized droplets reaching the tool–chip interface directly correlates with heat dissipation and friction reduction efficacy. Both droplet size distribution and velocity magnitude significantly influence interfacial droplet transportation efficiency. Consequently, discrete droplet diameter, velocity vectors, and interfacial droplet density were selected as evaluation metrics to assess pressure–flow rate effects on fluid flow behavior. Figure 3 illustrates the developed two-dimensional computational domain (300 mm × 200 mm), where the multiphase flow comprised compressed air and lubricant mixtures. Air pressure was defined via pressure inlet boundary conditions, while fluid delivery rate was regulated through DPM incident parameters.
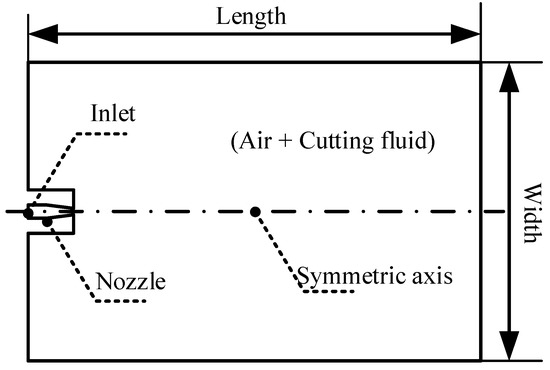
Figure 3.
Two-dimensional computational model.
3.1.2. Analysis of 2D Simulation Results
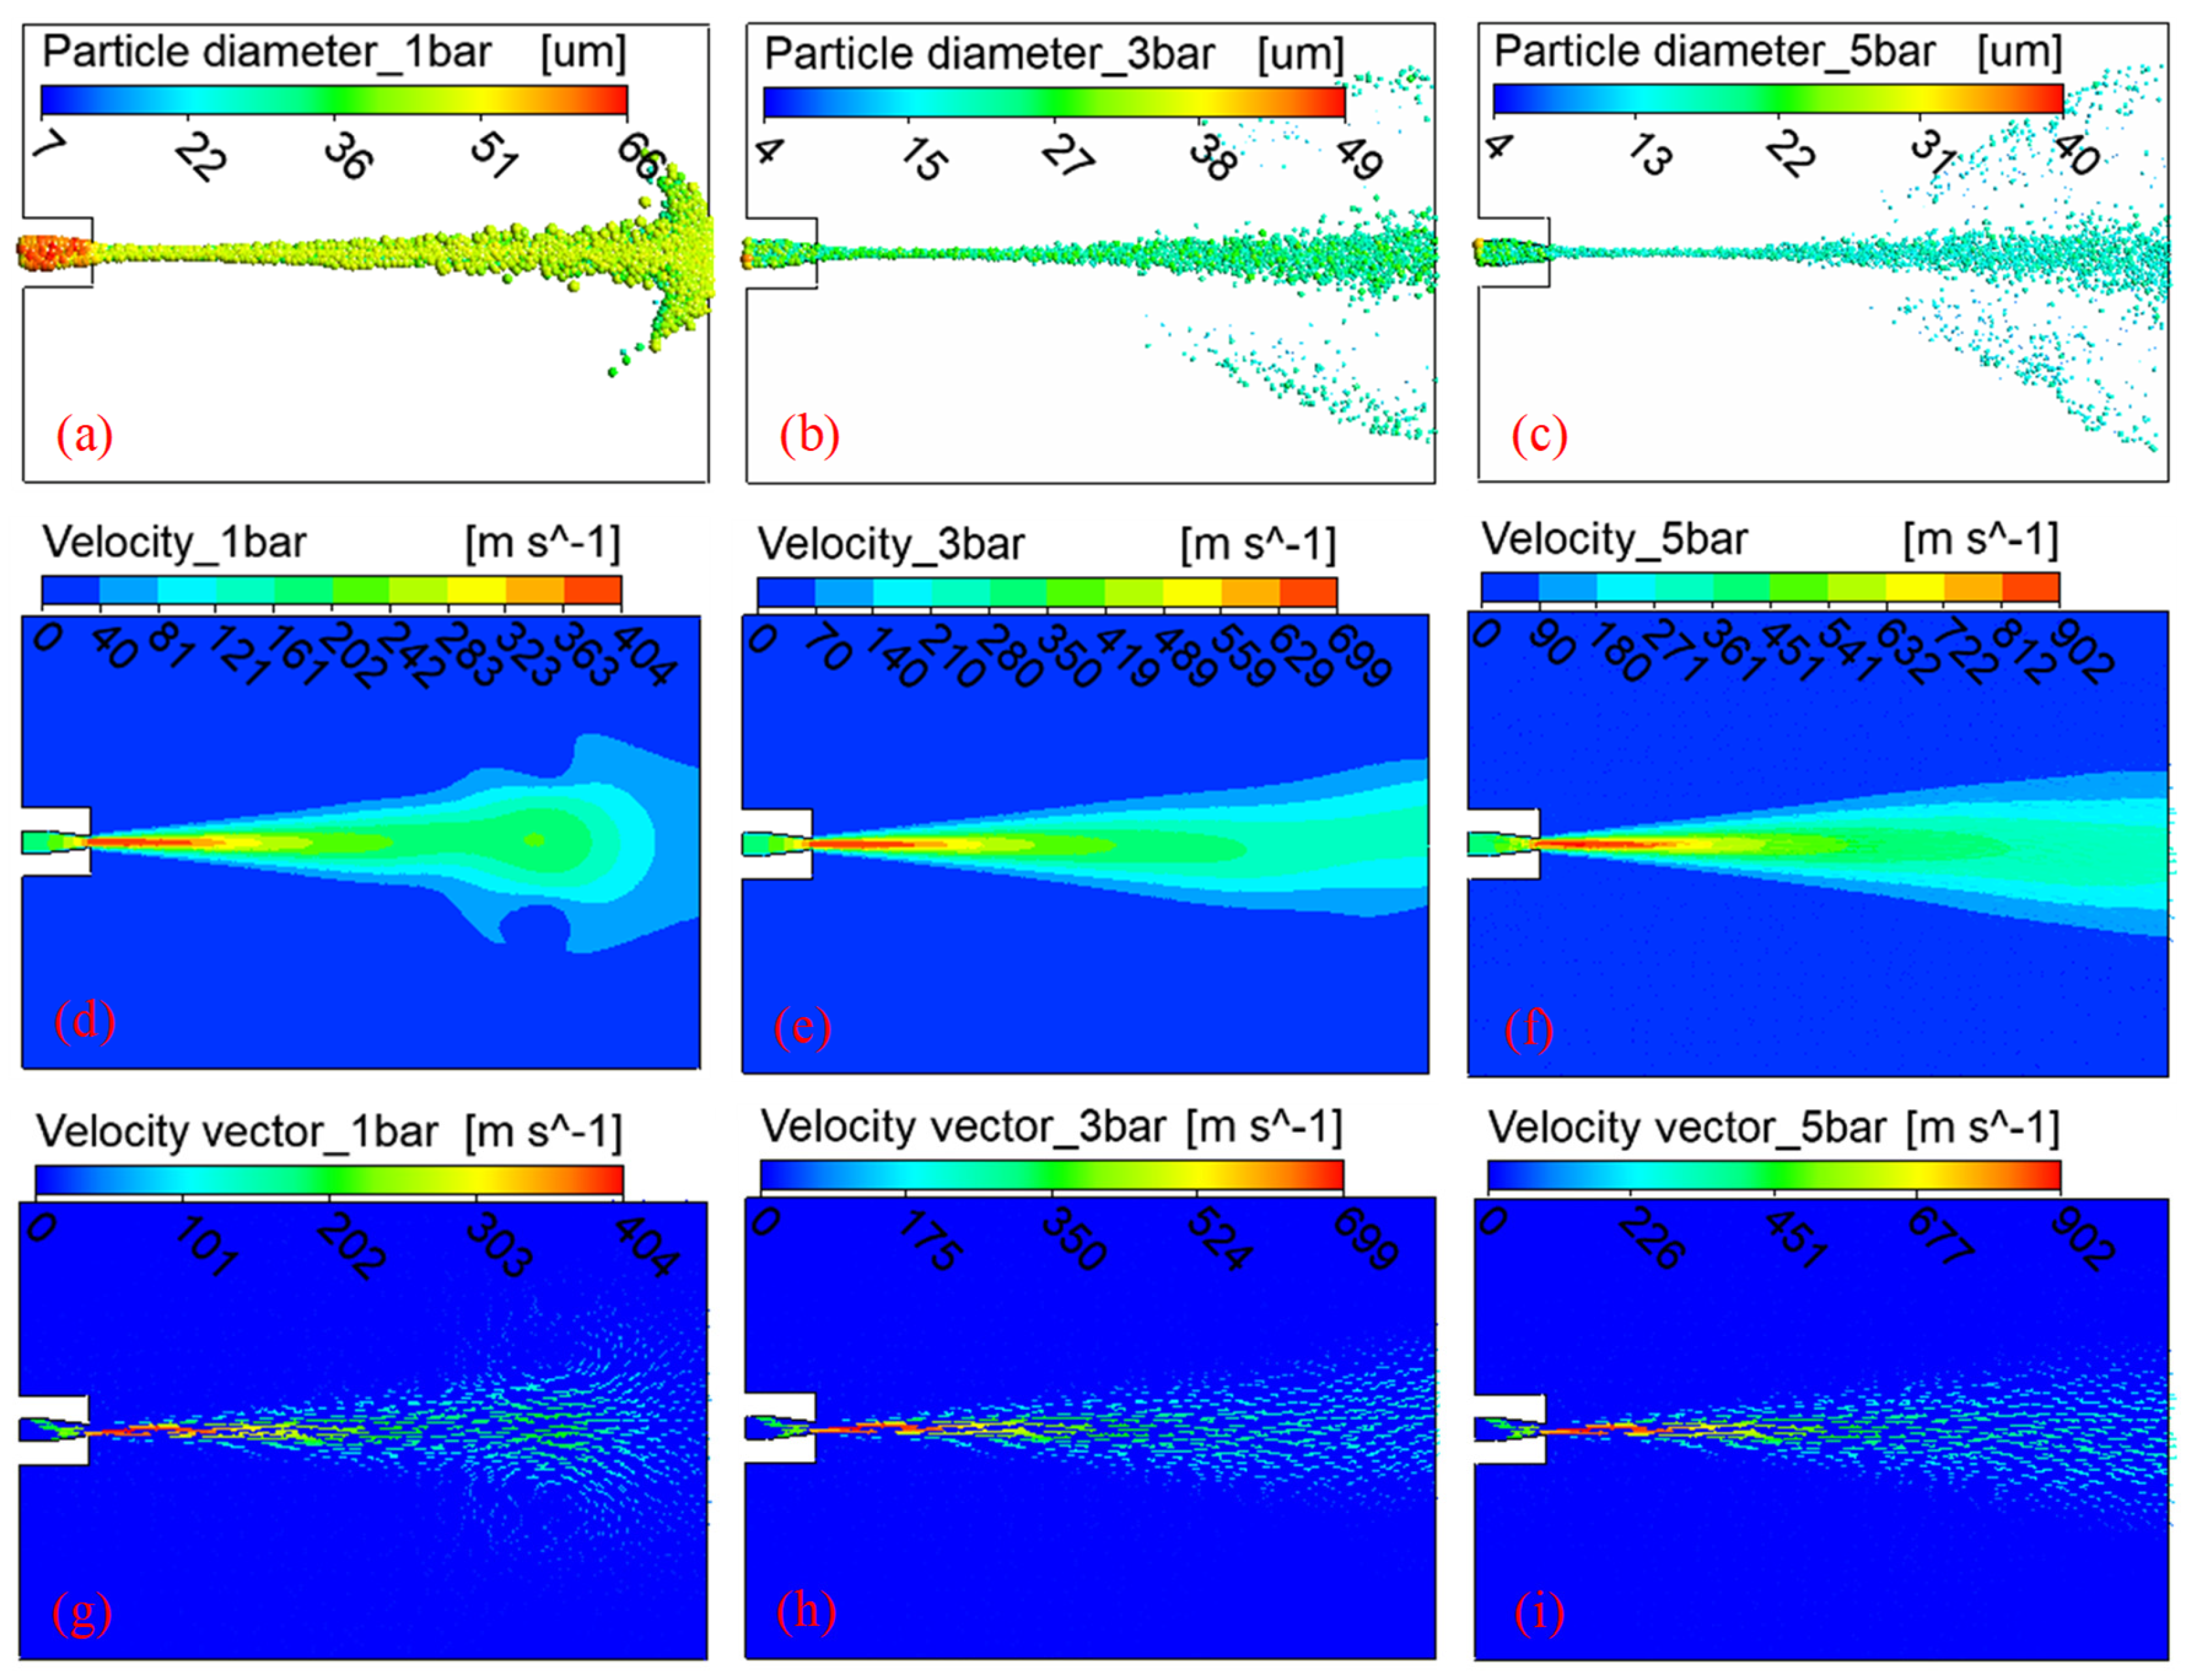
The diameter distribution, velocity vector, and velocity field of cutting fluid droplets under different pressures are presented in Figure 4. As depicted in Figure 4a–c, the degree of refinement of the droplet particles increased with the increase in pressure. From Figure 4d–f, the velocity of cutting fluid droplets reached its maximum value in the near domain at the centerline axis of the nozzle and gradually decreased as the radial and axial distances increased. This was mainly due to the momentum exchange between the flowing cutting fluid droplets and the surrounding air. In addition, as the air pressure increased, the maximum velocity of droplets gradually increased, and there was a stronger scaling relationship between the contours of the high-velocity field and the low-velocity field obtained under high air pressure. Namely, the contour of the low-velocity region could be regarded as the amplification of the contour of the high-velocity region. This was mainly due to the greater flow force on the cutting fluid droplets under a higher air pressure. At this time, the movement resistance generated by the surrounding ambient air on the cutting fluid droplets was not enough to affect the contour of the velocity field. According to Figure 4g–i, a typical vortex phenomenon was exhibited by the droplets at an air pressure of 1 bar, and this phenomenon gradually weakened with the increase in air pressure. This was mainly due to the fact that under low pressure, the flow power obtained by the cutting fluid droplets was small. With the increase in the axial motion distance, the cutting fluid droplets continuously exchanged momentum with the surrounding air, resulting in a decrease in the moving speed of the cutting fluid droplets. The intensity of momentum exchange between the outer cutting fluid droplets and the ambient air was much greater than that in the central region. When the speed of the outer cutting fluid droplets fell below the velocity of the counter-moving ambient air, the outer droplets reversed direction, resulting in vortex formation. Conversely, at high air injection pressures, the cutting fluid droplets experienced greater flow power. Therefore, the likelihood of vortex formation decreased within the same moving distance.
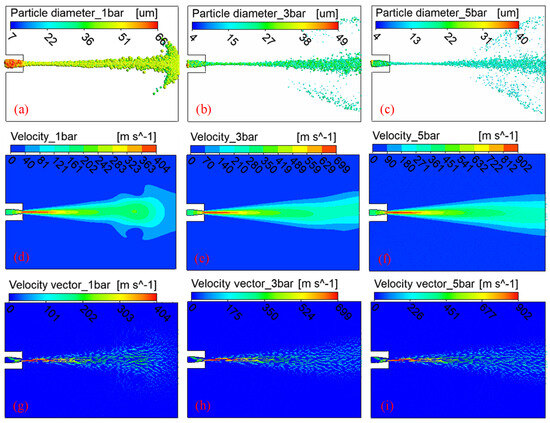
Figure 4.
Particle diameter distribution (a–c), velocity vector fields (d–f), and velocity contours (g–i) of cutting fluid droplets under injection pressures of 1, 3, and 5 bar. Results from 2D CFD simulations using ANSYS Fluent’s DPM illustrate droplet refinement and vortex development.
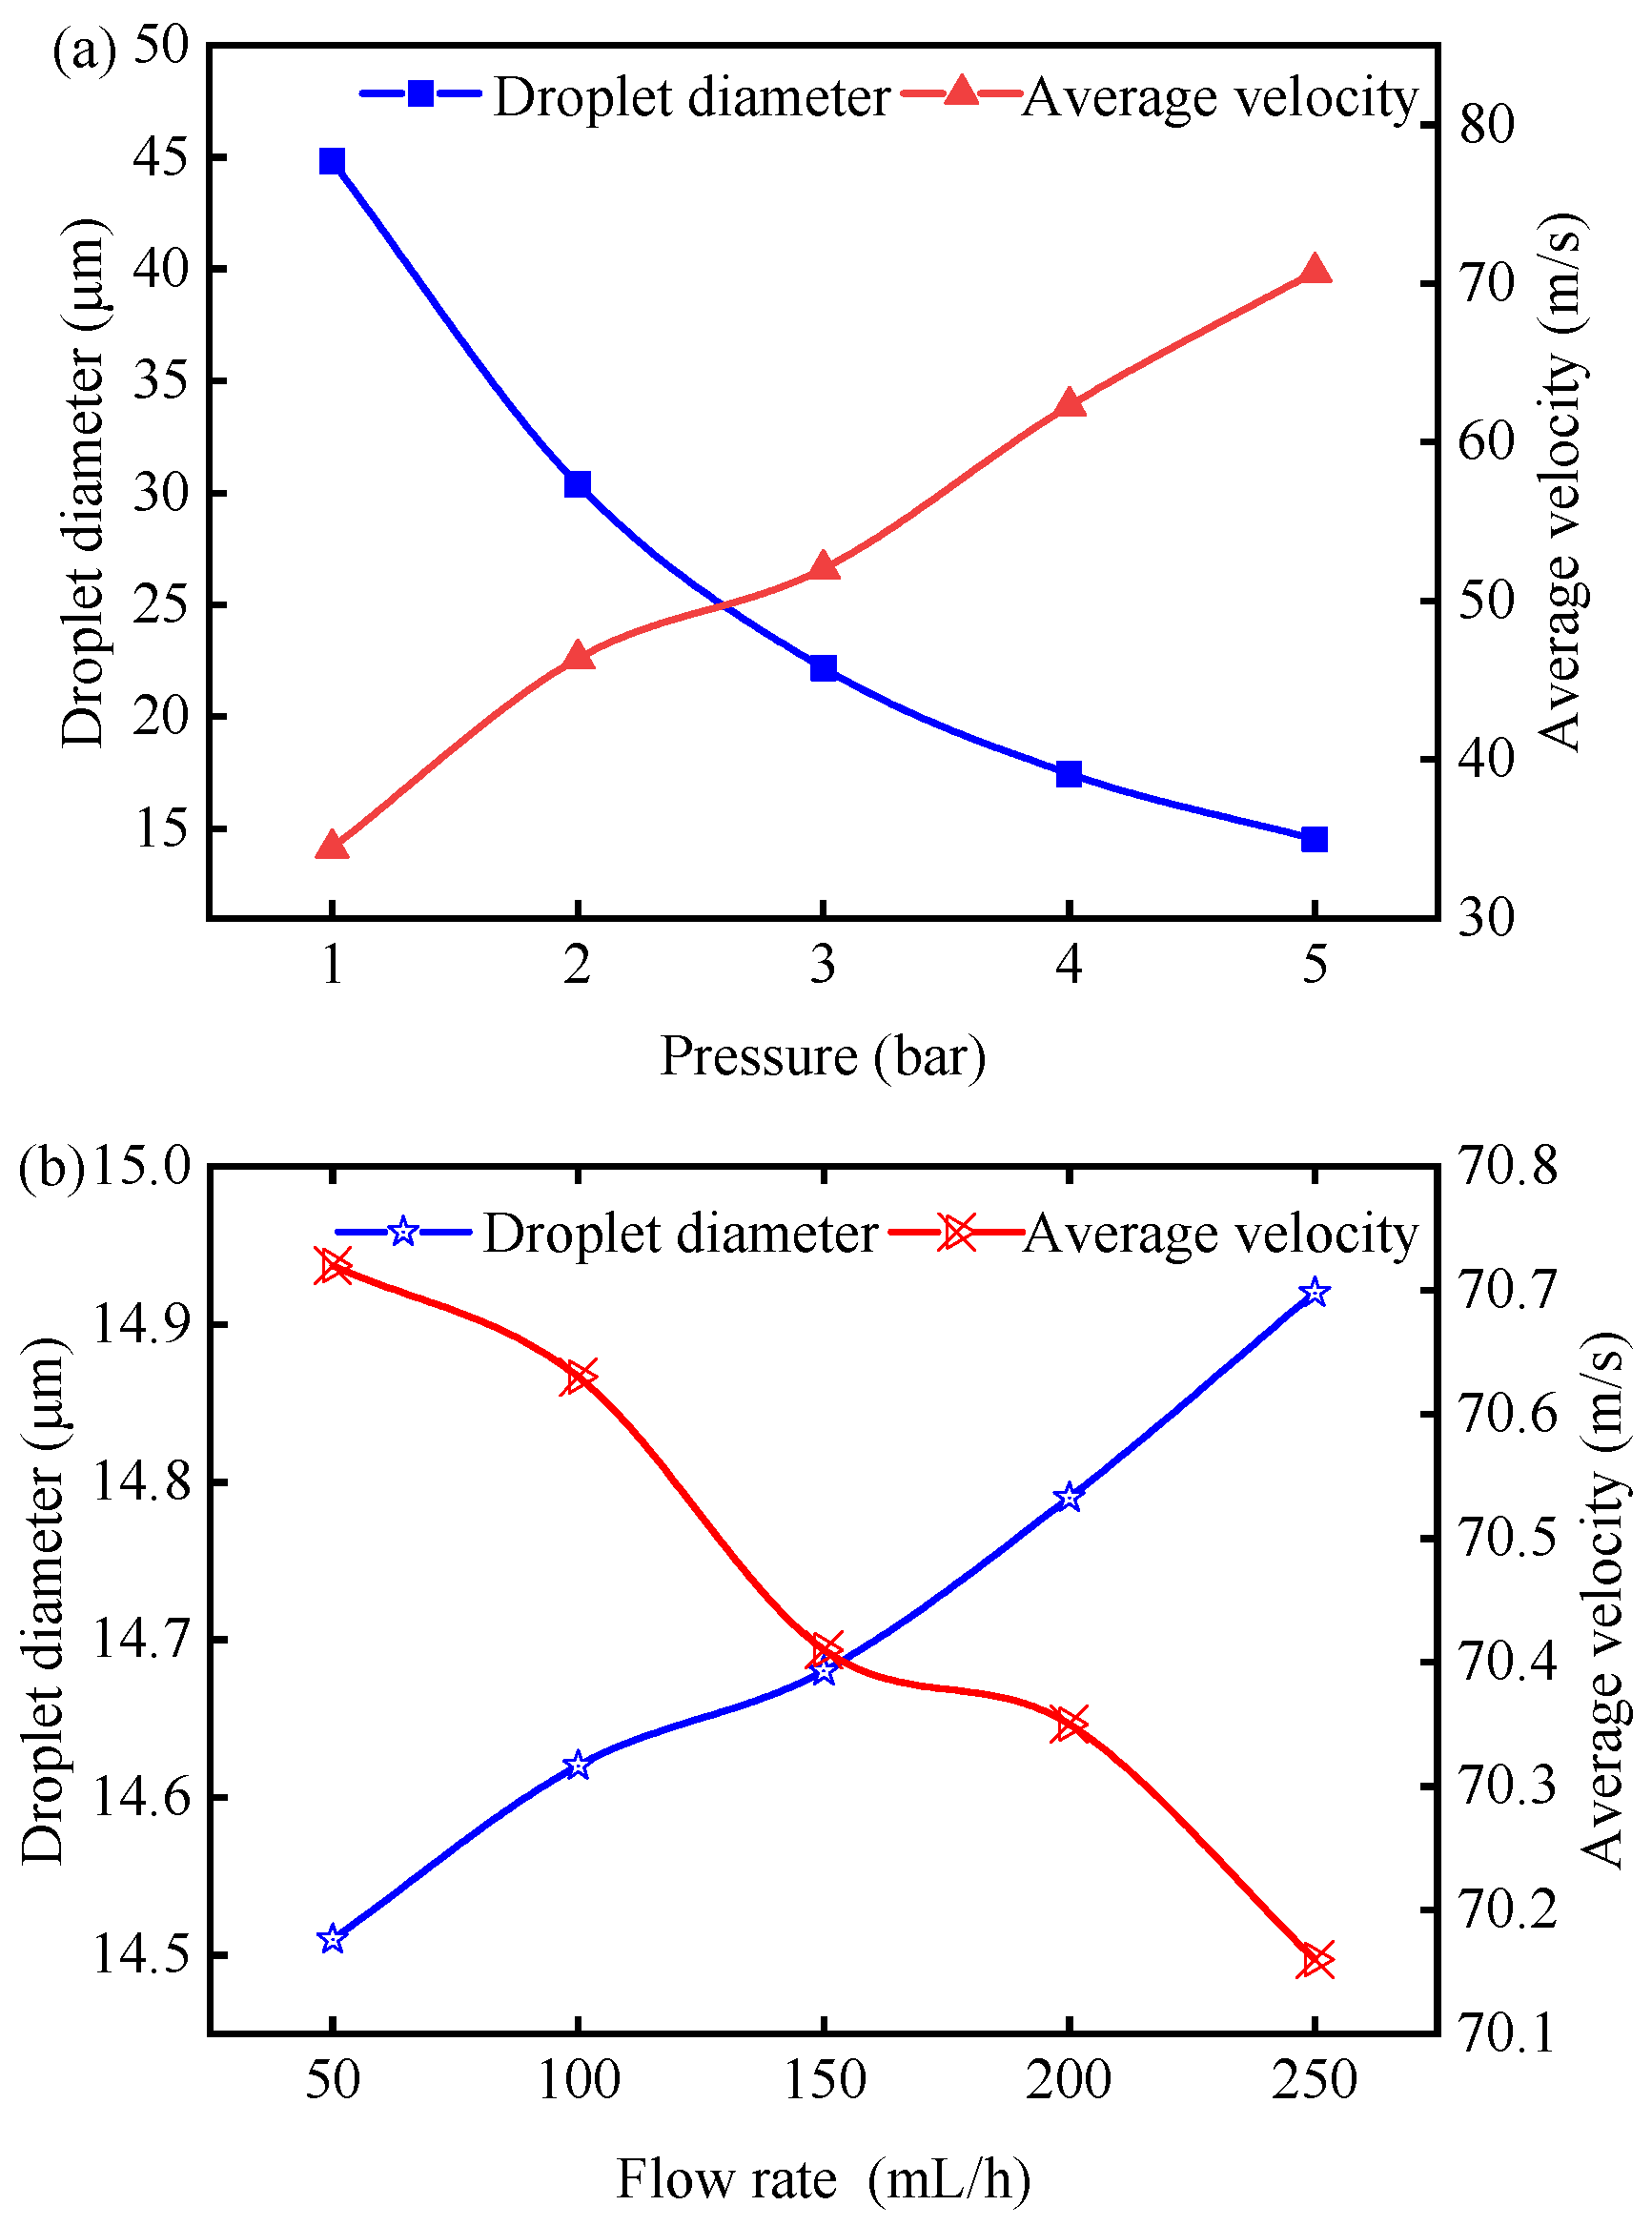
Building upon the flow behavior analysis during lubricant injection (Figure 4), quantitative evaluation was conducted using Sauter mean diameter (D32, SMD) and droplet velocity profiles as key metrics. Figure 5 demonstrates the parametric influence of injection pressure and fluid delivery rate on coolant flow dynamics. Figure 5a illustrates an inverse correlation between pressure magnitude and droplet dimensions, accompanied by proportional velocity enhancement. Conversely, Figure 5b reveals that an increasing flow rate induces a concurrent reduction in average velocity and increase in droplet size. A comparative analysis of Figure 5a,b demonstrates that pneumatic pressure exerts significantly greater influence on droplet transport characteristics than hydraulic flow parameters.
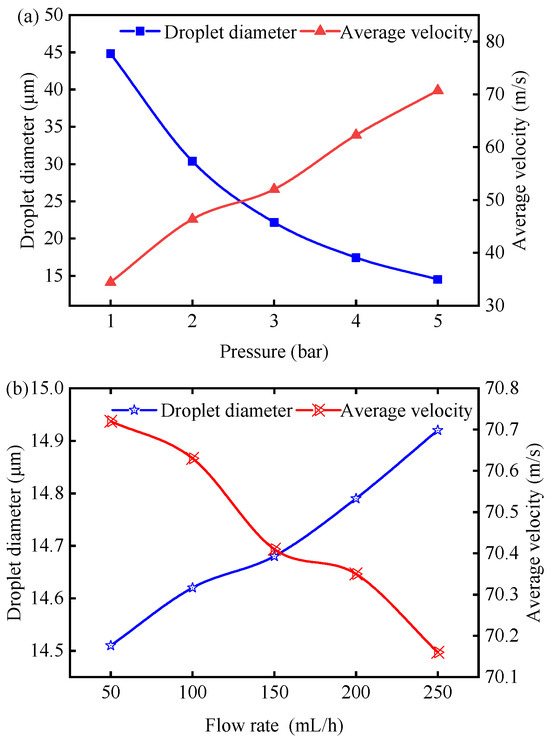
Figure 5.
Effect of (a) injection pressure (1–5 bar) and (b) flow rate (50–250 mL/h) on average droplet velocity and Sauter mean diameter, calculated from 2D CFD simulations. Results inform optimal droplet transport to tool–chip interface under MQL.
Appropriately sized droplets are conducive to entering the tool–chip contact area, thereby better exerting lubrication and cooling effects. In the turning process of X10CrNi198-8 steel in MQL environment, Maruda et al. [40,41] concluded that when the diameter of cutting fluid droplets was close to 15 μm, a thicker lubricating film could be formed, thereby reducing the friction coefficient of the interacting interface. Subsequently, in the turning process of AISI 1045 carbon steel, it was found that when the droplet diameter was 8.53 μm, the tool showed a significant improvement in wear resistance, and the cutting fluid droplets with smaller particle diameters were more likely to reach the tool–chip contact area, thereby exerting better lubrication and cooling performance. Different from turning, Dixit and Kant et al. [42] pointed out that medium-sized cutting fluid droplets with diameters ranging from 7.5 to 12.9 μm could maximize the lubrication and cooling performances in the MQL milling process of SS304. This can be attributed to the fact that droplets with excessively large particle diameters are subject to greater resistance during motion and have slower movement speeds, while droplets with extremely small particle diameters tend to rebound when sprayed onto the tool surface. Medium-sized droplets, taking into account the effects of both motion resistance and rebound, have a higher possibility of entering the tool–chip contact area. Considering the rebound phenomenon of droplets and the common droplet particle diameter range in MQL turning, the medium-sized particles with diameters of 7–15 μm are more beneficial for transporting cutting fluid droplets to the tool–chip contact area. As demonstrated in Figure 5a, medium-sized particles within the range of 7–15 μm could be obtained when the air pressure was 5 bar, so the air pressure was determined to be 5 bar. Reduced lubricant supply rates were observed to achieve enhanced droplet kinematics, characterized by higher mean velocity magnitudes and reduced particle dimensions (Figure 5b). These optimized fluid transport properties facilitated improved penetration efficiency into the tool–chip interface. Consequently, a fluid delivery rate of 50 mL/h was selected as the operational parameter for subsequent investigations.
3.2. Effects of Nozzle Pose Parameters on the Flow Characteristics
3.2.1. Establishment of 3D Calculation Model
In the MQL turning operations, three critical nozzle pose parameters were defined: spray distance (dn, the interval between the nozzle exit and tooltip), pitch angle (αn, the orientation between the nozzle axis and tool rake surface), and deflection angle (βn, the angular deviation between the nozzle and tool shank axes). A three-factor four-level orthogonal experimental design was formulated to systematically evaluate the influence of nozzle pose parameters on coolant flow dynamics. Experimental parameter coding with corresponding factor levels is tabulated in Table 3, while Table 4 details the complete experimental matrix. Following the orthogonal array outlined in Table 4, the nozzle pose parameters were adjusted, and the corresponding three-dimensional (3D) calculation model for the MQL nozzle pose was established (Figure 6).
Table 3.
Factor level coding for the orthogonal experiment of nozzle pose parameters.
Table 4.
Experimental scheme and results for nozzle pose parameters.
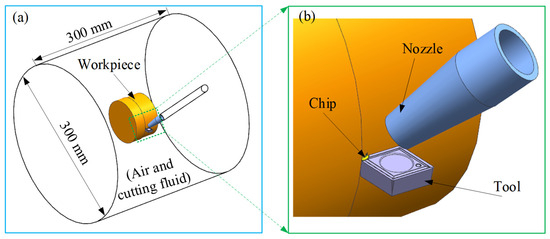
Figure 6.
Schematic diagram of the 3D calculation model of MQL nozzle pose (a,b) the partially enlarged view.
3.2.2. Analysis of 3D Simulation Results
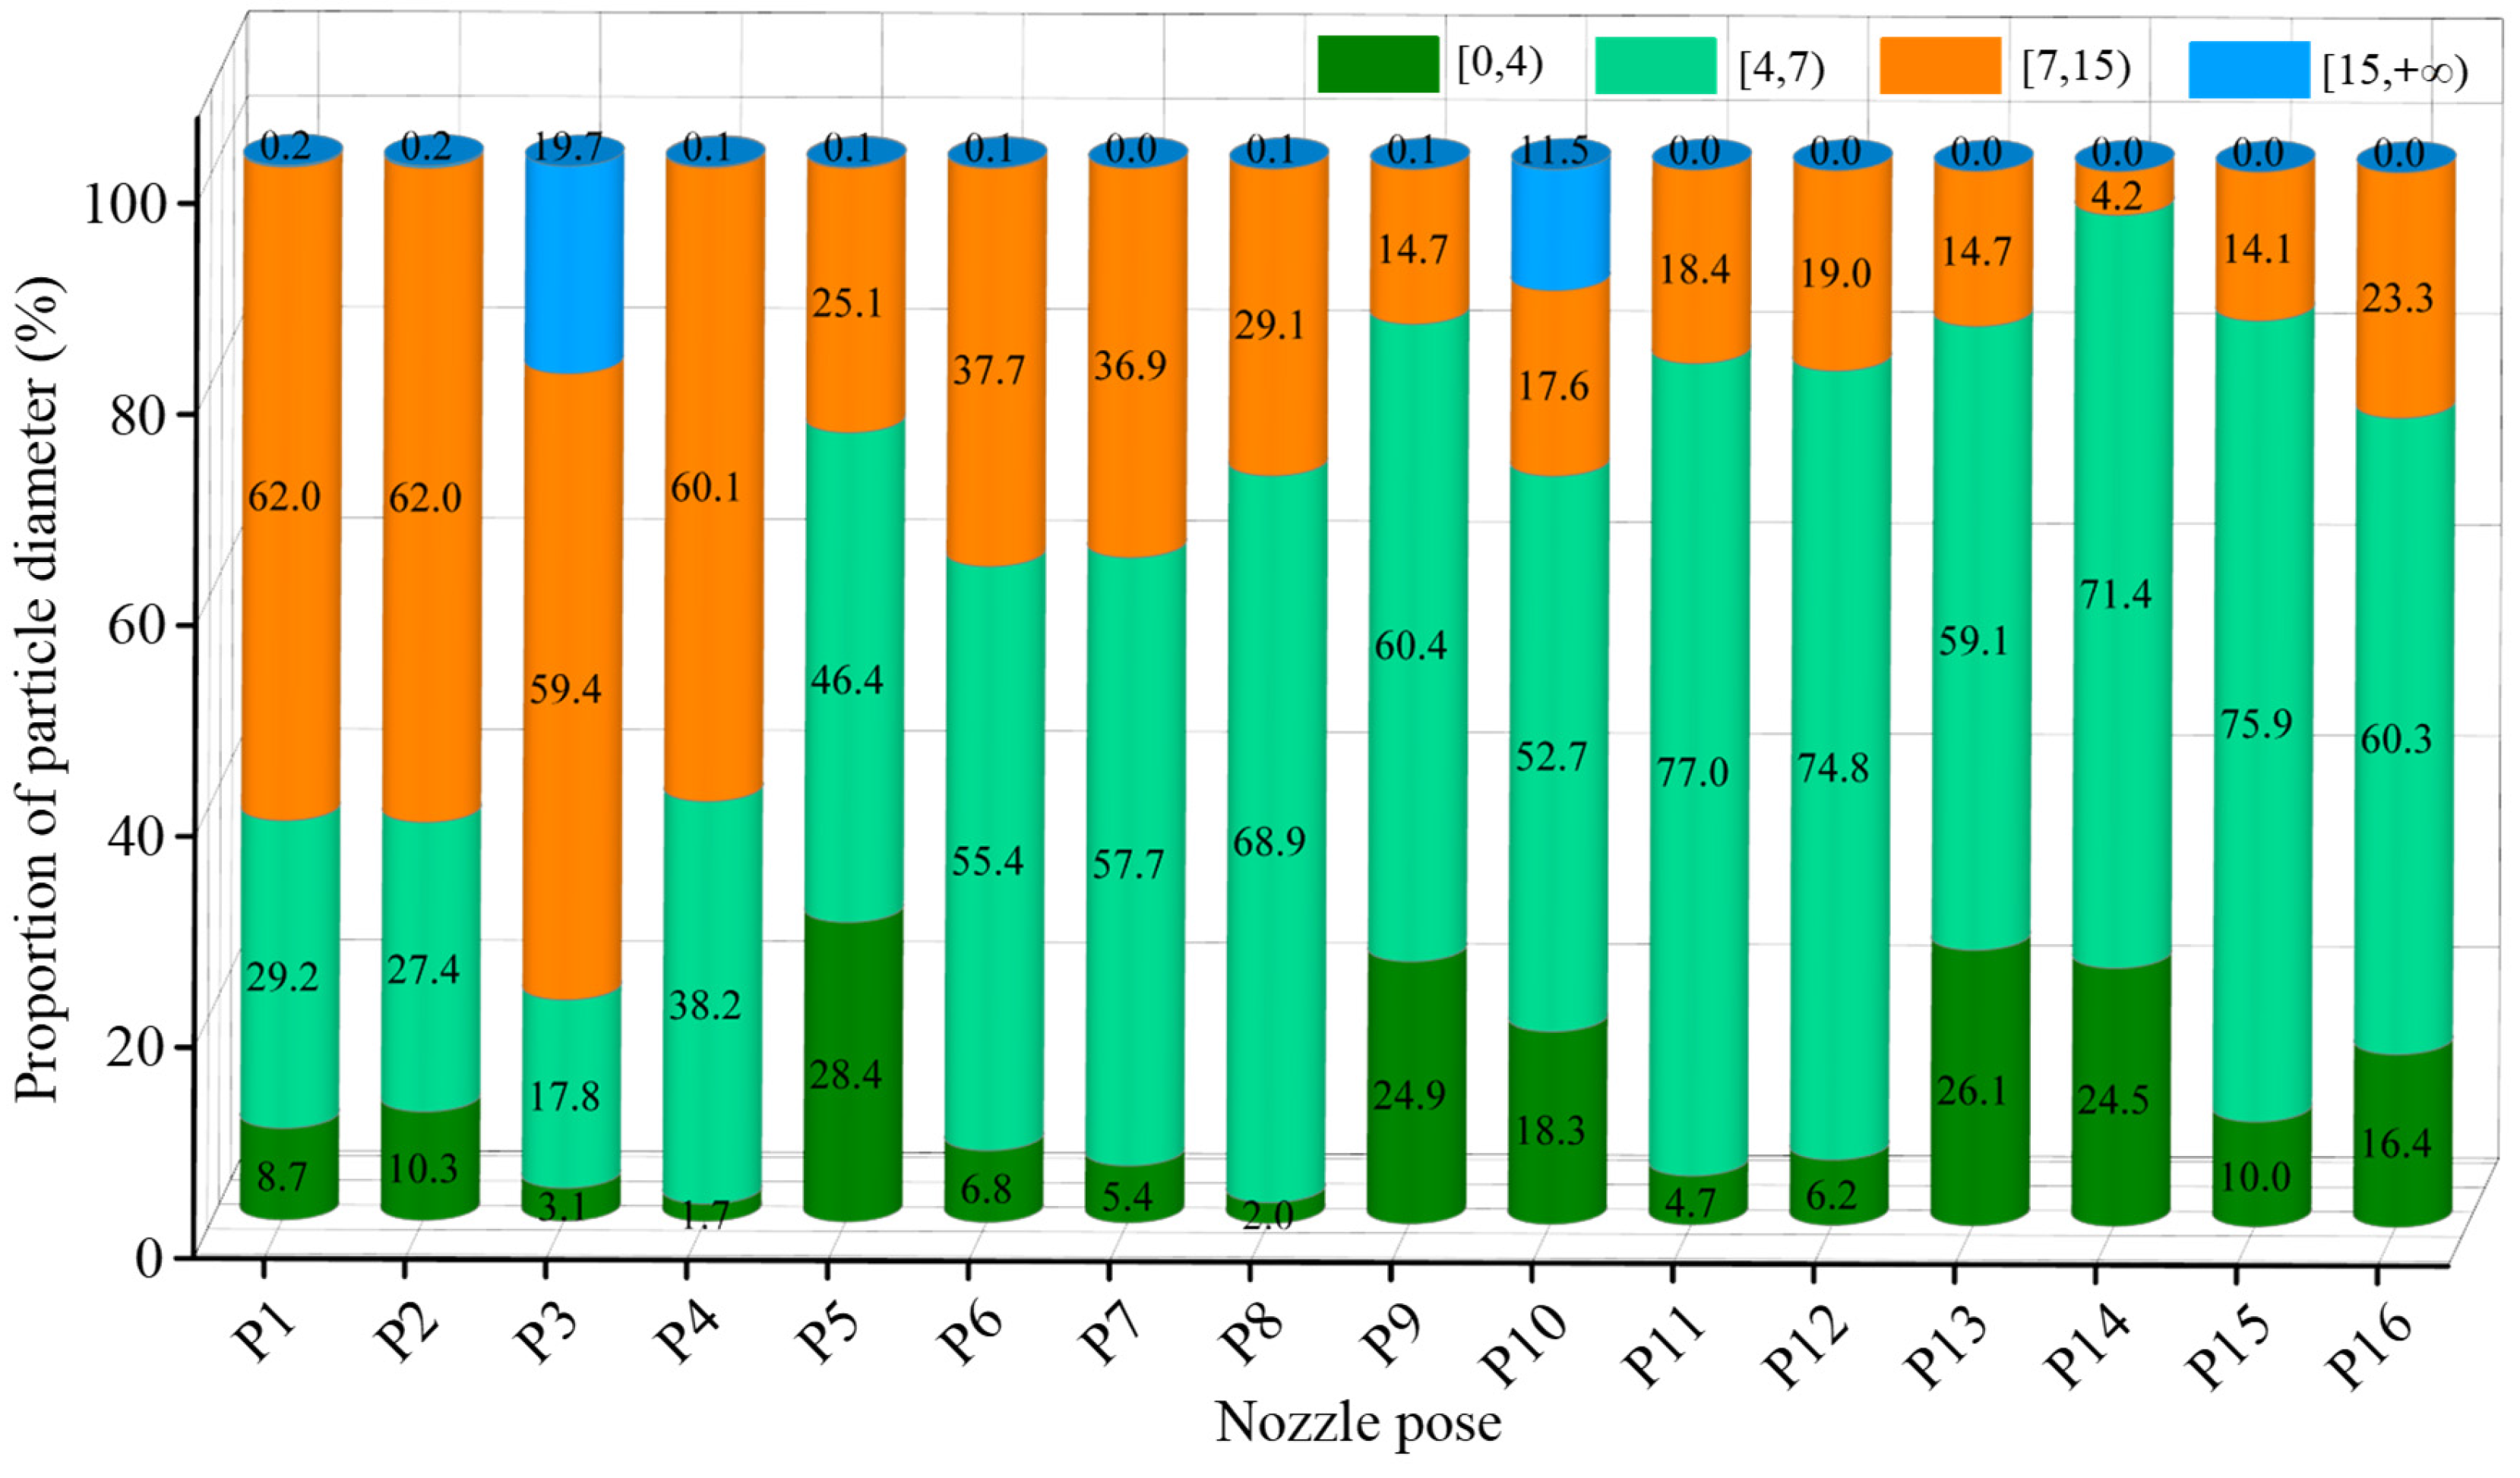
The particle distribution under different nozzle poses is shown in Figure 7. It could be observed from the figure that the aggregation degree of cutting fluid droplets varied significantly when the nozzle poses were different. The aggregation ability of nozzle poses P1, P5, and P16 was relatively weak, while the cutting fluid under other nozzle poses had a good aggregation ability. In terms of the distribution space of cutting fluid, it could be seen from the figure that the cutting fluid ejected from the nozzle mainly sprayed onto the tool surface, the workpiece surface, the chip surface, and the surrounding environment.
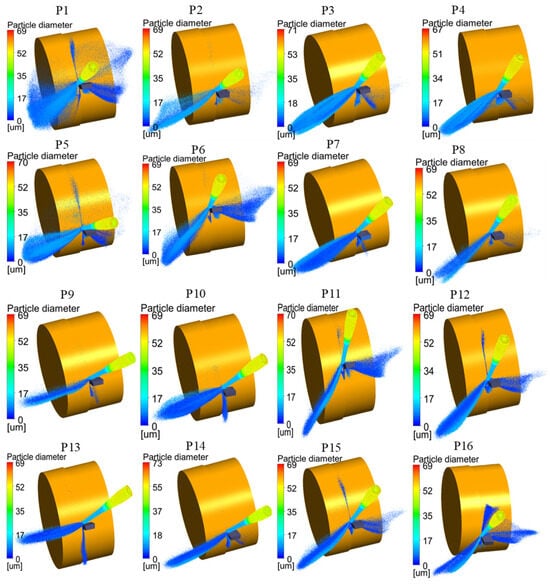
Figure 7.
Cutting fluid particle distribution under different nozzle pose parameters.
The lubrication and cooling effect of the cutting fluid is closely related to the number and particle size of the cutting fluid particles reaching the tool rake face. Through multiple trials, it was found that the MQL system entered a stable injection state after the simulation time steps reached 500 steps. Therefore, to conduct a quantitative analysis of cutting fluid particle characteristics under different nozzle poses, particle properties were sampled after the simulation time steps exceeded 500 steps, with a sampling interval of 10 steps.
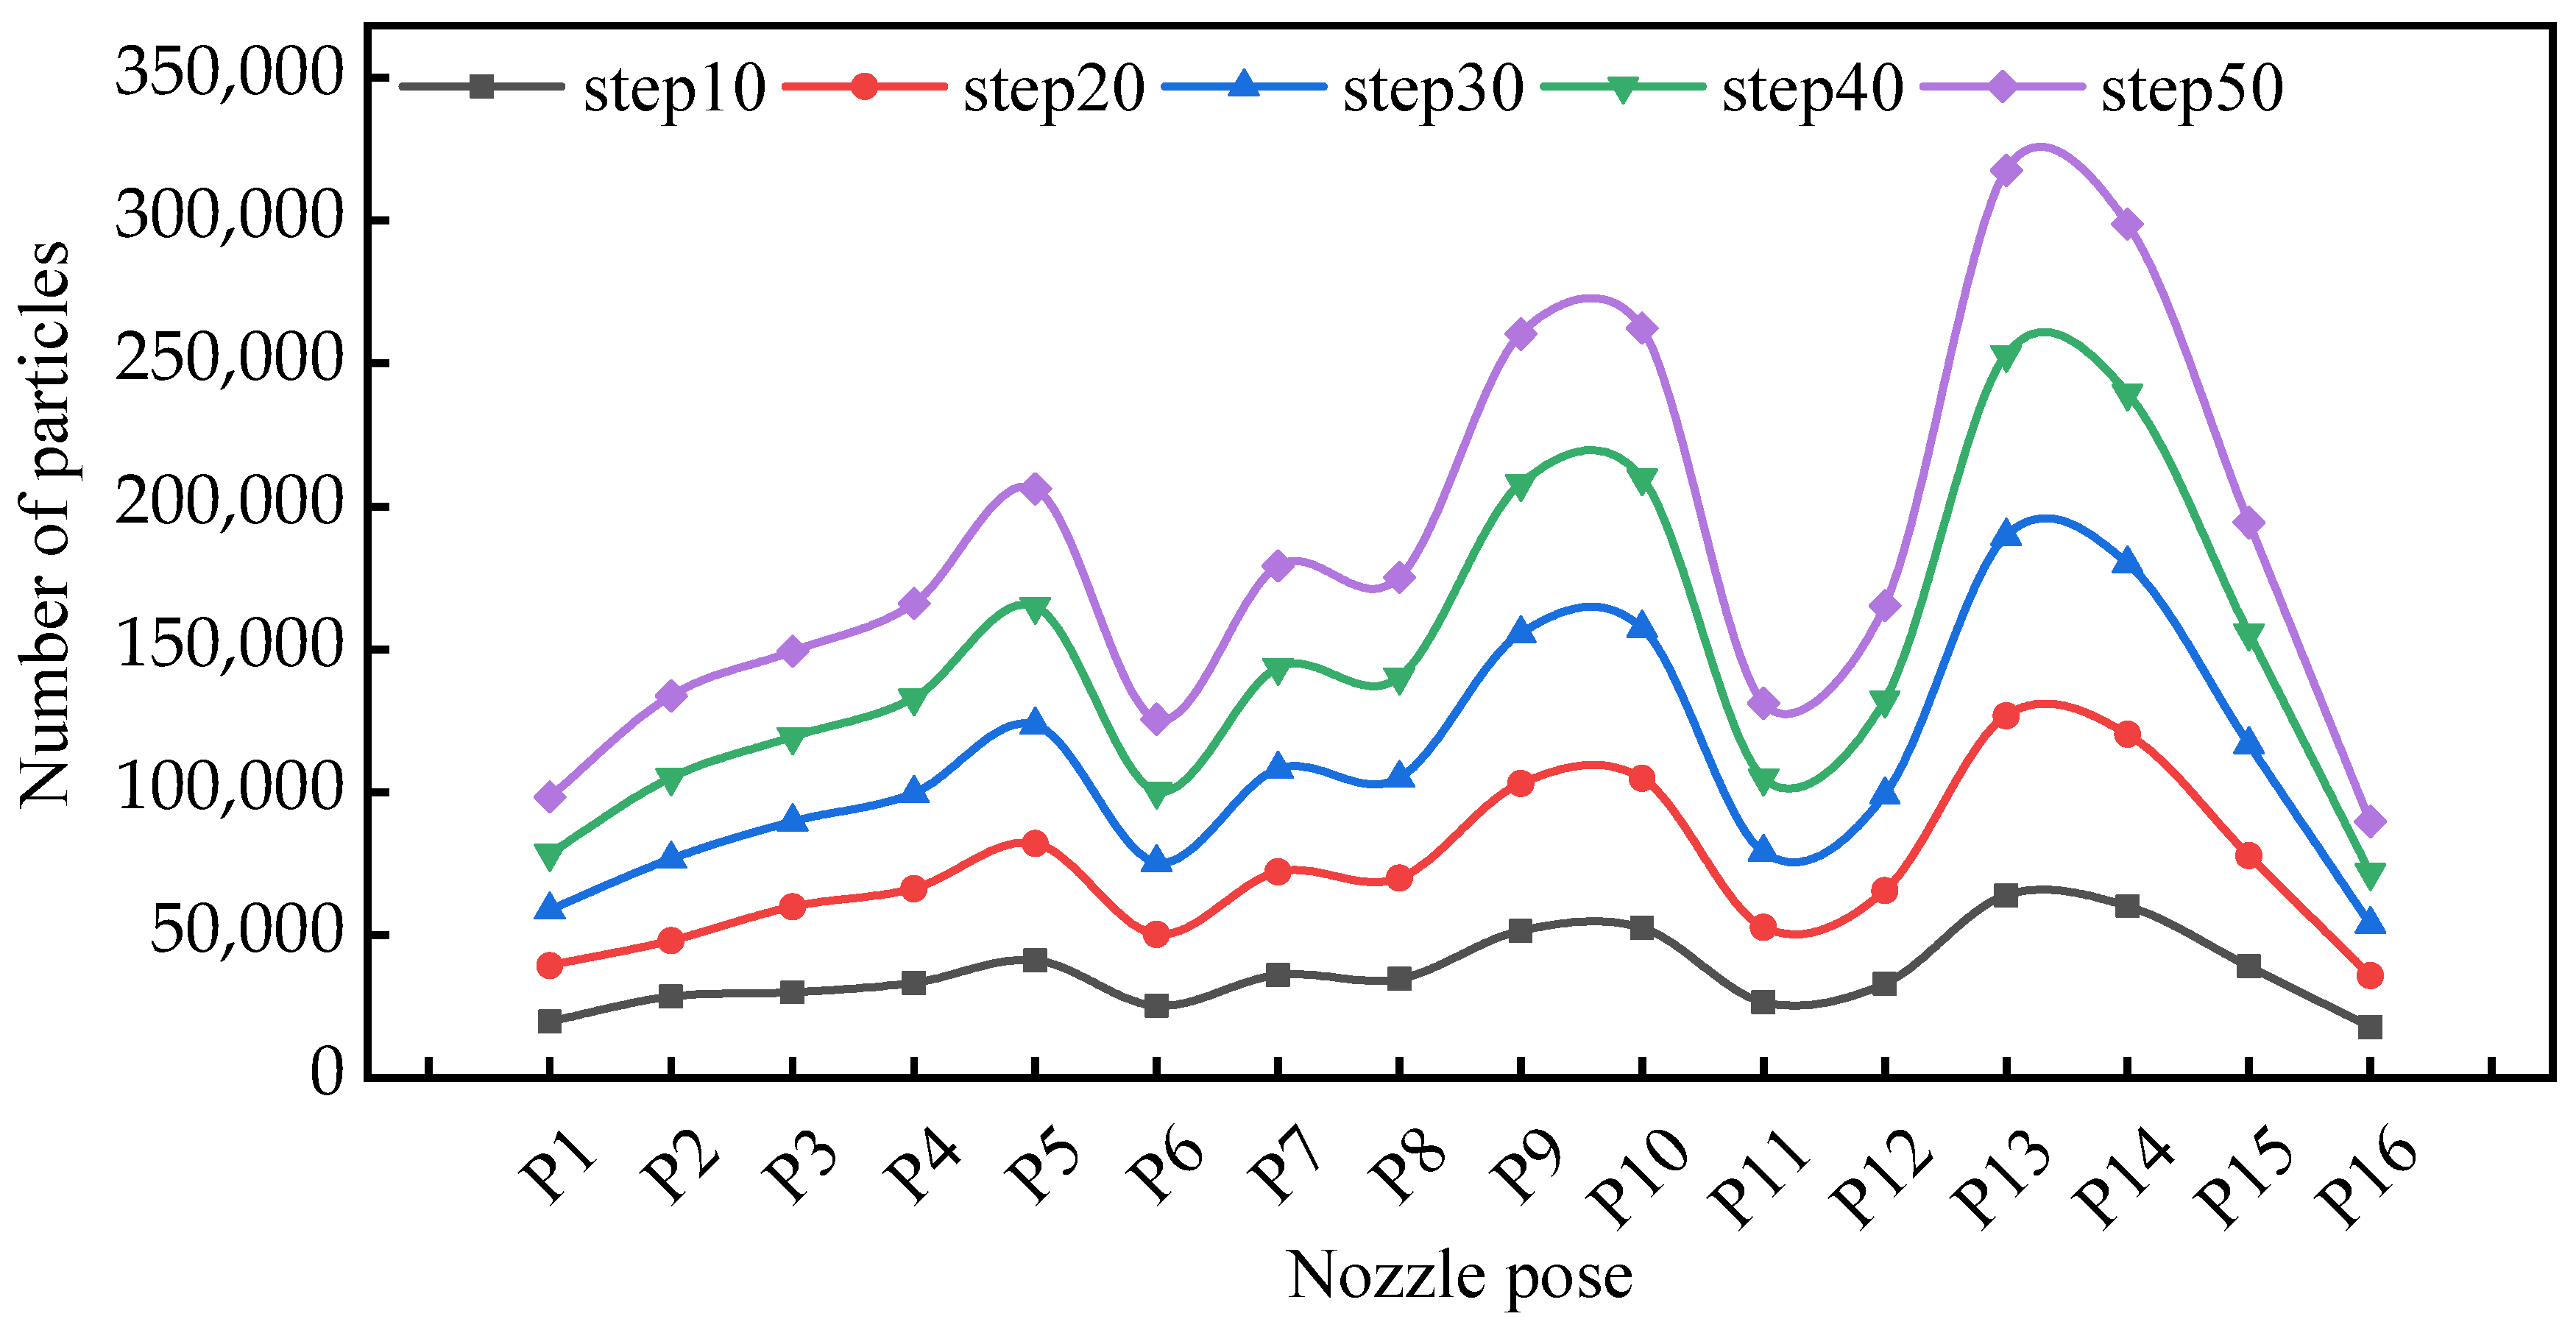
Figure 8 demonstrates the particle deposition density on the tool’s rake surface across varying nozzle pose parameters. Experimental data revealed substantial differences in lubricant particle accumulation across distinct nozzle poses under equivalent temporal conditions. Temporal progression analysis showed progressive increases in particle density on the rake surface within identical nozzle configurations. Notably, consistent temporal intervals produced nearly identical droplet deposition quantities regardless of nozzle positioning.
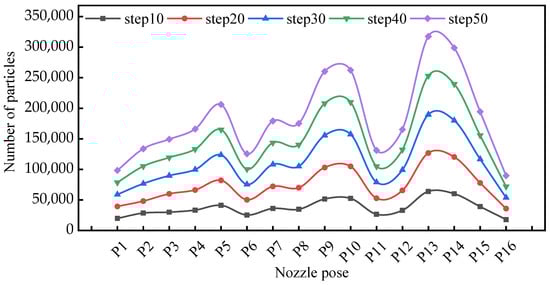
Figure 8.
Variation in the number of cutting fluid particles reaching the rake face under different nozzle pose parameters.
The proportions of the interval particle diameters of the rake face under different nozzle pose parameters are shown in Figure 9. As depicted in the diagram, in the case of nozzle pose P1, P2, P3, and P4, the proportion of particles with diameters in the range of 7–15 μm (medium-sized particles) obtained on the tool rake face was relatively high, all of which exceeded 50%. Under the action of other nozzle pose parameters, among the total number of cutting fluid particles obtained on the tool rake face, the total number of particles in the interval [4, 7) accounted for the highest proportion. According to Section 3.1, the medium-sized particles could more easily enter the tool–chip contact area. Therefore, it is necessary to calculate the number of medium-sized particles obtained on the tool rake face under different nozzle poses. By combining Figure 8 and Figure 9, the number of medium-sized particles on the tool rake face under different nozzle pose parameters were obtained (Table 4).
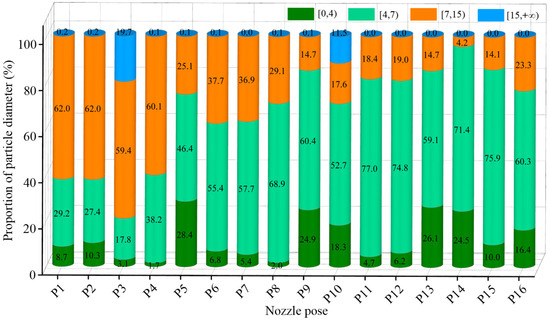
Figure 9.
Interval particle diameter proportions of rake face at different nozzle pose parameters.
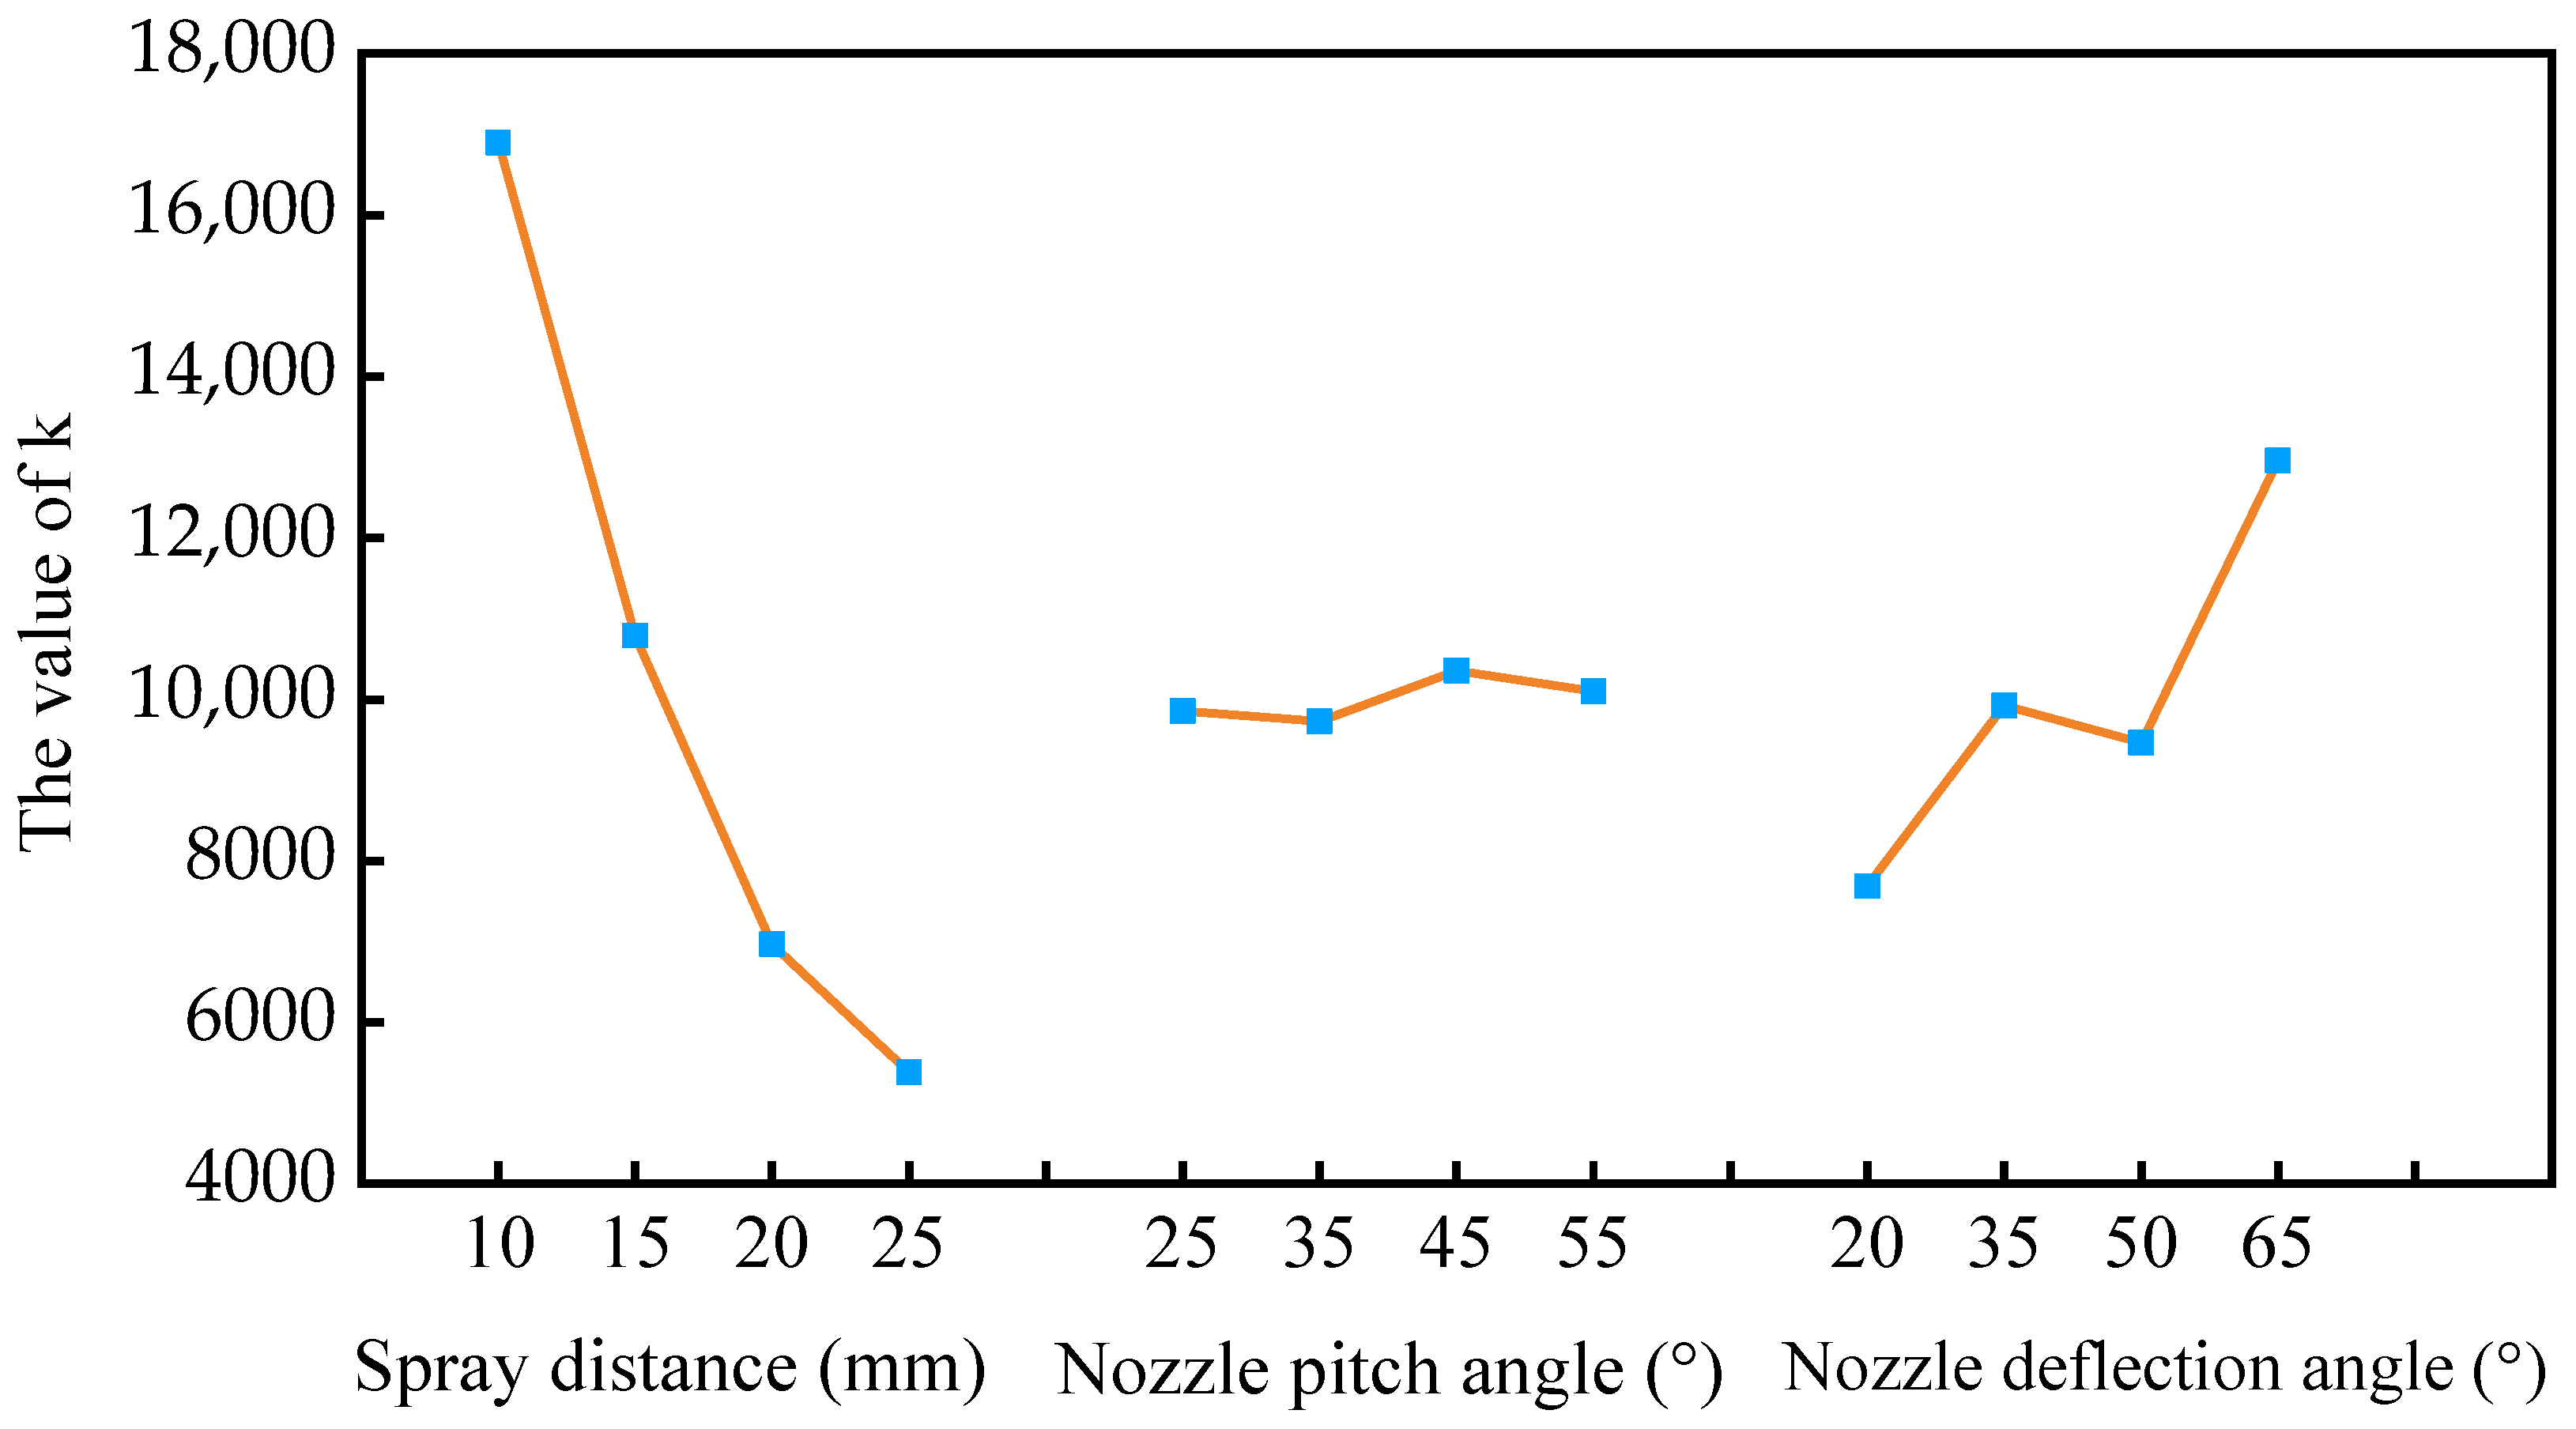
The nozzle pose parameters were used as influencing factors, and the number of medium-sized particles reaching the rake face of the tool was used as an evaluation index for range analysis to obtain the optimal nozzle pose parameters. The results of the range analysis are listed in Table 5. As demonstrated in Table 5, the greatest influence on the number of medium-sized particles of cutting fluid was the spray distance dn, followed by the nozzle deflection angle βn, and the nozzle pitch angle αn had the least influence. The optimal nozzle pose configuration was determined to be A1C4B3 based on the principle of maximizing the number of target medium-sized particles and combined with the variation trend of the target mean k under different levels of influencing factors (Figure 10). However, it is found that this configuration does not fall within the experimental scheme listed in Table 4. To determine whether configuration A1C4B3 is the optimal solution, experiments must be conducted on this configuration, and the results obtained should be compared with those of the relatively superior configuration A1C4B4 listed in Table 4. Statistical analysis revealed that configuration A1C4B3 produced 22,317 medium-sized particles on the tool rake face, whereas configuration A1C4B4 yielded 19,954 medium-sized particles; therefore, the number of medium-sized particles obtained by the A1C4B3 configuration was 11.8% more than that obtained by the A1C4B4 configuration. Consequently, the optimal nozzle pose configuration was confirmed as A1C4B3, corresponding to a spray distance of 10 mm, nozzle pitch angle of 45°, and nozzle deflection angle of 65°.
Table 5.
Range analysis of the number of medium-sized particle diameters on the rake face.
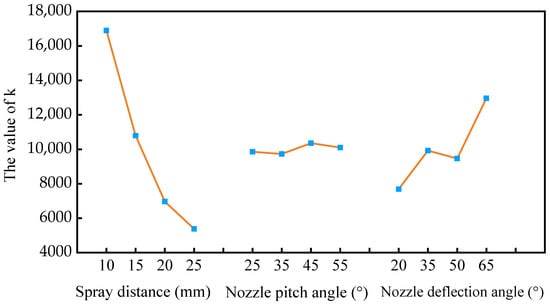
Figure 10.
Mean value main effect diagram of nozzle pose parameters.
3.3. FE and CFD Co-Simulation Method and Verification
3.3.1. FE and CFD Co-Simulation Method
A three-dimensional computational fluid dynamics (CFD) injection model was developed utilizing ANSYS FLUENT 2022 R1 software, incorporating optimized MQL parameters derived from Section 3.1 and Section 3.2. During material removal operations, thermal energy accumulation predominantly localizes near cutting edges, with thermal concentration zones aligned with primary cutting edges being dimensionally correlated with machining depth parameters [43]. Thermal mapping analysis identified elevated temperature regions matching these geometric constraints, subsequently designated as heat source zones. The heat transfer mode in the CFD model was conjugate heat transfer. Initial parametric specifications defined these zones with Lr = 1 mm and Wr = 0.1 mm. Geometric conversion of arcuate thermal zones to rectangular equivalents yielded an effective length approximation of 1.1 mm. Thus, a 0.11 mm2 region adjacent to cutting edges was computationally defined as the CFD thermal source domain, as illustrated in Figure 11. Then, the heat flux density extracted from FE simulation was applied to the heat source zone in the CFD model. During the setup of the CFD injection model, the energy equation was enabled to simulate heat transfer processes and the species transport model was activated, with cutting fluid particles simulated in droplet form. The addition of the species transport model activated the second law, introducing not only heating and cooling behaviors but also boiling and vaporization. The thermal equilibrium converted the heat changes in droplets into latent heat and convective heat transfer, which further translated into the heat changes in droplets and the continuous phase.
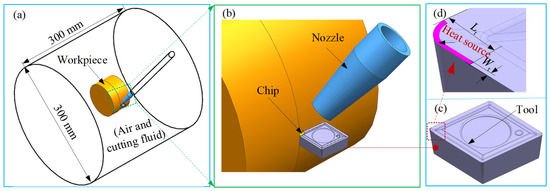
Figure 11.
CFD model of 3D MQL turning under heat source.
In addition, the friction coefficient is set as a constant value during the FE simulation process, which may affect the lubrication performance of the cutting tool and consequently influence the output results of both FE and CFD simulations. This is primarily because, in actual MQL machining experiments, the amount of cutting fluid entering the tool–chip contact region is dynamically changing, and the volume of cutting fluid directly impacts the cooling and lubrication effectiveness in this area. The remaining settings are referred to in Section 2.2. The coupled iterative process between FE and CFD is illustrated in Figure 12.
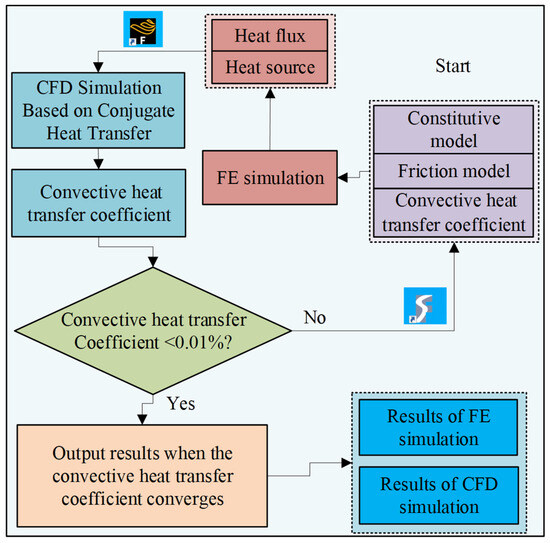
Figure 12.
Coupled iterative flow diagram of FE and CFD.
The DEFORM 11.0 software for FE simulation and the ANSYS FLUENT 2022 R1 software for CFD simulation were both installed on the same high-performance computing simulation platform purchased from Gentai Company. The hardware platform includes two Intel Xeon Scalable Gold series processors based on the SkylakeSP architecture, with each featuring 18 physical cores, a base frequency of 3.0 GHz, and 128 GB DDR4 Registered ECC memory. One unidirectional FE-CFD iteration took approximately 96 h.
3.3.2. Experimental Verification of FE and CFD Models
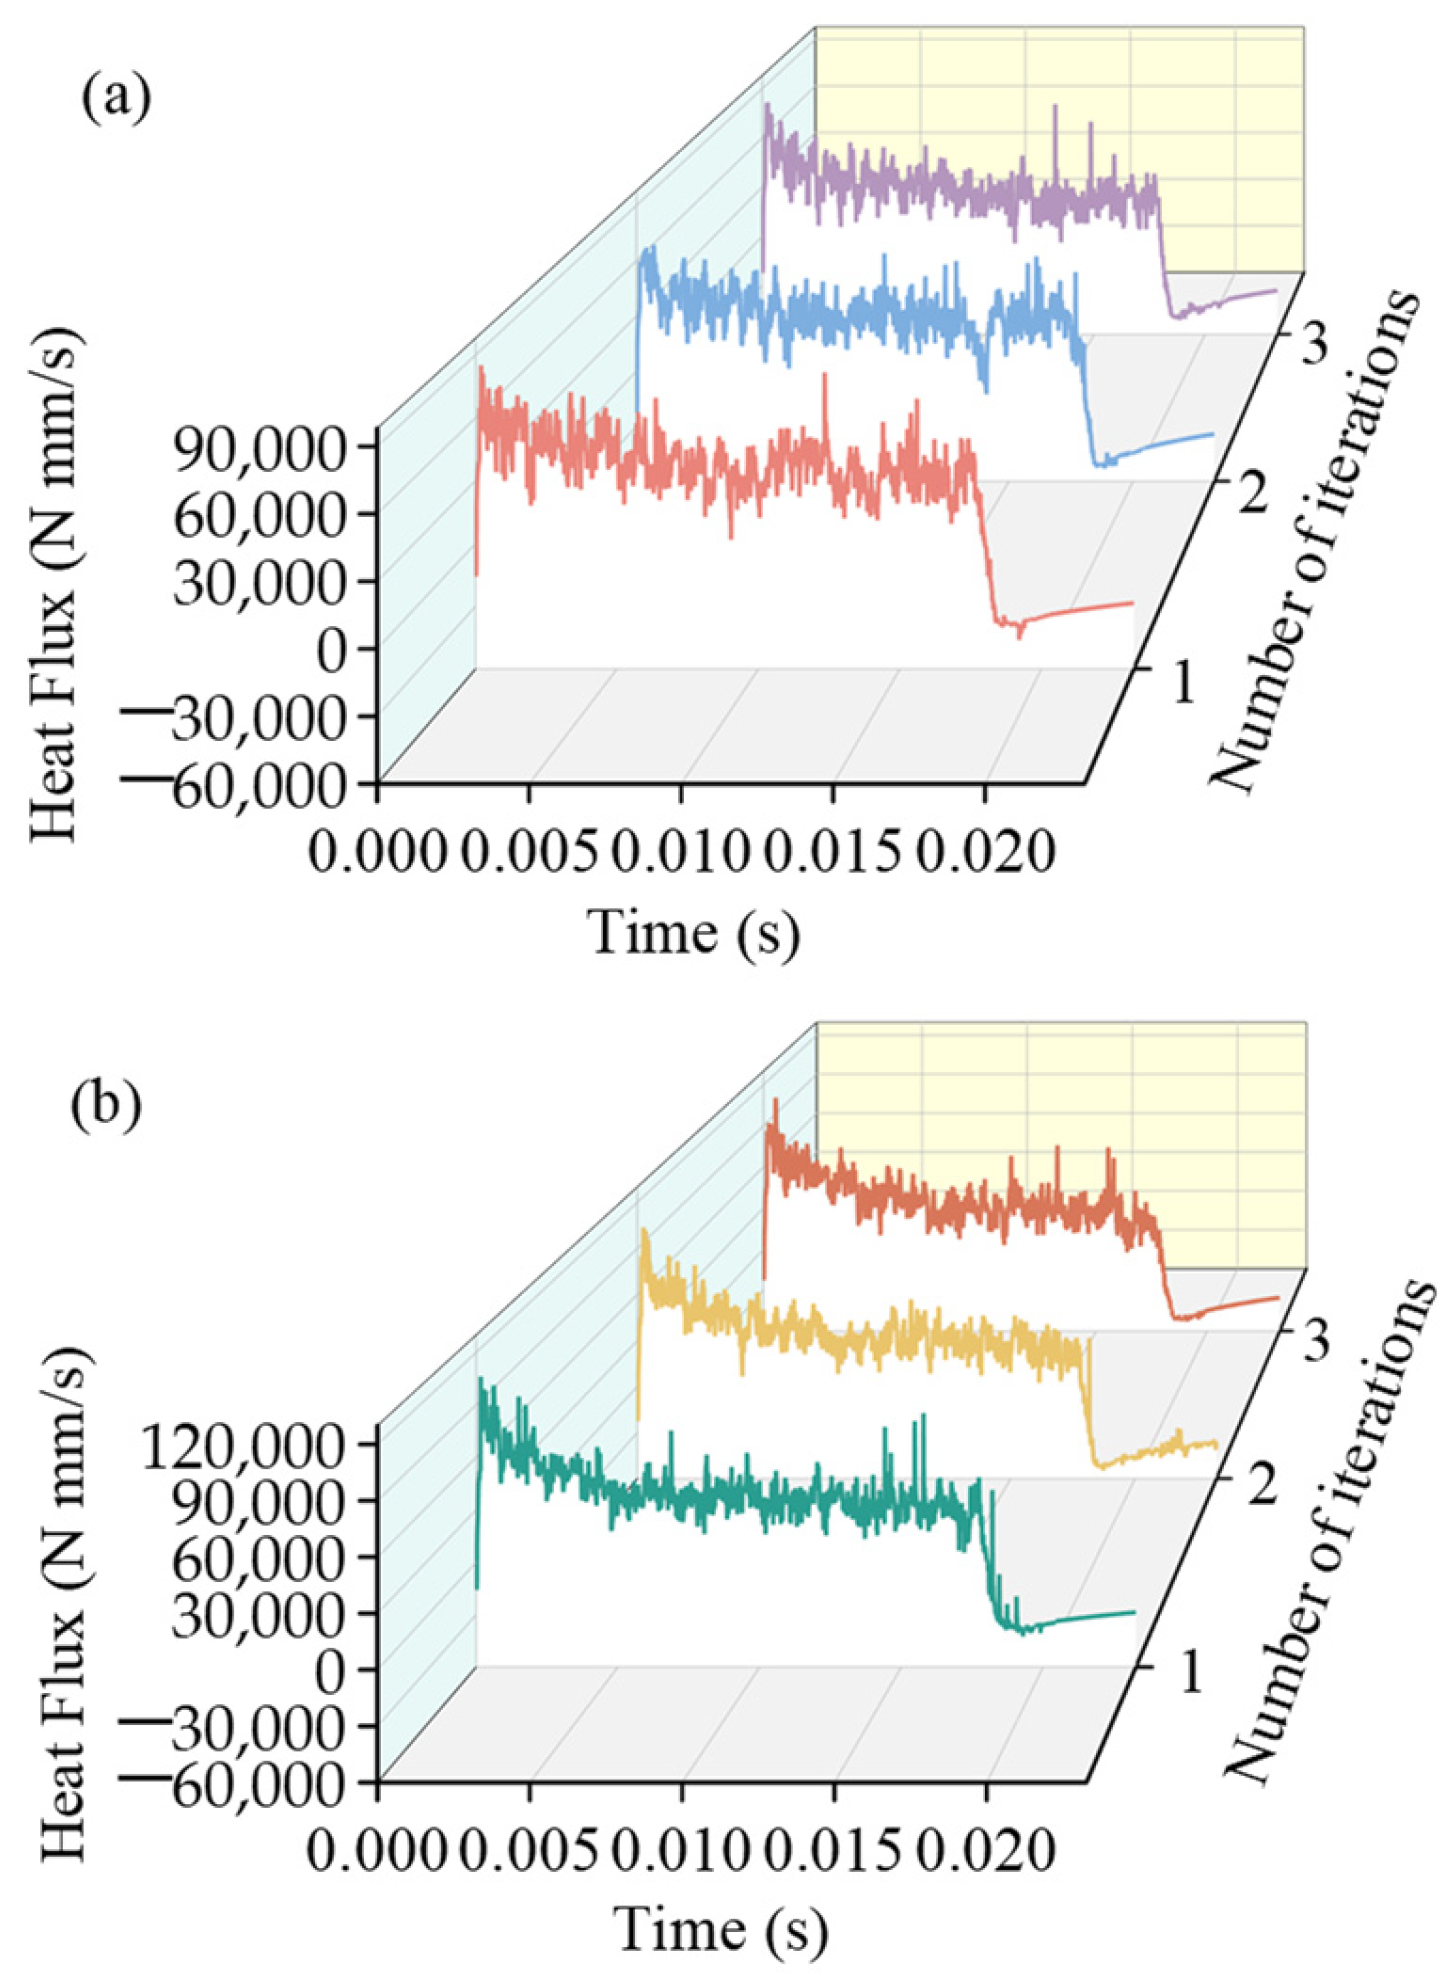
The heat flux obtained during the iteration process under different cutting parameters is presented in Figure 13. Their average values were assigned to the arc area of 0.11 mm2 near the tool tip, respectively, and then converted into the heat flux density on the surface heat source in the CFD model. After the CFD simulation was completed, the convection heat transfer coefficient h for the local heat transfer window in the FE cutting model during the first stage was calculated using the Fluent post-processing module. When the value of h was less than 0.01%, the convective heat transfer coefficient was considered to have achieved convergence; thus the FE-CFD loop was immediately terminated.

Figure 13.
The heat flux obtained during the iterative process at different feed rates: (a) 0.15 mm/rev, (b) 0.20 mm/rev.
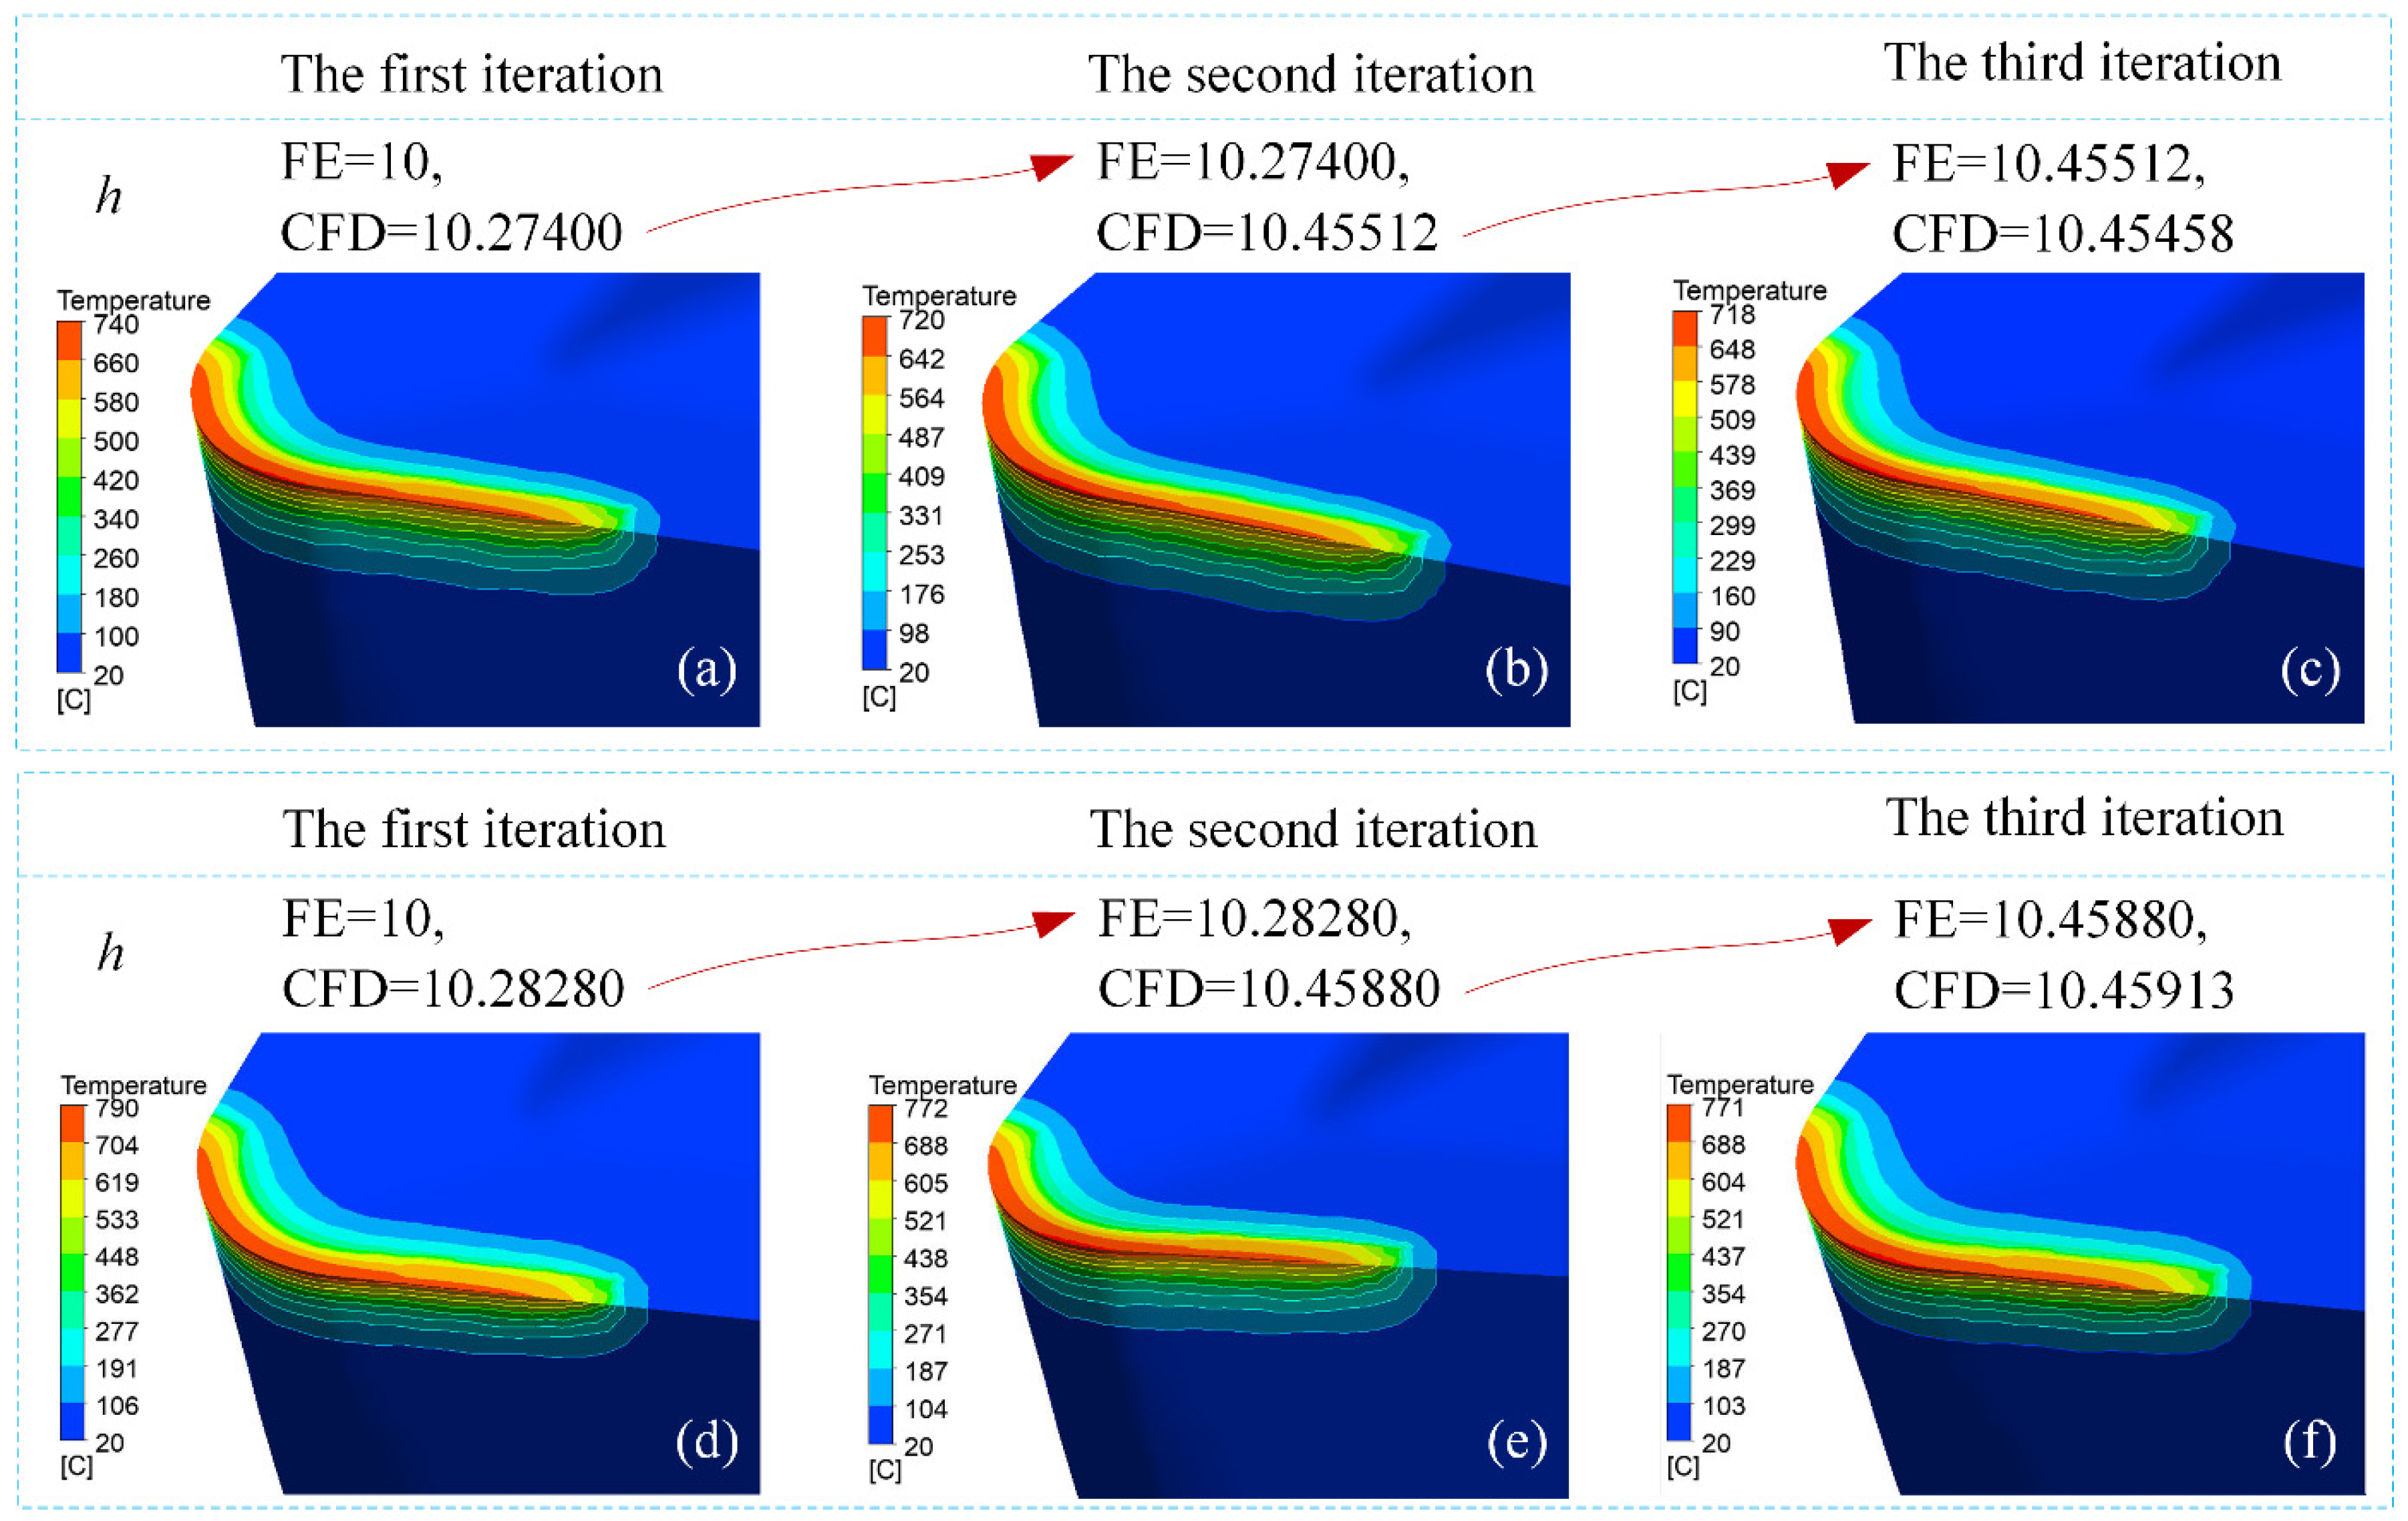
Figure 14 demonstrates the iterative evolution of convective heat transfer coefficients (h) derived from coupled FE–CFD simulations across varying feed rates. Analysis of Figure 14a–c reveals that during 0.15 mm/rev machining operations, after three computational cycles, both the FE model’s initial h parameter and its CFD–calculated counterparts converged to 10.455 kW/(m2·K), achieving numerical stabilization. The relative error between the two was approximately 0.005%, indicating that the convective heat transfer coefficient had converged at this stage. Furthermore, when the feed rate was 0.20 mm/rev (Figure 14d–f), during the third iteration, it was observed that both the h value inputted into the FE cutting model in the first stage and the h value calculated via the CFD model in the second stage stabilized around 10.45 kW/(m2·K). The minimal relative deviation of 0.003% between computational phases confirmed the numerical convergence of the convective heat transfer coefficient. These findings empirically validate the iterative co-simulation methodology’s capacity to achieve stabilized thermal exchange parameters through FE–CFD coupling.
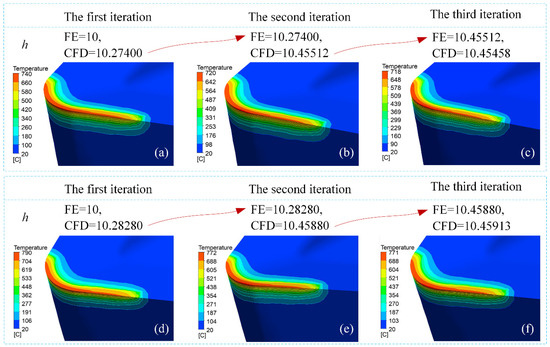
Figure 14.
Iterative evolution of temperature fields (°C) and convective heat transfer coefficients (kW/m2·K) at feed rates of 0.15 mm/rev (a–c) and 0.20 mm/rev (d–f). Subplots represent the results from the first, second, and third coupling cycles using DEFORM 3D and ANSYS Fluent.
To validate the credibility of CFD models, three repeated cutting experiments were conducted under the MQL environment. Considering the uncertainty of the experiment, the average value of the experimental results was taken as the final result. The peak cutting temperatures at different cutting parameters were collected and presented in Figure 15. According to Figure 15a–c, the average value of the peak cutting temperature produced at the feed rate of 0.15 mm/rev was calculated as 705.3 °C. Similarly, using the same method, the average peak cutting temperature produced at 0.20 mm/rev was determined as 759.8 °C according to Figure 15d–f. Iteration-derived thermal distributions from CFD computations are comparatively shown in Figure 14. For the 0.15 mm/rev feed condition (Figure 14a–c), third-cycle CFD predictions exhibited enhanced alignment with experimental temperature measurements compared to initial simulations, exhibiting an error reduction from 4.9% to 1.8%. Analogous error mitigation patterns emerged at 0.20 mm/rev (Figure 14d–f), where predictive accuracy improved from 4.0% to 1.5% through iterative refinement. Figure 14 further demonstrates the progressive error attenuation between numerical predictions and empirical data with increasing iteration counts, achieving computational stabilization post–third cycle.
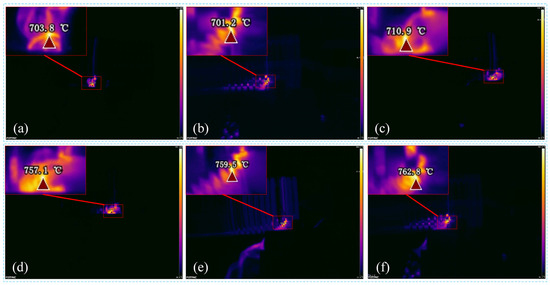
Figure 15.
The peak cutting temperatures obtained through three repetitive cutting experiments at feed rates of 0.15 mm/rev (a–c) and 0.20 mm/rev (d–f): (a,d) first experiment; (b,e) second experiment; (c,f) third experiment.
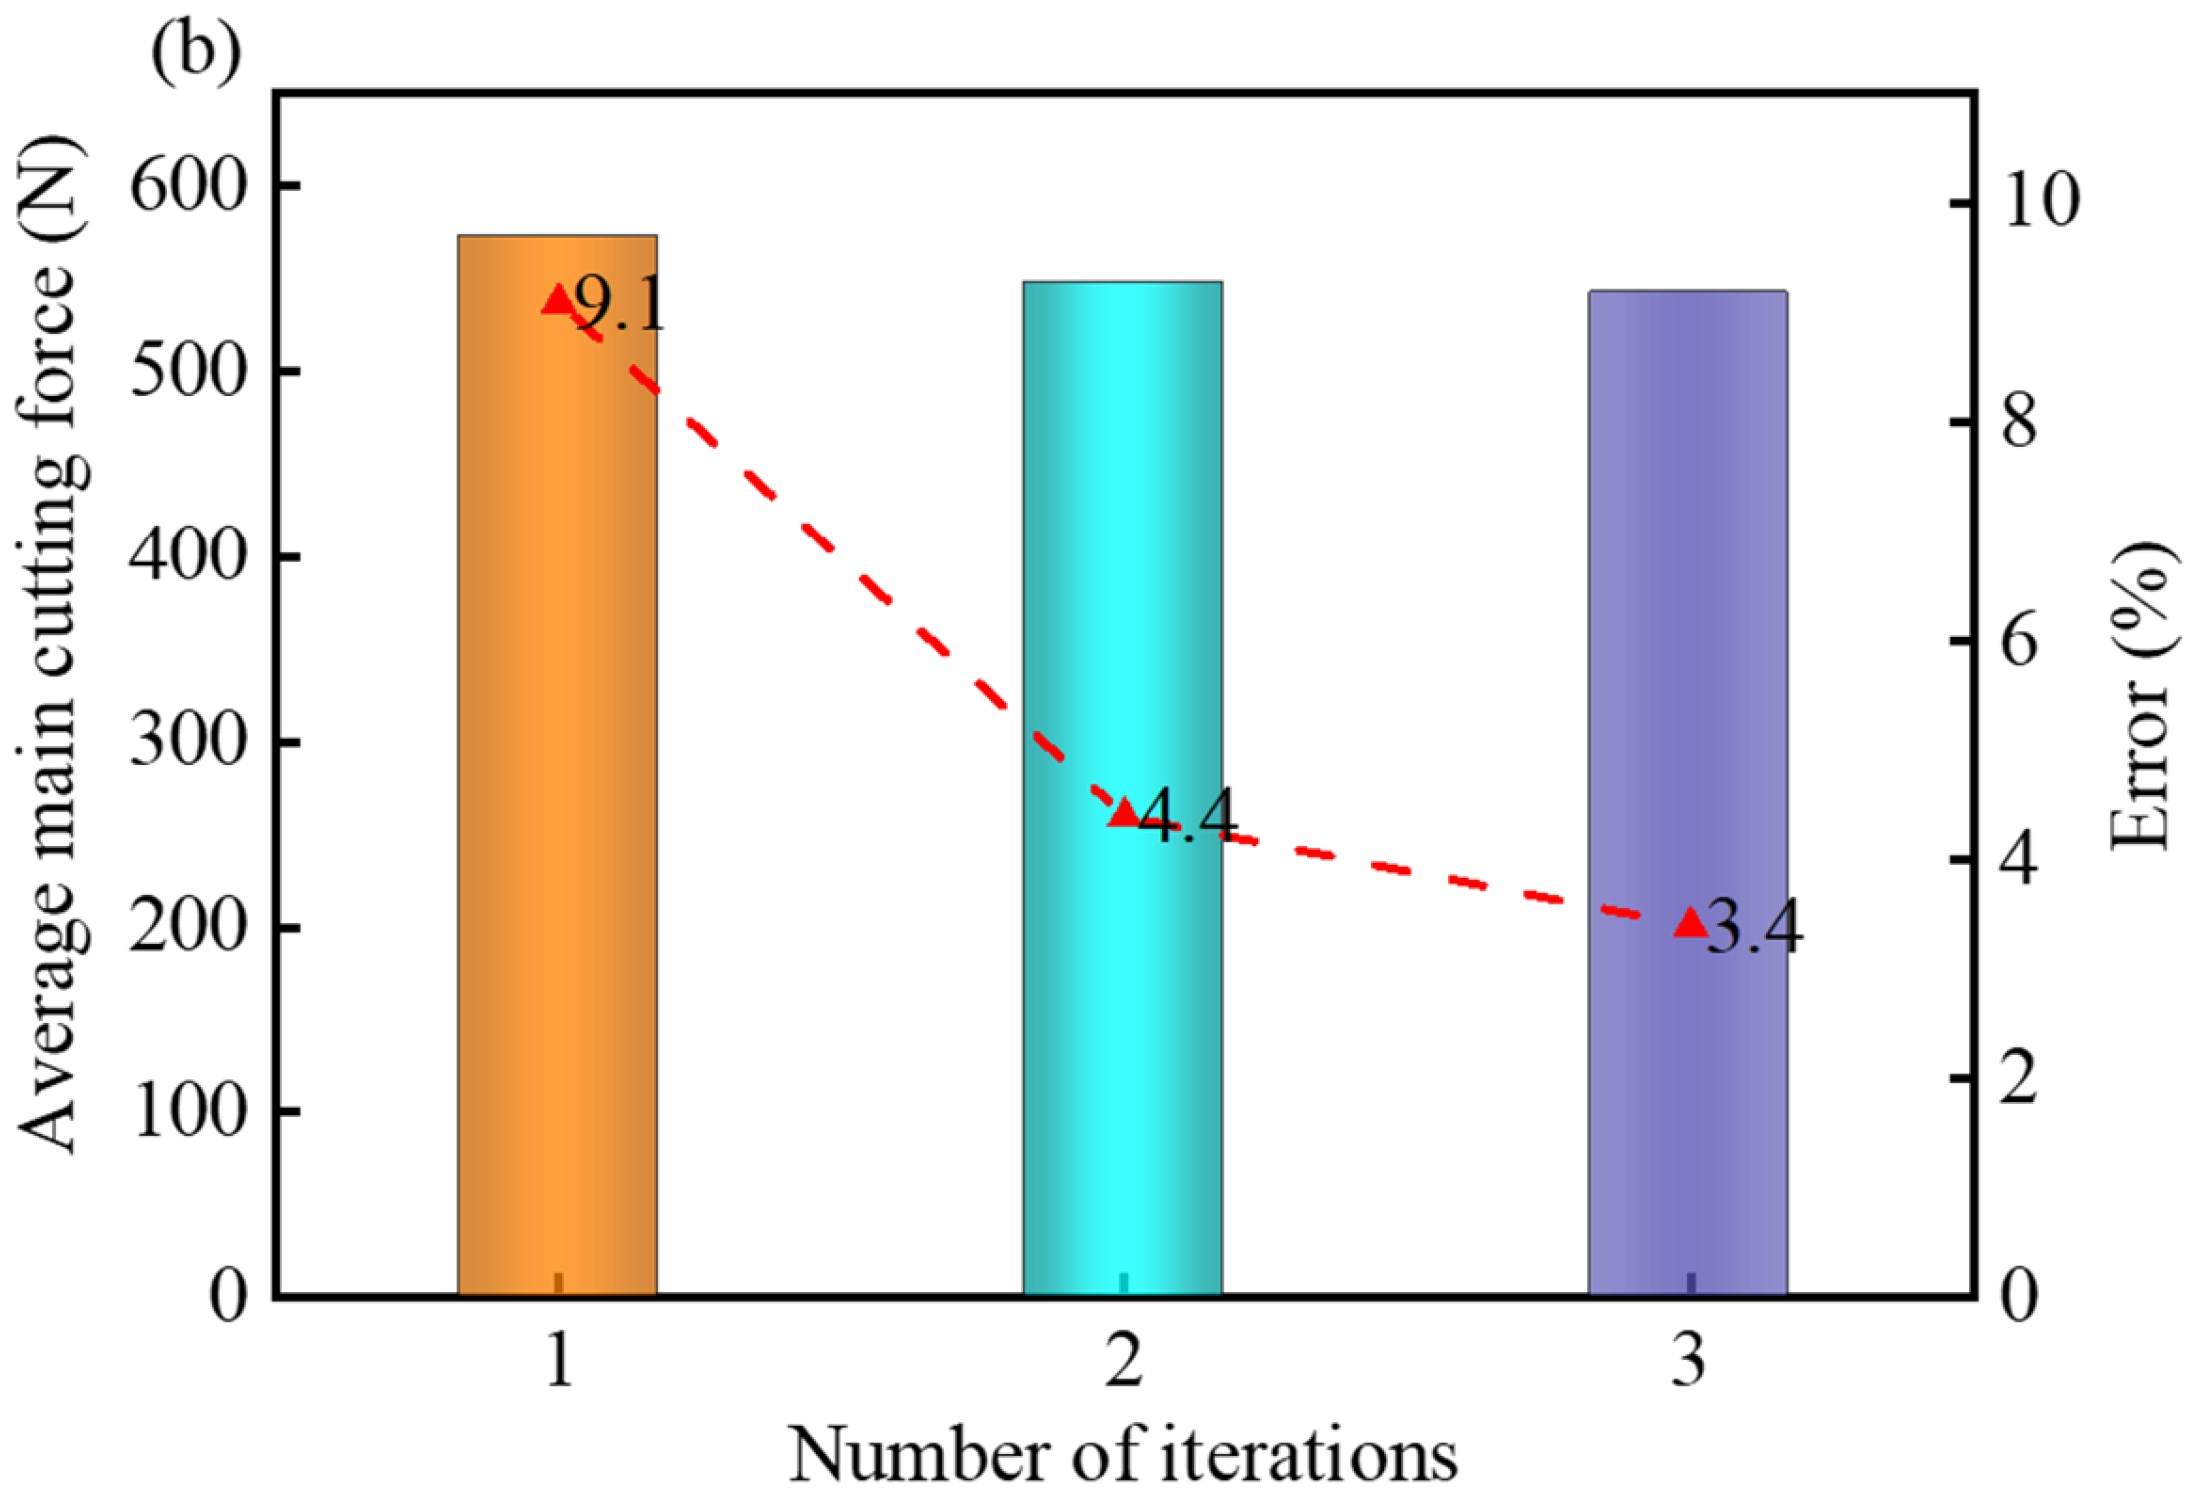
The average main cutting forces obtained from the FE model during the iteration process are shown in Figure 16. By comparing these values with the average main cutting forces produced in turning experiments in the MQL environment, it was observed that at the feed rate of 0.15 mm/rev, the third iteration results exhibited closer agreement with the experimental data compared to the first iteration, with the error reduced from 5.3% to 3.3% (Figure 16a). Similarly, at the feed rate of 0.2 mm/rev, the third iteration results demonstrated improved alignment with the experimental outcomes, where the error decreased from 9.1% to 3.4% (Figure 16b). It could be concluded from Figure 16 that the accuracy of the FE simulation outputs was significantly improved upon the convergence of the convective heat transfer coefficient.
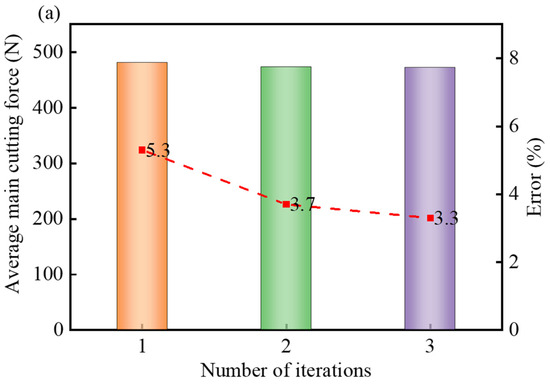
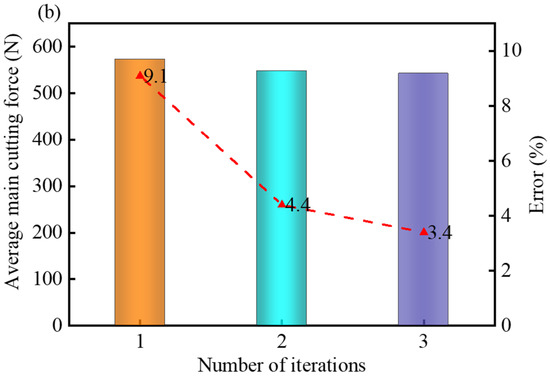
Figure 16.
Average main cutting force obtained from the FE model during the iterative process and the error with experimental cutting force at different feed rates: (a) 0.15 mm/rev; (b) 0.20 mm/rev.
Figure 14’s observations reveal the progressive elevation of peak cutting temperatures in FE-CFD co-simulations with increasing feed rates, demonstrating strong correlation with experimental thermal profiles and reinforcing methodological reliability. Similarly, Figure 16’s data exhibit proportional growth in simulated average principal cutting force magnitudes relative to feed rate increments, mirroring the empirical force trends observed during physical trials. These parallel validations across thermal and mechanical domains confirm the predictive capacity of the integrated FE-CFD framework.
4. Conclusions
To accurately simulate the MQL cutting process of Ti-6Al-4V alloy, this paper innovatively proposed a bidirectional iterative coupling method of FE and CFD under the optimal MQL parameters. The MQL parameters were first optimized using the CFD method. Based on the optimal MQL parameters, the stable convective heat transfer coefficient was obtained by the bidirectional iterative coupling method of FE and CFD. In the steady state, the cutting forces produced by the FE model in the first stage and the cutting temperatures derived from the CFD model in the second stage were, respectively, compared with the ones collected from corresponding turning experiments. The main conclusions obtained from this paper are presented as follows:
- Two-dimensional computational models and three-dimensional simulations were, respectively, employed to investigate MQL parameter effects on coolant flow dynamics, focusing on spray configurations and nozzle positioning. Elevated pressure levels were observed to correlate with reduced droplet dimensions and enhanced velocity magnitudes. Conversely, reduced lubricant supply rates were observed to achieve enhanced droplet kinematics, characterized by higher mean velocity magnitudes and reduced particle dimensions. Through the optimization of droplet transport velocity and mid-range droplet density at the tool’s rake interface, the following parameters were established as optimal: a 5 bar injection pressure, 50 mL/h coolant delivery rate, 10 mm spray distance, 45° nozzle inclination angle, and 65° nozzle orientation angle.
- The cutting forces produced in the turning process of Ti-6Al-4V alloy in the MQL condition were predicted accurately using the bidirectional iterative coupling method of FE and CFD, under the optimal MQL parameters. Under the stable convective heat transfer coefficient, the average main cutting forces obtained from the FE models agreed well with those produced in the turning experiments. In comparison to the results obtained from the FE model at the first iteration, the errors between the simulation and experiment under a stable state were reduced to 3.3% and 3.4% at the feed rates of 0.15 mm/rev and 0.20 mm/rev, respectively. The accurate prediction of cutting force proved the effectiveness of the bidirectional iterative coupling method of FE and CFD proposed in this paper.
- Thermal profiles produced during Ti-6Al-4V alloy turning under MQL conditions were effectively predicted through FE-CFD bidirectional iterative coupling with optimized MQL parameters. Upon the stabilization of thermal exchange coefficients, the CFD framework precisely replicated MQL-induced flow fields, enabling accurate thermal mapping. Experimental validation demonstrated strong alignment between CFD-predicted and empirically measured temperature maxima across varied cutting conditions. Predictive accuracy achieved deviations of 1.8% (0.15 mm/rev feed) and 1.5% (0.20 mm/rev feed) relative to experimental benchmarks, confirming the computational methodology’s robustness.
In the current research, the bidirectional iterative coupling method of FE and CFD was successfully used to simulate the turning process of Ti-6Al-4V alloy under the MQL environment. In future research, the method will continue to be effective by inputting the relevant characteristics of the material into the simulation process when the material changes. This method may also be applicable to other machining processes under MQL conditions, such as milling and drilling. In addition, this method will provide effective guidance for the optimal design of cutting tools with complex geometries under minimum quantity lubrication conditions, which is our intended focus for future work.
Author Contributions
X.Z.: Methodology, Software, Conceptualization, Writing—original draft. L.H.: Funding acquisition, Supervision. S.Y.: Funding acquisition, Investigation. H.J.: Investigation. J.D.: Formal analysis, Validation; F.D.: Reviewing and editing; J.Y. and Z.S.: Validation. All authors have read and agreed to the published version of the manuscript.
Funding
This work was financially supported by the Doctoral Research Startup Fund of Guiyang University (Grant No. GYU-KY-[2025]), National Natural Science Foundation of China (Grant No. 52265057), the Higher Education Engineering Research Center of Guizhou Province (Grant No. QJJ[2023]040), the Research on Mechanism Analysis of Cutting Chatter and Adaptive Control of Machining Stability for Thin walled Parts of Difficult-to-cut Materials (Grant No. 2023GCC033), and the National Natural Science Foundation of China (Grant No. 52365055).
Data Availability Statement
The data presented in this study are available on request from the corresponding author. The data are not publicly available due to restrictions on privacy.
Conflicts of Interest
The authors declare that they have no known competing financial interests or personal relationships that could have appeared to influence the work reported in this paper.
References
- Upadhyay, C.; Rajput, S.S.; Bera, S.; Ju, H.; Bhide, R.; Gangopadhyay, S. Influence of TiAlN coating thickness in dry machining of AISI 1045 steel using Finite Element simulation and experiments. Surf. Coatings Technol. 2024, 495, 131496. [Google Scholar] [CrossRef]
- Volke, P.; Saelzer, J.; Zabel, A.; Biermann, D. Influence of cutting tool coating on rake and flank face temperatures by operando pyrometric temperature measurement during orthogonal turning of AISI 316L. Wear 2025, 571, 205848. [Google Scholar] [CrossRef]
- Sirtuli, L.J.; Boing, D.; Bushlya, V.; Norgren, S. Study of initial notch wear during turning of stainless steel with CVD Al2O3/Ti(C,N) coated cemented carbide tools. Int. J. Refract. Met. Hard Mater. 2025, 129, 107116. [Google Scholar] [CrossRef]
- Bao, Y.; Deng, J.; Cao, S.; Sun, X.; Zhang, Z.; Tang, X. In-situ forming textured cutting tools based on electrohydrodynamic atomization and laser micro-cladding technology. Appl. Surf. Sci. 2024, 684, 161856. [Google Scholar] [CrossRef]
- Maldonado-Cortés, D.; Peña-Parás, L.; Rodríguez-Villalobos, M.; Castillo-Barraza, A.P.; Cruz-Olace, R. Increased performance in CNC drilling process through the application of laser surface texturing. Wear 2025, 570, 205937. [Google Scholar] [CrossRef]
- Yang, Y.; Pan, H.; Bai, Y.; Yao, Y. Adaptive diamond texturing of micro/nano-structured surfaces enabled by hybrid control of 2D tool position and cutting force. J. Mech. Work. Technol. 2025, 337, 118739. [Google Scholar] [CrossRef]
- Pimenov, D.Y.; da Silva, L.R.R.; Machado, A.R.; França, P.H.P.; Pintaude, G.; Unune, D.R.; Kuntoğlu, M.; Krolczyk, G.M. A comprehensive review of machinability of difficult-to-machine alloys with advanced lubricating and cooling techniques. Tribol. Int. 2024, 196, 109677. [Google Scholar] [CrossRef]
- Lindvall, R.; Gayubo, J.C.; Gutnichenko, O.; Auzenat, F.; M’SAoubi, R.; Bushlya, V. Performance and wear mechanisms of TiAlN-NbN coated cemented carbide in milling Ti6Al4V with different cooling and lubrication approaches. Wear 2025, 571, 205846. [Google Scholar] [CrossRef]
- Rauf, A.; Khan, M.A.; Jaffery, S.H.I.; Butt, S.I. Effects of machining parameters, ultrasonic vibrations and cooling conditions on cutting forces and tool wear in meso scale ultrasonic vibrations assisted end-milling (UVAEM) of Ti–6Al–4V under dry, flooded, MQL and cryogenic environments—A statistical analysis. J. Mater. Res. Technol. 2024, 30, 8287–8303. [Google Scholar] [CrossRef]
- Ali, S.H.; Yao, Y.; Wu, B.; Zhao, B.; Ding, W.; Jamil, M.; Khan, A.; Baig, A.; Liu, Q.; Xu, D. Recent developments in MQL machining of aeronautical materials: A comparative review. Chin. J. Aeronaut. 2024, 38, 102918. [Google Scholar] [CrossRef]
- Khatai, S.; Sahoo, A.K.; Kumar, R.; Panda, A. Sustainable hard machining under zirconia nano-cutting fluid: A step towards a green and cleaner manufacturing process. Measurement 2024, 242, 116087. [Google Scholar] [CrossRef]
- García-Martínez, E.; Miguel, V.; Martínez-Martínez, A. Economic analysis of eco-friendly lubrication strategies for the machining of Ti48Al2Cr2Nb aluminide. J. Clean. Prod. 2024, 435, 140541. [Google Scholar] [CrossRef]
- Zhang, Y.; Li, L.; Cui, X.; An, Q.; Xu, P.; Wang, W.; Jia, D.; Liu, M.; Dambatta, Y.S.; Li, C. Lubricant activity enhanced technologies for sustainable machining: Mechanisms and processability. Chin. J. Aeronaut. 2024, 38, 103203. [Google Scholar] [CrossRef]
- Revuru, R.S.; Sanjay, K.T.; Srinu, B.; Krishna, P.V. Evaluation of optimum process parameters based on specific cutting energy in turning for sustainability. Int. J. Adv. Manuf. Technol. 2025, 136, 4569–4579. [Google Scholar] [CrossRef]
- Srinivasarao, G.; Tarachand, V.; Nagaraja, T.K.; Hanumanthappa, H.; Kondalarao, D.; Usha, M. Experimental investigation of herbal based Al2O3 nano cutting fluids with minimum quantity lubrication in optimization of turning. Int. J. Interact. Des. Manuf. (IJIDeM) 2025, 1–13. [Google Scholar] [CrossRef]
- Aslantas, K.; Hasçelik, A.; Erçetin, A.; Danish, M.; Alatrushi, L.K.; Rubaiee, S.; Bin Mahfouz, A. Effect of cutting conditions on tool wear and wear mechanism in micro-milling of additively manufactured titanium alloy. Tribol. Int. 2024, 193, 109340. [Google Scholar] [CrossRef]
- Cönger, D.B.; Yapan, Y.F.; Emiroğlu, U.; Uysal, A.; Altan, E. Influence of singular and dual MQL nozzles on sustainable milling of Al6061-T651 in different machining environments. J. Manuf. Process. 2023, 109, 524–536. [Google Scholar] [CrossRef]
- Carvalho, S.D.; Horovistiz, A.; Davim, J. A hybrid numerical and experimental approach towards Ti6Al4V alloy sustainable orthogonal turning. J. Clean. Prod. 2024, 454, 142224. [Google Scholar] [CrossRef]
- Esmaeili, H.; Adibi, H.; Rizvi, R.; Rezaei, S.M. Coupled thermo-mechanical analysis and optimization of the grinding process for Inconel 718 superalloy using single grit approach. Tribol. Int. 2022, 171, 107530. [Google Scholar] [CrossRef]
- Rao, C.M.; Rao, S.S.; Herbert, M.A. An Experimental and Numerical Approach to Study the Performance of Modified Perforated Cutting Tools on Machining of Ti–6Al–4V Alloy. Arab. J. Sci. Eng. 2019, 45, 1191–1206. [Google Scholar] [CrossRef]
- Jamil, M.; He, N.; Zhao, W.; Gupta, M.K.; Khan, A.M. Novel approach of cutting temperature measurement in sustainable milling of Ti-6Al-4V alloy. Measurement 2023, 214, 112837. [Google Scholar] [CrossRef]
- Laakso, S.V.; Mallipeddi, D.; Krajnik, P. Evaluation of subcooled MQL in cBN hard turning of powder-based Cr-Mo-V tool steel using simulations and experiments. Int. J. Adv. Manuf. Technol. 2021, 118, 511–531. [Google Scholar] [CrossRef]
- Tu, J.; Yeoh, G.H.; Liu, C. Computational Fluid Dynamics: A Practical Approach; Butterworth-Heinemann: Oxford, UK, 2018. [Google Scholar]
- Du, F.; Zhou, T.; Tian, P.; Chen, J.; Zhou, X.; He, L.; Ren, A. Cutting performance and cutting fluid infiltration characteristics into tool-chip interface during MQL milling. Measurement 2023, 225, 113989. [Google Scholar] [CrossRef]
- Qiao, G.; Xiong, X.; Yang, J.; Zhen, D.; Zhang, F.; Wei, Y. Numerical and experimental analysis for the effect of oil mist flow characteristics on the penetration and lubrication performance in MQL milling. J. Manuf. Process. 2025, 134, 603–618. [Google Scholar] [CrossRef]
- Du, F.; He, L.; Zhou, T.; Tian, P.; Zou, Z.; Zhou, X. Analysis of droplet characteristics and cooling lubrication effects in MQL milling of 316L stainless steel. J. Mater. Res. Technol. 2022, 19, 4832–4856. [Google Scholar] [CrossRef]
- Singh, R.; Sharma, V. CFD based study of fluid flow and heat transfer effect for novel turning tool configured with internal cooling channel. J. Manuf. Process. 2022, 73, 164–176. [Google Scholar] [CrossRef]
- Pervaiz, S.; Deiab, I.; Wahba, E.; Rashid, A.; Nicolescu, C.M. A novel numerical modeling approach to determine the temperature distribution in the cutting tool using conjugate heat transfer (CHT) analysis. Int. J. Adv. Manuf. Technol. 2015, 80, 1039–1047. [Google Scholar] [CrossRef]
- Salame, C.; Bejjani, R. A better understanding of the cryogenic environment and the effect of nozzle location on the machinability of low carbon steel. J. Manuf. Process. 2022, 74, 544–556. [Google Scholar] [CrossRef]
- Hegab, H.; Kishawy, H.A.; Umer, U.; Mohany, A. A model for machining with nano-additives based minimum quantity lubrication. Int. J. Adv. Manuf. Technol. 2019, 102, 2013–2028. [Google Scholar] [CrossRef]
- Nouzil, I.; Eltaggaz, A.; Deiab, I.; Pervaiz, S. Numerical CFD-FEM model for machining titanium Ti-6Al-4V with nano minimum quantity lubrication: A step towards digital twin. J. Mech. Work. Technol. 2023, 312, 117867. [Google Scholar] [CrossRef]
- Shi, B.; Elsayed, A.; Damir, A.; Attia, H.; M’SAoubi, R. A Hybrid Modeling Approach for Characterization and Simulation of Cryogenic Machining of Ti–6Al–4V Alloy. J. Manuf. Sci. Eng. 2019, 141, 021021. [Google Scholar] [CrossRef]
- Xu, X.; Outeiro, J.; Zhang, J.; Xu, B.; Zhao, W.; Astakhov, V. Machining simulation of Ti6Al4V using coupled Eulerian-Lagrangian approach and a constitutive model considering the state of stress. Simul. Model. Pr. Theory 2021, 110, 102312. [Google Scholar] [CrossRef]
- Xu, X.; Zhang, J.; Outeiro, J.; Xu, B.; Zhao, W. Multiscale simulation of grain refinement induced by dynamic recrystallization of Ti6Al4V alloy during high speed machining. J. Mech. Work. Technol. 2020, 286, 116816–116834. [Google Scholar] [CrossRef]
- Liang, X.; Liu, Z.; Wang, B.; Wang, C.; Cheung, C.F. Friction behaviors in the metal cutting process: State of the art and future perspectives. Int. J. Extreme Manuf. 2022, 5, 012002. [Google Scholar] [CrossRef]
- Johnson, G.R.; Cook, W.H. A constitutive model and data for metals subjected to large strains, high strain rates and high temperatures. Proc. Seventh Int. Symp. Ballistic. 1983, 21, 541–547. [Google Scholar]
- Cockcroft, M.G.; Latham, D. Ductility Work. Metals 1968, 96, 33–39. [Google Scholar]
- El-Bouri, W.; Deiab, I.; Khanafer, K.; Wahba, E. Numerical and experimental analysis of turbulent flow and heat transfer of minimum quantity lubrication in a turning process using discrete phase model. Int. Commun. Heat Mass Transf. 2019, 104, 23–32. [Google Scholar] [CrossRef]
- Jadhav, P.; Deivanathan, R. Numerical modelling and experimental study of MQL spray parameters in machining of Ti-6Al-4V. Int. J. Interact. Des. Manuf. (IJIDeM) 2023, 18, 3247–3258. [Google Scholar] [CrossRef]
- Maruda, R.W.; Krolczyk, G.M.; Feldshtein, E.; Pusavec, F.; Szydlowski, M.; Legutko, S.; Sobczak-Kupiec, A. A study on droplets sizes, their distribution and heat exchange for minimum quantity cooling lubrication (MQCL). Int. J. Mach. Tools Manuf. 2016, 100, 81–92. [Google Scholar] [CrossRef]
- Maruda, R.W.; Krolczyk, G.M.; Feldshtein, E.; Nieslony, P.; Tyliszczak, B.; Pusavec, F. Tool wear characterizations in finish turning of AISI 1045 carbon steel for MQCL conditions. Wear 2017, 372–373, 54–67. [Google Scholar] [CrossRef]
- Dixit, U.S.; Kant, R. Simulations for Design and Manufacturing; Springer: Singapore, 2018. [Google Scholar]
- Peng, R.; Jiang, H.; Tang, X.; Huang, X.; Xu, Y.; Hu, Y. Design and performance of an internal-cooling turning tool with micro-channel structures. J. Manuf. Process. 2019, 45, 690–701. [Google Scholar] [CrossRef]


Disclaimer/Publisher’s Note: The statements, opinions and data contained in all publications are solely those of the individual author(s) and contributor(s) and not of MDPI and/or the editor(s). MDPI and/or the editor(s) disclaim responsibility for any injury to people or property resulting from any ideas, methods, instructions or products referred to in the content. |
© 2025 by the authors. Licensee MDPI, Basel, Switzerland. This article is an open access article distributed under the terms and conditions of the Creative Commons Attribution (CC BY) license (https://creativecommons.org/licenses/by/4.0/).