Article

A New Framework for Identifying the Wear States of Ball Screws Based on Surface Profile Characterization and Machine Learning

Department of Mechanical Engineering, Nanjing University of Science and Technology, Nanjing 210094, China
*
Author to whom correspondence should be addressed.
Lubricants 2025, 13(11), 476; https://doi.org/10.3390/lubricants13110476
Submission received: 19 September 2025 / Revised: 23 October 2025 / Accepted: 25 October 2025 / Published: 28 October 2025
(This article belongs to the Special Issue Intelligent Algorithms for Triboinformatics)

Abstract

Wear inevitably occurs in ball screw assemblies after long-term operation, leading to a decline in transmission performance and machining accuracy. Therefore, the accurate identification of wear states is crucial. In this study, we propose a wear state identification method based on the surface profile of the ball screw. This method effectively overcomes the limitations of traditional experimental approaches that require frequent disassembly of the ball screw or rely on vibration and current signals, which are prone to external interference. Surface profile data covering the entire service life of the screw were obtained through performance degradation experiments. A hybrid feature set was constructed by extracting parameters such as roughness, peak-to-valley height, root mean square, recurrence rate, and fractal characteristics, and classification was performed using a genetic-algorithm-optimized support vector machine (GA-SVM). The experimental results demonstrate that the proposed method can accurately characterize wear evolution, achieving an average identification accuracy of 98.48% while maintaining robustness and effectively avoiding interference from extraneous signals.

1. Introduction

The ball screw assembly is a high-precision transmission mechanism that converts rotational motion into linear motion. Due to its high positioning accuracy and excellent load-carrying performance, it has been widely used in the feed systems of CNC machine tools [1,2,3]. Wear caused by long-term operation leads to the degradation of transmission performance, thereby affecting machining quality and the reliability of the machine tool. Therefore, accurate identification of the wear state of ball screw assemblies is crucial for ensuring machining accuracy and improving equipment utilization.
In most applications, a certain preload is applied to the ball screw assembly to enhance transmission stiffness and eliminate axial clearance. Consequently, the degradation of the preload can serve as an important indicator of the wear state. Feng et al. [4] designed a mechanism that evaluates and adjusts the preload using a compressed disk spring. Frey et al. [5] measured the preload of a double-nut ball screw using three high-stiffness piezoelectric sensors uniformly distributed between the two nuts. Denkena et al. [6] proposed a sensor fusion method based on principal component analysis for monitoring the preload loss of single-nut ball screws. Some researchers have further investigated preload degradation based on friction torque measurements [7,8,9]. However, such methods typically require frequent disassembly of the screw or the use of embedded sensors, which may affect the system’s stiffness and accuracy, thereby limiting their practical application.
To avoid structural interference, recent studies have gradually shifted toward identifying ball screw wear based on signal features. For example, Zhao et al. [10] extracted features from velocity and torque signals, showing that the LE-MD method can effectively distinguish different wear states; Garinei et al. [11] used hall sensors and digital cameras to identify wear via signal extrema; and Yuan et al. [12] combined fuzzy entropy, time-domain features, and manifold distance for health assessment.
The above researchers primarily used traditional signal processing methods to identify the wear state of ball screw assemblies. In recent years, machine learning and neural network models have been widely applied for the fault diagnosis and state identification of ball screws due to their autonomy, fast response, and high accuracy. Me [13] collected current signals during the wear process and extracted features to identify wear states using a support vector machine; Wang et al. [14] used vibration signals and a CNN-LSTM model to predict wear states; and Chen [15] employed machine vision to monitor raceway wear and calculate the accuracy loss. Although these methods achieve notable identification performance, vibration and current signals often contain interference from guides and bearings, affecting the accuracy and repeatability of wear state recognition.
It is worth noting that apart from the nut–raceway contact zone, most of the screw raceway surface remains exposed, allowing for direct acquisition of its surface morphology without disassembly. More importantly, the raceway surface profile is influenced solely by wear, free from load or structural interference. Based on this observation, this study proposes a wear state identification method based on the surface profile characteristics of the screw raceway, introducing surface morphology information into the wear modeling of ball screw assemblies. Surface profile data covering the entire degradation process were acquired and analyzed to extract multi-scale features such as roughness, peak-to-valley height, recurrence rate, and multifractal parameters. A hybrid feature set was then constructed, and a genetic algorithm-optimized support vector machine (GA-SVM) was employed for wear state recognition.
The main contributions of this study are as follows:
(1) A novel wear identification framework based on raceway surface morphology was proposed, overcoming the limitations of traditional signal-based methods that are easily affected by interference;
(2) A multi-scale hybrid feature set combining geometric, statistical, and fractal characteristics was constructed, enhancing the comprehensiveness of wear representation;
(3) The integration of GA-SVM enabled high-accuracy wear state recognition, achieving an average identification accuracy of 98.48%, which verified the effectiveness and robustness of the proposed method.
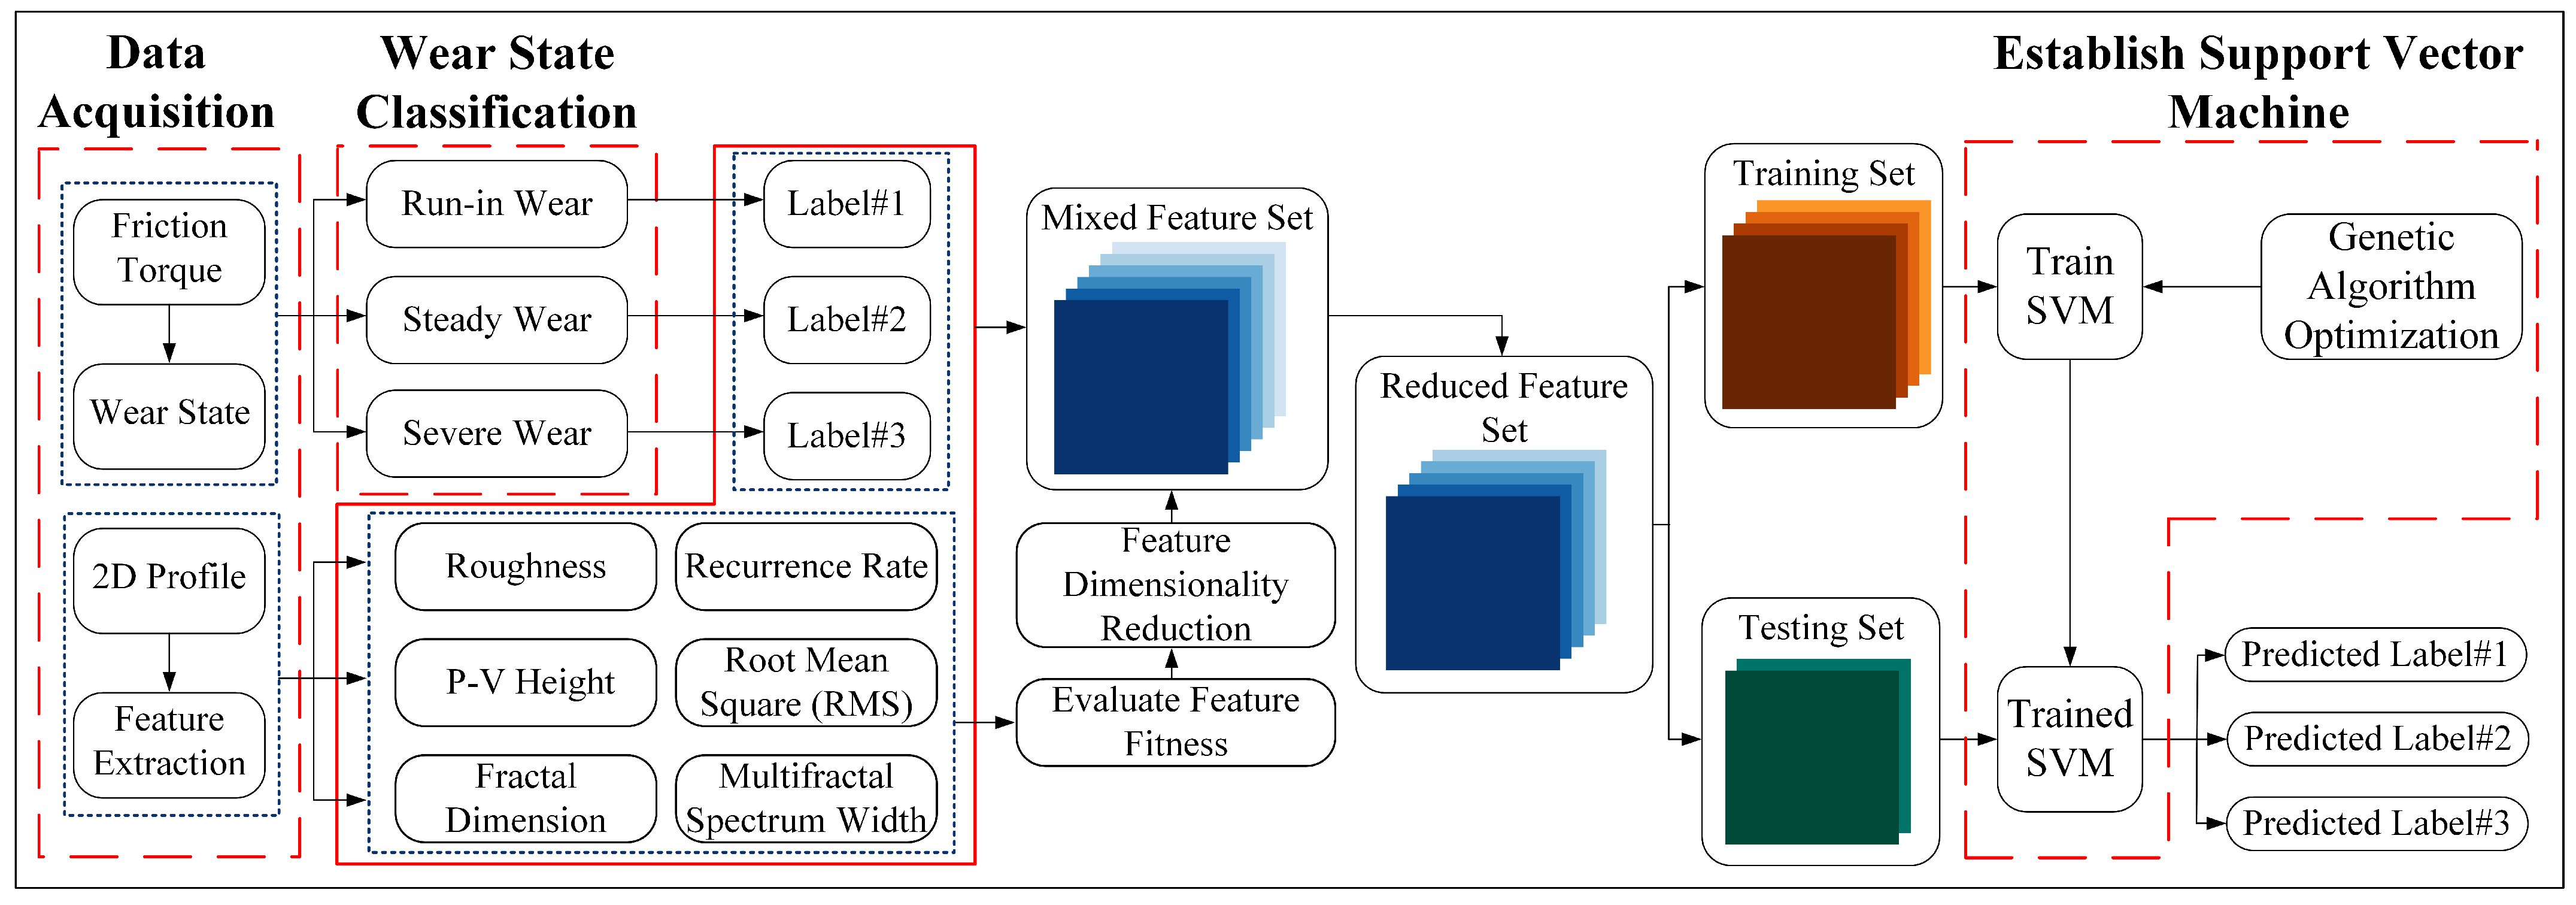
The methodological framework is illustrated in Figure 1.

2. Data Acquisition

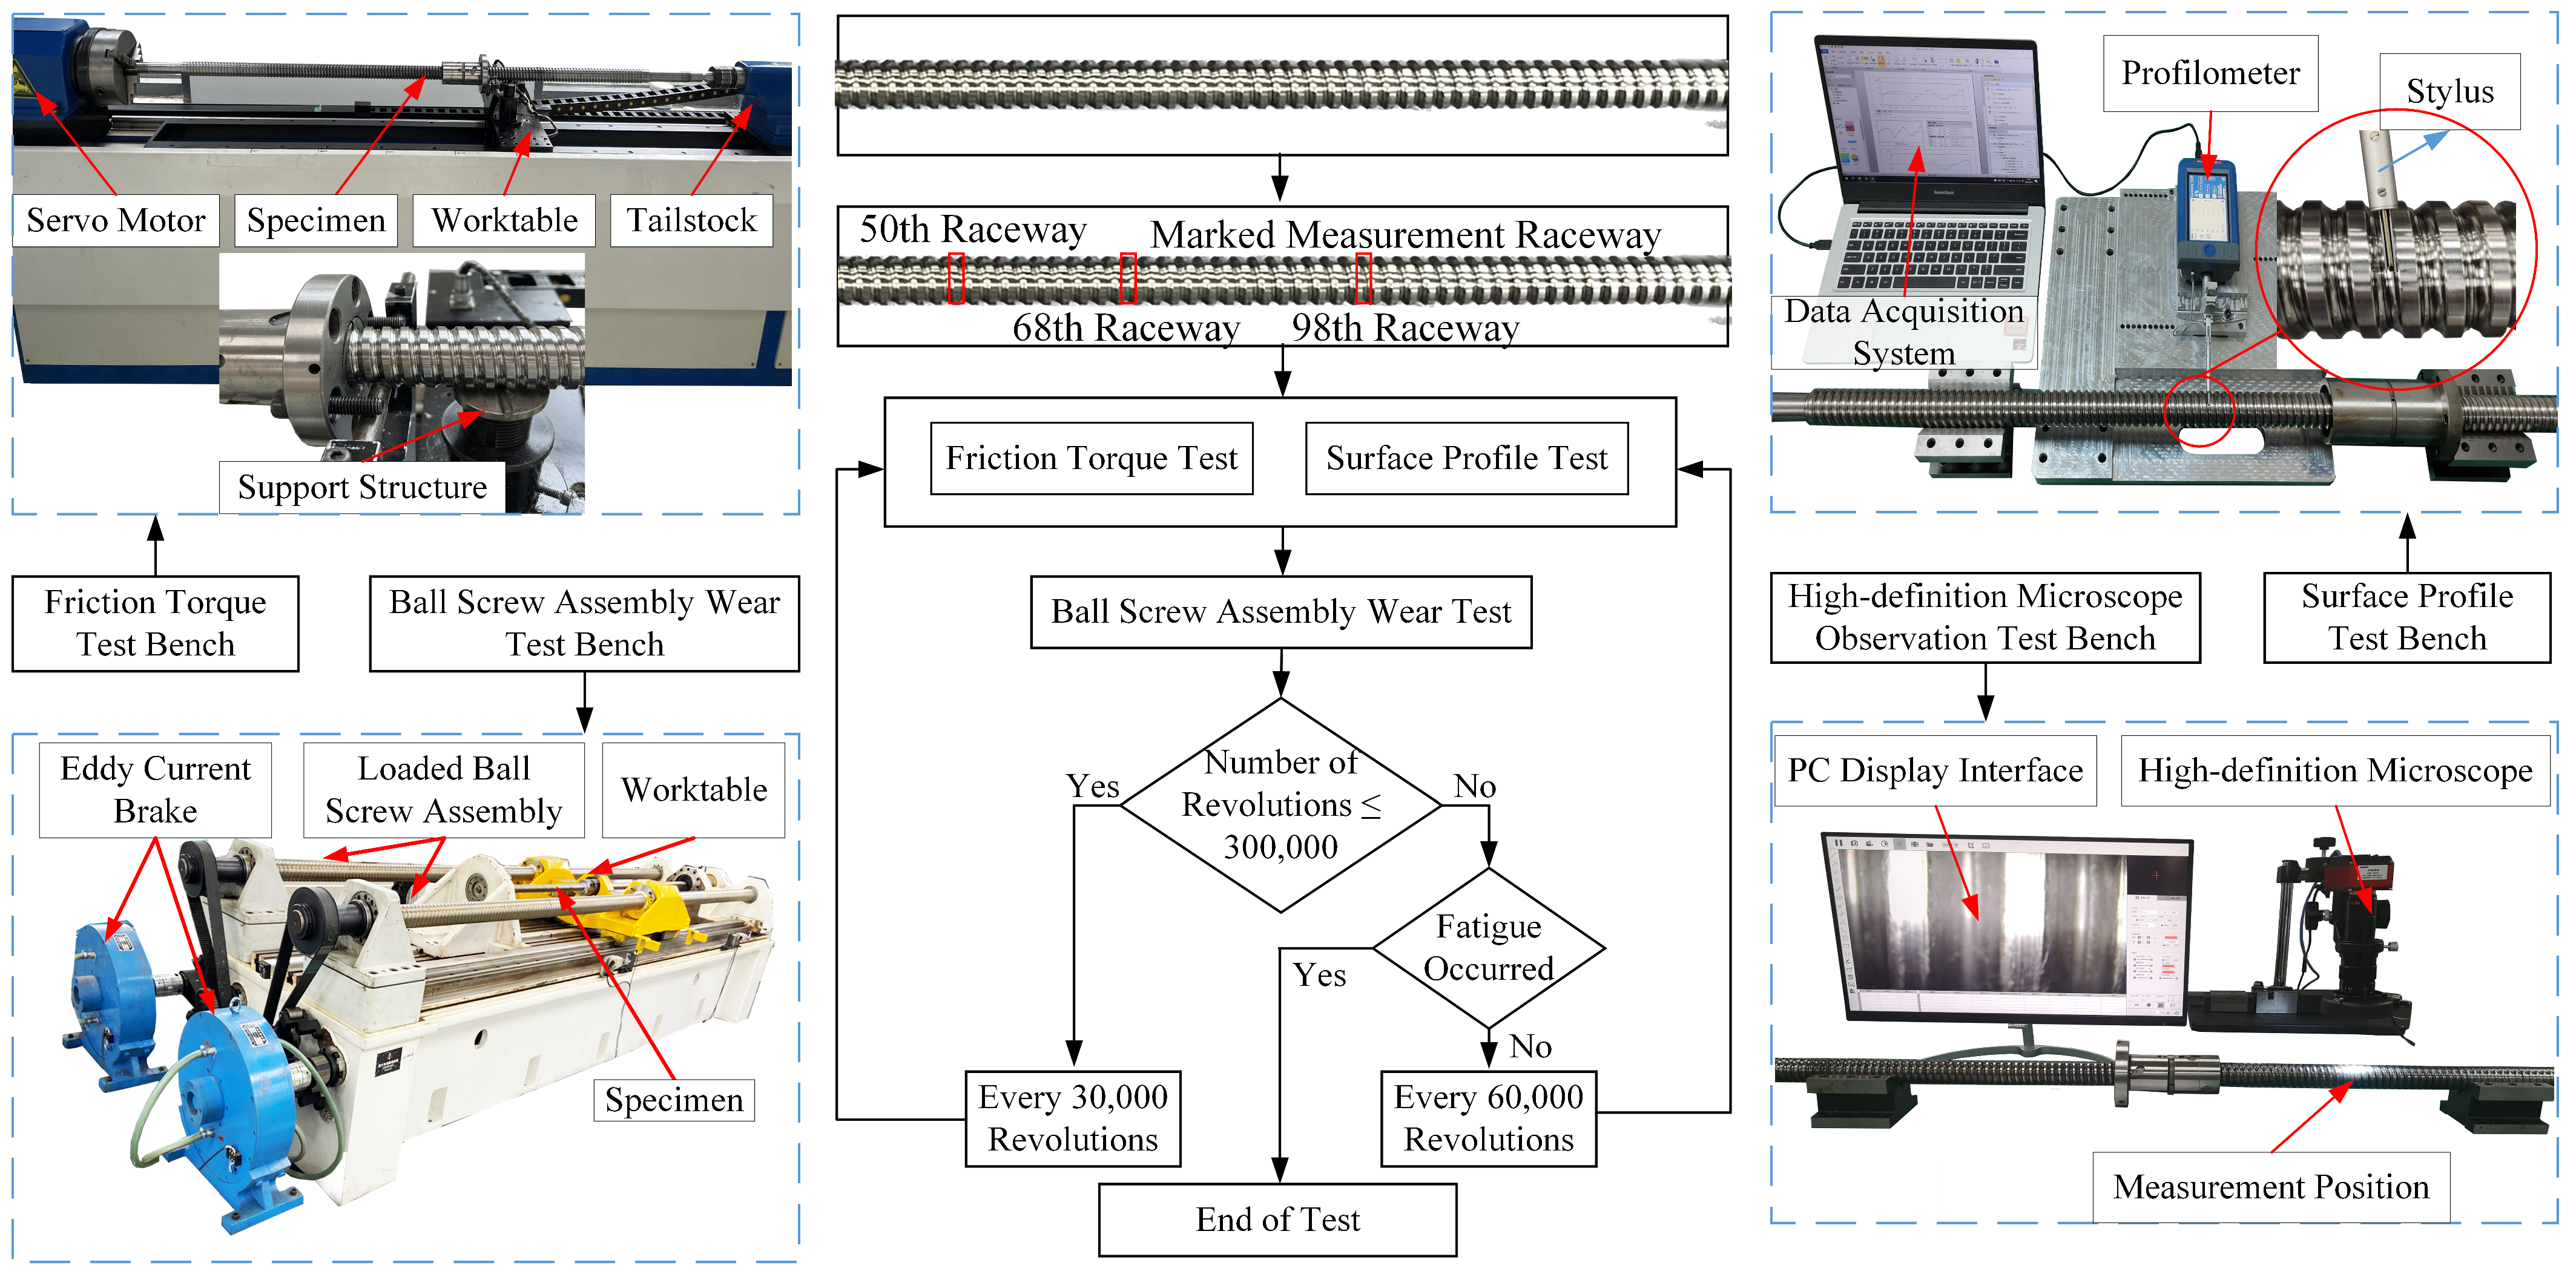
To establish an accurate wear state recognition method for ball screw pairs, it is essential to first construct a database of raceway surface wear states for training purposes. Accordingly, a dedicated wear state acquisition system and procedure were developed in this study, as illustrated in Figure 2.
Step 1: Before the test, the 50th, 68th, and 98th raceways of the screw were marked, and the surface profiles of these three raceways were collected. The preload torque of the ball screw assembly was measured in accordance with the international standard DIN ISO 3408-3 [16].
Step 2: The ball screw pair was subsequently operated under a load of 25 kN and a rotational speed of 400 rpm for 30,000 revolutions. Following this, the surface profiles and preload torque were collected again as in Step 1. The raceway surface morphology was examined, and the test was terminated if fatigue spalling was observed; otherwise, the procedure continued to Step 3.
Step 3: If the cumulative operating revolutions had not yet reached 300,000, the procedure returned to Step 2; otherwise, Step 4 was initiated.
Step 4: The screw was further operated under the same conditions (25 kN, 400 rpm) for 30,000 revolutions, after which surface profiles and preload torque were collected as in Step 1.
Step 5: The raceway surface morphology was examined once more. If no fatigue spalling was present, Step 4 was repeated; otherwise, the test was terminated.
In addition, to ensure consistent experimental conditions, all ball screw assemblies were tested in a temperature-controlled laboratory, with the ambient temperature maintained at (20 ± 1) °C. During testing, according to the DIN ISO 3408-3 standard [16], each ball screw assembly was mounted on the test bench and pre-run at a rotational speed of 100 rpm for 5 min. Lubricating oil was applied to ensure adequate lubrication. After the pre-lubrication stage, measurements were carried out without adding any additional lubricant.
Surface profile measurements were conducted using a Taylor Hobson Surtronic S-128 profilometer, with a resolution of 50 nm and a repeatability error of ±(0.5% × measured value + noise). The measurement parameters were set as follows: sampling length of 1 mm, Gaussian filter cutoff radius of 0.25, and removal of form using a fifth-order polynomial. Finally, the surface profile data of the screw raceway were exported. Each point was measured three times, and the average value was used to minimize the influence of random errors. In total, three ball screw pairs were selected for the experiments, and their specific parameters are listed in Table 1.

3. Data Processing

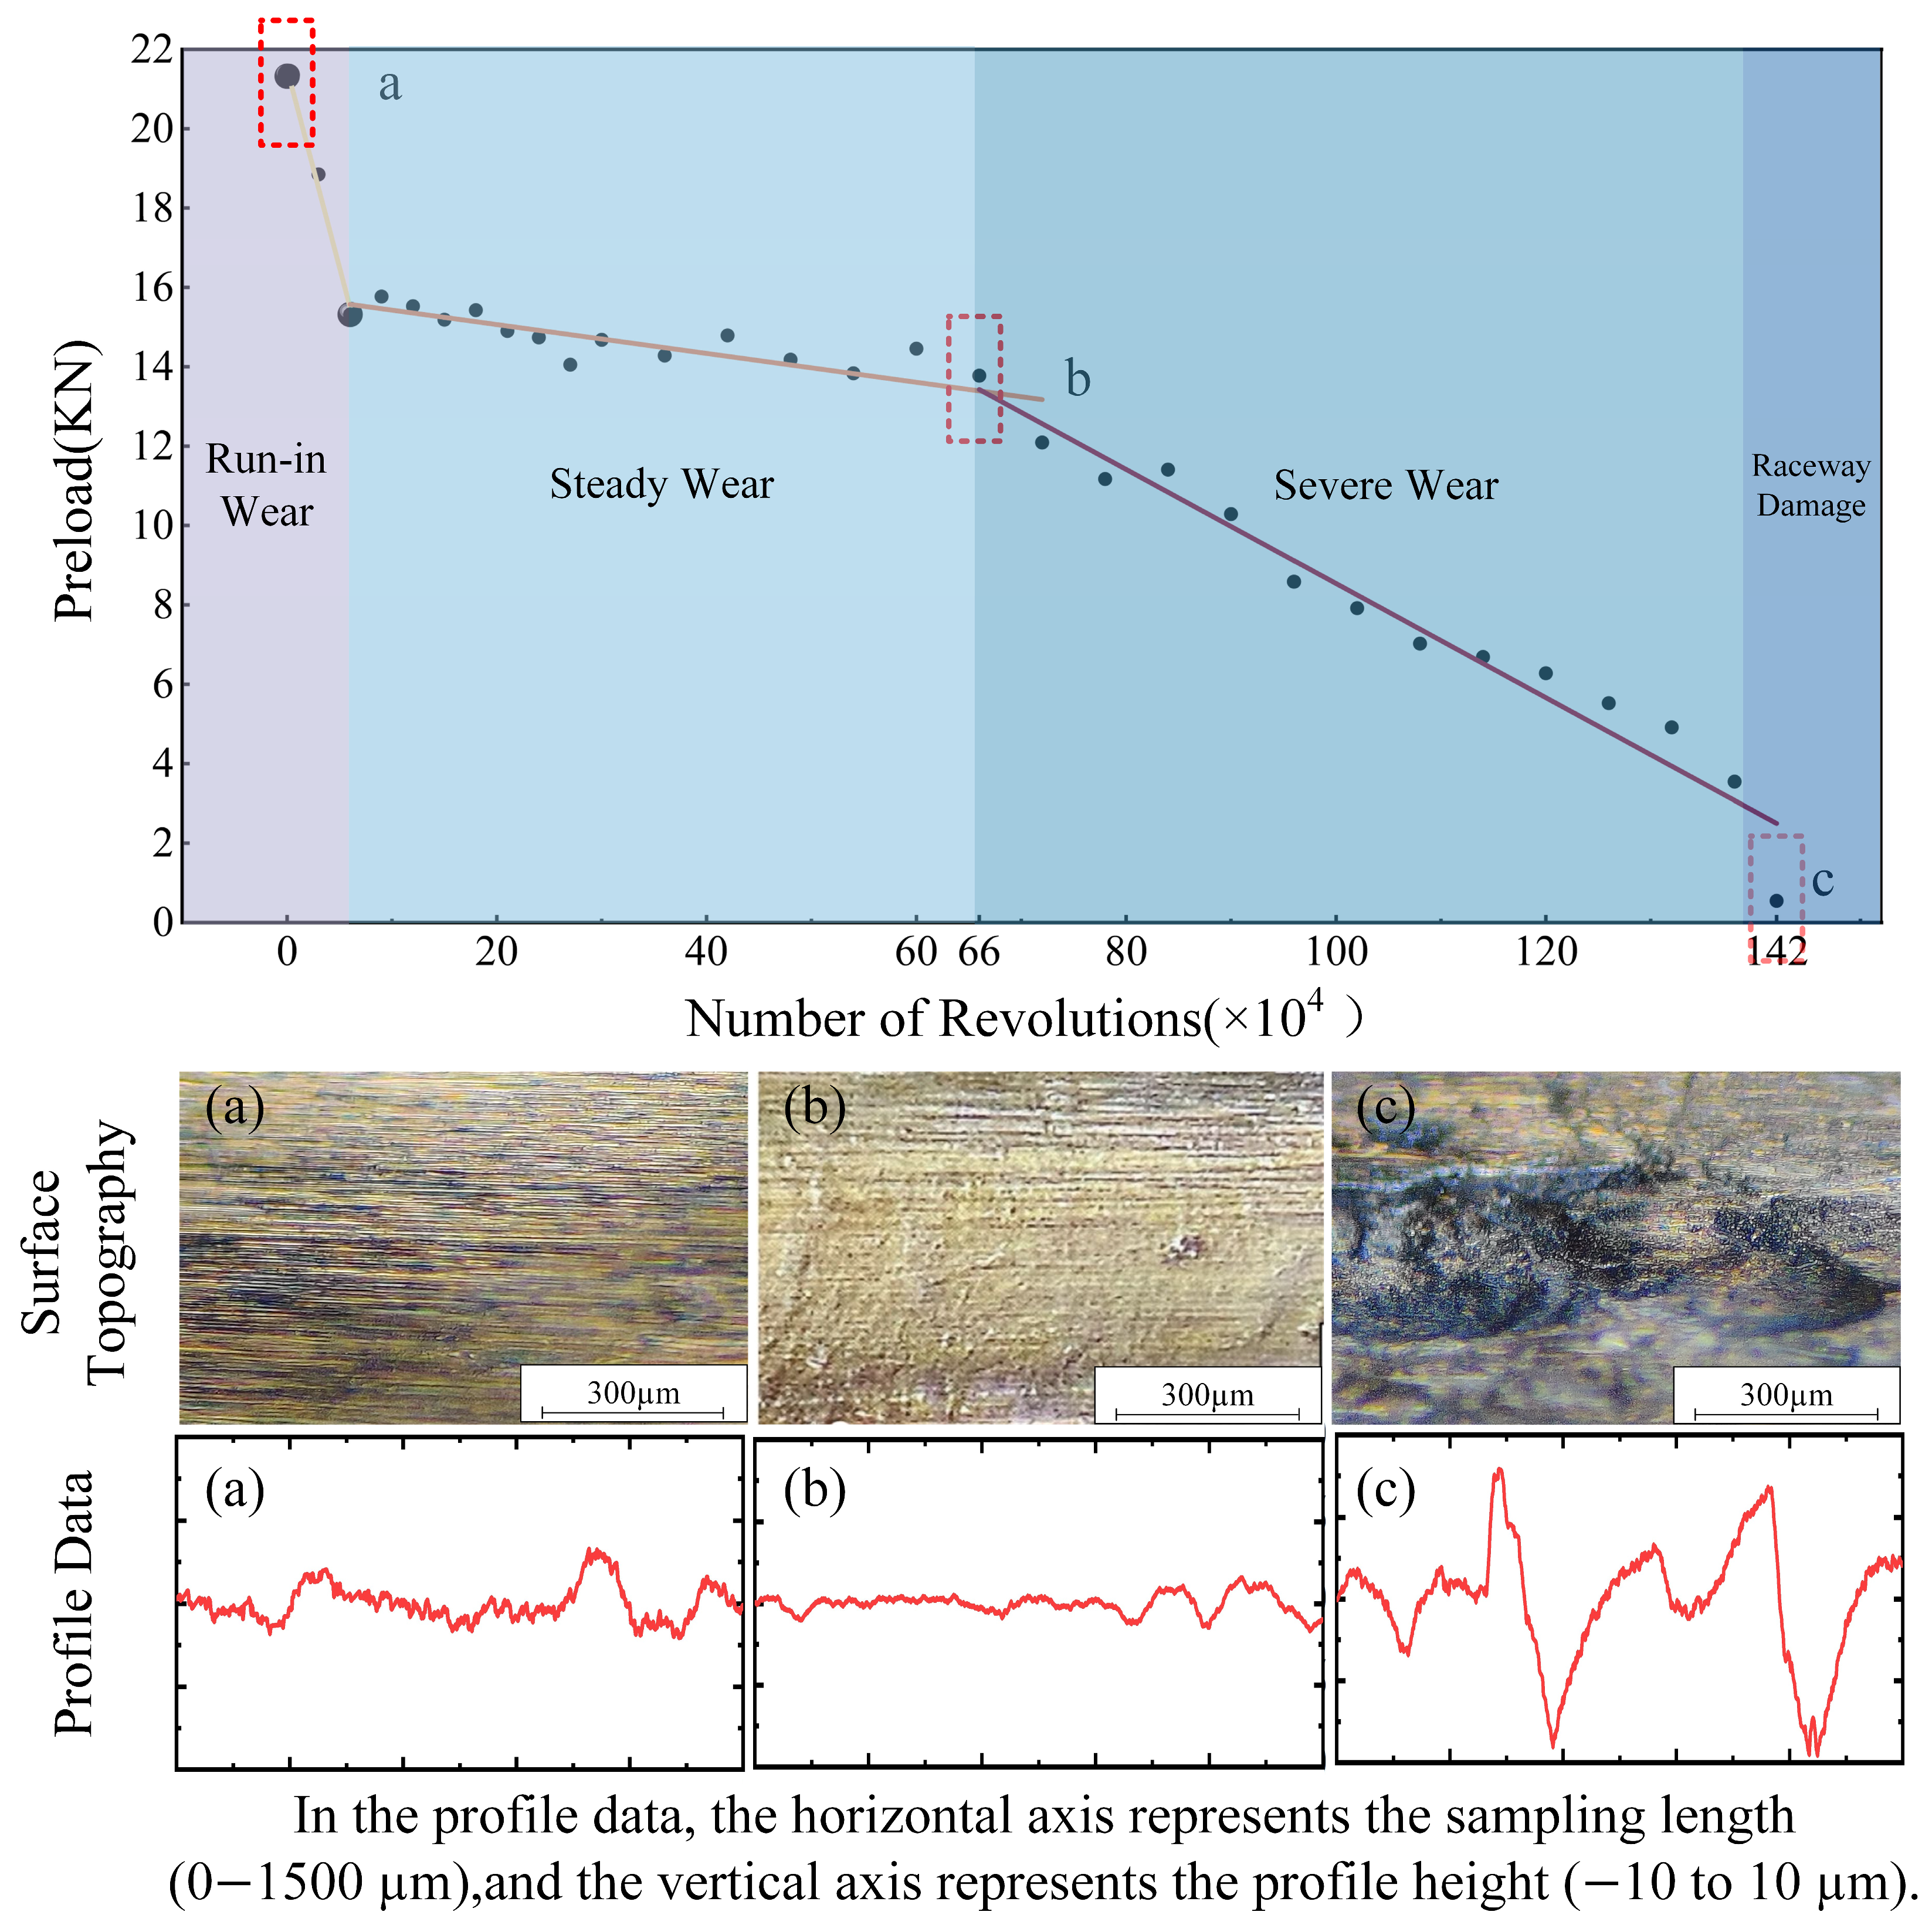
According to [17], the preload corresponding to each operating point can be calculated from the measured frictional torque. As shown in Figure 3, the preload exhibited a three-stage degradation trend: it decreased rapidly at first, then declined slowly and steadily, and finally dropped sharply again. Specifically, during the range of 0–60,000 revolutions, the initial surface roughness of the raceway was relatively high, and the micro-asperity peaks were quickly worn down, leading to a rapid decrease in preload. In this stage, the ball screw pair is in the running-in wear state. Between 60,000 and 660,000 revolutions, the raceway roughness decreased, the wear rate remained nearly constant, and the preload declined slowly, indicating a stable wear state. From 660,000 to 1,360,000 revolutions, the roughness increased again, accompanied by the onset of surface pitting and fatigue, which significantly accelerated wear and rapidly decreased the preload. Beyond 1,360,000 revolutions, large-scale fatigue spalling occurred on the raceway surface, marking the failure stage and the end of service life.
Based on the complete life cycle performance degradation data obtained, this study proposes a methodology combining statistical analysis, recurrence analysis, and fractal analysis to characterize the degradation behavior of ball screw pairs.
The statistical analysis method captures the fundamental characteristics of the raceway surface profile. Among its basic features, surface roughness (Ra), maximum peak-to-valley height (Rz), and root mean square (Rms) directly describe the original profile characteristics and are highly sensitive to wear evolution. Larger Ra, Rz, and Rms values indicate a rougher and more uneven raceway surface with greater fluctuation. Their definitions are given in Equations (1)–(3).
R a = 1 n i = 1 n z i z ¯
R z = z max z min
R m s = 1 n i = 1 n z i 2
Ra denotes surface roughness, Rz represents the maximum peak-to-valley height, and Rms is the root mean square value. z i is the profile height; z m i n and z m a x are the minimum and maximum profile heights, respectively; z ¯ is the mean profile height; and n denotes the sampling rate.
Recurrence refers to the property of a system in which certain characteristics reappear after a period of time or displacement, demonstrating similarity to the original state. As the surface profile of the ball screw raceway exhibited strong nonlinearity, recurrence analysis was introduced to characterize the performance degradation of ball screw pairs.
The recurrence analysis method mainly includes recurrence plots and recurrence quantification analysis (RQA). In this study, RQA was employed. Among the RQA indicators, the recurrence rate (RR) is one of the most fundamental features used to quantitatively reflect the stability and fluctuation of the system state. For the raceway surface profile of a ball screw, a higher RR indicates a greater similarity between different sampling points, implying a more stable surface morphology and more uniform wear. Its calculation is given in Equation (4).
R R = 1 N 2 i , j = 1 N R i , j
N denotes the number of phase points, where each phase point represents a point in the reconstructed phase space, and R i , j represents the recurrence points.
Fractal theory can be categorized into monofractal and multifractal approaches. The fractal dimension (D) is one of the most important parameters in monofractal theory and can be understood as a measure of the surface complexity. A larger fractal dimension indicates a smoother raceway profile with smaller fluctuations while also reflecting greater complexity and irregularity of the profile curve. In this study, the monofractal dimension was determined using the structure function method.
The Weierstrass–Mandelbrot (W–M) function is particularly suitable for describing the nonlinear characteristics of the raceway surface profile, and is defined in Equation (5).
z ( x ) = G D 1 n = n 1 cos ( 2 π γ n x ) γ ( 2 D ) n
Here, 1 < D < 2 , γ > 1 , and D denote the fractal dimension; G represents the height scaling factor; γ n is the spectrum of the rough surface; n is the sampling frequency; n 1 is the minimum sampling frequency, γ n 1 1 / L ; and L is the sampling length, which generally satisfies γ = 1.5 . In addition, z x denotes the random profile height, and x is the position coordinate of the profile. Intuitively, the W–M function regards the height variations in the surface profile as a set of “waves”, where different frequencies and amplitudes reflect the undulating characteristics of wear at different scales.
The corresponding power spectrum function can be expressed as Equation (6).
S ( w ) = G 2 ( D 1 ) 2 ln γ 1 ω ( 5 2 D )
The variance of the increments is defined as the structure function, which can be expressed as Equation (7).
S ( τ ) = z ( x + τ ) z ( x ) 2 = + S ( ω ) ( e j ω τ 1 ) d ω
Here, τ = n L , where L denotes the sampling interval.
By combining Equations (5) and (7), Equation (8) can be obtained.
S ( τ ) = C G 2 ( D 1 ) τ ( 4 2 D ) = 1 N n i = 0 N n ( z i + n z i ) 2
The above terms are defined as follows: C = Γ ( 2 D 3 ) sin ( ( D 1.5 ) π ) / ( 4 2 D ) ln γ , where Γ ( * ) denotes the Gamma function, Γ ( x ) = 0 + t x 1 e t d t .
Taking the logarithm of both sides of the above equation yields Equation (9).
lg S ( τ ) = ( 4 2 D ) lg τ + lg C + 2 ( D 1 ) lg G
According to the above equation, the fractal dimension, D , can be obtained as expressed in Equation (10).
D = 4 k 2
Here, k represents the slope of the straight line.
The monofractal dimension can characterize the intrinsic properties of the raceway profile; however, it is insufficient to capture the local nonlinear characteristics of the profile in detail. Multifractals can be regarded as an infinite set of intertwined monofractals under different measures, which are inherently more complex and heterogeneous than monofractals. Therefore, the multifractal method was introduced to describe the nonlinear features of the raceway profile. Multifractal analysis mainly consists of the generalized dimension and the multifractal spectrum, with the latter being more widely applied. In this study, the multifractal spectrum was employed to characterize the degradation pattern of the raceway surface profile.
The box-counting method was adopted to compute the multifractal spectrum of the raceway profile. The core idea was to analyze the nonuniform distribution of the profile’s probability measure across different scales. First, the minimum value of the acquired raceway profile data was taken as the lower bound and set to zero to ensure all amplitude values were positive. Then, the profile was covered with a series of small boxes with a size of ε 0 < ε < 1 . For each box, the ratio between the sum of the profile amplitudes within the box and the total amplitude was calculated to obtain the probability measure, P i ε , as expressed in Equation (11).
P i ε = S i ε S i ε
Here, S i ε represents the sum of all profile amplitudes within the i -th box at scale ε , and S i ε denotes the sum of all amplitude values of the entire raceway profile. Intuitively, P i ε reflects the degree of concentration of the profile height information within that region at scale ε .
Within the scaling region, P i ε can also be expressed in exponential form, as shown in Equation (12):
P i ε ~ ε α
where α is the singularity exponent, which reflects the intensity of variation in the measure within the local region.
Assuming that the number of boxes with the same singularity exponent α is N α ε , then within the scaling region N α ε can also be written in exponential form as follows:
N α ε ~ ε f α
where f α represents the fractal dimension corresponding to the singularity exponent α . A smaller N α ε corresponds to a smaller f α . However, it is difficult to directly count the number of boxes with the same singularity exponent; therefore, the partition function was introduced for indirect calculation. The multifractal partition function is defined as χ q ε , as shown in Equation (14):
χ q ε = P i ε q = ε τ q
where q is the moment order, with τ q serving as a weighting factor. Theoretically, q should be in the range of , . However, for practical computation, its range cannot be infinite. Therefore, in this study, q was taken from [−20, 30] with a step size of 1.
When ε 0 , τ q can be rewritten as Equation (15):
τ q = lim ε 0 log χ q ε log ε
By linking α , f α , and the generalized dimension τ α and considering the Legendre transformation relationship among them, the following equations can be obtained:
α q = d τ q d q
f α = q α q τ q
where α and f α together form the multifractal spectrum, and the multifractal spectrum width α is defined to quantify the overall nonuniformity of the profile, as shown in Equation (18).
α = α max α min
Here, α m i n and α max represent the minimum and maximum singularity exponents, respectively. α represents the nonuniformity of the probability measure of the sequence. A larger α value indicates that the surface simultaneously contains multiple feature regions, such as smooth and rough areas, reflecting greater surface complexity and stronger nonuniformity; conversely, a smaller Δα value indicates that the profile is more uniform overall.
Finally, labels were established for the performance degradation data of the ball screw pairs. According to the variation in preload torque throughout the full service life, the wear progression of the ball screw pair was divided into three stages: the running-in wear stage, the stable wear stage, and the severe wear stage, which were assigned labels 1, 2, and 3, respectively.
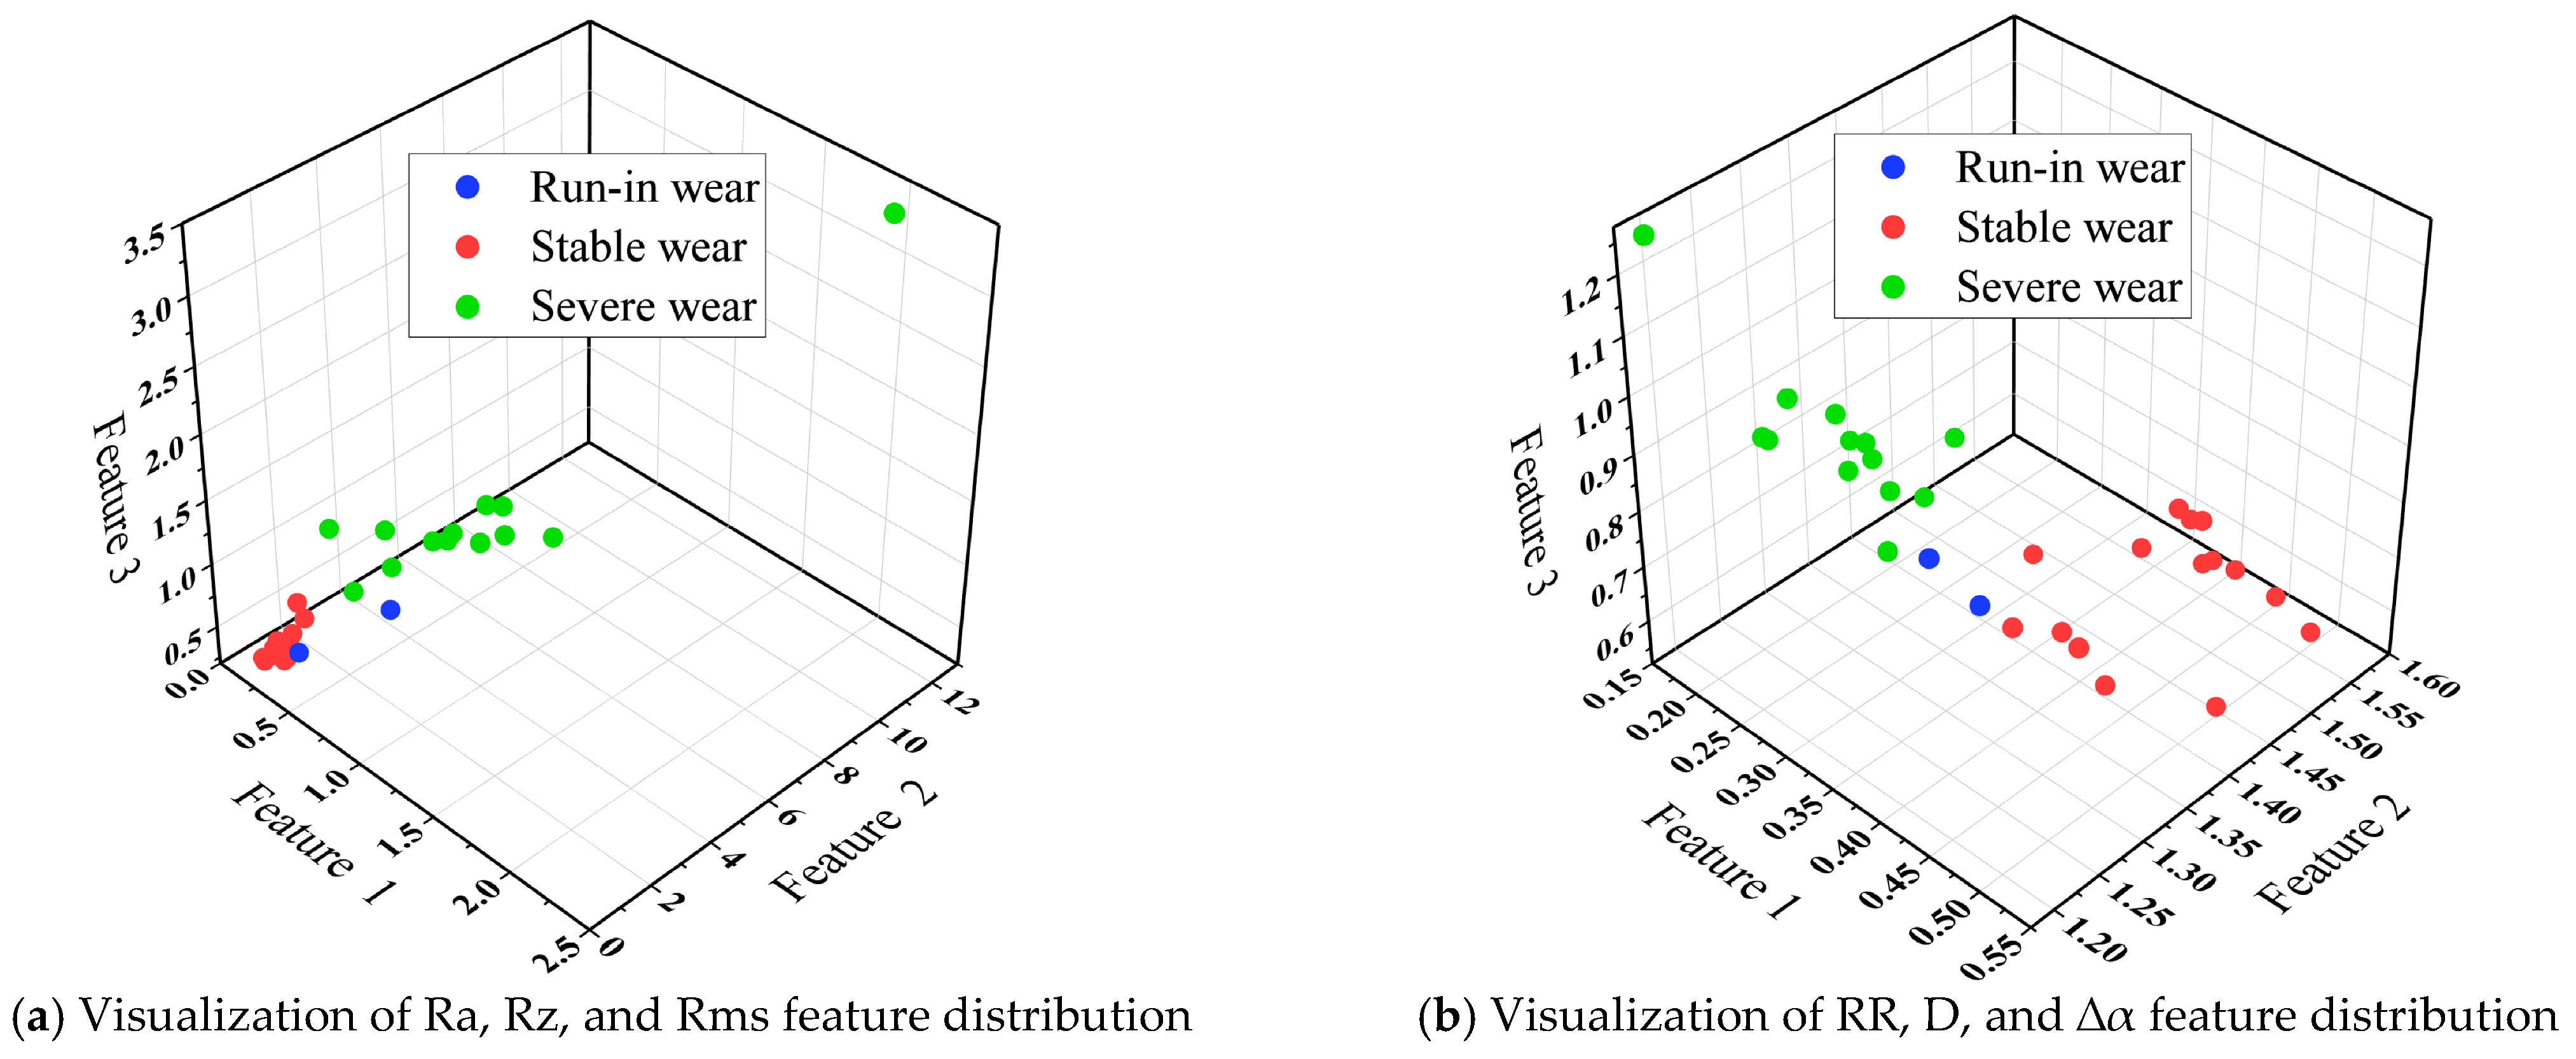
In summary, six feature parameters were employed in this study to characterize the performance degradation of the ball screw pair, namely surface roughness (Ra), maximum peak-to-valley height (Rz), root mean square (Rms), recurrence rate (RR), monofractal dimension (D), and multifractal spectrum width ( α ). However, these features exhibited different behaviors in representing the degradation process. The polynomial fitting coefficients of Ra, Rz, and Rms were all below 0.85, indicating poor linear correlation, while the remaining three features showed polynomial fitting coefficients above 0.90, indicating strong linear correlation. Moreover, Ra, Rz, and Rms presented a large fluctuation range between the minimum and maximum values across different degradation states, whereas the other three features exhibited relatively small fluctuation ranges. When fatigue spalling occurred, no abrupt changes were observed in the fractal and recurrence analysis features, whereas the statistical analysis features exhibited significant mutations. This observation suggests that fractal analysis and recurrence analysis are more suitable for characterizing the degradation process of the ball screw pair. Therefore, the three statistical features were discarded, and only RR, D, and α were retained.
Figure 4 illustrates the visualization of feature distributions under different wear states. In Figure 4a, the features corresponding to the three degradation states exhibited partial overlap, whereas in Figure 4b, the three degradation states can be clearly distinguished, with only minor overlaps observed.
Considering the limited number of wear state samples, this study expanded the dataset using function fitting and interpolation methods while maintaining a consistent data distribution to avoid outliers. In addition, regularization was introduced during modeling to reduce the risk of overfitting and enhance the robustness of the model.
4. Establishment of SVM Model Optimized by Genetic Algorithm

In recent years, machine learning methods—particularly deep learning—have been widely applied for mechanical component state identification. For example, the softmax classifier [18] has been used for bearing health assessment and intelligent fault diagnosis under non-stationary operating conditions, and the Transformer model [19] has demonstrated excellent performance in the transferable fault diagnosis of rotating machinery.
However, deep learning models typically rely on large-scale datasets and high computational resources, which limit their performance when experimental samples are scarce. In addition, their complex architectures and low interpretability make it difficult to reveal the physical mechanisms underlying the wear evolution of ball screw assemblies. In contrast, support vector machine (SVM) exhibits strong generalization capability and stability in small-sample, nonlinear classification tasks, with fewer parameters and easier training and interpretation [13].
To further enhance classification accuracy and robustness, this study introduced a genetic algorithm (GA) to perform global optimization of the SVM’s key parameters. In this section, the dimensionally reduced hybrid feature set was input into the GA-SVM model, and training and testing were conducted to achieve accurate recognition of the wear states of the ball screw assembly. This approach combines the stability of SVM in small-sample nonlinear classification with the global search capability of GA, ensuring high model accuracy while enhancing automated optimization and robustness.

4.1. Support Vector Machine Model

Support vector machine (SVM) [20,21] is a supervised learning model based on statistical theory, which has unique advantages in nonlinear and small-sample pattern recognition. It has been widely applied in data classification and regression tasks. The core principle of SVM is to employ kernel-based nonlinear mapping to transform linearly inseparable data in the original space into a higher-dimensional feature space, where the data can be linearly separated. In this high-dimensional space, the optimal hyperplane is determined, which not only separates different categories, but also maximizes the margin between data points and the hyperplane.
SVM can be applied to classification problems in linear and nonlinear manners. This section focuses on the nonlinear analysis process since it is more common. The optimization objective function is defined as Equation (19):
ϕ ω = 1 2 ω T ω + c i = 1 l ξ i
The above is subject to the constraints in Equation (20):
y i ω T x i + b 1 ξ i
where x i and y i denote the input training data and their corresponding labels, y i 1 , 1 ; w and b are the hyperplane parameters; c is the penalty factor; and ξ i is the slack variable. The value of c has a significant impact on classification performance: a large value may lead to overfitting, while a small value may result in underfitting.
The selection of the kernel function is crucial in the mapping process. Commonly used kernels include the linear kernel, polynomial kernel, radial basis function (RBF) kernel, and sigmoid kernel [22]. Since the RBF kernel is well-suited for nonlinear decision boundaries, requires fewer parameters, and generally achieves high classification accuracy [23], it was adopted in this study. The kernel parameter g plays a key role in classification performance; thus, its optimal value must be carefully selected.
In summary, the penalty factor, c, and the kernel parameter, g, are the most critical parameters in SVM training. Therefore, a genetic algorithm was employed to optimize these parameters to achieve the accurate recognition of ball screw pair degradation states.

4.2. Genetic Algorithm

The genetic algorithm (GA) [24,25] is a global optimization technique inspired by Darwin’s theory of evolution and Mendel’s genetics. It is essentially an efficient, parallel, and global search method that follows the principle of “survival of the fittest”, and its optimization process mainly involves selection, crossover, and mutation. Through these genetic operations, a new generation of population is produced, completing an evolutionary iteration. By continuous evolution, the population gradually approaches the optimal solution.
The specific procedure for applying GA to optimize parameters c and g in this study is as follows:
Step 1: Encode parameters c and g and randomly generate M individuals as the initial population P 1 . The maximum number of generations is set as N.
Step 2: Calculate the fitness of each individual in the population, P n n = 1 , 2 , , N , and evaluate the quality of each individual.
Step 3: Check whether the fitness satisfies the termination condition or if the maximum generation number is reached. If yes, proceed to Step 5; otherwise, go to Step 4.
Step 4: Apply selection, crossover, and mutation operations to the population, with crossover and mutation probabilities set accordingly, to generate a new population. Return to Step 2.
Step 5: Obtain optimal parameters c and g.
In this study, the classification accuracy of the SVM model was used as the fitness function, which is defined in Equation (21):
F i t n e s s = s t
where s is the number of correctly classified samples, and t is the total number of samples.

5. Wear State Recognition of Ball Screw Pairs

5.1. Results Analysis

After establishing the model, the reduced mixed feature set was divided into a training set and a testing set with a ratio of 2:1. The training set was fed into the model for training, with the GA population size set to 20 and the maximum number of generations set to 100.
The trained SVM model was then evaluated using the testing set, and the results were represented by a confusion matrix. In this study, all three ball screw pairs were used for training and testing. Specifically, the degradation data of two ball screw pairs were used as the training set, while the degradation data of the third ball screw pair were used as the testing set. The recognition results are illustrated in Figure 5.
After constructing the wear state recognition model of the ball screw pairs, it was necessary to evaluate the prediction results. Prediction accuracy is one of the most commonly used and straightforward evaluation metrics. However, in this study, the number of samples in the running-in wear stage was much smaller than that in the other two stages, resulting in class imbalance. Such imbalance may cause the model to be biased toward the majority classes, leading to the running-in stage samples being easily overlooked. Meanwhile, the classification boundaries were influenced by the majority classes, making the minority class more prone to misclassification and preventing the model from accurately reflecting its performance on the minority class. To address this issue, a three-class confusion matrix along with the following four evaluation metrics were introduced as joint criteria for performance assessment.
(1)
Confusion matrix:
The confusion matrix provides an intuitive visualization of the model’s prediction results. The confusion matrix for the three-class classification task is shown in Table 2.
For a binary classification confusion matrix, the four values TP (True Positive), FN (False Negative), FP (False Positive), and TN (True Negative) are commonly used to represent the results. For a three-class confusion matrix, the class-wise calculations are as follows:
Class 1: TP = a, FN = b + c, FP = d + g, TN = e + i;
Class 2: TP = e, FN = d + f, FP = b + h, TN = a + i;
Class 3: TP = I, FN = g + h, FP = c + f, TN = a + e.
(2)
Accuracy (A):
Accuracy is defined as the proportion of correctly classified samples to the total number of samples, which measures the overall classification performance of the model across all classes:
A = T P + T N T P + F N + F P + T N
(3)
Precision (P):
Precision, also known as the positive predictive value, focuses on the prediction results. It represents the probability that a sample predicted as positive is actually positive. In other words, it reflects the reliability of positive predictions. Precision differs from accuracy in that it only considers the positive prediction subset, while accuracy evaluates the overall performance across both positive and negative classes. Its formulation is
P = T P T P + F P
(4)
Recall (R):
Recall, also known as sensitivity, measures the probability that a sample which is actually positive is correctly predicted as positive. It is defined as
R = T P T P + F N
(5)
F1-score:
The F1-score combines both precision and recall, representing their harmonic mean to balance the two metrics simultaneously. It is calculated as
F 1 = 2 P R P + R
To validate the effectiveness of the dimensionality reduction, the mixed feature set before reduction was also input into the GA-SVM model. The testing results are illustrated in Figure 6.
Figure 7 shows that for all evaluation metrics across the three labels, the performance after dimensionality reduction was superior to that before reduction. Particularly for Label 1, which represents the running-in wear stage, both precision and recall were relatively low, indicating misclassification between Label 1 and the other labels. Misclassifying running-in wear as stable wear or severe wear may lead to resource wastage. Conversely, misclassifying severe wear as running-in wear has a much higher cost and could potentially cause production accidents. These observations demonstrate the necessity of feature dimensionality reduction.

5.2. Comparison of Different Methods

To further validate the effectiveness of the proposed method, the dimensionally reduced feature data were input into three classical classification models—support vector machine (SVM), random forest (RF), and artificial neural network (ANN)—for ball screw wear state identification. The results are compared in Figure 8.
The recognition results show that among the three comparative models, support vector machine (SVM) achieved the best performance with an accuracy of 95.139%, random forest (RF) ranked second with an accuracy of 92.326%, and the artificial neural network (ANN) performed relatively poorly, achieving an accuracy of only 90.023%. Compared with these methods, the GA-SVM model proposed in this study demonstrated superior performance in the wear state identification task, with a stable recognition accuracy of 98.48%.
Moreover, compared with the traditional SVM, the proposed method improved the recognition accuracy by 3 percentage points, effectively demonstrating that parameter optimization using the genetic algorithm significantly enhances the performance of SVM. Therefore, the GA-SVM model can achieve a more accurate and reliable identification of the ball screw wear states, providing an effective solution for equipment condition monitoring and fault diagnosis.

6. Conclusions

In this article pertaining to identifying the wear states of ball screw pairs, we proposed a performance degradation identification method based on raceway surface profile features. By integrating statistical, recurrence, and fractal features, the method achieved multi-scale characterization of the screw raceway wear process. The main conclusions are as follows.
(1) Based on the variation in preload, the performance degradation of ball screw pairs can be divided into three stages, namely, running-in, stable, and severe wear, revealing the evolution characteristics of wear.
(2) Among the six extracted features, the recurrence rate (RR), monofractal dimension (D), and multifractal spectrum width (Δα) showed the strongest correlation with wear state and can serve as key recognition indicators.
(3) The genetic algorithm-optimized support vector machine (GA-SVM) model enables high-precision recognition of the wear states of ball screws, achieving an average accuracy of 98.48%.
The results indicate that raceway surface profile features can effectively reflect the wear patterns of ball screw pairs, thereby providing a new approach for the predictive maintenance and health monitoring of critical components in CNC equipment. Future research will focus on expanding experimental samples under various operating conditions, constructing a multi-condition wear database, and combining three-dimensional surface characterization with deep learning methods to achieve broader and more intelligent wear state recognition.

Author Contributions

Methodology, writing—original draft, C.Z.; writing—review and editing, D.Y.; software, Z.L.; Experimental instructions, L.W.; writing—review and supervision, H.F. All authors have read and agreed to the published version of the manuscript.

Funding

This research was funded by the Science and Technology Major Project of Jiangsu Province (BG2024009), the National Natural Science Foundation of China (Grant No. 51905274), the Fundamental Research Funds for the Central Universities (Grant No. 30923011011), the Intelligent Manufacturing Longcheng Laboratory (Grant no. LK202407), and the Key R&D Projects in Lishui Economic Development Zone (Grant No. 2022KFQZDYF15).

Data Availability Statement

Data is part of another ongoing research. We do not have the permission to share data.

Conflicts of Interest

The authors declare that the research was conducted in the absence of any commercial or financial relationships that could be construed as a potential conflict of interest.

References

  1. Wang, M.; Zan, T.; Gao, X.; Li, S. Suppression of the time-varying vibration of ball screws induced from the continuous movement of the nut using multiple tuned mass dampers. Int. J. Mach. Tools Manuf. 2016, 107, 41–49. [Google Scholar] [CrossRef]
  2. Xu, M.; Cai, B.; Li, C. Dynamic characteristics and reliability analysis of ball screw feed system on a lathe. Mech. Mach. Theory 2020, 150, 103890. [Google Scholar] [CrossRef]
  3. Lv, L.; Chen, S.; Lu, C.; Wang, W. Analysis of load distribution for ball screws with circulation modes and geometric errors. Mech. Mach. Theory 2024, 199, 105677. [Google Scholar] [CrossRef]
  4. Feng, G.H.; Pan, Y.L. Investigation of ball screw preload variation based on dynamic modeling of a preload adjustable feed-drive system and spectrum analysis of ball-nuts sensed vibration signals. Int. J. Mach. Tools Manuf. 2012, 52, 85–96. [Google Scholar] [CrossRef]
  5. Frey, S.; Walther, M.; Verl, A. Periodic variation of preloading in ball screws. Prod. Eng. 2010, 4, 261–267. [Google Scholar] [CrossRef]
  6. Denkena, B.; Bergmann, B.; Schmidt, A. Preload monitoring of single nut ball screws based on sensor fusion. CIRP J. Manuf. Sci. Technol. 2021, 33, 63–70. [Google Scholar] [CrossRef]
  7. Shu, F.; Feng, H.; Zhou, C.; Ou, Y. Research on friction torque loss model and experiment of double nut ball screw. Modul. Mach. Tool Autom. Manuf. Technol. 2019, 4, 37–40. [Google Scholar] [CrossRef]
  8. Oh, K.-J.; Cao, L.; Chung, S.-C. Explicit Modeling and Investigation of Friction Torques in Double-Nut Ball Screws for the Precision Design of Ball Screw Feed Drives. Tribol. Int. 2020, 141, 105841. [Google Scholar] [CrossRef]
  9. Zhao, J.; Qi, B.; Song, X.; Jiang, H.; Dong, P. A modeling method for predicting friction torque of the preload double-nut ball screw based on thermal elastohydrodynamic lubrication. Int. J. Adv. Manuf. Technol. 2022, 124, 4231–4251. [Google Scholar] [CrossRef]
  10. Zhao, S.; Huang, Y.; Wang, H.; Liu, X.; Liang, X. Laplacian Eigenmaps and Mahalanobis Distance based health assessment methodology for ball screw. J. Mech. Eng. 2017, 53, 125–130. [Google Scholar] [CrossRef]
  11. Garinei, A.; Marsili, R. A new diagnostic technique for ball screw actuators. Measurement 2012, 45, 819–828. [Google Scholar] [CrossRef]
  12. Yuan, H.; Lei, Z.; Zhang, H.; Liu, J. Performance evaluation of ball screw pair based on manifold distance. Sci. Technol. Eng. 2023, 23, 10808–10816. [Google Scholar] [CrossRef]
  13. Me, S. Wear Condition Monitoring Research of Ball Screw Based on Current Signal. Master’s Thesis, Huazhong University of Science and Technology, Wuhan, China, 2015. [Google Scholar] [CrossRef]
  14. Wang, K. Research on Methods of Health Status Evaluation and Prediction of Ball Screw. Ph.D. Thesis, Shanghai Jiao Tong University, Shanghai, China, 2019. [Google Scholar] [CrossRef]
  15. Chen, C. Research on Ball Screw Raceway Wear Monitoring Based on Machine Vision. Master’s Thesis, Shandong Jianzhu University, Jinan, China, 2024. [Google Scholar] [CrossRef]
  16. BS ISO 3408-3:2006; Ball Screws—Acceptance Conditions and Acceptance Tests. BSI (British Standards Institution): London, UK, 2006.
  17. Zhou, C.-G.; Feng, H.-T.; Chen, Z.-T.; Ou, Y. Correlation between preload and no-load drag torque of ball screws. Int. J. Mach. Tools Manuf. 2016, 102, 35–40. [Google Scholar] [CrossRef]
  18. Liu, D.; Cui, L.; Cheng, W. Flexible generalized demodulation for intelligent bearing fault diagnosis under nonstationary conditions. IEEE Trans. Ind. Inform. 2023, 19, 2717–2728. [Google Scholar] [CrossRef]
  19. Liu, D.; Cui, L.; Wang, G.; Cheng, W. Interpretable domain adaptation transformer: A transfer learning method for fault diagnosis of rotating machinery. Struct. Health Monit. 2024, 24, 1187–1200. [Google Scholar] [CrossRef]
  20. Hu, H.Z.; Qin, C.; Guan, F.; Zhang, H.B.; An, S.J. Tool wear recognition based on sparrow search algorithm optimized support vector machine. Sci. Technol. Eng. 2021, 21, 10755–10761. [Google Scholar] [CrossRef]
  21. Zhang, J.; Xu, Y.; Wang, X. Research on tool state during grinding process of flexible abrasive belt based on support vector machine and GA. Tool Eng. 2021, 55, 55–59. [Google Scholar] [CrossRef]
  22. Yin, J. Research on Selection of Kernel Functions and Key Parameters in Support Vector Machine. Master’s Thesis, Harbin Institute of Technology, Harbin, China, 2016. [Google Scholar] [CrossRef]
  23. Peng, M. Research on Wear State Recognition of Micro Milling Tool Based on ACO-SVM. Master’s Thesis, Changzhou University, Changzhou, China, 2021. [Google Scholar] [CrossRef]
  24. Dai, Y. Fault diagnosis analysis of airborne radar based on support vector machine and genetic algorithm optimization. Electron. Qual. 2025, 7, 8–13. [Google Scholar] [CrossRef]
  25. Cai, Y.; Chen, J.; Wang, J.; Zhang, Y.; Yang, J. Intelligent diagnosis method based on genetic algorithm optimization and support vector machine for leakage faults of gas valves of marine diesel engines. Chin. Intern. Combust. Eng. Eng. 2022, 43, 71–76. [Google Scholar] [CrossRef]
Figure 1. Logic diagram.
Lubricants 13 00476 g001
Figure 2. Experimental procedure flowchart.
Lubricants 13 00476 g002
Figure 3. Preload fitting curve.
Lubricants 13 00476 g003
Figure 4. Feature distribution visualization under different wear states.
Lubricants 13 00476 g004
Figure 5. Confusion matrix results after dimensionality reduction.
Lubricants 13 00476 g005
Figure 6. Confusion matrix results before dimensionality reduction.
Lubricants 13 00476 g006
Figure 7. Evaluation metrics before and after dimensionality reduction for different labels.
Lubricants 13 00476 g007
Figure 8. Recognition accuracies using various methods.
Lubricants 13 00476 g008
Table 1. Ball screw assembly parameters.
ParameterSymbolValueUnit
Ball diameterDb5.953mm
Pitch circle diameterDm40mm
Helix angleγ4.55°
Contact angleβ45°
LeadPh10mm
Screw material\Gcr15\
Nut material\Gcr15\
Ball material\Gcr15\
Initial preloadFp21.324KN
Dynamic load ratingC48.392KN
Static load ratingC0136.957KN
Circulation mode\Internal circulation\
Lubrication method\Oil lubrication\
Table 2. Results of the confusion matrix for three-class classification.
Actual ClassPredicted Result
123
1abc
2def
3ghi
Disclaimer/Publisher’s Note: The statements, opinions and data contained in all publications are solely those of the individual author(s) and contributor(s) and not of MDPI and/or the editor(s). MDPI and/or the editor(s) disclaim responsibility for any injury to people or property resulting from any ideas, methods, instructions or products referred to in the content.