Abstract
This study develops an integrated methodological approach for interpreting used oil analysis results in diesel engines, focusing on optimizing maintenance strategies. The methodology combines a literature review with a quantitative assessment of 156 lubricant analysis reports from a fleet of diesel waste collection trucks operating in Cuenca, Ecuador, a high-altitude city. The framework includes critical limits for key lubricant parameters, correlation analysis, and Principal Component Analysis (PCA) to identify dominant degradation mechanisms. The Binary Segmentation (BS) algorithm is also used for Change-Point Detection. The findings indicate four primary degradation pathways: thermal–chemical degradation influenced by sulfur, oxidation, and soot; metallic wear and base depletion, involving iron, chromium, and copper; external contamination linked to silica and copper; and viscosity alteration due to lubricant aging. Significant degradation shifts were identified at approximately 346 and 444 service hours, suggesting critical points for condition-based maintenance interventions. This study highlights the effectiveness of multivariate statistical tools in enhancing the interpretation of used oil analysis and optimizing predictive maintenance strategies. The integration of Change-Point Detection and multivariate analysis provides a robust framework for defining oil change intervals based on lubricant condition rather than fixed time- or mileage-based criteria. This approach offers practical benefits for fleet operations, enabling the reduction in operational costs, enhancing engine reliability, and minimizing the environmental impact of unnecessary lubricant changes.
1. Introduction
Used oil analysis has established itself as a key tool in predictive maintenance for diesel engines [1], enabling the assessment of lubricant condition [2], the detection of wear indicators in internal components [3], and the monitoring of external contaminants [4].
Unlike traditional corrective and preventive maintenance approaches, where oil changes are scheduled at a fixed time or mileage intervals without considering the actual degradation of the lubricant, condition-based maintenance (CBM) has proven to be a more efficient strategy, allowing for the extension of oil service life [5,6], reduction in operating costs [7], and minimization of unexpected failures [8]. However, the practical interpretation of used oil analysis remains a challenge, primarily due to the lack of standardized methodologies for accurately evaluating lubricant degradation patterns [9].
Traditionally, studies have relied on predefined condemnation limits for key parameters, such as viscosity, Total Acid Number (TAN), Total Base Number (TBN), wear metal concentrations, and contaminants, such as water and silica [10,11,12,13]. However, these thresholds are often based on limited historical data and manufacturer recommendations, which do not always reflect the variability of real-world engine operating conditions, reducing diagnostic reliability.
To overcome these limitations, advanced approaches based on statistical tools and artificial intelligence have been explored, including linear regression and correlation analysis [14,15,16], as well as Principal Component Analysis (PCA), which has proven effective in reducing data dimensionality and identifying lubricant degradation patterns [17,18,19]. Additionally, advances in machine learning have enabled the implementation of neural networks and predictive algorithms to anticipate diesel engine failures based on historical oil analysis data [20,21,22,23,24]. However, these approaches still have limitations, as most focus on identifying long-term degradation trends without addressing the detection of abrupt changes in lubricant conditions, which restricts their applicability in condition-based maintenance strategies.
In this context, Change-Point Detection (CPD) techniques have emerged as a promising solution for identifying critical transitions in oil conditions, enabling the detection of points where the properties of a time series experience abrupt changes. This makes CPD a widely used tool in anomaly detection, dynamic system monitoring, and fault diagnostics [25,26,27,28,29]. Its applications include parametric and non-parametric methods, as well as advanced versions incorporating neural networks and machine learning techniques to improve detection accuracy and adaptability [28,29,30].
Techniques such as Principal Component Analysis (PCA), Bayesian Online Change-Point Detection (BOCPD) [31,32,33,34], and density ratio estimation have been commonly employed to enhance the precision and efficiency of CPD [26,29,35]. Furthermore, the integration of CPD with oil analysis can significantly strengthen system monitoring and maintenance, as it allows for the detection of abrupt changes in lubricant condition, which may indicate incipient mechanical failures or accelerated wear [36,37,38]. For instance, CPD can be used to identify trend shifts in wear particle concentration or oil contaminants, providing early warnings of potential failures before they become catastrophic breakdowns [39,40,41].
Among CPD techniques, the Binary Segmentation (BS) algorithm has been widely applied for detecting multiple change points without requiring prior knowledge of the expected number of transitions [42,43]. However, when change points are closely spaced, this method may present limitations, leading to the development of enhanced versions, such as Wild Binary Segmentation (WBS), designed to locate both frequent and infrequent changes more accurately [44,45]. Additionally, techniques like Fast Binary Segmentation (FBS) have been optimized for high-dimensional applications [46], while Ensemble Binary Segmentation (EBS) improves analysis robustness by combining multiple evaluations across different data subsets [47].
Furthermore, other methods such as Bayesian Change-Point Detection (BOCPD) [31,32,33,34] and the Cumulative Sum Control Chart (CUSUM) [48,49,50] have been successfully applied in machinery monitoring and industrial processes. However, these methods have certain limitations, including challenges in detecting subtle changes or the need for manual parameter calibration to enhance accuracy.
Despite these advancements, a gap remains in integrating these methodologies into used oil analysis for predictive maintenance applications. Most previous studies have focused on long-term degradation trends without addressing critical moments when lubricants undergo abrupt structural changes, which can serve as key indicators of imminent failures or engine performance anomalies. Additionally, the combination of CPD with multivariate statistical tools has been largely unexplored, limiting its application in the dynamic optimization of oil change intervals.
For this reason, this study aims to develop an advanced methodological framework that integrates CPD with PCA and statistical correlation analysis to improve the interpretation of used oil analysis and enable the real-time identification of critical lubricant degradation points. This approach will optimize maintenance strategies through more accurate oil condition monitoring, reducing unnecessary oil changes and enhancing engine reliability using a data-driven approach.
It is hypothesized that integrating CPD with PCA and correlation analysis will significantly enhance the detection of critical transitions in lubricant degradation, enabling the implementation of more precise and adaptive condition-based maintenance strategies in diesel engines. Furthermore, this integration will provide a more robust framework for dynamically defining oil change intervals, thereby optimizing operating costs and enhancing engine efficiency.
2. Materials and Methods
2.1. Study Design Description
This study employed a mixed-methods approach, consisting of two sequential phases. The first phase involved a literature review aimed at establishing commonly accepted interpretation criteria for analyzing used oil in diesel engines. The review encompassed recent academic publications (from 2019 to 2024) indexed in internationally recognized databases (e.g., Web of Science, Scopus, MDPI, IEEE Xplore) to identify the degradation mechanisms and evaluation parameters most frequently used in the field.
In the second phase, a quantitative analysis was conducted on 156 laboratory reports collected from a fleet of 17 solid waste collection trucks operating in Cuenca, Ecuador, a city situated 2560 m above sea level. Table 1 presents the technical specifications of the fleet trucks, including their emission classification and the associated emission control technologies.

Table 1.
Main characteristics of the trucks.
According to the recommendations specified in the engine’s technical data sheet, these units are lubricated with a multigrade SAE 15W40 CI-4 oil (with a kinematic viscosity of 15.3 cSt at 100 °C and a Total Base Number of 12 mg KOH/g), and a scheduled oil change is programmed every 300 operating hours. However, the available data indicate that this change interval is not consistently met due to the variability in operating conditions and the integral maintenance routines of the fleet.
The diesel fuel used in the fleet was supplied through national distributors and complies with Ecuadorian standard NTE INEN 1489 [52], which permits a maximum sulfur content of 450 ppm. This specification is broadly aligned with the fuel quality required under Euro II–III emission standards.
The sample collection protocol was defined contractually between the fleet owner and the lubricant supplier. Oil samples were extracted at the end of each lubricant’s service period (immediately before an oil change) using the vacuum pump technique.
The oil samples were analyzed by a certified laboratory operating under a quality management system compliant with ISO 9001 [53] and based on technical procedures aligned with ISO/IEC 17025 standards [54]. The analysis was conducted using a Spectroil M spectrometer (Spectro Inc., Chelmsford, MA, USA), which applies rotating disc electrode optical emission spectrometry (RDE-OES) in accordance with ASTM D6595 [55] to quantify wear metals such as chromium, copper, iron, and lead.
An FT-IR spectrometer (Eralytics, Vienna, Austria) was employed to evaluate degradation indicators—oxidation, soot, and sulfur—according to the ASTM E2412 standard [56], which estimates lubricant degradation by analyzing characteristic infrared absorption bands. The resulting values are derived from calibration models embedded in the instrument software and expressed as normalized percentages, representing relative degradation intensity rather than absolute concentration.
Water and fuel contamination was also evaluated by FT-IR; however, these parameters were reported qualitatively in the laboratory reports (positive/negative). According to the laboratory’s criteria, contamination is considered positive when fuel dilution exceeds 1% or water exceeds 0.1%.
Kinematic viscosity at 100 °C was measured using a thermostatic viscosity bath in accordance with ASTM D445 [57], while the Total Base Number (TBN) was determined according to the ASTM D2896 procedure [58].
The laboratory reports provided measurements of various parameters grouped into (i) wear indicators (e.g., chromium, copper, iron, and lead concentrations measured in ppm), (ii) oil condition parameters (including kinematic viscosity measured at 100 °C, Total Base Number (TBN), oxidation, soot, and sulfur percentage), and (iii) contamination markers (such as the presence of water, fuel, and silica concentration measured in ppm). However, according to the laboratory’s established protocol, any sample exhibiting detectable levels of water or fuel contamination is excluded from analysis. Consequently, this parameter is reported as negative for all examined samples.
It is worth noting that the operational profile of the fleet, dedicated to solid waste collection, entails frequent stop-and-go driving, high load conditions, and low-speed operation across urban routes. These factors, combined with the high-altitude environment, are known to reduce combustion efficiency and increase soot formation within the engine, which may influence lubricant degradation patterns under these conditions.
2.2. Quantitative Analysis Methodology
For the quantitative analysis, the methodology integrated three complementary levels as follows:
- The determination of condemning limits was established for each key parameter based on historical data and technical recommendations from the literature review. These thresholds serve to flag unacceptable lubricant degradation levels, indicating the need for immediate corrective action.
- Correlation and interaction analysis was performed through statistical tools, such as Pearson correlation tests and Principal Component Analysis (PCA), to identify significant relationships among parameters. This step enabled a global assessment of the engine–lubricant system, highlighting significant correlations (e.g., sulfur, oxidation, and soot) indicative of combustion-related degradation phenomena.
- Change-Point Detection employed the Binary Segmentation (BS) algorithm to detect statistically significant shifts in lubricant degradation patterns over time. Detected change points were validated using the Wald test (p < 0.05 highly significant, p < 0.10 moderately significant). A sensitivity analysis was also conducted to confirm the robustness of the identified shifts. This approach supports condition-based definitions of oil service intervals, optimizing lubricant maintenance strategies based on actual degradation behavior.
2.3. Statistical Techniques Description
To assess the relationships between different oil analysis parameters, Pearson’s correlation coefficient [59], denoted as , was computed to quantify the strength of the linear association between two variables, X and Y, using the formula expressed in Equation (1) as follows:
where and are the sample means of each variable, and , respectively.
To reduce dimensionality and capture interaction effects among multiple parameters, Principal Component Analysis (PCA) was applied [60]. PCA applies an orthogonal transformation to convert a set of correlated variables into a new coordinate system in which the transformed variables (principal components) are uncorrelated. Algebraically, this approach diagonalizes the covariance (or correlation) matrix of the data, while geometrically, it shifts the axes to the directions along which the data shows the most significant variance.
The correlation matrix is constructed from the standardized variables and then solved for its eigenvalues and eigenvectors. Mathematically, the correlation matrix is defined as shown in Equation (2) as follows:
where is the correlation coefficient between the i-th and j-th variables, and n represents the total number of variables. The eigenvalue problem is defined in Equation (3) as follows:
where represents the eigenvalues λ1, λ2, …, λn, and denotes the corresponding eigenvectors for . Each eigenvector is a vector with n elements, which can be expressed as shown in Equation (4) as follows:
The eigenvector provides a direction in the original variable space along which the data exhibit maximal variance, and the associated eigenvalue quantifies the amount of variance captured by that direction.
The transformed variables, known as principal components , , …,, are linear combinations of the original parameters. The principal components can be written as described in Equation (5) as follows:
where the notation indicates the j-th element of the m-th eigenvector.
Typically, only a few of the first principal components are needed to explain most of the variance in the data, making PCA an effective tool for revealing underlying patterns while mitigating redundancy among variables.
The temporal evolution of lubricant degradation was analyzed using Change-Point Detection (CPD), a statistical methodology that identifies moments when significant shifts occur in the behavior of lubricant parameters. Specifically, the Binary Segmentation (BS) algorithm [61] was employed, which systematically divides the dataset into segments, searching for points at which lubricant degradation patterns change significantly. The BS algorithm solves an optimization problem defined as shown in Equation (6) as follows:
where represents the selected cost function, denotes the number of identified segments, and γ is a penalty parameter that controls the method’s sensitivity to identifying change points.
The selected cost function was the quadratic error loss, also known as the sum of squared deviations. This function quantifies how closely the observations within a segment cluster around their mean. The quadratic error loss is mathematically expressed as follows in Equation (7):
where is the observed lubricant parameter value at time , and is the average of the observations from time to . This quadratic error loss function aligns with the maximum likelihood estimation (MLE) described in [55].
To statistically verify the significance of the identified change points, the Wald test [62] was applied. This statistical test evaluates the null hypothesis of parameter stability—meaning no structural change occurs—against the alternative hypothesis that a significant shift in regression parameters exists at the identified change points.
The Wald statistic () compares the regression coefficients estimated from data segments before and after each potential change point. The statistic is mathematically defined in Equation (8) as follows:
where is the vector of regression parameters estimated from data before the detected change point, is the vector of regression parameters estimated from data after the detected change point, and is the covariance matrix associated with the difference in parameter estimates, capturing the statistical uncertainty of this difference.
The statistical significance of the computed Wald statistic () is assessed by comparing it against a chi-squared (χ2) distribution, with degrees of freedom equal to the number of parameters tested. The detected structural breaks were considered highly significant at a significance level of p < 0.05 and moderately significant at p < 0.10.
This methodological framework provides robust validation for identifying structural changes in lubricant degradation patterns, thereby enabling accurate, data-driven definitions of optimal lubricant maintenance intervals.
Although the dataset does not correspond to a strict time series, the oil samples were systematically collected at the end of each lubricant service interval. This consistent sampling strategy allowed the construction of a pseudo-time series, aligned by operational hours, enabling the application of CPD techniques to detect statistically significant shifts in lubricant degradation patterns across the fleet. The analysis focuses on structural transitions in aggregated behavior rather than tracking individual engine evolution over time.
3. Results
3.1. Descriptive Analysis of Lubricant Condition Parameters
A preliminary descriptive analysis was conducted on the dataset comprising 156 used oil analysis reports from a fleet of 17 diesel-powered solid waste collection trucks. The dataset includes key indicators categorized into wear elements, oil condition parameters, and contamination markers. The statistical summary of these parameters is provided in Table 2.
Table 2.
Statistical summary of lubricant parameters.
The analysis revealed that the most variable parameters were oxidation (mean = 30.60%, SD = 25.62%), soot (mean = 18.53%, SD = 17.96%), and sulfur (mean = 37.85%, SD = 30.52%), which exhibit considerable dispersion across the dataset. These values, obtained via FT-IR spectroscopy, correspond to normalized intensity indicators derived from spectral absorbance and calibration models. As such, they reflect relative degradation levels rather than absolute concentrations.
The elevated soot content can be attributed to the fleet’s operational context—urban waste collection under high-load, low-speed, and stop-and-go conditions at high altitudes—which promotes incomplete combustion and soot accumulation in the lubricant. Short-term operational fluctuations, recent oil top-ups, or variations in fuel composition may also contribute to the observed variability in these indicators.
Conversely, wear metal concentrations, including iron (mean = 11.02 ppm, SD = 5.01 ppm) and lead (mean = 0.91 ppm, SD = 1.15 ppm), remained within moderate levels, suggesting controlled wear processes under the fleet’s operating conditions. In the case of elements such as chromium and copper, the low mean values result from a high frequency of non-detectable readings, as concentrations are reported in whole numbers starting from 1 ppm.
3.2. Definition of Condemning Limits
To establish a framework for assessing lubricant degradation, condemning limits were defined for each critical parameter based on technical literature, historical fleet data, and manufacturer recommendations. These limits categorize lubricant condition into three categories: normal, when the parameter falls within acceptable operational ranges; cautionary, when the parameter exhibits deviations that may indicate early-stage degradation but do not necessitate immediate intervention; and critical, when the parameter exceeds predefined thresholds, indicating an urgent need for maintenance action.
Table 3 presents the established condemning limits for key lubricant condition parameters.
Table 3.
Condemning limits for lubricant parameters.
3.3. Correlation and Principal Component Analysis
The analysis of correlations among lubricant degradation indicators provides valuable insights into the interdependence between wear elements, oil condition parameters, and contamination markers. Pearson correlation coefficients were computed for all parameters, and the results are presented in Figure 1, which depicts the correlation matrix as a heatmap.
Figure 1.
Correlation matrix of lubricant parameters.
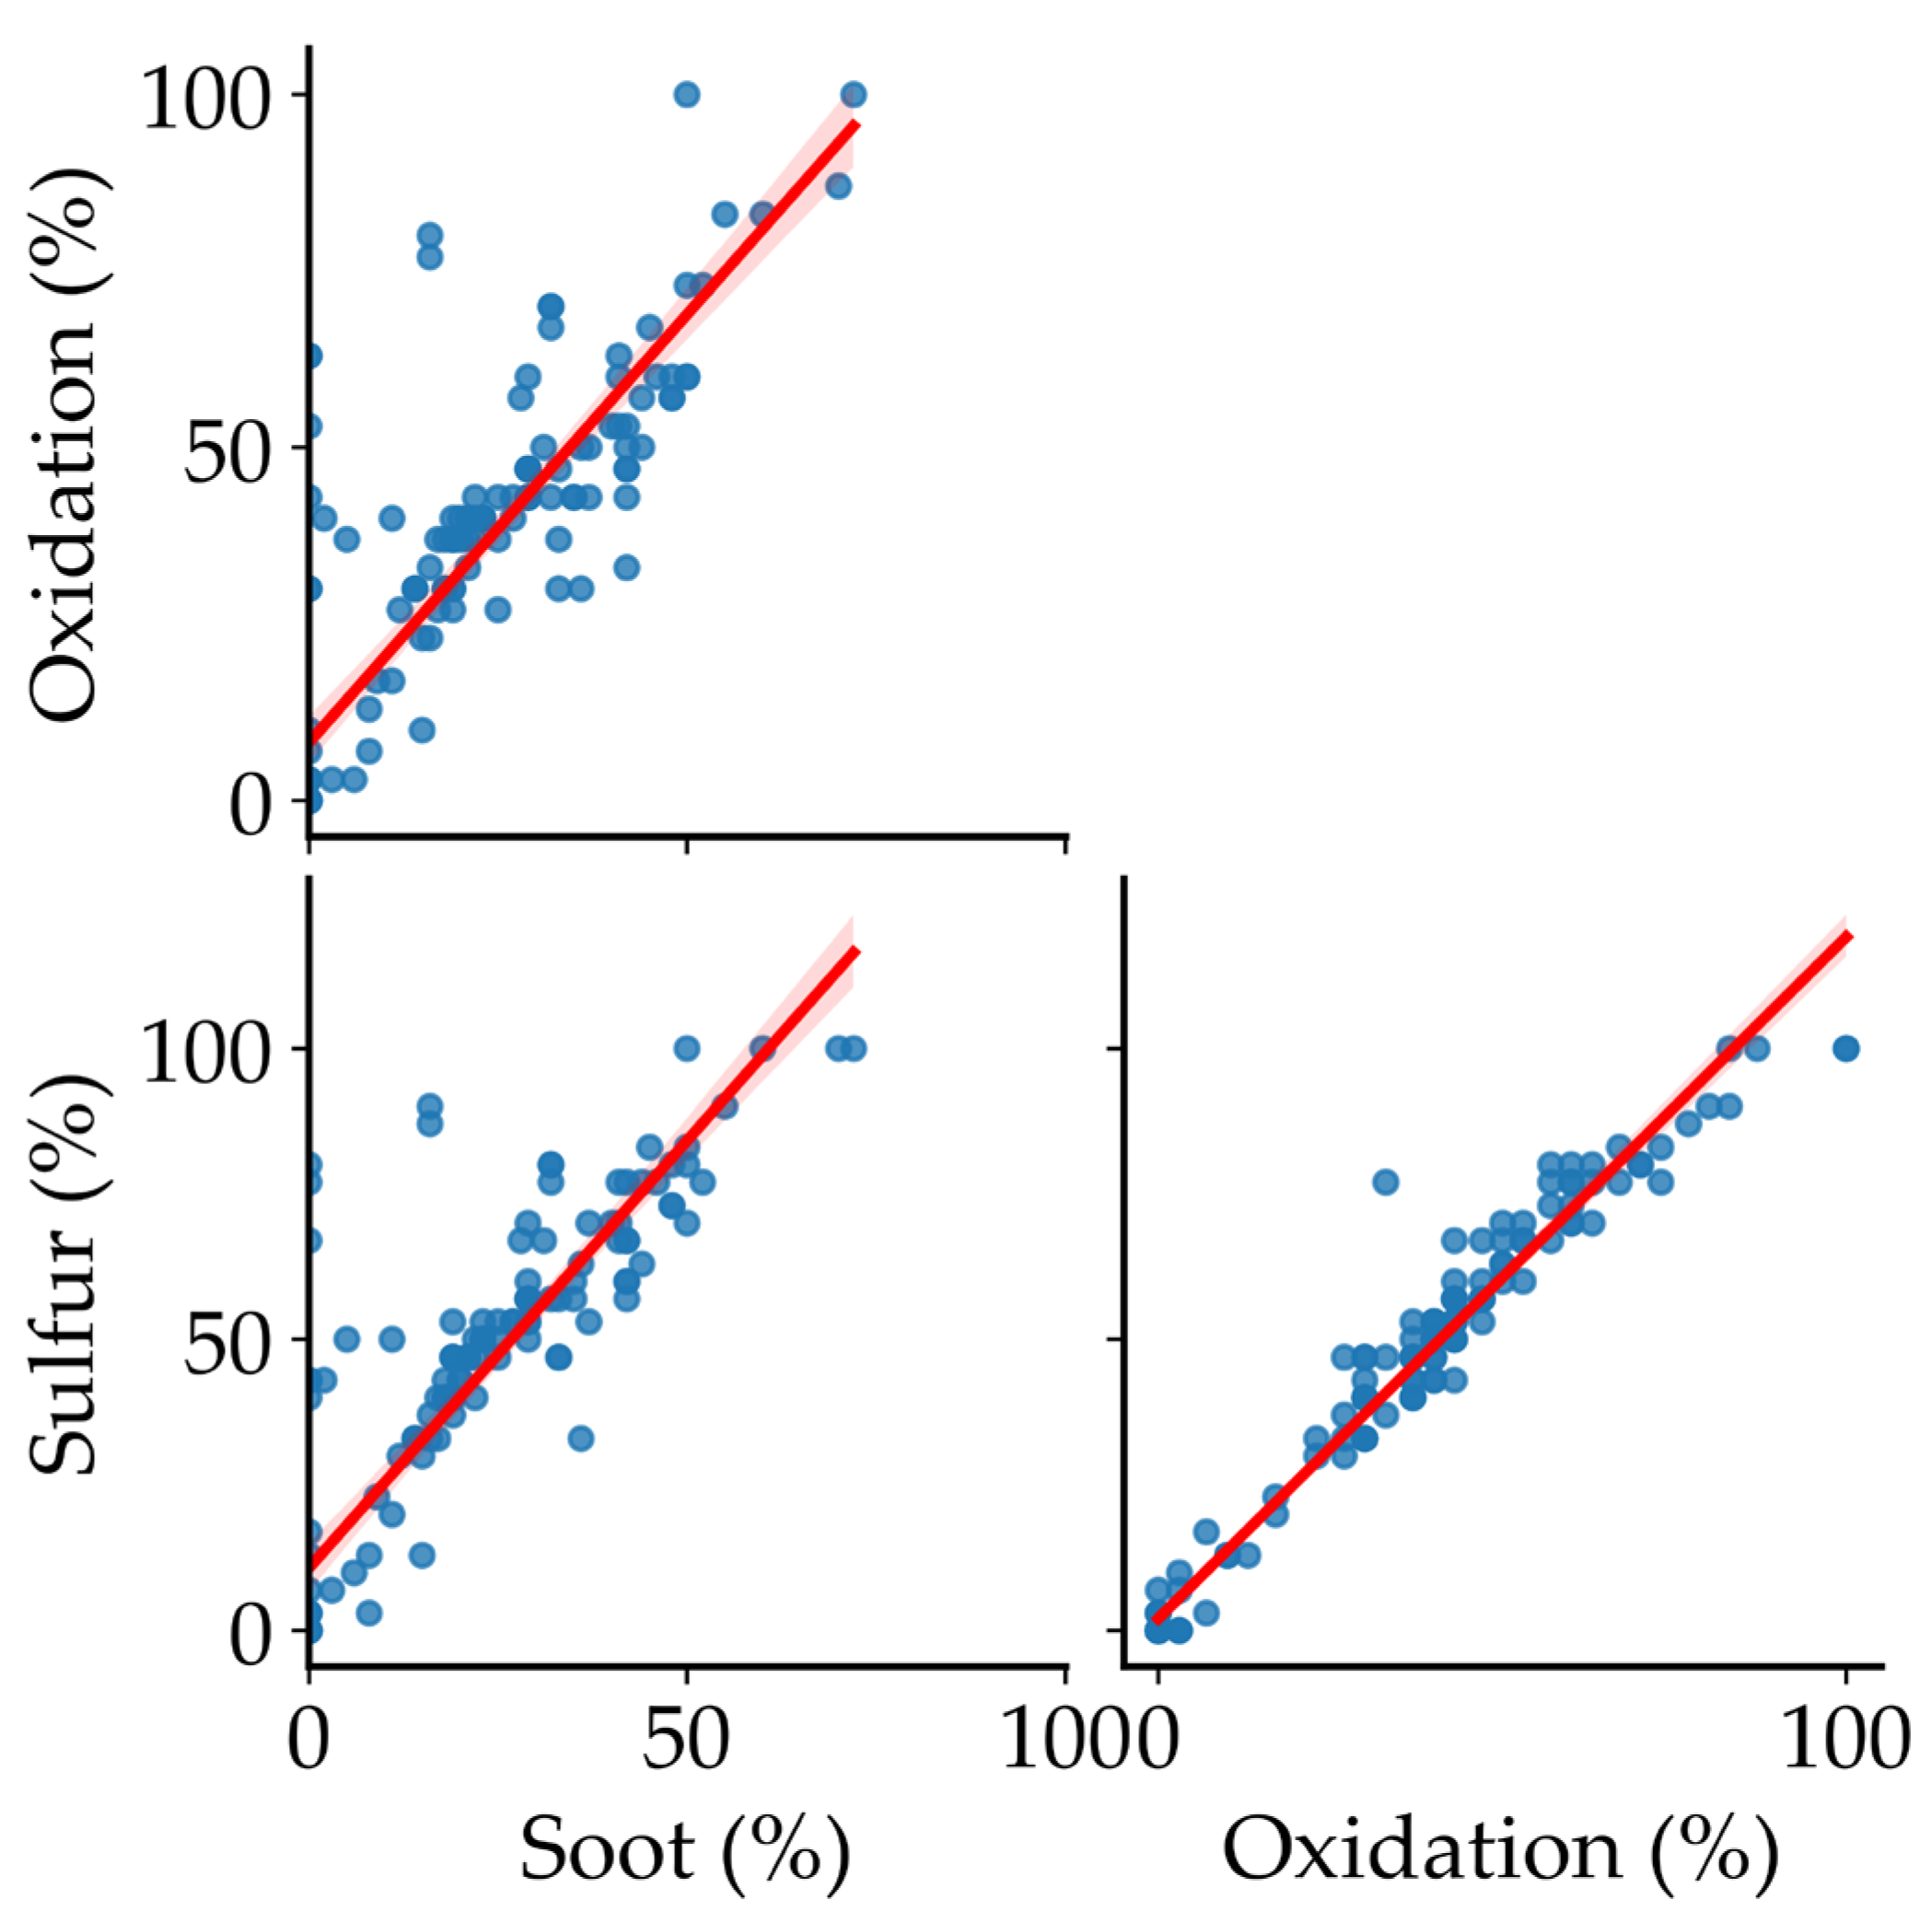
Strong positive correlations were observed among key degradation indicators, particularly those associated with combustion byproducts and oil oxidation processes. Notably, sulfur and oxidation exhibited a strong correlation (r = 0.983, p < 0.05), as well as sulfur and soot (r = 0.864, p < 0.05) and oxidation and soot (r = 0.851, p < 0.05), indicating a common degradation pathway related to incomplete combustion and thermal breakdown.
Figure 2 presents scatter plots generated to explore these relationships, highlighting the linear trends that characterize these degradation mechanisms.

Figure 2.
Scatter plots showing strong linear correlations between soot, sulfur, and oxidation (%). The blue points represent individual data observations, and the red lines indicate the fitted linear regression trends.
3.4. Principal Component Analysis (PCA)
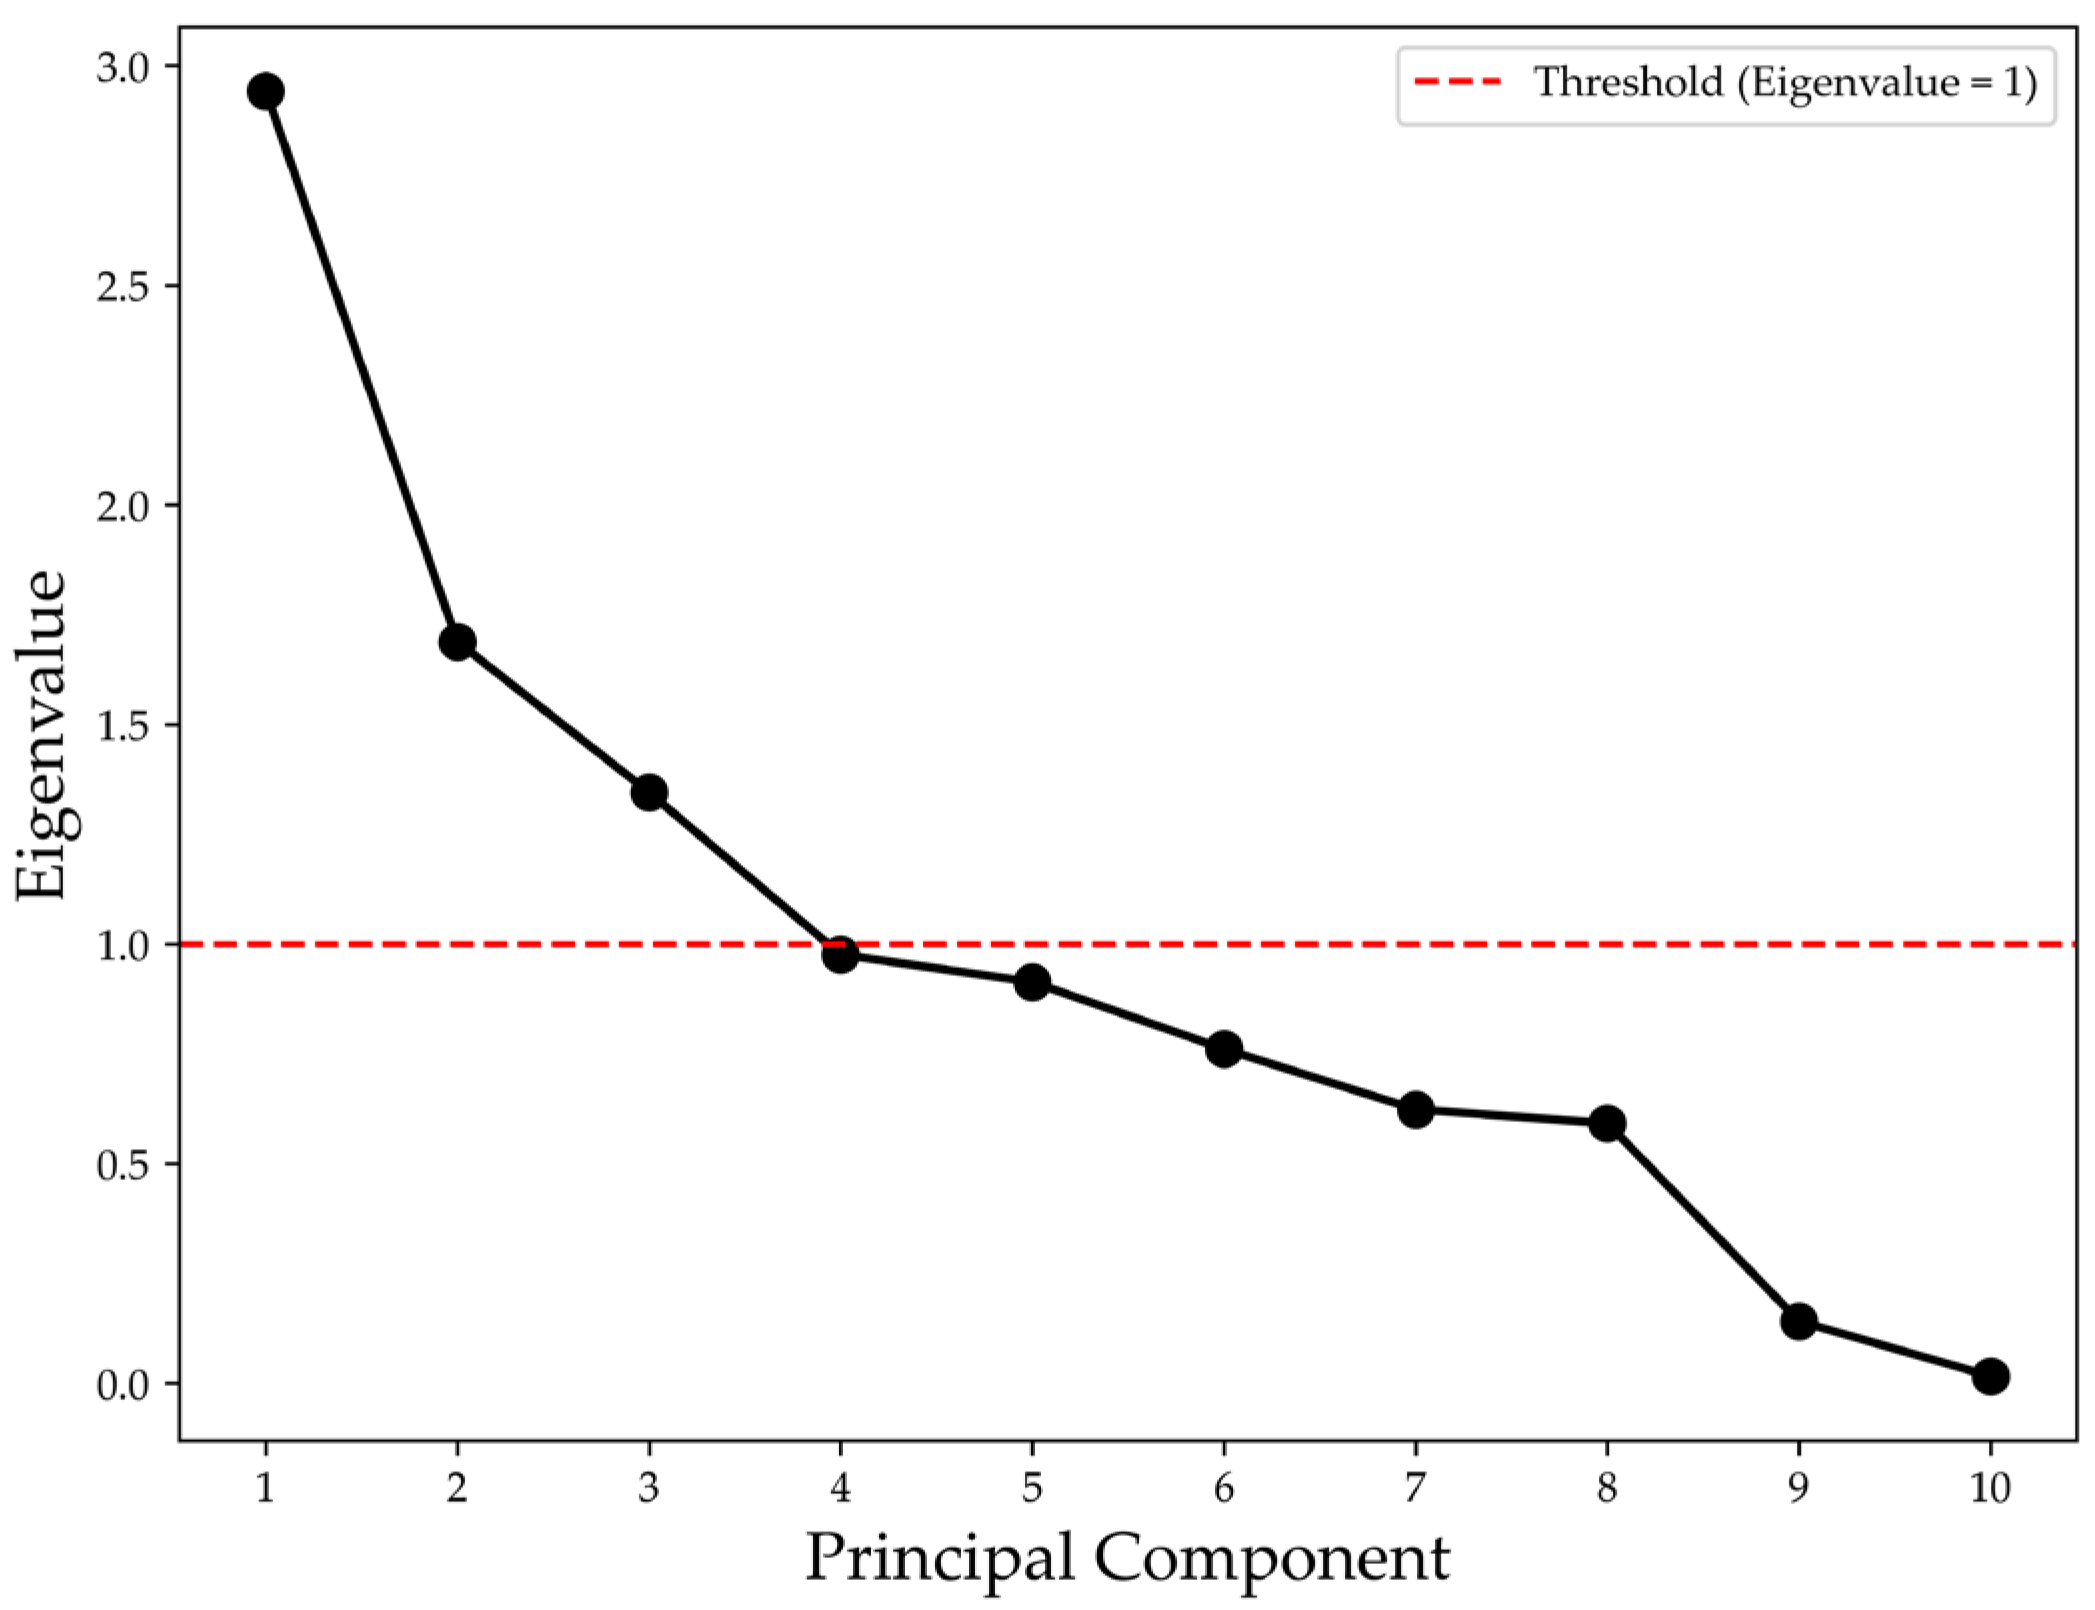
To reduce dimensionality and identify dominant degradation mechanisms, Principal Component Analysis (PCA) was applied to the standardized dataset. Four principal components with eigenvalues greater than or close to 1 were retained, cumulatively explaining 69.5% of the total variance, as detailed in Table 4.
Table 4.
Eigenvalues and explained variance for principal components.
The corresponding scree plot in Figure 3 illustrates the contribution of each principal component to the total variance and supports the decision to retain the first four components for interpretation.
Figure 3.
Scree plot of principal components.
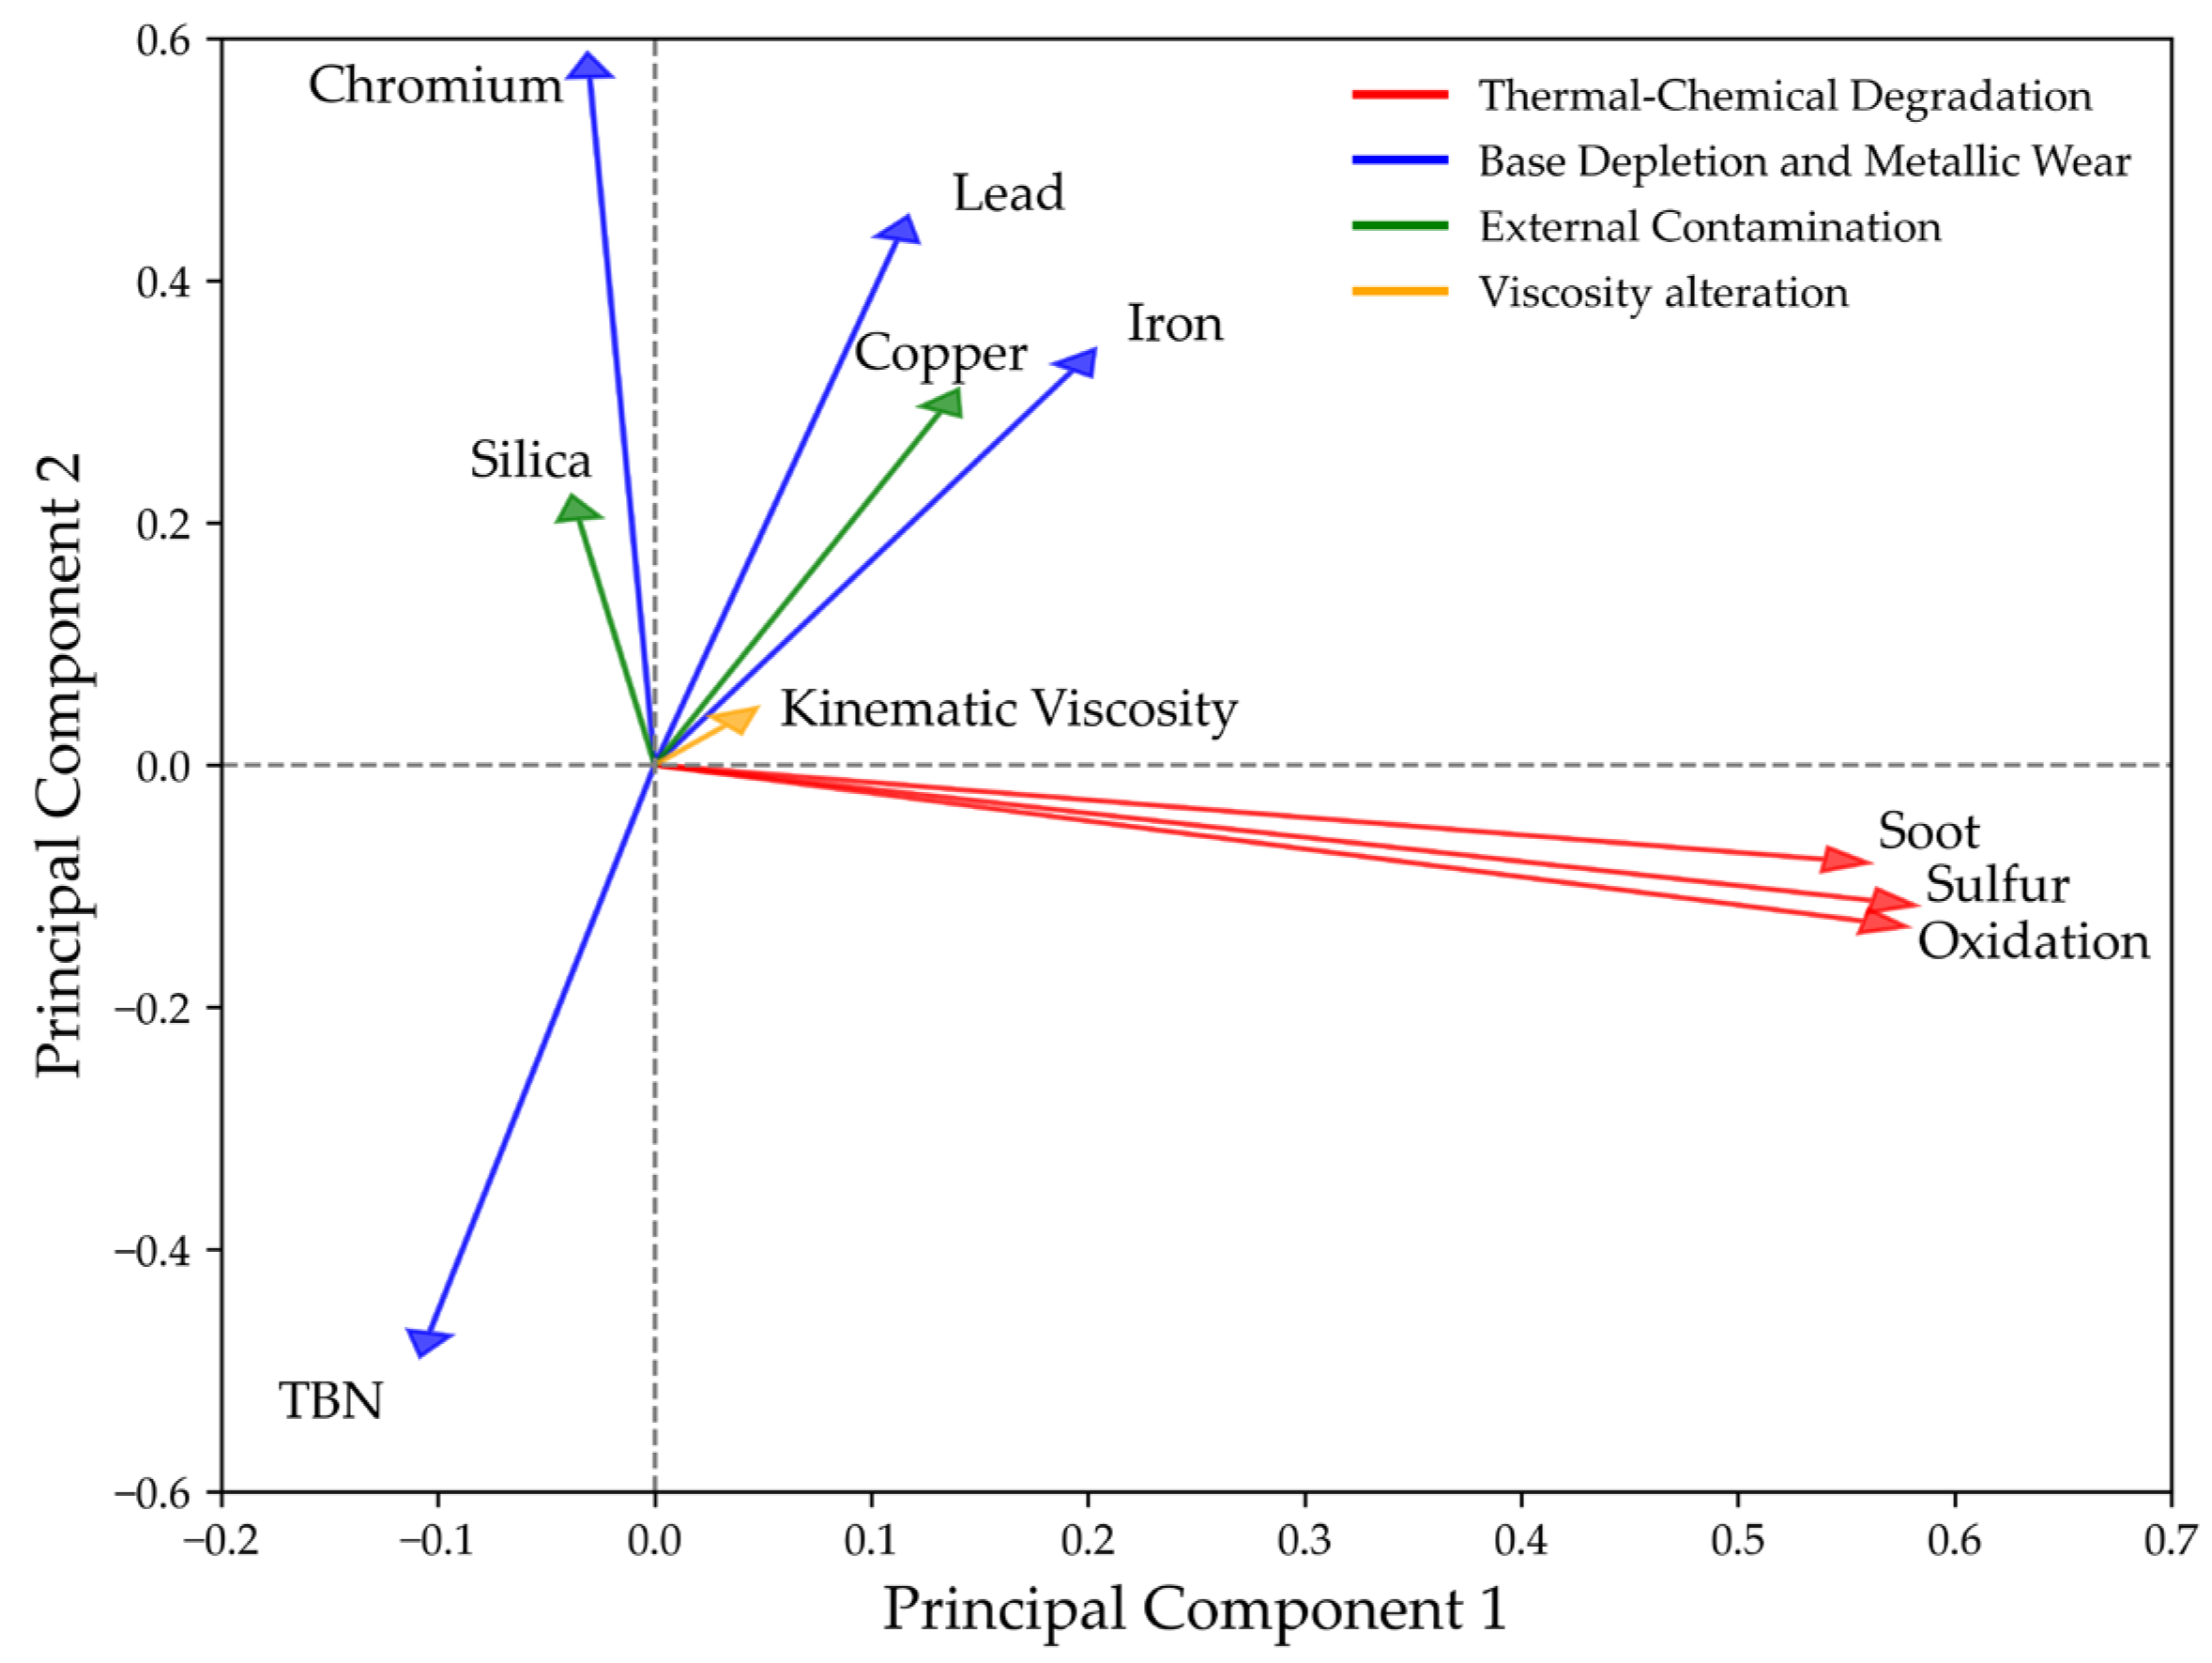
To facilitate interpretation, Table 5 presents the variable loadings for each component. Variables were interpreted based on their relative contribution to each principal component, prioritizing those with the highest loadings per component.
Table 5.
Principal component loadings for key lubricant degradation indicators.
PC1 (29.4%) is associated with soot, sulfur, and oxidation, which are indicators of thermal–chemical degradation processes driven by combustion byproducts. PC2 (16.9%) reflects metallic wear processes, with strong contributions from chromium, lead, and iron. These are typical wear metals originating from engine components. The negative loading of TBN suggests an inverse relationship between wear intensity and the lubricant’s alkaline reserve, indicating chemical depletion in conjunction with mechanical degradation.
PC3 (13.5%) is dominated by silica and copper, pointing to contamination by external particles and potential abrasive effects. PC4 (9.8%) is predominantly driven by changes in lubricant viscosity, suggesting thickening phenomena linked to oil aging or extended service intervals.
Figure 4 presents a biplot illustrating the projection of variables along the first two principal components. This representation highlights the dominance of soot, sulfur, and oxidation in PC1 and the grouping of wear metals (chromium, lead, iron) in PC2. It should be noted that variables such as kinematic viscosity, which are more strongly associated with PC4, appear near the origin in this projection due to their limited contribution to PC1 and PC2.
Figure 4.
Biplot of PC1 vs. PC2 with variable loadings colored by their primary degradation pattern.
3.5. Change-Point Detection
The Change-Point Detection (CPD) analysis identified significant structural shifts in lubricant degradation parameters, reflecting critical transitions in lubricant performance during service intervals. Table 6 summarizes the results obtained by applying the Binary Segmentation (BS) algorithm and subsequent statistical validation using the Wald test.
Table 6.
Summary of Change-Point Detection results.
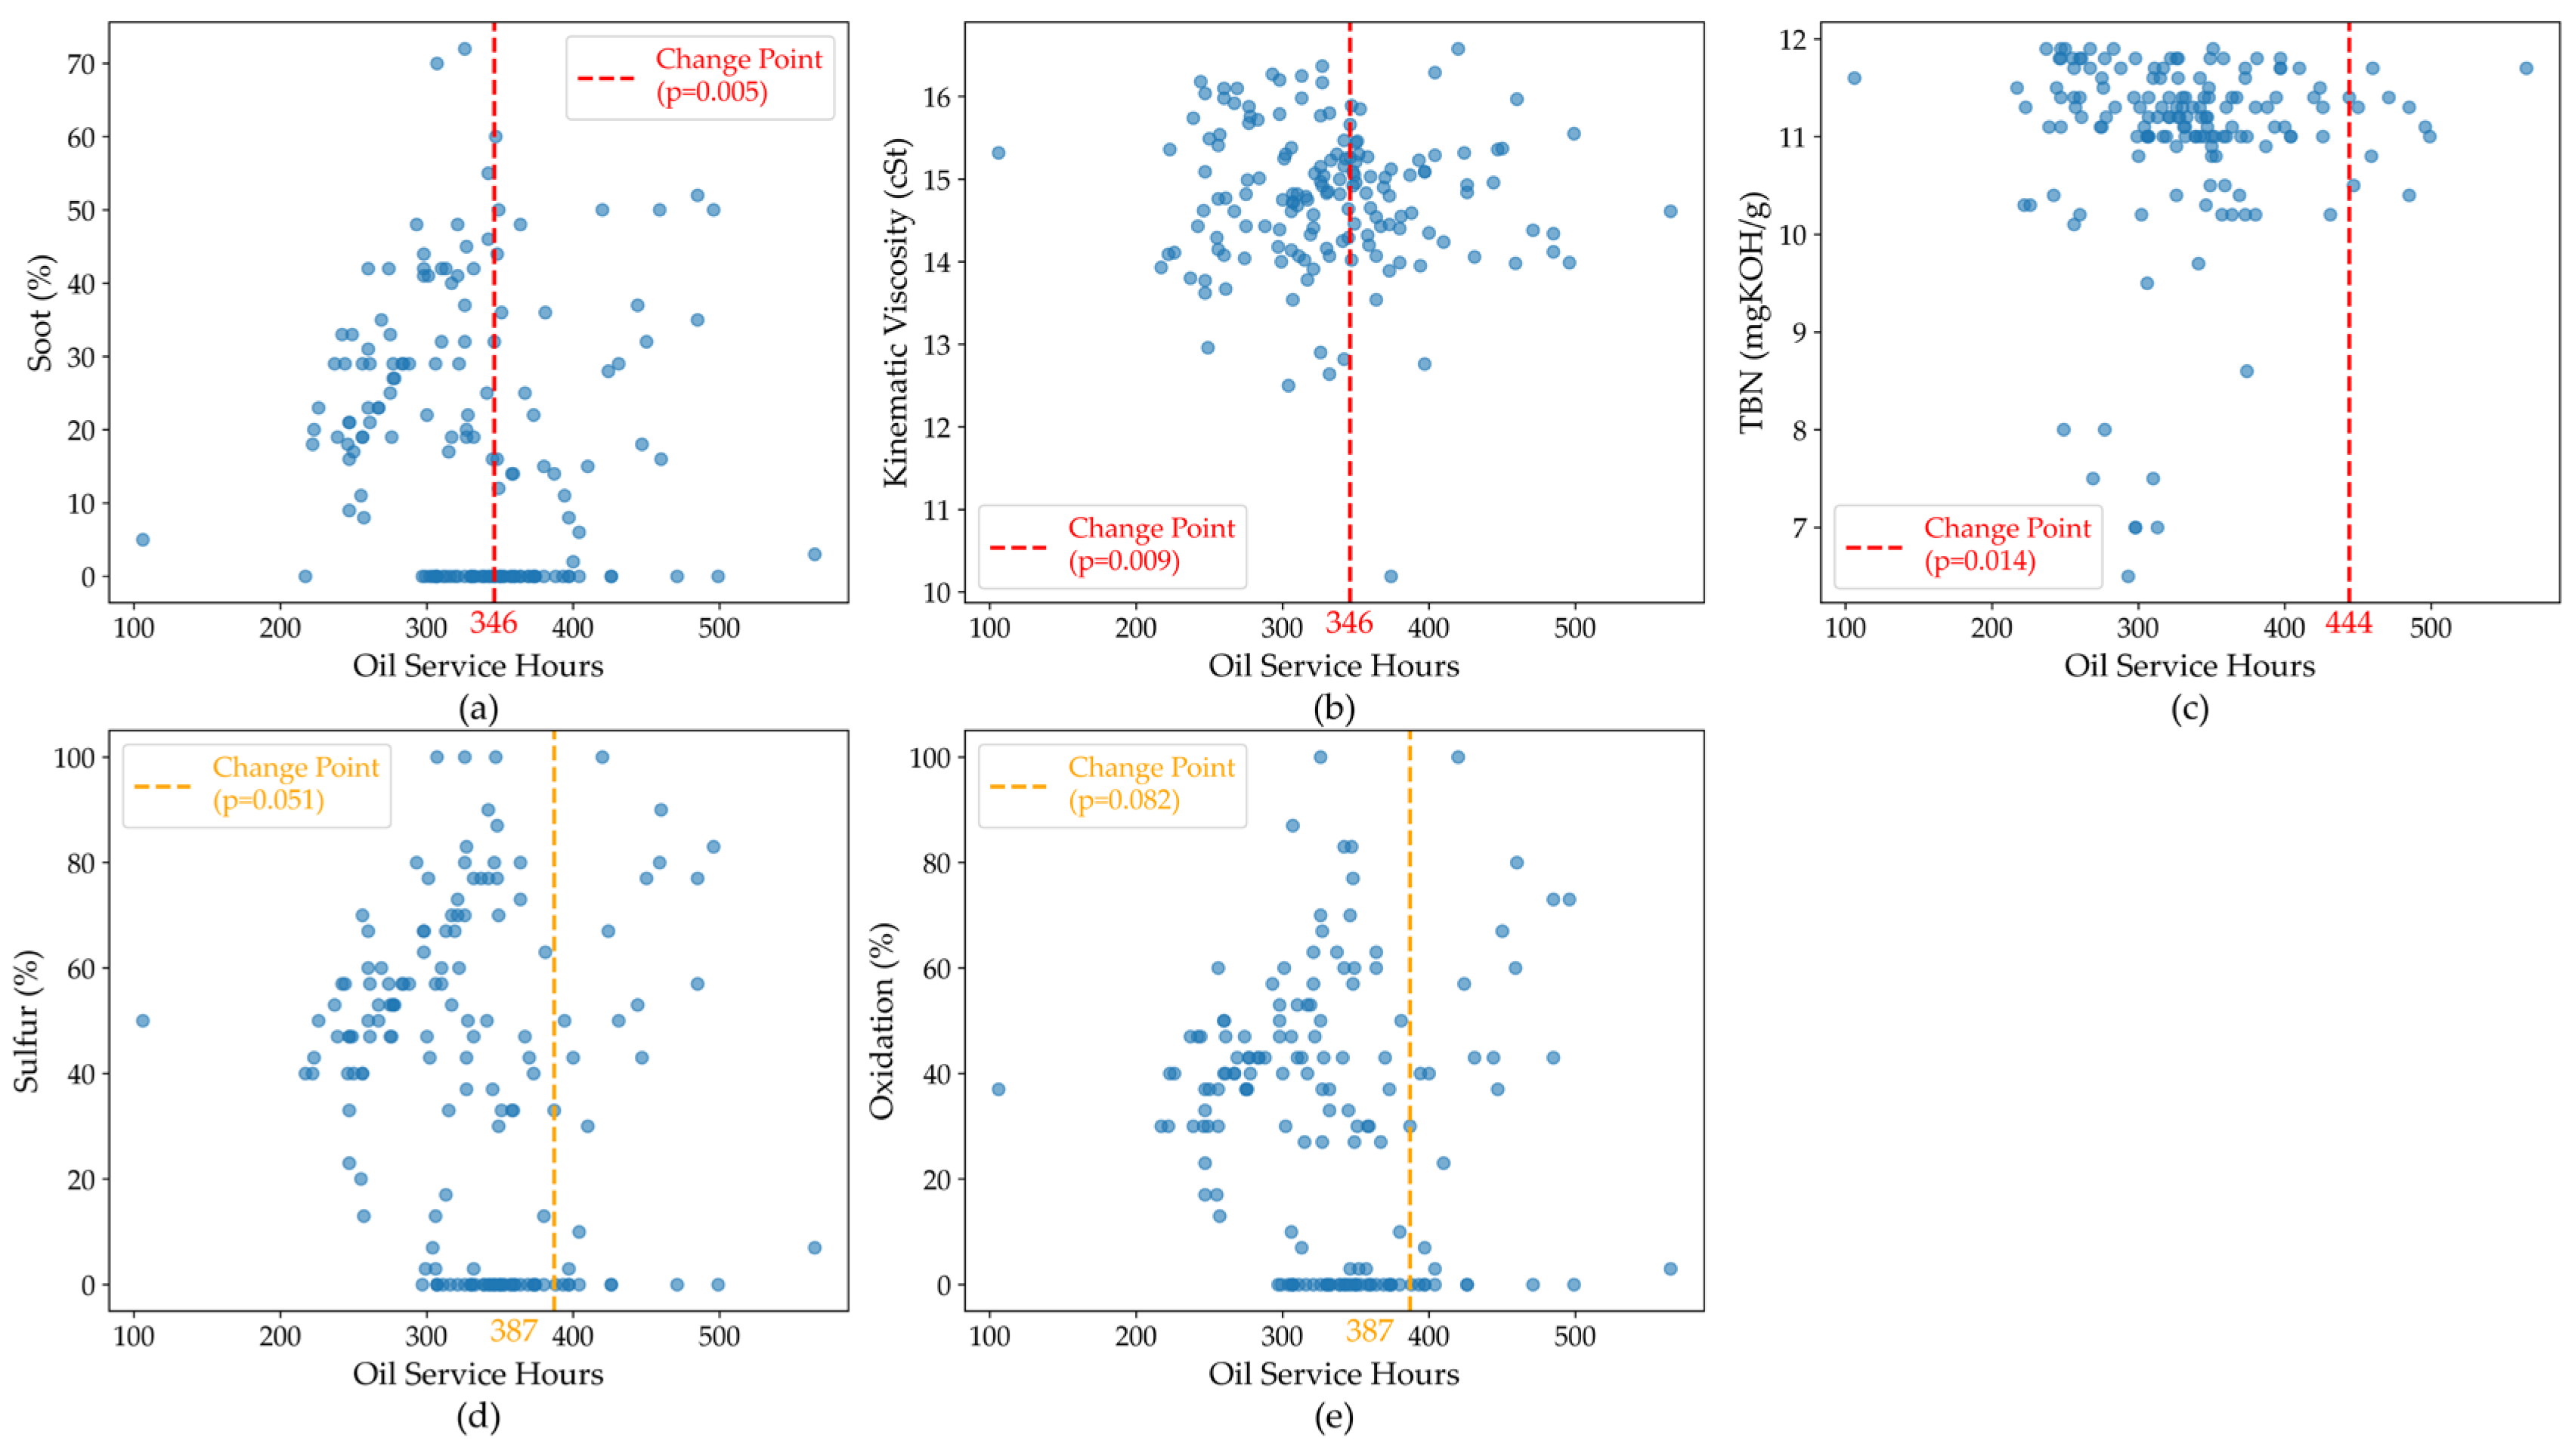
Statistically significant shifts were observed for soot and kinematic viscosity at 346 service hours, while a considerable shift in TBN was identified at 444 service hours. Moderately substantial changes were also detected for oxidation and sulfur parameters at 387 service hours. These identified change points indicate clear and relevant transitions in lubricant degradation dynamics, signaling critical moments at which lubricant performance significantly deteriorates, necessitating corrective maintenance actions.
The graphical distribution of parameters exhibiting significant and moderately significant change points is illustrated in Figure 5. These plots provide a visual representation of lubricant degradation trends, highlighting the identified statistical transitions that denote significant changes in the lubricant’s performance and condition. This emphasizes the importance of condition-based maintenance intervals informed by actual operational data rather than predefined schedules.
Figure 5.
Distribution of parameters with statistically significant and moderately significant change points.
A sensitivity analysis was conducted by varying the penalty parameter (γ) within the BS algorithm to assess the robustness of identified change points. Table 7 summarizes these results, showing that the most critical change points are consistently detected across different analytical scenarios, thus reinforcing their reliability.
Table 7.
Sensitivity analysis of the penalty parameter for Change-Point Detection.
The consistency of these findings across various analytical conditions highlights the robustness of the methodology and the practical significance of defining lubricant maintenance intervals based on actual degradation data rather than traditional time-based strategies.
It is essential to clarify that the change points identified in this study do not correspond to actual oil drain events but rather to statistically significant transitions in the operational behavior of each lubricant parameter. Since these parameters reflect distinct physicochemical degradation mechanisms, the timing of such transitions naturally varies.
The purpose of the CPD analysis is not to establish a universal replacement threshold but to identify inflection points that reveal the onset of significant changes in lubricant condition. These findings enhance the understanding of degradation dynamics and support the development of more targeted, condition-based maintenance strategies.
4. Discussion
This study provided a comprehensive understanding of lubricant degradation mechanisms in diesel engine fleets by integrating various quantitative analytical techniques. Initially, the establishment of condemning limits based on historical data and literature recommendations allowed the identification of critical thresholds, providing a practical basis for timely maintenance interventions.
Correlation analysis, including Pearson’s coefficients, highlighted significant interactions among lubricant parameters. Strong relationships, notably between oxidation, sulfur, and soot, corroborate prior findings on combustion-induced lubricant degradation phenomena, underscoring their potential as key diagnostic indicators.
The use of Principal Component Analysis (PCA) further simplified the complexity inherent in analyzing multiple correlated parameters, offering insights into the predominant factors influencing lubricant condition. The PCA identified four principal components, which together explained 69.5% of the total variance. Each component was associated with a distinct degradation mechanism: thermo-chemical effects (PC1), metallic wear and base depletion (PC2), external contamination (PC3), and viscosity alteration due to aging (PC4). This multivariate structure enhanced the interpretability of the degradation profiles across the dataset.
The elevated levels of soot, oxidation, and sulfur observed in this study play a central role in understanding lubricant degradation under severe operating conditions. These parameters, measured via FT-IR spectroscopy in accordance with ASTM E2412, are reported as normalized absorbance indices and should be interpreted as relative indicators of chemical and physical stress. Soot accumulation has a direct impact on viscosity increase and wear acceleration, which highlights the importance of monitoring these indicators for condition-based maintenance decisions.
It is essential to recognize that the dataset does not constitute a conventional time series, as the oil samples were not collected sequentially from the same engines. However, the sampling protocol was standardized, with oil samples consistently taken at the end of each lubricant service interval. This allowed the dataset to be aligned according to operational hours, enabling the application of change-point detection techniques to identify statistically significant shifts in degradation behavior across.
Although each unit in the dataset includes repeated measurements, the analysis was designed to identify structural degradation patterns at the fleet level through operationally time-aligned data. This approach prioritizes consistency and statistical robustness across the system, without disregarding the potential value of individual unit analysis.
The Change-Point Detection (CPD) complemented these analyses by pinpointing statistically significant transitions in lubricant condition. Apparent structural changes were detected in soot content and kinematic viscosity at approximately 346 service hours and in TBN at 444 h. Moderate shifts were observed in sulfur and oxidation parameters at 387 h, indicating that specific operational conditions may have influenced more subtle transitions. Sensitivity analysis reinforced the reliability of the CPD methodology, highlighting its practical potential for condition-based maintenance decision making.
This study has some limitations that may impact the interpretation of the results. Although fuel sulfur content was not directly measured, it is known to be relatively high under Ecuadorian regulations, comparable to Euro II–III standards. Combined with the reduced combustion efficiency typical of high-altitude operation, this may have amplified certain degradation effects. Additionally, oil top-up volumes were not systematically recorded, which limited the ability to assess their impact on lubricant condition. Future studies should incorporate more detailed operational data to strengthen diagnostic accuracy.
These findings reinforce the value of transitioning from fixed-interval maintenance to condition-based strategies. Future research should explore the integration of real-time monitoring and predictive analytics to further improve decision making, reliability, and cost efficiency in fleet operations.
5. Conclusions
The present study systematically integrated statistical methodologies, including threshold definition, correlation analyses, Principal Component Analysis (PCA), and rigorous Change-Point Detection, to characterize lubricant degradation in diesel engine fleets effectively.
The determination of condemning limits based on literature recommendations and historical data proved effective in identifying critical thresholds requiring immediate corrective action. Correlation and PCA analyses facilitated a deeper understanding of lubricant–parameter interactions, particularly those related to combustion phenomena (soot, oxidation, and sulfur), providing comprehensive insights into the underlying degradation mechanisms.
Furthermore, the Binary Segmentation algorithm for Change-Point Detection allowed precise identification of statistically significant degradation transitions. Robust shifts were detected at specific service intervals (346 h for soot and viscosity and 444 h for TBN), reinforcing the practical advantage of condition-based monitoring over fixed-time maintenance strategies. Moderate significance was also observed for oxidation and sulfur, highlighting additional, subtle signals of lubricant deterioration that are worth monitoring.
The sensitivity analysis further confirmed the robustness of identified change points, underscoring the methodological reliability and potential practical applications in maintenance management.
These results support fleet managers and maintenance engineers in developing more precise, efficient, and economical lubricant maintenance intervals. Future work may focus on leveraging these results through real-time condition monitoring systems and predictive analytics, improving asset reliability, reducing unnecessary maintenance costs, and optimizing overall fleet operational efficiency.
Author Contributions
Conceptualization, R.R.C. and C.G.G.; methodology, R.R.C., C.G.G. and M.G.T.; software, R.R.C.; validation, R.R.C., C.G.G., M.G.T. and J.F.M.; formal analysis, R.R.C., M.G.T. and J.F.M.; investigation, R.R.C., M.G.T. and C.G.G.; resources, C.G.G. and J.F.M.; data curation, R.R.C. and C.G.G.; writing—original draft preparation, R.R.C. and M.G.T.; writing—review and editing, R.R.C., M.G.T., C.G.G. and J.F.M.; visualization, R.R.C.; supervision, R.R.C. All authors have read and agreed to the published version of the manuscript.
Funding
This research received no external funding.
Data Availability Statement
The data presented in this study are available on request from the corresponding author due to confidentiality agreements with the fleet operator and institutional restrictions.
Conflicts of Interest
The authors declare no conflict of interest.
References
- Amrani, M.A.; Haddad, Y.; Abdulhameed, M.; Hyder, O.S.; Saif, A.; Ghaleb, A.M.; Mejjaouli, S. A Lubricating Oil-Based Maintenance for Diesel Engines at the End-User: An Effective Predictive Approach. Jordan J. Mech. Ind. Eng. 2022, 16, 689–700. [Google Scholar]
- Santana, N.S.; Silva, G.A.; Mothé, C.G.; Mothé, M.G. Evaluation of Lubricating Oil in Marine Diesel Engine Using Thermal Analysis, FTIR, and Rheology. J. Therm. Anal. Calorim. 2022, 147, 13261–13274. [Google Scholar] [CrossRef]
- Azevedo, K.; Olsen, D.B. Engine Oil Degradation Analysis of Construction Equipment in Latin America. J. Qual. Maint. Eng. 2019, 25, 294–313. [Google Scholar] [CrossRef]
- Kaminski, P. Investigation Lubricity Performance of Lubricating Oil Used in Marine Diesel Engine—Fuel Injection Pump. Appl. Sci. 2024, 14, 6148. [Google Scholar] [CrossRef]
- Ma, H.-G.; Wu, J.-P.; Li, X.-Y.; Kang, R. Condition-Based Maintenance Optimization for Multicomponent Systems under Imperfect Repair-Based on RFAD Model. IEEE Trans. Fuzzy Syst. 2019, 27, 917–927. [Google Scholar] [CrossRef]
- Do, P.; Hoang, A.; Iung, B.; Vu, H.-C. Energy Efficiency for Condition-Based Maintenance Decision-Making: Application to a Manufacturing Platform. Proc. Inst. Mech. Eng. O. J. Risk Reliab. 2018, 232, 379–388. [Google Scholar] [CrossRef]
- Anurag, G.; Akshay, C.; Menon, A.; Akshitha, N.; Giri, A. Predictive Analysis of Outages and Enhanced Network Optimization for Industrial IoT System. In Proceedings of the International Conference on Smart Computing and Communication, Bali, Indonesia, 25–27 July 2024; Volume 947, Lecture Notes in Networks and Systems. ISBN 9789819713257. [Google Scholar]
- Al-Saedi, K.; Al Awadhi, H.; Ddin Kalhoro, M.U.; Nadeem, M.; Al Harmi, S.; Al Halabi, S. Leveraging Condition Based Major Overhaul for Higher Uptime and Profitability. In Proceedings of the Society of Petroleum Engineers—ADIPEC, ADIP 2023, Abu Dhabi, United Arab Emirates, 2–5 October 2023. [Google Scholar]
- Rahimi, M.; Pourramezan, M.R.; Rohani, A. Modeling and Classifying the In-Operando Effects of Wear and Metal Contaminations of Lubricating Oil on Diesel Engine: A Machine Learning Approach. Expert. Syst. Appl. 2022, 203, 117494. [Google Scholar] [CrossRef]
- Wolak, A.; Molenda, J.; Fijorek, K.; Łankiewicz, B. Prediction of the Total Base Number (TBN) of Engine Oil by Means of FTIR Spectroscopy. Energies 2022, 15, 2809. [Google Scholar] [CrossRef]
- Chybowski, L.; Szczepanek, M.; Ćwirko, K.; Marosek, K. Analytical Method for Determining the Viscosity Index of Engine Lubricating Oils. Energies 2024, 17, 4908. [Google Scholar] [CrossRef]
- Chybowski, L.; Szczepanek, M.; Sztangierski, R.; Brożek, P. Modeling of Selected Parameters of Used Lubricating Oil Diluted with Diesel Oil Using the Characteristics of Fresh Lubricating Oil. Energies 2024, 17, 2047. [Google Scholar] [CrossRef]
- Sejkorová, M.; Šarkan, B.; Veselík, P.; Hurtová, I. FTIR Spectrometry with PLS Regression for Rapid TBN Determination of Worn Mineral Engine Oils. Energies 2020, 13, 6438. [Google Scholar] [CrossRef]
- Maltseva, E.I.; Keruchenko, L.S.; Shimokhin, A.V.; Zakharov, S.V. Using Statistical Methods for Assessment of Wear Product Content Limits of Engine Oils Used in Agriculture. IOP Conf. Ser. Earth Environ. Sci. 2022, 988, 042056. [Google Scholar] [CrossRef]
- Lu, Z.; Liu, M.; Qin, Y.; Xin, G.; Wang, Y.; Zhang, S.; Cheng, X.; Yi, X. An Engine Oil Analysis Method Based on Kernel Density Estimation and Three-Lines Values Method. In Proceedings of the 2020 International Conference on Sensing, Diagnostics, Prognostics, and Control (SDPC), Beijing, China, 5–7 August 2020; IEEE: New York, NY, USA, 2020; pp. 409–414. [Google Scholar]
- Raposo, H.; Farinha, J.T.; Fonseca, I.; Galar, D. Predicting Condition Based on Oil Analysis—A Case Study. Tribol. Int. 2019, 135, 65–74. [Google Scholar] [CrossRef]
- Liu, T.; Tian, H.-X.; Guo, W.-Y. Application of PCA to Diesel Engine Oil Spectrometric Analysis. Spectrosc. Spectr. Anal. 2010, 30, 779–782. [Google Scholar] [CrossRef]
- Li, Y.; Yu, A.; Ji, H.; Li, M.; Guo, Z. A Method for Armored Vehicle Engine State Assessment Based on KPCA-SCSO-SVM. Dalian Ligong Daxue Xuebao/J. Dalian Univ. Technol. 2024, 64, 426–432. [Google Scholar] [CrossRef]
- Aruna, M.A.; Fox, M.F. Correlation of Field, Laboratory and Standard Lubricant Tests Using Multivariate Analysis. Proc. Inst. Mech. Eng. Part D J. Automob. Eng. 2004, 218, 195–201. [Google Scholar] [CrossRef]
- Malaguti, R.; Lourenço, N.; Silva, C. A Supervised Machine Learning Model for Determining Lubricant Oil Operating Conditions. Expert. Syst. 2023, 40, e13116. [Google Scholar] [CrossRef]
- Pourramezan, M.-R.; Rohani, A. Improved Monitoring and Classification of Engine Oil Condition through Two Machine Learning Techniques. SAE Int. J. Fuels Lubr. 2024, 18, 04–18–01–0005. [Google Scholar] [CrossRef]
- Szrama, S. Engine Health Status Prediction Based on Oil Analysis With Augmented Machine Learning Algorithms. Tribol. Ind. 2024, 46, 624–638. [Google Scholar] [CrossRef]
- Plaščak, I.; Jurišić, M.; Radočaj, D. A Machine-Learning Approach for the Assessment of Quantitative Changes in the Tractor Diesel-Engine Oil During Exploitation. Poljoprivreda 2024, 30, 108–114. [Google Scholar] [CrossRef]
- Adelkhani, A.; Daneshkhah, E. Investigation of Engine Lubrication Oil Quality Using a Support Vector Machine and Electronic Nose. Machines 2025, 13, 121. [Google Scholar] [CrossRef]
- Gupta, A.; Onumanyi, A.J.; Ahlawat, S.; Prasad, Y.; Singh, V. B-CAVE: A Robust Online Time Series Change Point Detection Algorithm Based on the Between-Class Average and Variance Evaluation Approach. IEEE Trans. Knowl. Data Eng. 2024, 37, 75–88. [Google Scholar] [CrossRef]
- Si, T.; Wang, Y.; Zhang, L.; Richmond, E.; Ahn, T.-H.; Gong, H. Multivariate Time Series Change-Point Detection with a Novel Pearson-like Scaled Bregman Divergence. Stats 2024, 7, 462–480. [Google Scholar] [CrossRef] [PubMed]
- Coil, C.; Corizzo, R. Assessing Distance Measures for Change Point Detection in Continual Learning Scenarios. In Proceedings of the International Symposium on Methodologies for Intelligent Systems, Poitiers, France, 17–19 June 2024; Volume 14670, Lecture Notes in Computer Science. ISBN 9783031626999. [Google Scholar]
- Cao, Z.; Seeuws, N.; De Vos, M.; Bertrand, A. Change Point Detection in Multi-Channel Time Series via a Time-Invariant Representation. IEEE Trans. Knowl. Data Eng. 2024, 36, 7743–7756. [Google Scholar] [CrossRef]
- Draayer, E.; Cao, H.; Hao, Y. Reevaluating the Change Point Detection Problem with Segment-Based Bayesian Online Detection. In Proceedings of the International Conference on Information and Knowledge Management, Virtual, 1–5 November 2021; pp. 2989–2993. [Google Scholar]
- Faber, K.; Corizzo, R.; Sniezynski, B.; Baron, M.; Japkowicz, N. WATCH: Wasserstein Change Point Detection for High-Dimensional Time Series Data. In Proceedings of the 2021 IEEE International Conference on Big Data, Big Data, Orlando, FL, USA, 15–18 December 2021; pp. 4450–4459. [Google Scholar]
- Wu, R.; Liu, C.; Jiang, D. Unsupervised Bayesian Change-Point Detection Approach for Reliable Prognostics and Health Management of Complex Mechanical Systems. Reliab. Eng. Syst. Saf. 2024, 245, 110037. [Google Scholar] [CrossRef]
- Pan, Y.; Zheng, Z. Bayesian Online Change Point Detection Method for Process Monitoring. In Proceedings of the 32nd Chinese Control and Decision Conference, CCDC 2020, Hefei, China, 22–24 August 2020; pp. 3389–3393. [Google Scholar]
- Huang, D.; Bai, R.; Zhao, S.; Wen, P.; Wang, S.; Chen, S. Bayesian Neural Network Based Method of Remaining Useful Life Prediction and Uncertainty Quantification for Aircraft Engine. In Proceedings of the Annual Conference of the Prognostics and Health Management Society, PHM, Detroit, MI, USA, 8–10 June 2020. [Google Scholar]
- Fouka, A.; Bousdekis, A.; Lepenioti, K.; Mentzas, G. Real-Time Equipment Health State Prediction with LSTM Networks and Bayesian Inference. In Proceedings of the International Conference on Advanced Information Systems Engineering, Melbourne, Australia, 28 June–2 July 2021; Volume 423, Lecture Notes in Business Information Processing. ISBN 9783030790219. [Google Scholar]
- Zhao, L.; Liu, Q.; Du, P.; Fu, G.; Cao, W. Novel Change-Point Detection Approach for Monitoring High-Dimensionaltraffics in Distributed Systems. Appl. Mech. Mater. 2014, 536–537, 499–511. [Google Scholar] [CrossRef]
- Burkatovskaya, Y.; Vorobeychikov, S.; Kudinov, A.; Frantcuzskaia, E. Cumulative Sum Algorithms for Automatic Detection of Gas Well Parameter Changes. IFAC-PapersOnLine 2017, 50, 14614–14619. [Google Scholar] [CrossRef]
- Gonçalves, A.C.; Paschoalini, A.T.; Bazani, M.A. Predictive Maintenance of a Worm Reducer with an Unbalanced Load. Int. J. Surf. Sci. Eng. 2014, 8, 302–317. [Google Scholar] [CrossRef]
- Gonçalves, A.C.; Silva, J.B.C. Predictive Maintenance of a Reducer with Contaminated Oil under an Excentrical Load through Vibration and Oil Analysis. J. Braz. Soc. Mech. Sci. Eng. 2011, 33, 1–7. [Google Scholar] [CrossRef]
- Di, S.; Haijun, W.; Haifeng, L. Recent Patents on Oil Analysis Technologies of Mechanical Equipment. Recent Pat. Mech. Eng. 2013, 6, 11–25. [Google Scholar] [CrossRef]
- Cuerva, M.P.; Gonçalves, A.C.; Da Consolação Fonseca de Albuquerque, M.; Chavarette, F.R.; Outa, R.; De Almeida, E.F. Analysis of the Influence of Contamination in Lubricant by Biodiesel in a Pin-On-Disk Equipment. Mater. Res. 2022, 25, e20210375. [Google Scholar] [CrossRef]
- Levi, O.; Eliaz, N. Failure Analysis and Condition Monitoring of an Open-Loop Oil System Using Ferrography. Tribol. Lett. 2009, 36, 17–29. [Google Scholar] [CrossRef]
- Martí, L.; Sanchez-Pi, N.; Molina, J.M.; Bicharra Garcia, A.C. YASA: Yet Another Time Series Segmentation Algorithm for Anomaly Detection in Big Data Problems. In Proceedings of the Hybrid Artificial Intelligence Systems: 9th International Conference, Salamanca, Spain, 11–13 June 2014; Volume 8480, Lecture Notes in Computer Science. ISBN 9783319076164. [Google Scholar]
- Chen, C.-F.; Chang, L.-Y. Extraction of Oil Slicks on the Sea Surface from Optical Satellite Images by Using an Anomaly Detection Technique. J. Appl. Remote Sens. 2010, 4, 043565. [Google Scholar] [CrossRef]
- Korkas, K.K.; Fryzlewicz, P. Multiple Change-Point Detection for Non-Stationary Time Series Using Wild Binary Segmentation. Stat. Sin. 2017, 27, 287–311. [Google Scholar] [CrossRef]
- Fryzlewicz, P. Detecting Possibly Frequent Change-Points: Wild Binary Segmentation 2 and Steepest-Drop Model Selection. J. Korean Stat. Soc. 2020, 49, 1027–1070. [Google Scholar] [CrossRef]
- Wang, X.; Liu, B.; Zhang, X. A Computationally Efficient and Flexible Algorithm for High Dimensional Mean and Covariance Matrix Change Point Models. J. Korean Stat. Soc. 2022, 51, 1216–1246. [Google Scholar] [CrossRef]
- Korkas, K.K. Ensemble Binary Segmentation for Irregularly Spaced Data with Change-Points. J. Korean Stat. Soc. 2022, 51, 65–86. [Google Scholar] [CrossRef]
- Jawad, S.M.; Jaber, A.A. Rolling Bearing Fault Detection Based on Vibration Signal Analysis and Cumulative Sum Control Chart. FME Trans. 2021, 49, 684–695. [Google Scholar] [CrossRef]
- Fan, W.; Zheng, X.; Chen, C.; Li, Y.; Liu, X.; He, C. Dynamic CUSUM Chart with an Integrated Indicator for Bearing Condition Monitoring. IEEE Sens. J. 2023, 23, 15400–15412. [Google Scholar] [CrossRef]
- Estaji, A.; Gotzinger, M.; Tutzer, B.; Kollmann, S.; Sauter, T.; Jantsch, A. Evaluation of Drift Detection Algorithms in the Condition Monitoring Domain. IEEE Trans. Ind. Inf. 2025, 21, 317–326. [Google Scholar] [CrossRef]
- United States Environmental Protection Agency (EPA). Control of Emissions of Air Pollution from 2004 and Later Model Year Heavy-Duty Highway Engines and Vehicles; United States Environmental Protection Agency (EPA): Washington, DC, USA, 2000.
- NTE INEN 1489; Petroleum Products Diesel Requirements. Ecuadorian Institute of Standardization (INEN): Quito, Ecuador, 2021.
- ISO 9001:2015; Quality Management Systems—Requirements. International Organization for Standardization: Geneva, Switzerland, 2015.
- ISO/IEC 17025:2017; General Requirements for the Competence of Testing and Calibration Laboratories. International Organization for Standardization. International Electrotechnical Commission: Geneva, Switzerland, 2017.
- ASTM D6595–17; Standard Test Method for Determination of Wear Metals and Contaminants in Used Lubricating Oils or Used Hydraulic Fluids by Rotating Disc Electrode Atomic Emission Spectrometry. ASTM International: West Conshohocken, PA, USA, 2017.
- ASTM E2412–22; Standard Guide for Condition Monitoring of Used Lubricants by Trend Analysis Using Fourier Transform Infrared (FT-IR) Spectrometry. ASTM International: West Conshohocken, PA, USA, 2022.
- ASTM D445–21; Standard Test Method for Kinematic Viscosity of Transparent and Opaque Liquids (and Calculation of Dynamic Viscosity). ASTM International: West Conshohocken, PA, USA, 2021.
- ASTM D2896–20; Standard Test Method for Base Number of Petroleum Products by Potentiometric Perchloric Acid Titration. ASTM International: West Conshohocken, PA, USA, 2020.
- Tan, C.; Deng, H.; Feng, Z.; Li, B.; Peng, Z.; Feng, G. Data-Driven System Efficiency Prediction and Production Parameter Optimization for PW-LHM. J. Pet. Sci. Eng. 2022, 209, 109810. [Google Scholar] [CrossRef]
- Fu, C.; Liang, X.; Li, Q.; Lu, K.; Gu, F.; Ball, A.D.; Zheng, Z. Comparative Study on Health Monitoring of a Marine Engine Using Multivariate Physics-Based Models and Unsupervised Data-Driven Models. Machines 2023, 11, 557. [Google Scholar] [CrossRef]
- Truong, C.; Oudre, L.; Vayatis, N. Selective Review of Offline Change Point Detection Methods. Signal Process. 2020, 167, 107299. [Google Scholar] [CrossRef]
- Andrews, D.W.K. Tests for Parameter Instability and Structural Change With Unknown Change Point. Econometrica 1993, 61, 821. [Google Scholar] [CrossRef]

Disclaimer/Publisher’s Note: The statements, opinions and data contained in all publications are solely those of the individual author(s) and contributor(s) and not of MDPI and/or the editor(s). MDPI and/or the editor(s) disclaim responsibility for any injury to people or property resulting from any ideas, methods, instructions or products referred to in the content. |
© 2025 by the authors. Licensee MDPI, Basel, Switzerland. This article is an open access article distributed under the terms and conditions of the Creative Commons Attribution (CC BY) license (https://creativecommons.org/licenses/by/4.0/).