1. Introduction
The ball screw assembly is a high-precision transmission mechanism that converts rotational motion into linear motion. Due to its high positioning accuracy and excellent load-carrying performance, it has been widely used in the feed systems of CNC machine tools [
1,
2,
3]. Wear caused by long-term operation leads to the degradation of transmission performance, thereby affecting machining quality and the reliability of the machine tool. Therefore, accurate identification of the wear state of ball screw assemblies is crucial for ensuring machining accuracy and improving equipment utilization.
In most applications, a certain preload is applied to the ball screw assembly to enhance transmission stiffness and eliminate axial clearance. Consequently, the degradation of the preload can serve as an important indicator of the wear state. Feng et al. [
4] designed a mechanism that evaluates and adjusts the preload using a compressed disk spring. Frey et al. [
5] measured the preload of a double-nut ball screw using three high-stiffness piezoelectric sensors uniformly distributed between the two nuts. Denkena et al. [
6] proposed a sensor fusion method based on principal component analysis for monitoring the preload loss of single-nut ball screws. Some researchers have further investigated preload degradation based on friction torque measurements [
7,
8,
9]. However, such methods typically require frequent disassembly of the screw or the use of embedded sensors, which may affect the system’s stiffness and accuracy, thereby limiting their practical application.
To avoid structural interference, recent studies have gradually shifted toward identifying ball screw wear based on signal features. For example, Zhao et al. [
10] extracted features from velocity and torque signals, showing that the LE-MD method can effectively distinguish different wear states; Garinei et al. [
11] used hall sensors and digital cameras to identify wear via signal extrema; and Yuan et al. [
12] combined fuzzy entropy, time-domain features, and manifold distance for health assessment.
The above researchers primarily used traditional signal processing methods to identify the wear state of ball screw assemblies. In recent years, machine learning and neural network models have been widely applied for the fault diagnosis and state identification of ball screws due to their autonomy, fast response, and high accuracy. Me [
13] collected current signals during the wear process and extracted features to identify wear states using a support vector machine; Wang et al. [
14] used vibration signals and a CNN-LSTM model to predict wear states; and Chen [
15] employed machine vision to monitor raceway wear and calculate the accuracy loss. Although these methods achieve notable identification performance, vibration and current signals often contain interference from guides and bearings, affecting the accuracy and repeatability of wear state recognition.
It is worth noting that apart from the nut–raceway contact zone, most of the screw raceway surface remains exposed, allowing for direct acquisition of its surface morphology without disassembly. More importantly, the raceway surface profile is influenced solely by wear, free from load or structural interference. Based on this observation, this study proposes a wear state identification method based on the surface profile characteristics of the screw raceway, introducing surface morphology information into the wear modeling of ball screw assemblies. Surface profile data covering the entire degradation process were acquired and analyzed to extract multi-scale features such as roughness, peak-to-valley height, recurrence rate, and multifractal parameters. A hybrid feature set was then constructed, and a genetic algorithm-optimized support vector machine (GA-SVM) was employed for wear state recognition.
The main contributions of this study are as follows:
(1) A novel wear identification framework based on raceway surface morphology was proposed, overcoming the limitations of traditional signal-based methods that are easily affected by interference;
(2) A multi-scale hybrid feature set combining geometric, statistical, and fractal characteristics was constructed, enhancing the comprehensiveness of wear representation;
(3) The integration of GA-SVM enabled high-accuracy wear state recognition, achieving an average identification accuracy of 98.48%, which verified the effectiveness and robustness of the proposed method.
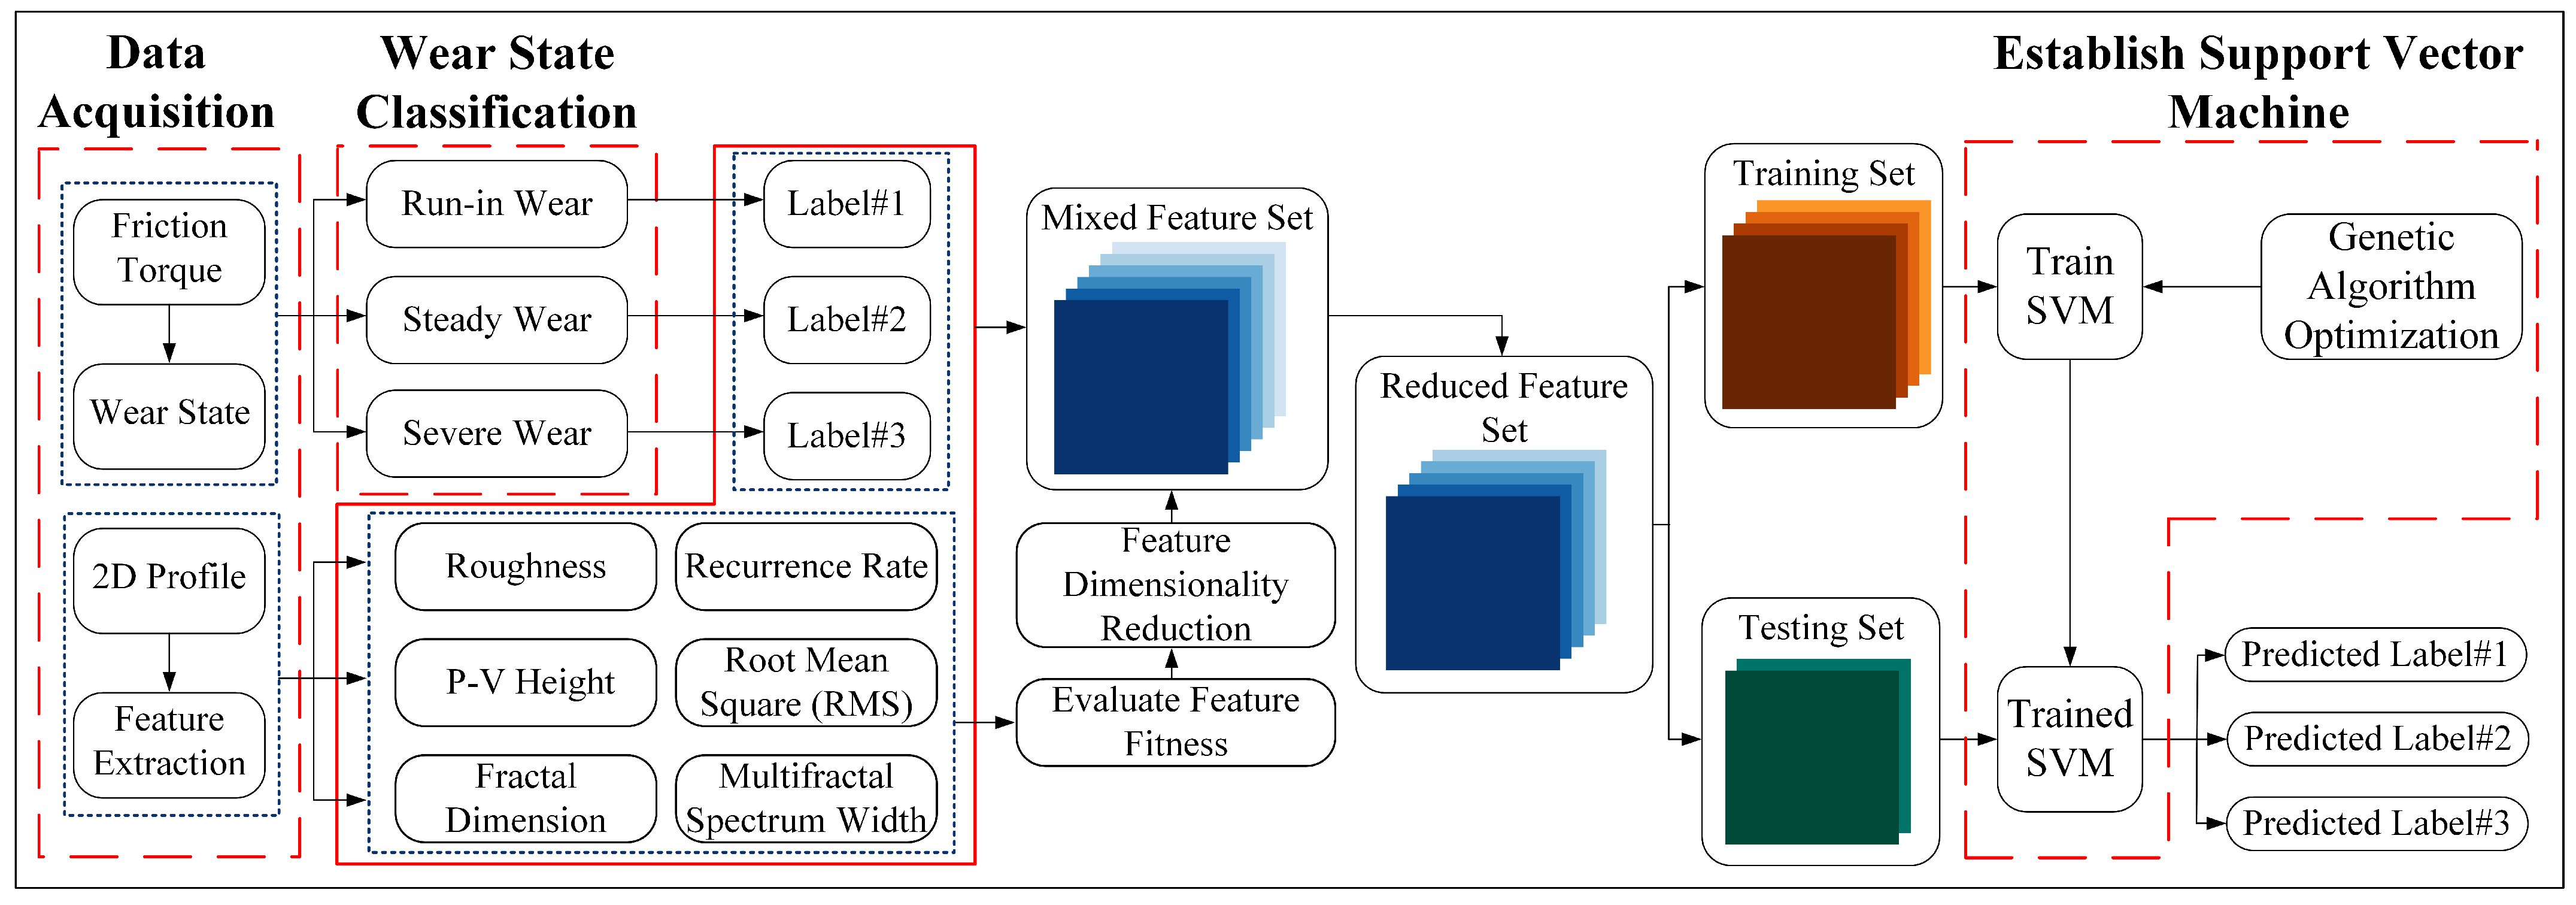
The methodological framework is illustrated in
Figure 1.
2. Data Acquisition
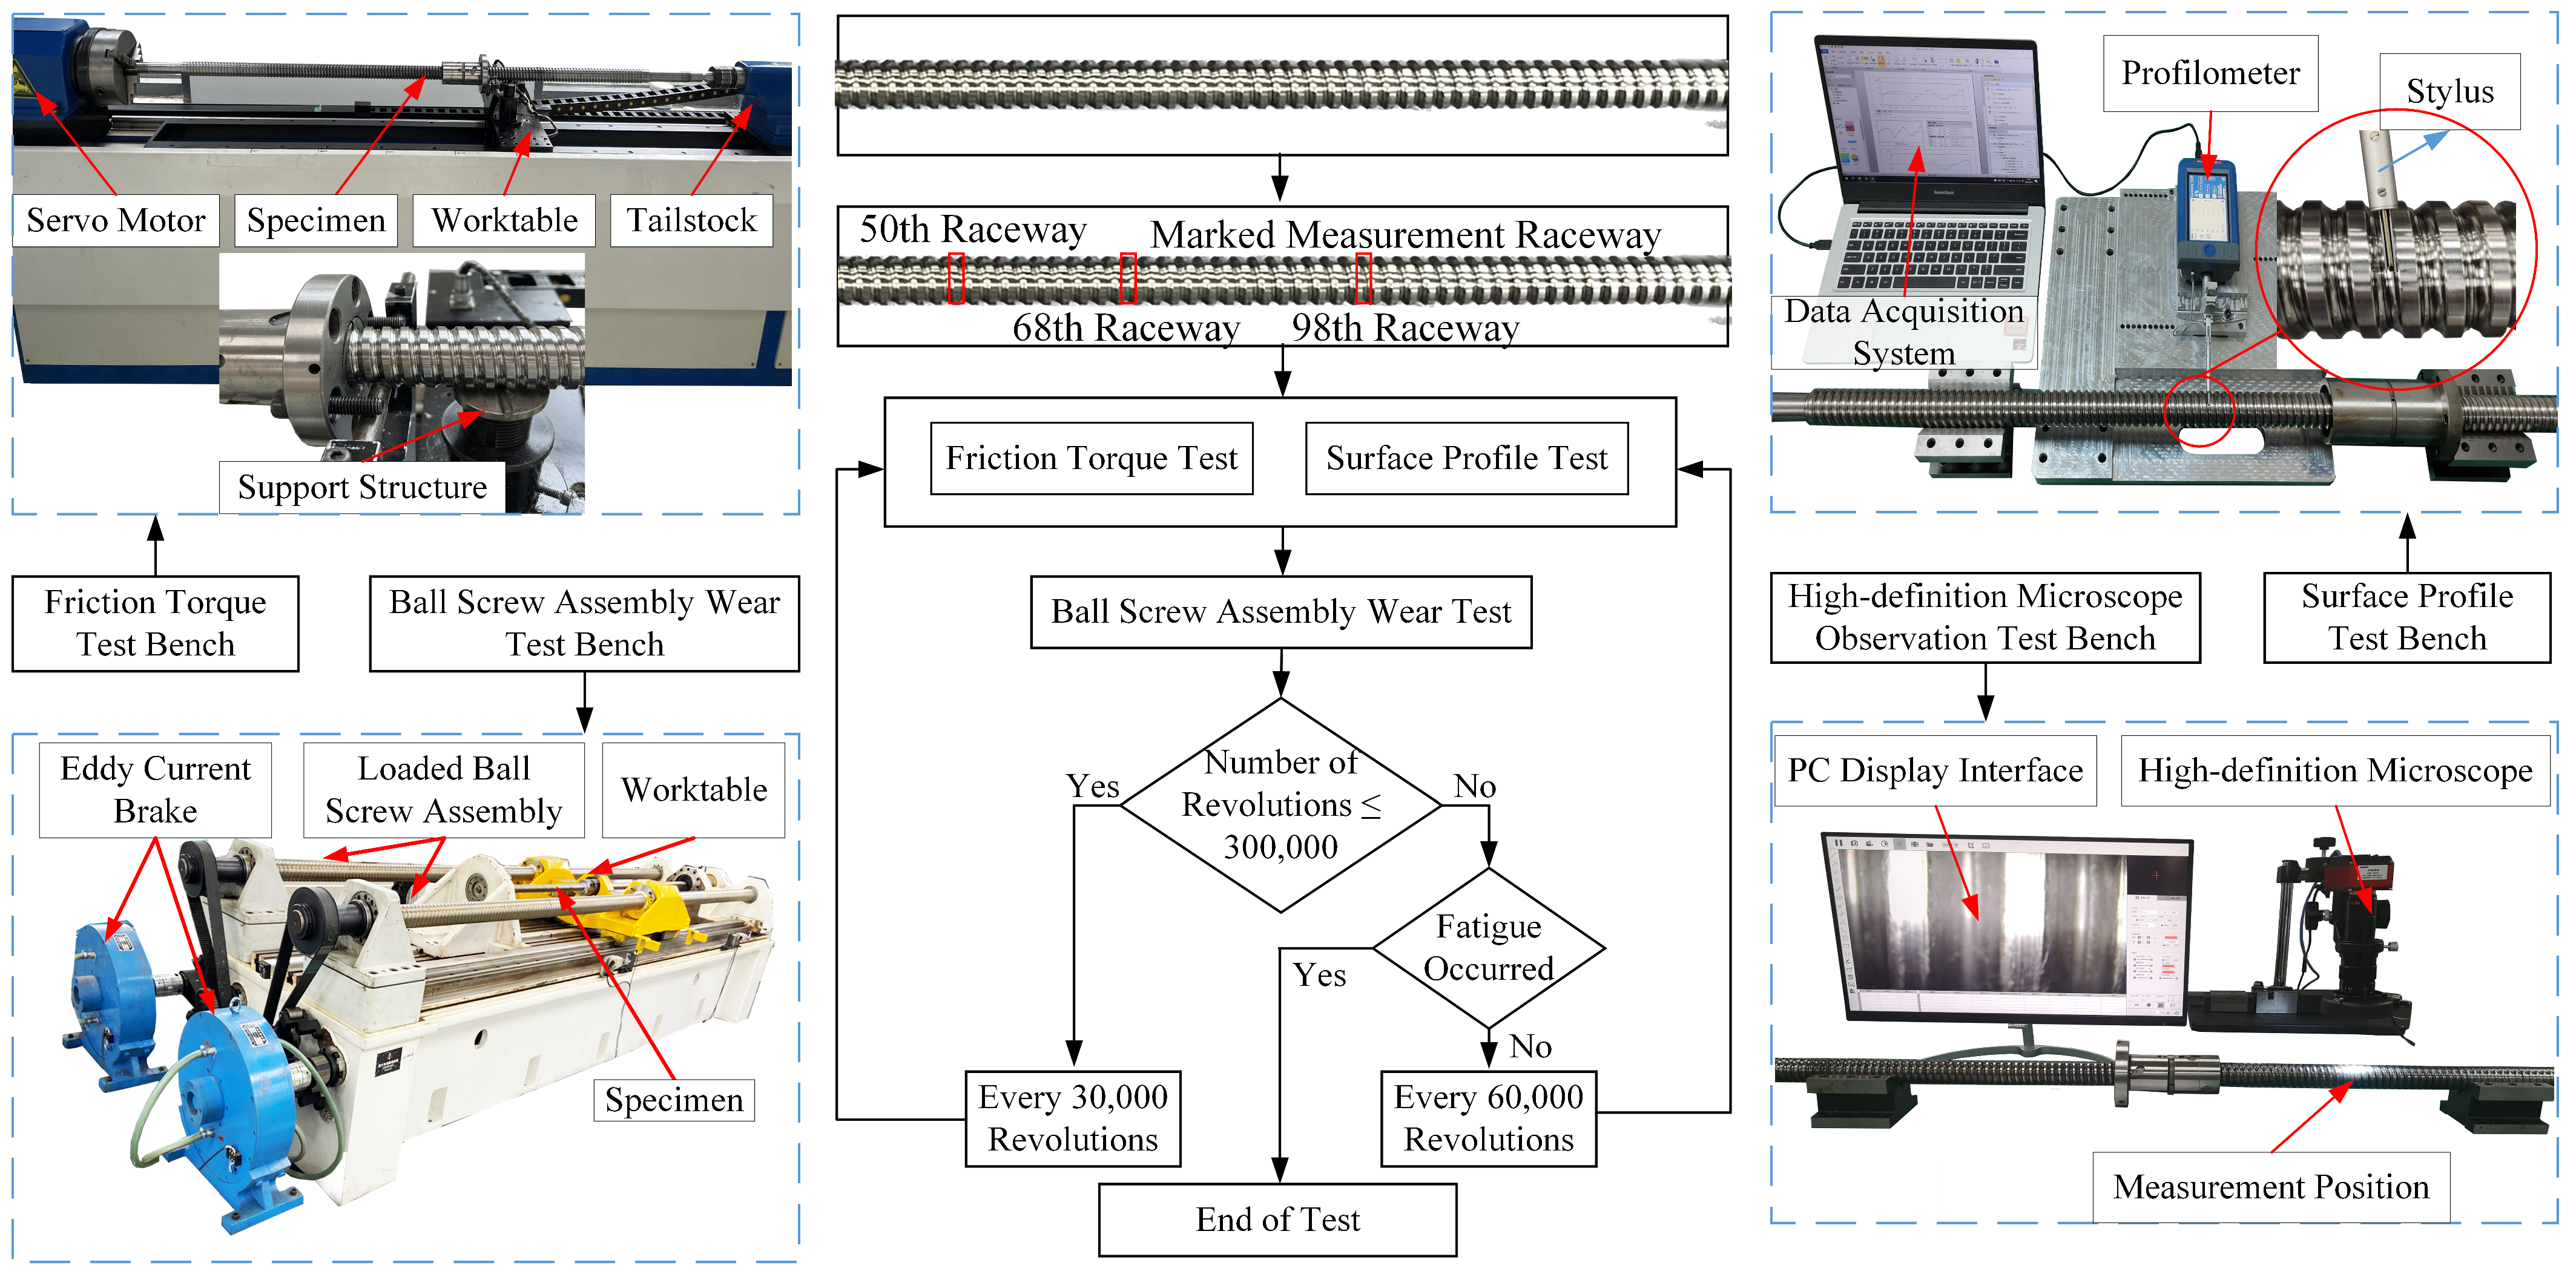
To establish an accurate wear state recognition method for ball screw pairs, it is essential to first construct a database of raceway surface wear states for training purposes. Accordingly, a dedicated wear state acquisition system and procedure were developed in this study, as illustrated in
Figure 2.
Step 1: Before the test, the 50th, 68th, and 98th raceways of the screw were marked, and the surface profiles of these three raceways were collected. The preload torque of the ball screw assembly was measured in accordance with the international standard DIN ISO 3408-3 [
16].
Step 2: The ball screw pair was subsequently operated under a load of 25 kN and a rotational speed of 400 rpm for 30,000 revolutions. Following this, the surface profiles and preload torque were collected again as in Step 1. The raceway surface morphology was examined, and the test was terminated if fatigue spalling was observed; otherwise, the procedure continued to Step 3.
Step 3: If the cumulative operating revolutions had not yet reached 300,000, the procedure returned to Step 2; otherwise, Step 4 was initiated.
Step 4: The screw was further operated under the same conditions (25 kN, 400 rpm) for 30,000 revolutions, after which surface profiles and preload torque were collected as in Step 1.
Step 5: The raceway surface morphology was examined once more. If no fatigue spalling was present, Step 4 was repeated; otherwise, the test was terminated.
In addition, to ensure consistent experimental conditions, all ball screw assemblies were tested in a temperature-controlled laboratory, with the ambient temperature maintained at (20 ± 1) °C. During testing, according to the DIN ISO 3408-3 standard [
16], each ball screw assembly was mounted on the test bench and pre-run at a rotational speed of 100 rpm for 5 min. Lubricating oil was applied to ensure adequate lubrication. After the pre-lubrication stage, measurements were carried out without adding any additional lubricant.
Surface profile measurements were conducted using a Taylor Hobson Surtronic S-128 profilometer, with a resolution of 50 nm and a repeatability error of ±(0.5% × measured value + noise). The measurement parameters were set as follows: sampling length of 1 mm, Gaussian filter cutoff radius of 0.25, and removal of form using a fifth-order polynomial. Finally, the surface profile data of the screw raceway were exported. Each point was measured three times, and the average value was used to minimize the influence of random errors. In total, three ball screw pairs were selected for the experiments, and their specific parameters are listed in
Table 1.
3. Data Processing
According to [
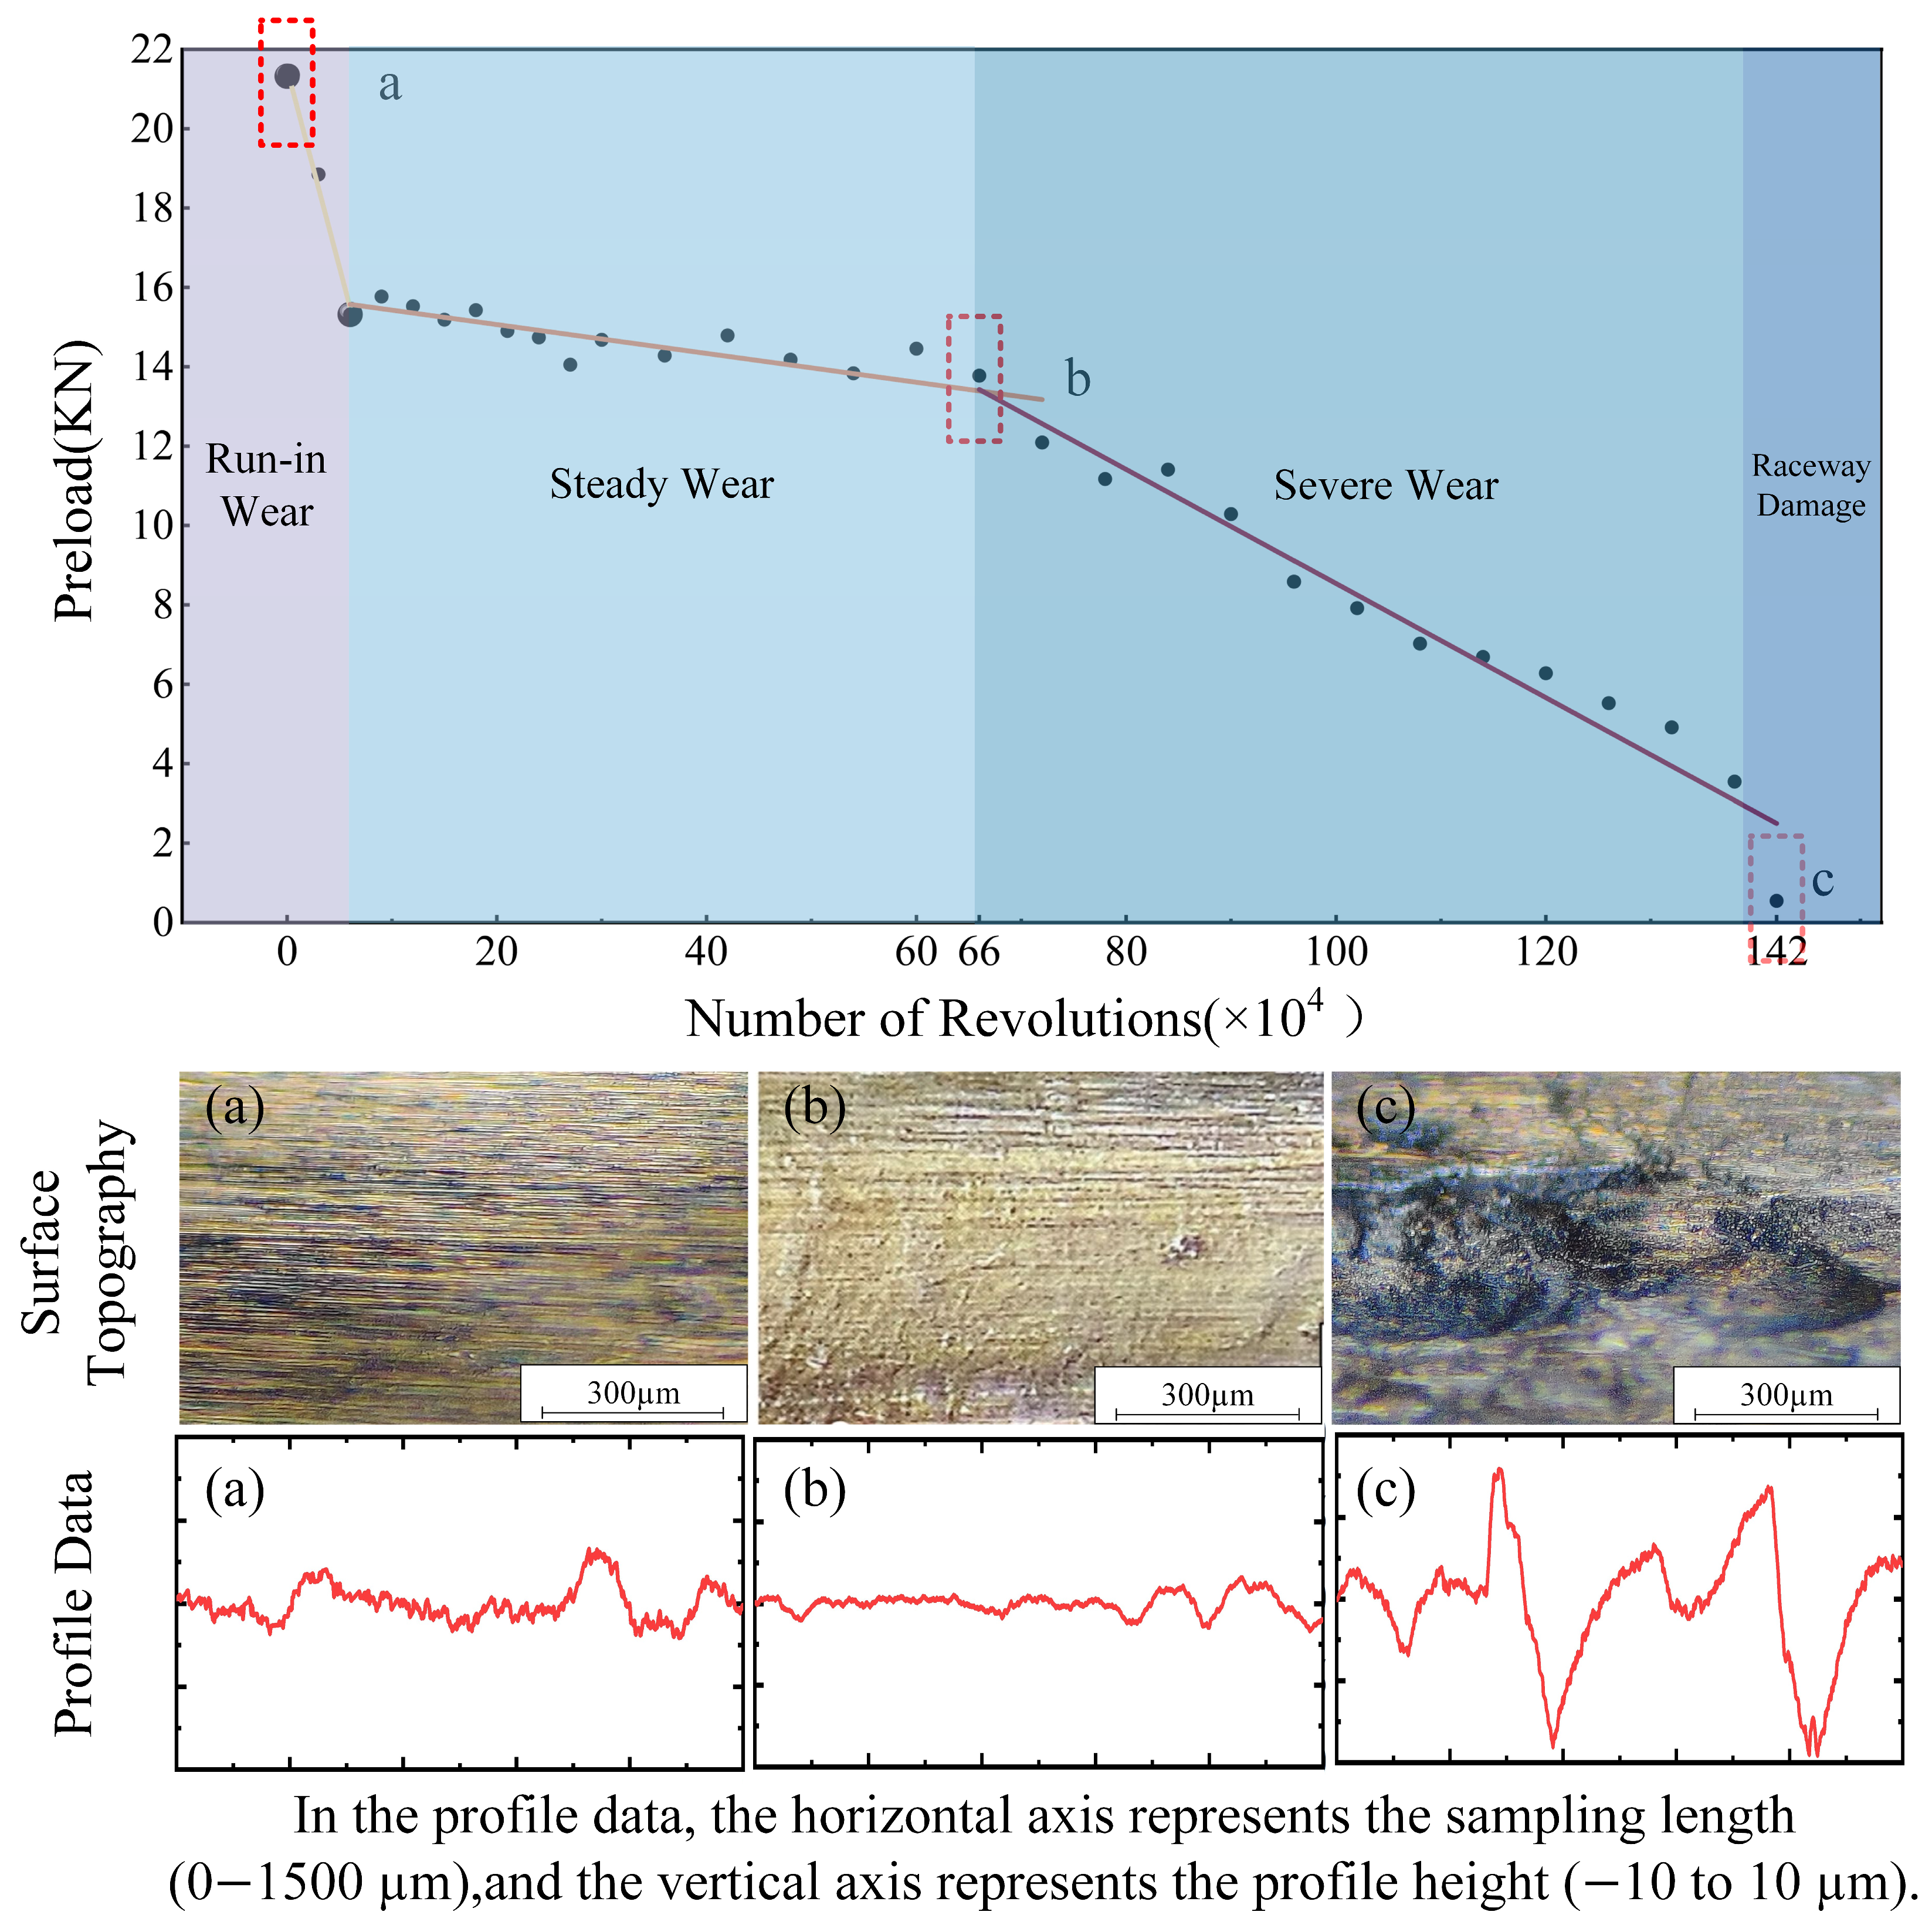
17], the preload corresponding to each operating point can be calculated from the measured frictional torque. As shown in
Figure 3, the preload exhibited a three-stage degradation trend: it decreased rapidly at first, then declined slowly and steadily, and finally dropped sharply again. Specifically, during the range of 0–60,000 revolutions, the initial surface roughness of the raceway was relatively high, and the micro-asperity peaks were quickly worn down, leading to a rapid decrease in preload. In this stage, the ball screw pair is in the running-in wear state. Between 60,000 and 660,000 revolutions, the raceway roughness decreased, the wear rate remained nearly constant, and the preload declined slowly, indicating a stable wear state. From 660,000 to 1,360,000 revolutions, the roughness increased again, accompanied by the onset of surface pitting and fatigue, which significantly accelerated wear and rapidly decreased the preload. Beyond 1,360,000 revolutions, large-scale fatigue spalling occurred on the raceway surface, marking the failure stage and the end of service life.
Based on the complete life cycle performance degradation data obtained, this study proposes a methodology combining statistical analysis, recurrence analysis, and fractal analysis to characterize the degradation behavior of ball screw pairs.
The statistical analysis method captures the fundamental characteristics of the raceway surface profile. Among its basic features, surface roughness (Ra), maximum peak-to-valley height (Rz), and root mean square (Rms) directly describe the original profile characteristics and are highly sensitive to wear evolution. Larger Ra, Rz, and Rms values indicate a rougher and more uneven raceway surface with greater fluctuation. Their definitions are given in Equations (1)–(3).
Ra denotes surface roughness, Rz represents the maximum peak-to-valley height, and Rms is the root mean square value. is the profile height; and are the minimum and maximum profile heights, respectively; is the mean profile height; and n denotes the sampling rate.
Recurrence refers to the property of a system in which certain characteristics reappear after a period of time or displacement, demonstrating similarity to the original state. As the surface profile of the ball screw raceway exhibited strong nonlinearity, recurrence analysis was introduced to characterize the performance degradation of ball screw pairs.
The recurrence analysis method mainly includes recurrence plots and recurrence quantification analysis (RQA). In this study, RQA was employed. Among the RQA indicators, the recurrence rate (RR) is one of the most fundamental features used to quantitatively reflect the stability and fluctuation of the system state. For the raceway surface profile of a ball screw, a higher RR indicates a greater similarity between different sampling points, implying a more stable surface morphology and more uniform wear. Its calculation is given in Equation (4).
denotes the number of phase points, where each phase point represents a point in the reconstructed phase space, and represents the recurrence points.
Fractal theory can be categorized into monofractal and multifractal approaches. The fractal dimension (D) is one of the most important parameters in monofractal theory and can be understood as a measure of the surface complexity. A larger fractal dimension indicates a smoother raceway profile with smaller fluctuations while also reflecting greater complexity and irregularity of the profile curve. In this study, the monofractal dimension was determined using the structure function method.
The Weierstrass–Mandelbrot (W–M) function is particularly suitable for describing the nonlinear characteristics of the raceway surface profile, and is defined in Equation (5).
Here, , , and denote the fractal dimension; represents the height scaling factor; is the spectrum of the rough surface; n is the sampling frequency; is the minimum sampling frequency, ; and is the sampling length, which generally satisfies . In addition, denotes the random profile height, and is the position coordinate of the profile. Intuitively, the W–M function regards the height variations in the surface profile as a set of “waves”, where different frequencies and amplitudes reflect the undulating characteristics of wear at different scales.
The corresponding power spectrum function can be expressed as Equation (6).
The variance of the increments is defined as the structure function, which can be expressed as Equation (7).
Here, , where denotes the sampling interval.
By combining Equations (5) and (7), Equation (8) can be obtained.
The above terms are defined as follows: , where denotes the Gamma function, .
Taking the logarithm of both sides of the above equation yields Equation (9).
According to the above equation, the fractal dimension,
, can be obtained as expressed in Equation (10).
Here, represents the slope of the straight line.
The monofractal dimension can characterize the intrinsic properties of the raceway profile; however, it is insufficient to capture the local nonlinear characteristics of the profile in detail. Multifractals can be regarded as an infinite set of intertwined monofractals under different measures, which are inherently more complex and heterogeneous than monofractals. Therefore, the multifractal method was introduced to describe the nonlinear features of the raceway profile. Multifractal analysis mainly consists of the generalized dimension and the multifractal spectrum, with the latter being more widely applied. In this study, the multifractal spectrum was employed to characterize the degradation pattern of the raceway surface profile.
The box-counting method was adopted to compute the multifractal spectrum of the raceway profile. The core idea was to analyze the nonuniform distribution of the profile’s probability measure across different scales. First, the minimum value of the acquired raceway profile data was taken as the lower bound and set to zero to ensure all amplitude values were positive. Then, the profile was covered with a series of small boxes with a size of
. For each box, the ratio between the sum of the profile amplitudes within the box and the total amplitude was calculated to obtain the probability measure,
, as expressed in Equation (11).
Here, represents the sum of all profile amplitudes within the -th box at scale , and denotes the sum of all amplitude values of the entire raceway profile. Intuitively, reflects the degree of concentration of the profile height information within that region at scale .
Within the scaling region,
can also be expressed in exponential form, as shown in Equation (12):
where
is the singularity exponent, which reflects the intensity of variation in the measure within the local region.
Assuming that the number of boxes with the same singularity exponent
is
, then within the scaling region
can also be written in exponential form as follows:
where
represents the fractal dimension corresponding to the singularity exponent
. A smaller
corresponds to a smaller
. However, it is difficult to directly count the number of boxes with the same singularity exponent; therefore, the partition function was introduced for indirect calculation. The multifractal partition function is defined as
, as shown in Equation (14):
where
is the moment order, with
serving as a weighting factor. Theoretically,
should be in the range of
. However, for practical computation, its range cannot be infinite. Therefore, in this study,
was taken from [−20, 30] with a step size of 1.
When
,
can be rewritten as Equation (15):
By linking
,
, and the generalized dimension
and considering the Legendre transformation relationship among them, the following equations can be obtained:
where
and
together form the multifractal spectrum, and the multifractal spectrum width
is defined to quantify the overall nonuniformity of the profile, as shown in Equation (18).
Here, and represent the minimum and maximum singularity exponents, respectively. represents the nonuniformity of the probability measure of the sequence. A larger value indicates that the surface simultaneously contains multiple feature regions, such as smooth and rough areas, reflecting greater surface complexity and stronger nonuniformity; conversely, a smaller Δα value indicates that the profile is more uniform overall.
Finally, labels were established for the performance degradation data of the ball screw pairs. According to the variation in preload torque throughout the full service life, the wear progression of the ball screw pair was divided into three stages: the running-in wear stage, the stable wear stage, and the severe wear stage, which were assigned labels 1, 2, and 3, respectively.
In summary, six feature parameters were employed in this study to characterize the performance degradation of the ball screw pair, namely surface roughness (Ra), maximum peak-to-valley height (Rz), root mean square (Rms), recurrence rate (RR), monofractal dimension (D), and multifractal spectrum width (). However, these features exhibited different behaviors in representing the degradation process. The polynomial fitting coefficients of Ra, Rz, and Rms were all below 0.85, indicating poor linear correlation, while the remaining three features showed polynomial fitting coefficients above 0.90, indicating strong linear correlation. Moreover, Ra, Rz, and Rms presented a large fluctuation range between the minimum and maximum values across different degradation states, whereas the other three features exhibited relatively small fluctuation ranges. When fatigue spalling occurred, no abrupt changes were observed in the fractal and recurrence analysis features, whereas the statistical analysis features exhibited significant mutations. This observation suggests that fractal analysis and recurrence analysis are more suitable for characterizing the degradation process of the ball screw pair. Therefore, the three statistical features were discarded, and only RR, D, and were retained.
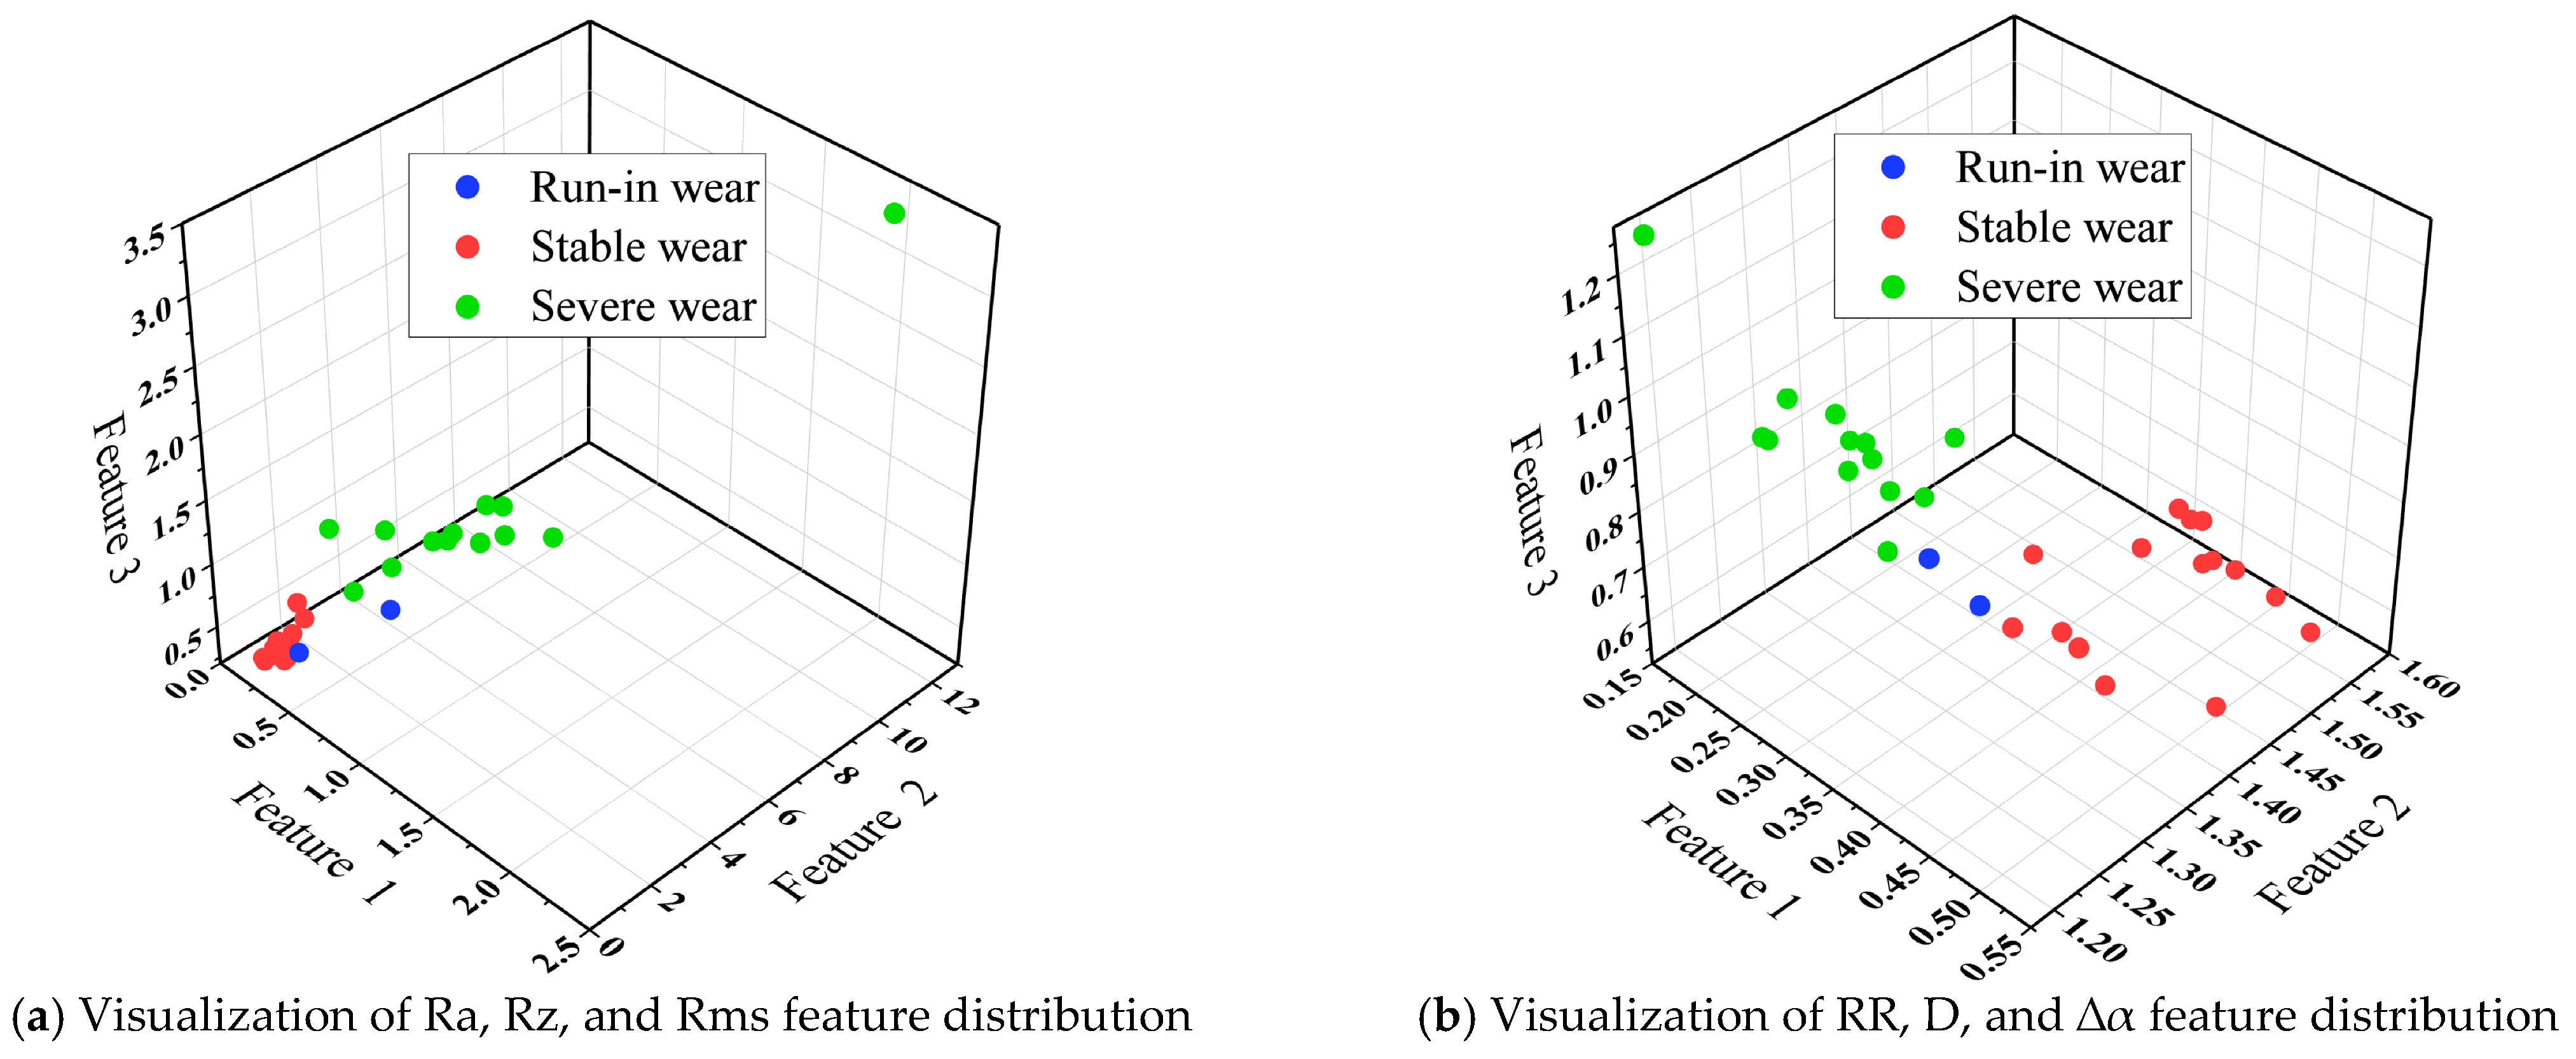
Figure 4 illustrates the visualization of feature distributions under different wear states. In
Figure 4a, the features corresponding to the three degradation states exhibited partial overlap, whereas in
Figure 4b, the three degradation states can be clearly distinguished, with only minor overlaps observed.
Considering the limited number of wear state samples, this study expanded the dataset using function fitting and interpolation methods while maintaining a consistent data distribution to avoid outliers. In addition, regularization was introduced during modeling to reduce the risk of overfitting and enhance the robustness of the model.


