Article

Study of the Micropore Structure and Tribological Properties of PTFE-Modified Porous Polyimide

1
Key Laboratory of Education Ministry for Modern Design and Rotor-Bearing System, Xi’an Jiaotong University, Xi’an 710049, China
2
Luoyang Bearing Research Institute Co., Ltd., Luoyang 471039, China
*
Authors to whom correspondence should be addressed.
Lubricants 2025, 13(10), 455; https://doi.org/10.3390/lubricants13100455
Submission received: 23 August 2025 / Revised: 18 September 2025 / Accepted: 14 October 2025 / Published: 18 October 2025
(This article belongs to the Special Issue Tribology of Polymeric Composites)

Abstract

To address the challenges of regulating micropore properties and improving the tribological performance of porous polyimide (PPI), PPI/PTFE composites were fabricated via cold pressing–sintering. The effects of PTFE content on porosity, oil absorption/retention, and tribological behavior were systematically studied. Results show that PTFE addition significantly reduced porosity—by 1.8% to 7.9% as PTFE increased from 5 wt% to 30 wt%—while markedly enhancing dry friction performance. The friction coefficient decreased from 0.22 to 0.06 with 30 wt% PTFE, with optimal performance at 20 wt% (friction coefficient: 0.068; wear rate: 1.5 × 10⁻⁶ mm3/N·m). Oil-impregnated samples exhibited further improved tribological properties (friction coefficient ≈ 0.047), attributed to lubricant release forming a protective oil film. Although PTFE promotes lubricant release, it increases wear at higher contents. A PTFE content of 0–10% balances porosity control and tribological performance.

1. Introduction

Porous polymers are advanced materials with abundant porous structures in their frameworks. They exhibit advantages such as light weight, corrosion resistance, excellent self-lubricating performance, and continuous oil supply, making them ideal for high-precision, long-life space bearing cage materials [1,2,3]. Commonly porous polymer cage materials include porous nylon [4], porous phenolic laminated fabric tubes [5,6,7], porous polyimide (PPI) [8,9], and porous polyetheretherketone [10].
Among these materials, polyimide (PI) has been widely used in space bearing cages or oil reservoirs owing to its excellent mechanical properties, high- and low-temperature resistance, and radiation resistance [11,12,13,14]. However, with the rapid development of space technology, increasing stringent requirements have been imposed on the lubrication performance and service life of bearings. Consequently, extensive research has been focused on the tribological and lubrication characteristics of PI cage materials. Qiu et al. demonstrated that PI can form a continuous ‘ink-bottle’ porous structure, which can release lubricating oil to form a stable oil film, thereby reducing friction [15]. Xu et al. studied the effects of porosity on the mechanical and oil-containing tribological properties of PI, revealing that while increased porosity reduces the friction coefficient, it also compromises mechanical properties [16]. Ye et al. adjusted the surface pore size of PI using laser scanning technology and found that smaller pores contribute to a lower friction coefficient. Their study also indicated that under oil-containing conditions, the friction interface operates in the boundary lubrication regime [17]. Sun et al. impregnated PPI with four types of space lubricants and investigated their tribological performance under different working conditions. They found that oil-containing PPI exhibits the best compatibility with 4123 lubricant and excellent self-lubricating ability [18].
To further improve friction–wear performance, modified materials are often added to enhance the properties of PPI. For example, Zhou et al. prepared carbon nanotube-containing PPI and found that carbon nanotubes can adhere to the surface of PI particles, contributing to increased porosity and surface adsorption capacity [19]. Zhang et al. selectively improved the oil-containing rate and retention rate of PPI for silicone oil through direct chemical modification [20]. Polytetrafluoroethylene (PTFE), a self-lubricating material with excellent lubrication performance, has also been used as a modifier additive for PI materials. For instance, Samyn et al. studied the friction and wear properties of carbon fiber-reinforced thermoplastic PI filled with PTFE, noting that the layered structure of PTFE and the low shear resistance of its parallel planes effectively reduce the friction coefficient of the composite [21]. Wang et al. fabricated PPI/PTFE cage materials with varying PTFE contents and demonstrated that although PTFE incorporation reduces ring tensile strength, it contributes to lower friction, offering valuable insights for bearing material selection [22]. Jiang et al. developed a rolling-sliding friction test to evaluate the tribological behavior of PTFE-modified porous oil-containing PI. Their results indicated that black wear debris generated in this mode leads to more severe wear, while PTFE itself does not undergo chemical changes during friction [23]. Despite evidence supporting the beneficial role of PTFE in enhancing the tribological performance of PPI, research on the lubrication mechanisms and comprehensive tribological properties of PTFE-modified porous oil-containing PI remains limited. This gap hinders the development of long-life PPI cages and porous oil-containing bearings for aerospace applications.
Therefore, this study fabricates PTFE-filled PPI composites with the aim of investigating their properties to elucidate control strategies for the microporous structure of PPI and optimize its friction and wear performance. The findings are expected to provide valuable insights and guidance for the lubrication design of PPI-based bearing cages.

2. Experiments

2.1. Preparation of PPI/PTFE

As shown in Figure 1, PI was used as the matrix, with 0%, 5%, 10%, 15%, 20%, and 30% PTFE added, respectively. In order to mix PTFE and PPI powders evenly, a high-speed tissue mixer was used. The PPI/PTFE materials were prepared via cold pressing and vacuum sintering. The PI molding powder was an ether-anhydride type polyimide with a glass transition temperature of 266 °C, a particle size of 15 μm, and a width of 14. PTFE was purchased from Daikin, Osaka, Japan.

2.2. Preparation of Oil-Containing PPI/PTFE (OCPPI/PTFE)

The prepared PPI/PTFE materials were cleaned and then immersed in lubricating oil under vacuum conditions to fill the internal pores with oil, as shown in Figure 1 [24]. The lubricating oil was poly-α-olefin (PAO) with the grade 4129, and a viscosity of 59.5/9.48 mm2 (40/100 °C), purchased from Sinopec Lubricant Co., Ltd. (Beijing, China) The samples were weighed using an analytical balance before and after oil immersion, and the mass difference was taken the mass of stored lubricating oil.

2.3. Materials Characterizations

An Auto Pore IV 9500 mercury intrusion porosimeter (Norcross, GA, USA) was used to test the porosity and pore diameter according to GB/T 21650.1-2008 [25]. A Zeiss EVO-18 scanning electron microscope (SEM) (Oberkochen, Germany) was used to analyze the porous structure. The composition of the porous structure was analyzed using an X-MAXN X-ray energy dispersive spectrometer (Oxford, UK). A DataPhysics OCA 20 contact angle goniometer (Stuttgart, Germany) was used to measure the contact angle of PAO on PPI materials. A Thermo Fisher-ESCALAB 250Xi (Waltham, MA, USA) was utilized for XPS characterization of friction transfer components. The excitation source is monochromatic Al Kα rays (E = 1486.68 eV, voltage 15.1 kV), and the vacuum degree of the sample chamber is maintained below 1 × 10⁻⁹ mBar. The test is divided into two steps: (1) full spectrum scanning (Binding Energy: conduction energy of 100 eV, step size of 1 eV, scan once), qualitative analysis of element composition; (2) Perform high-resolution scanning on the C 1s characteristic peak (with a conduction energy of 20 eV, a step size of 0.05 eV, and 5 scans accumulated). A LSM 7000 laser confocal microscope (Oberkochen, Germany) was used to characterize the wear scar morphology.
Table 1 shows the micropore properties and oil-containing rates of the prepared OCPPI/PTFE. After adding 5%, 10%, 15%, 20%, and 30% PTFE, the porosity decreased by 1.8%, 2.3%, 4.4%, 5.4%, and 7.9%, respectively, while the pore size and oil-containing rate also decreased.

2.4. Tribological Performances

As shown in Figure 2, a MFT 3000 (RTEC) friction tester (San Joze, CA, USA) was used to evaluate the tribological performance of the composites. The bottom sample was a PPI/PTFE composite with a diameter of 20 mm, and a bearing steel ball (GCr15) with a diameter of 4 mm was used for ball-on-disk reciprocating friction against the composite. The test conditions were: load 20 N, reciprocating frequency 20 Hz, and reciprocating stroke 5 mm. All friction tests were conducted under atmospheric conditions for 60 min, with 3 repetitions per group. The friction coefficient was the average of the instantaneous friction coefficients from the 3 groups. After each test, a CFT-Ⅰ material surface performance tester was used to measure the wear volume (∆V) of the composite. The wear rate (K) was calculated using the following formula:
K = ∆V/PL
where ∆V is the wear volume (mm3), P is the load (N), and L is the sliding distance (m).

3. Results and Discussion

3.1. Mechanical Properties

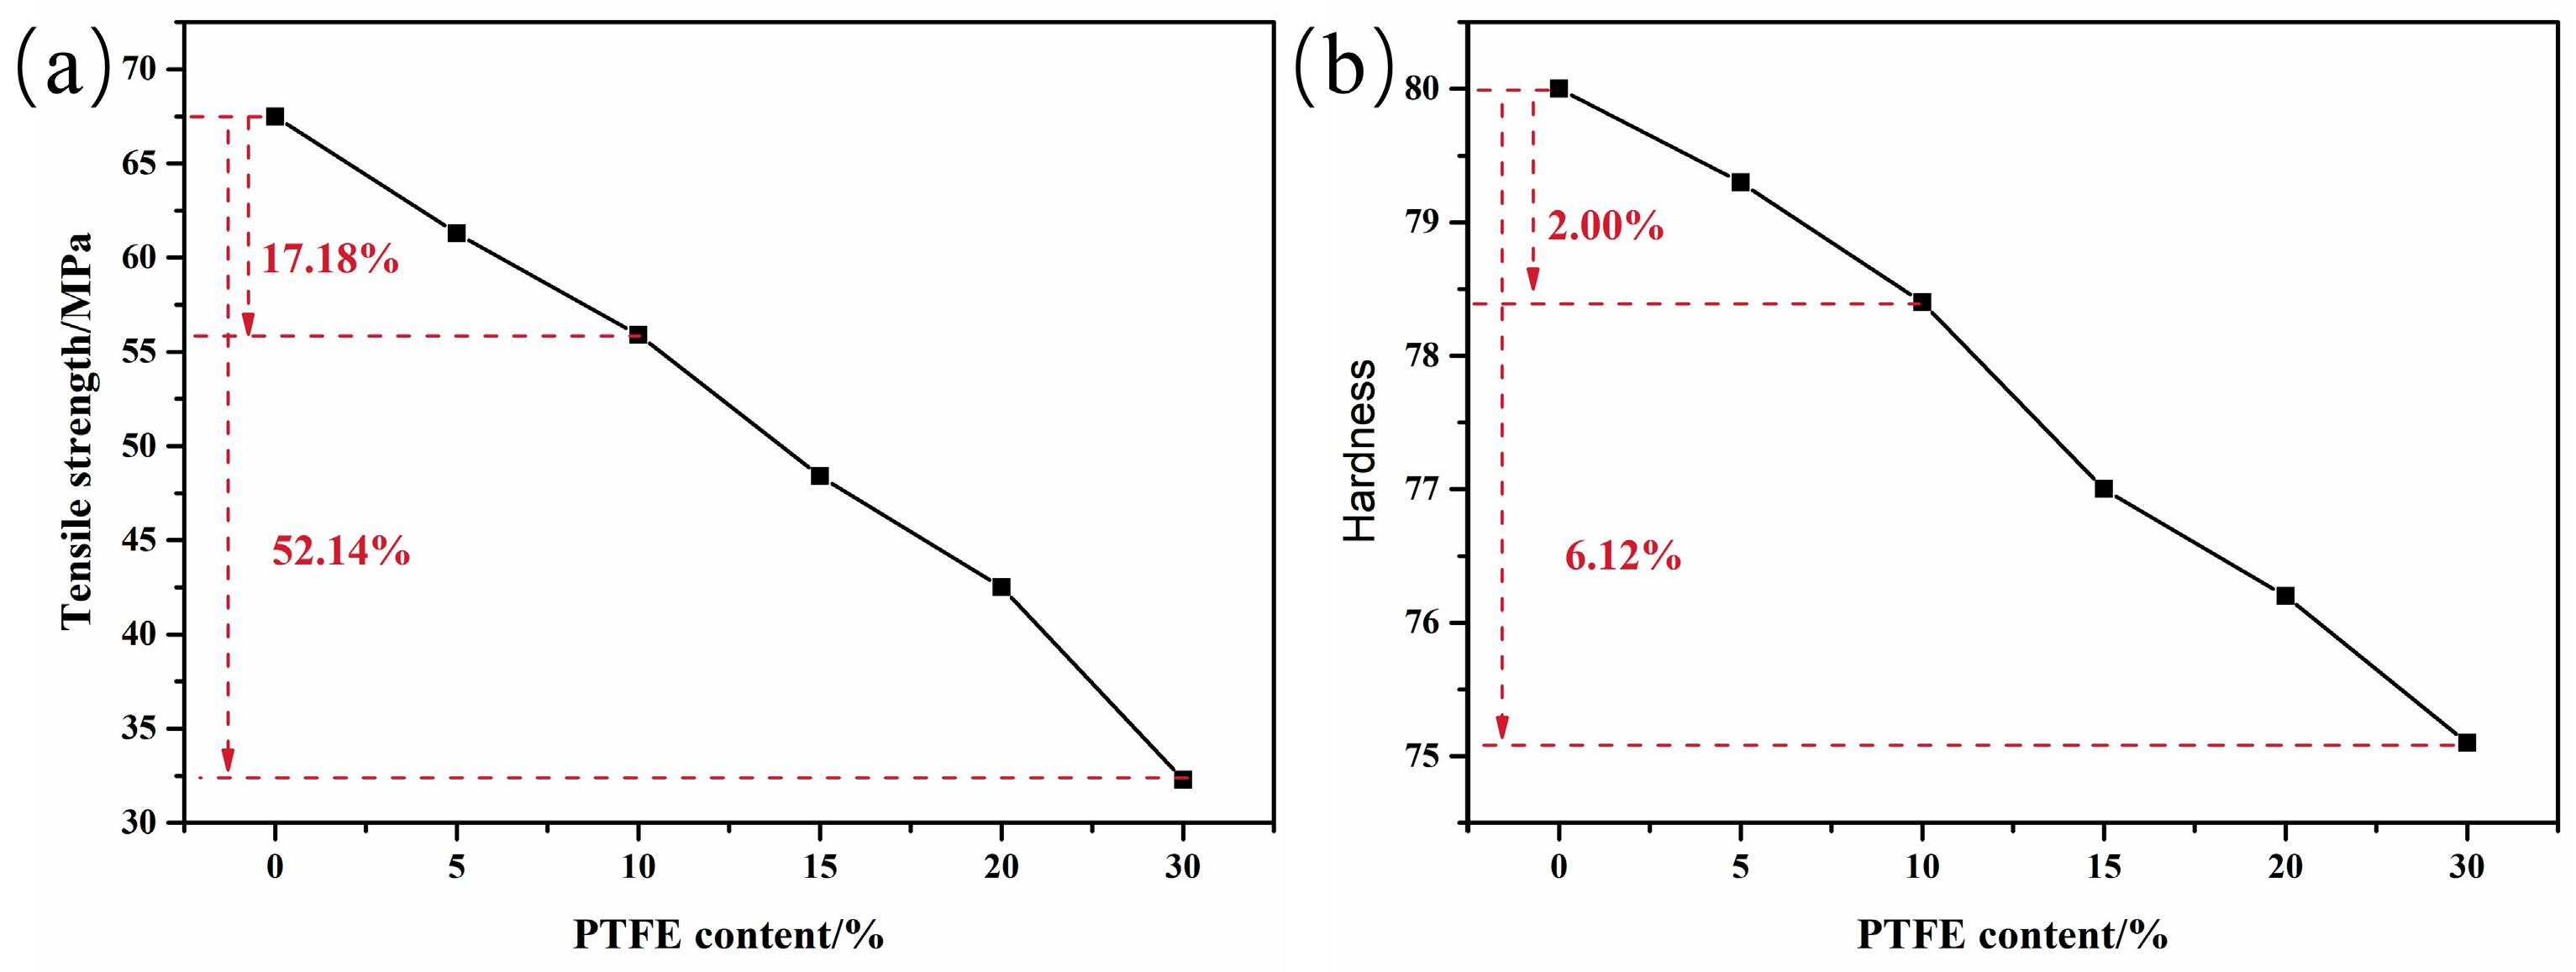
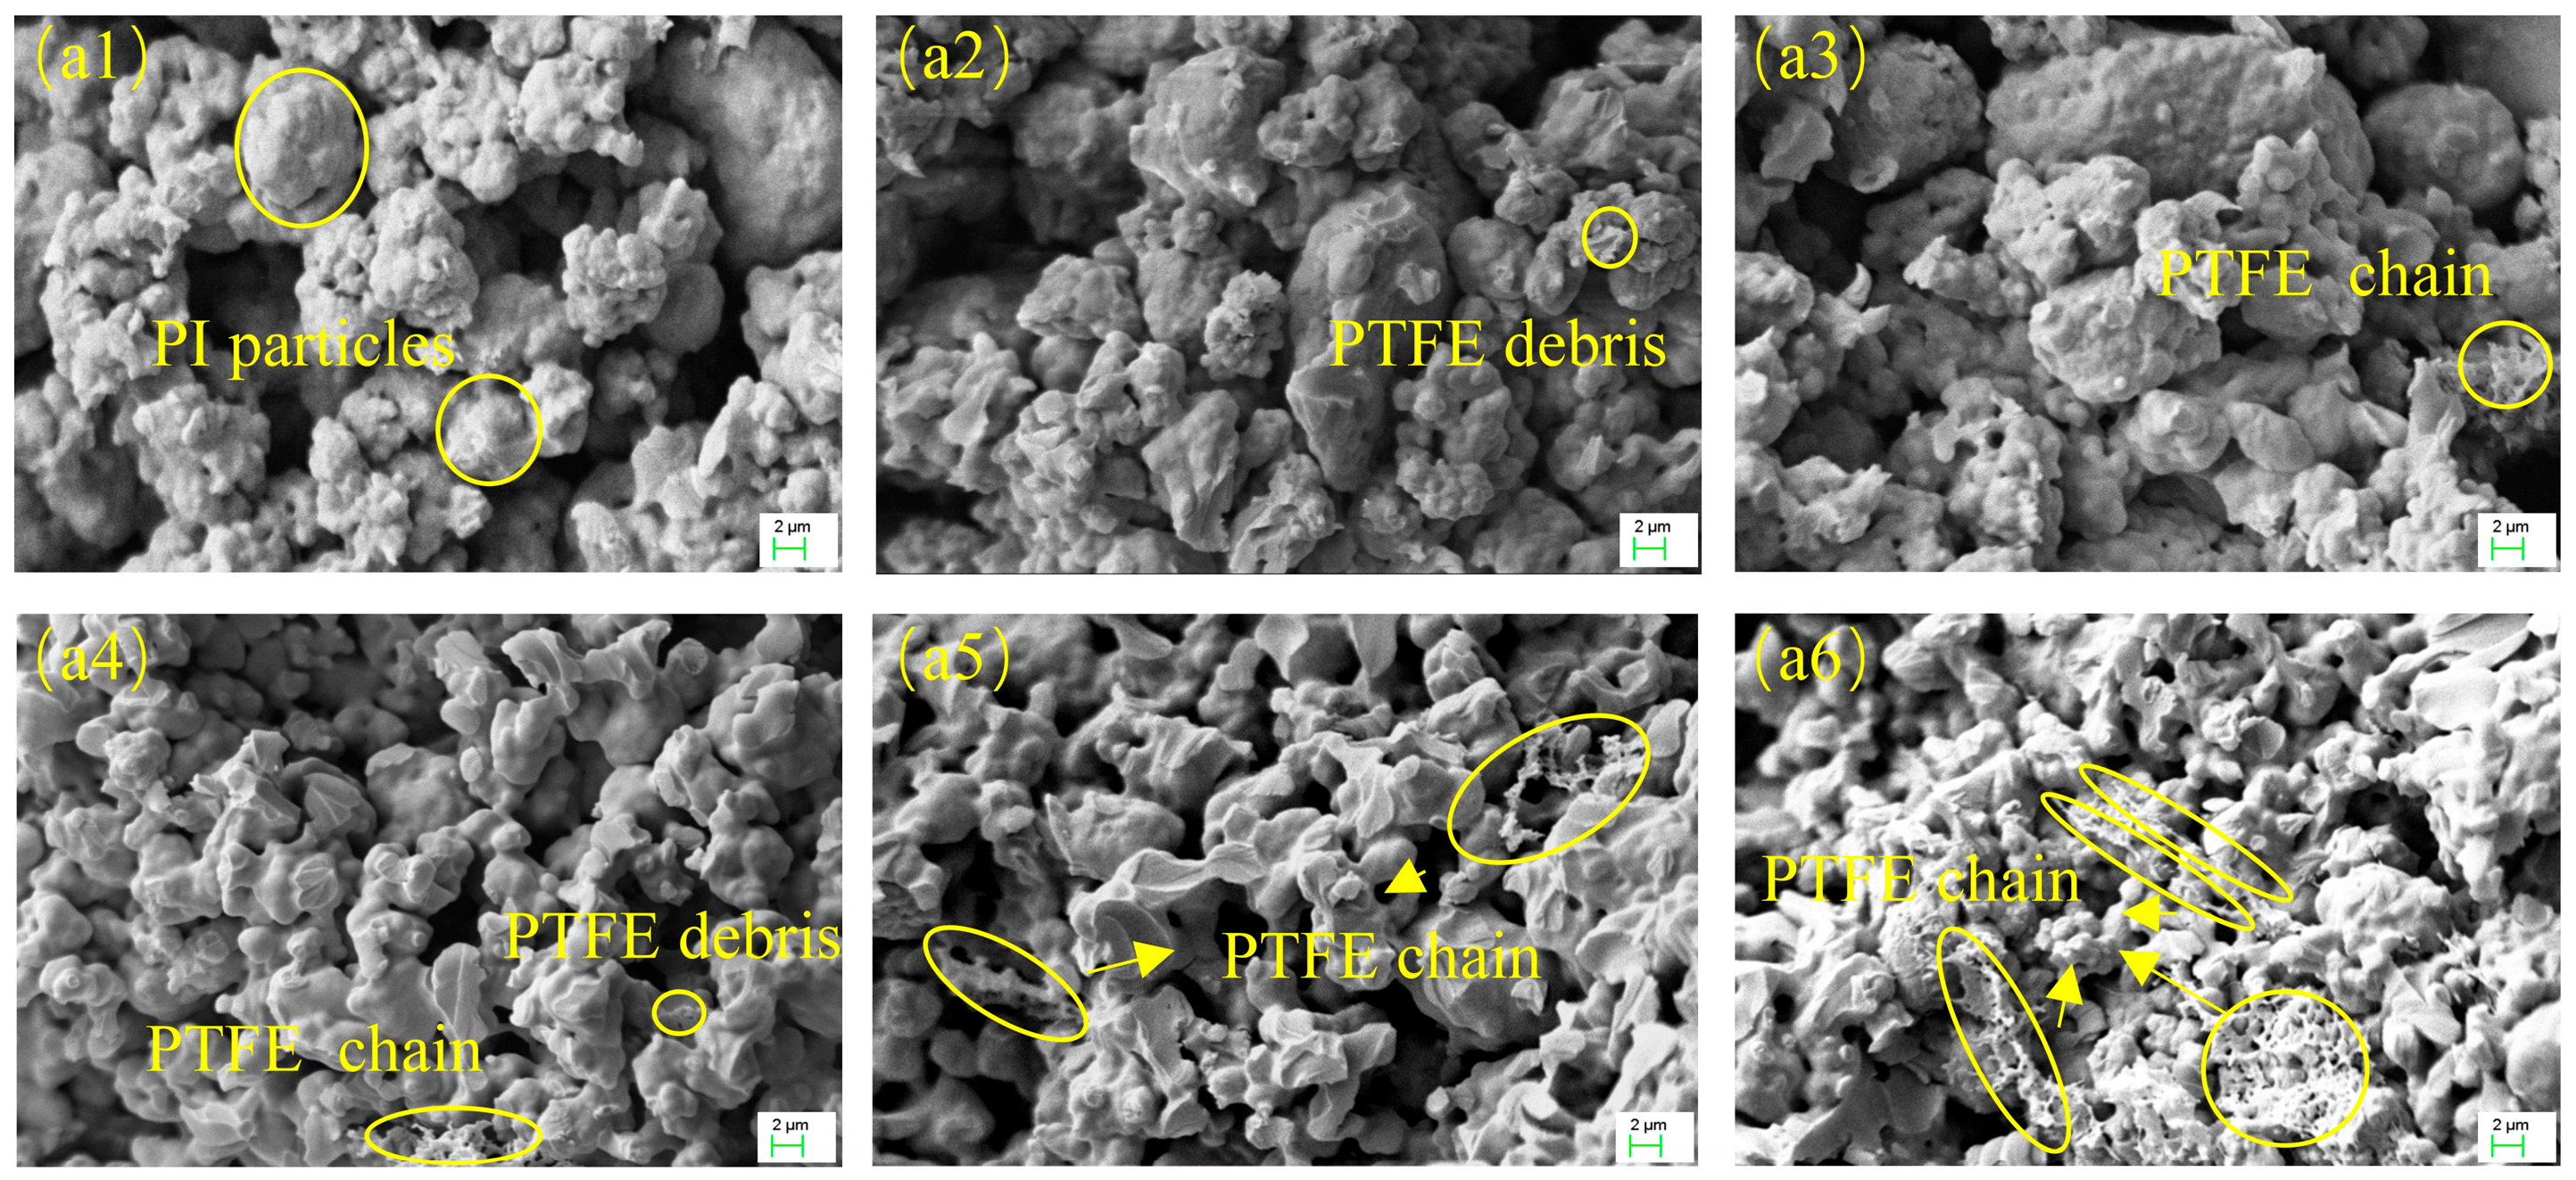
Figure 3a presents the cyclic tensile strength of the composites. As indicated, the incorporation of PTFE leads to a reduction in the porosity of PPI, resulting in a denser material structure. However, the tensile strength decreases significantly with increasing PTFE content—by 17.18% at 10% PTFE and by 52.14% at 30% PTFE. At such higher filler content, the strength becomes insufficient to meet the application requirements for bearing cages. When the PTFE proportion is low, it exists as discrete particles dispersed within the polyimide matrix, as visible in Figure 4. As the PTFE content increases beyond a certain threshold, it forms a continuous phase. In this case, the mechanical properties of the composite are predominantly governed by the polyimide matrix. Consequently, the tensile strength of the composite progressively declines with higher PTFE loading. Figure 3b illustrates the change in hardness of the PPI composites. The hardness decreases by 2.00% at 10% PTFE and by 6.12% at 30% PTFE. This reduction in hardness is expected to adversely affect the wear resistance of the material.

3.2. Micropore Properties

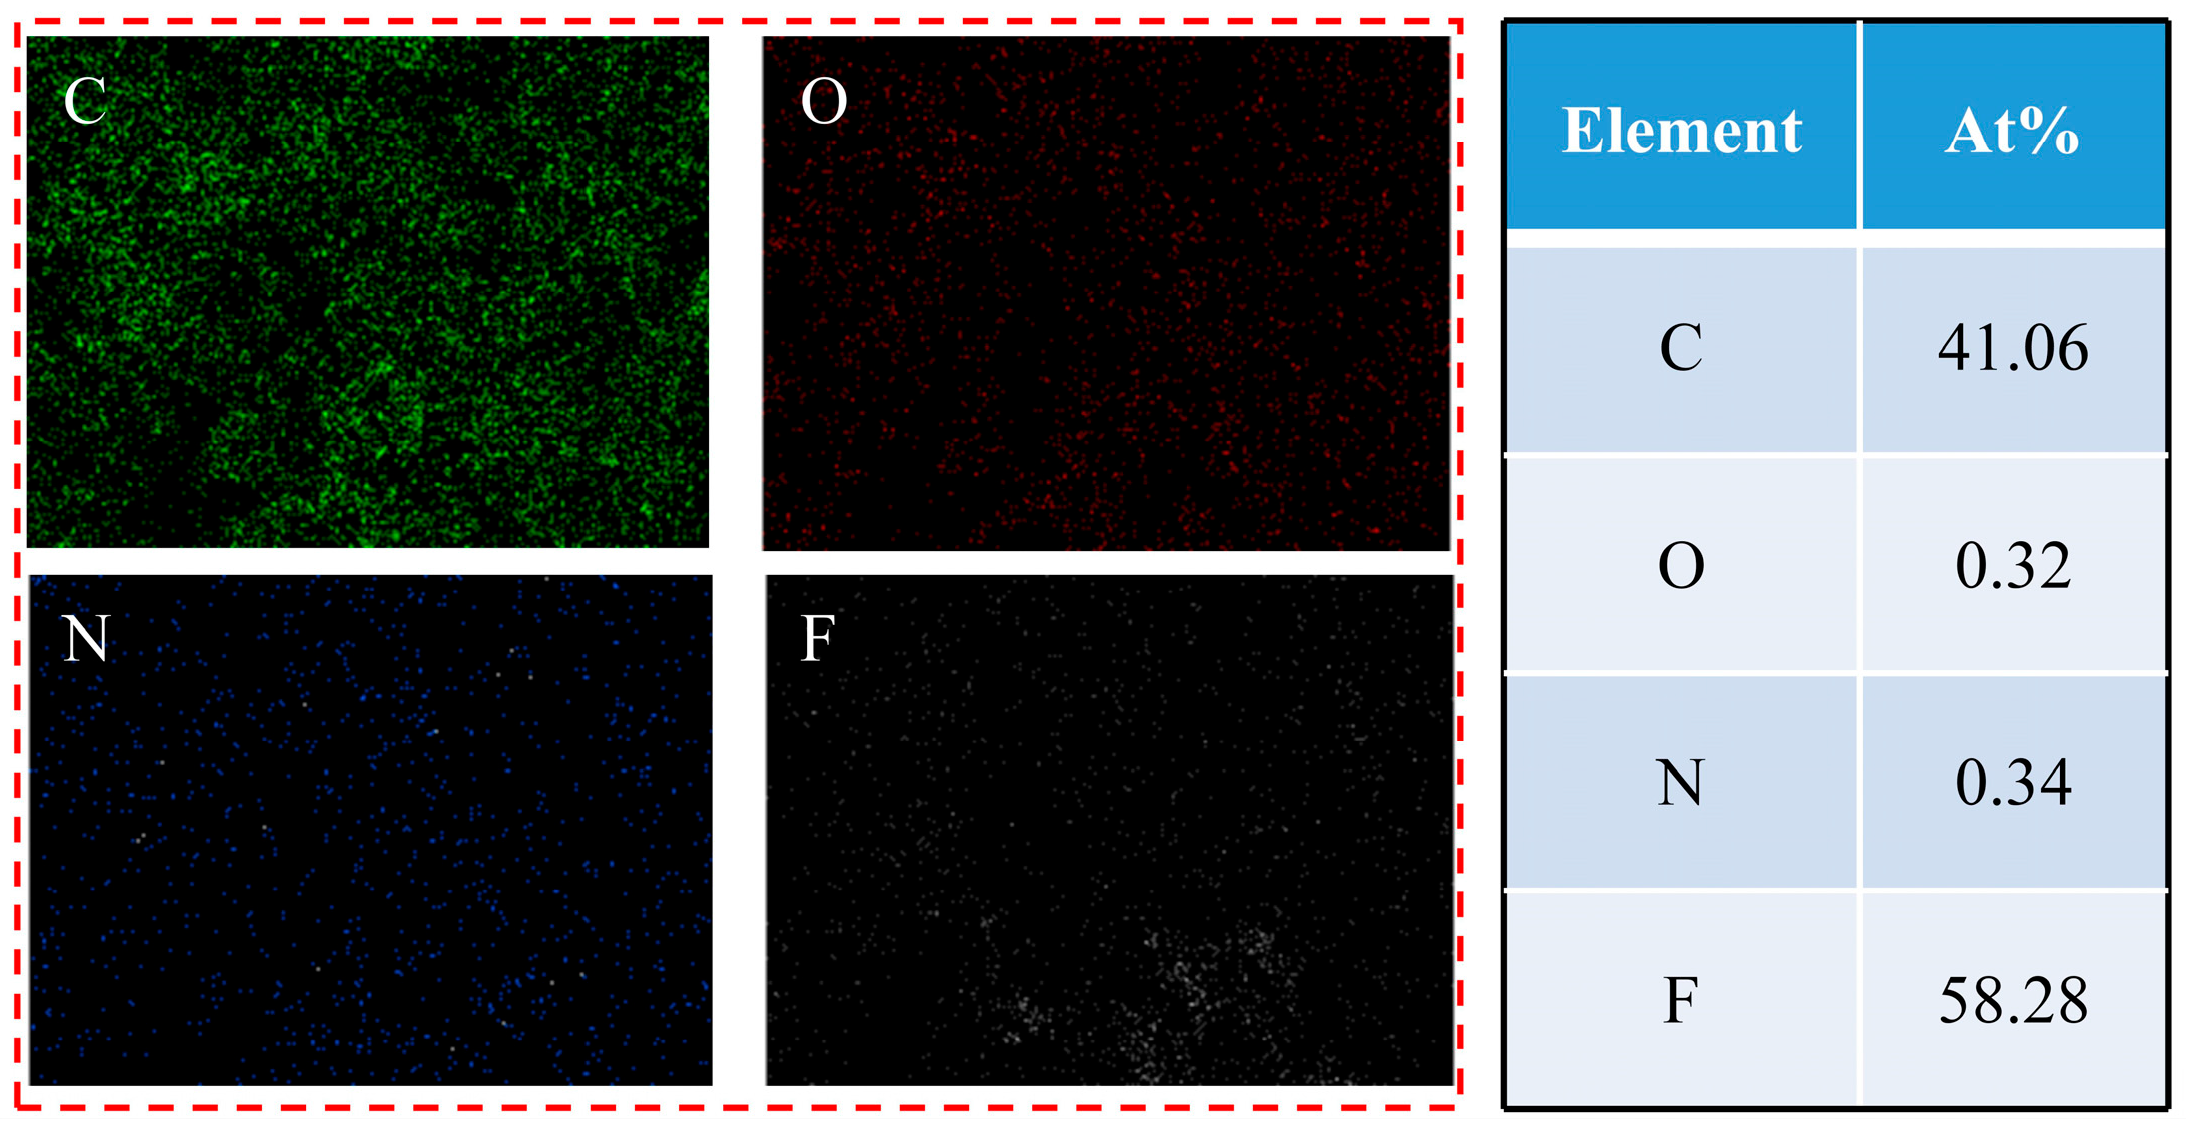
Figure 4 shows SEM images of PPI with different PTFE contents. As shown in Figure 4(a1), after cold pressing and thermal sintering, the PI particles assume a spherical shape and are evenly distributed. And the PI particles are relatively independent, with low levels of aggregation and connectivity. Consequently, the gaps between these formed particles create continuous and interconnected pores. Upon the addition of PTFE, as illustrated in Figure 4(a2–a6), the PI becomes more densely packed, and the particles are connected by dispersed PTFE, which seals the micropores. When the PTFE content increases to 15%, due to its higher concentration, PTFE tends to accumulate more easily, leading to the appearance of chain-like PTFE dispersions in the pore structure. At a 30% PTFE content, significant accumulation occurs, significantly reducing the porosity and pore size. Figure 5 illustrates the element distribution of the porous structure with a 30% PTFE content. It can be observed that the F element is evenly distributed, with a dense concentration in areas where PTFE accumulates.
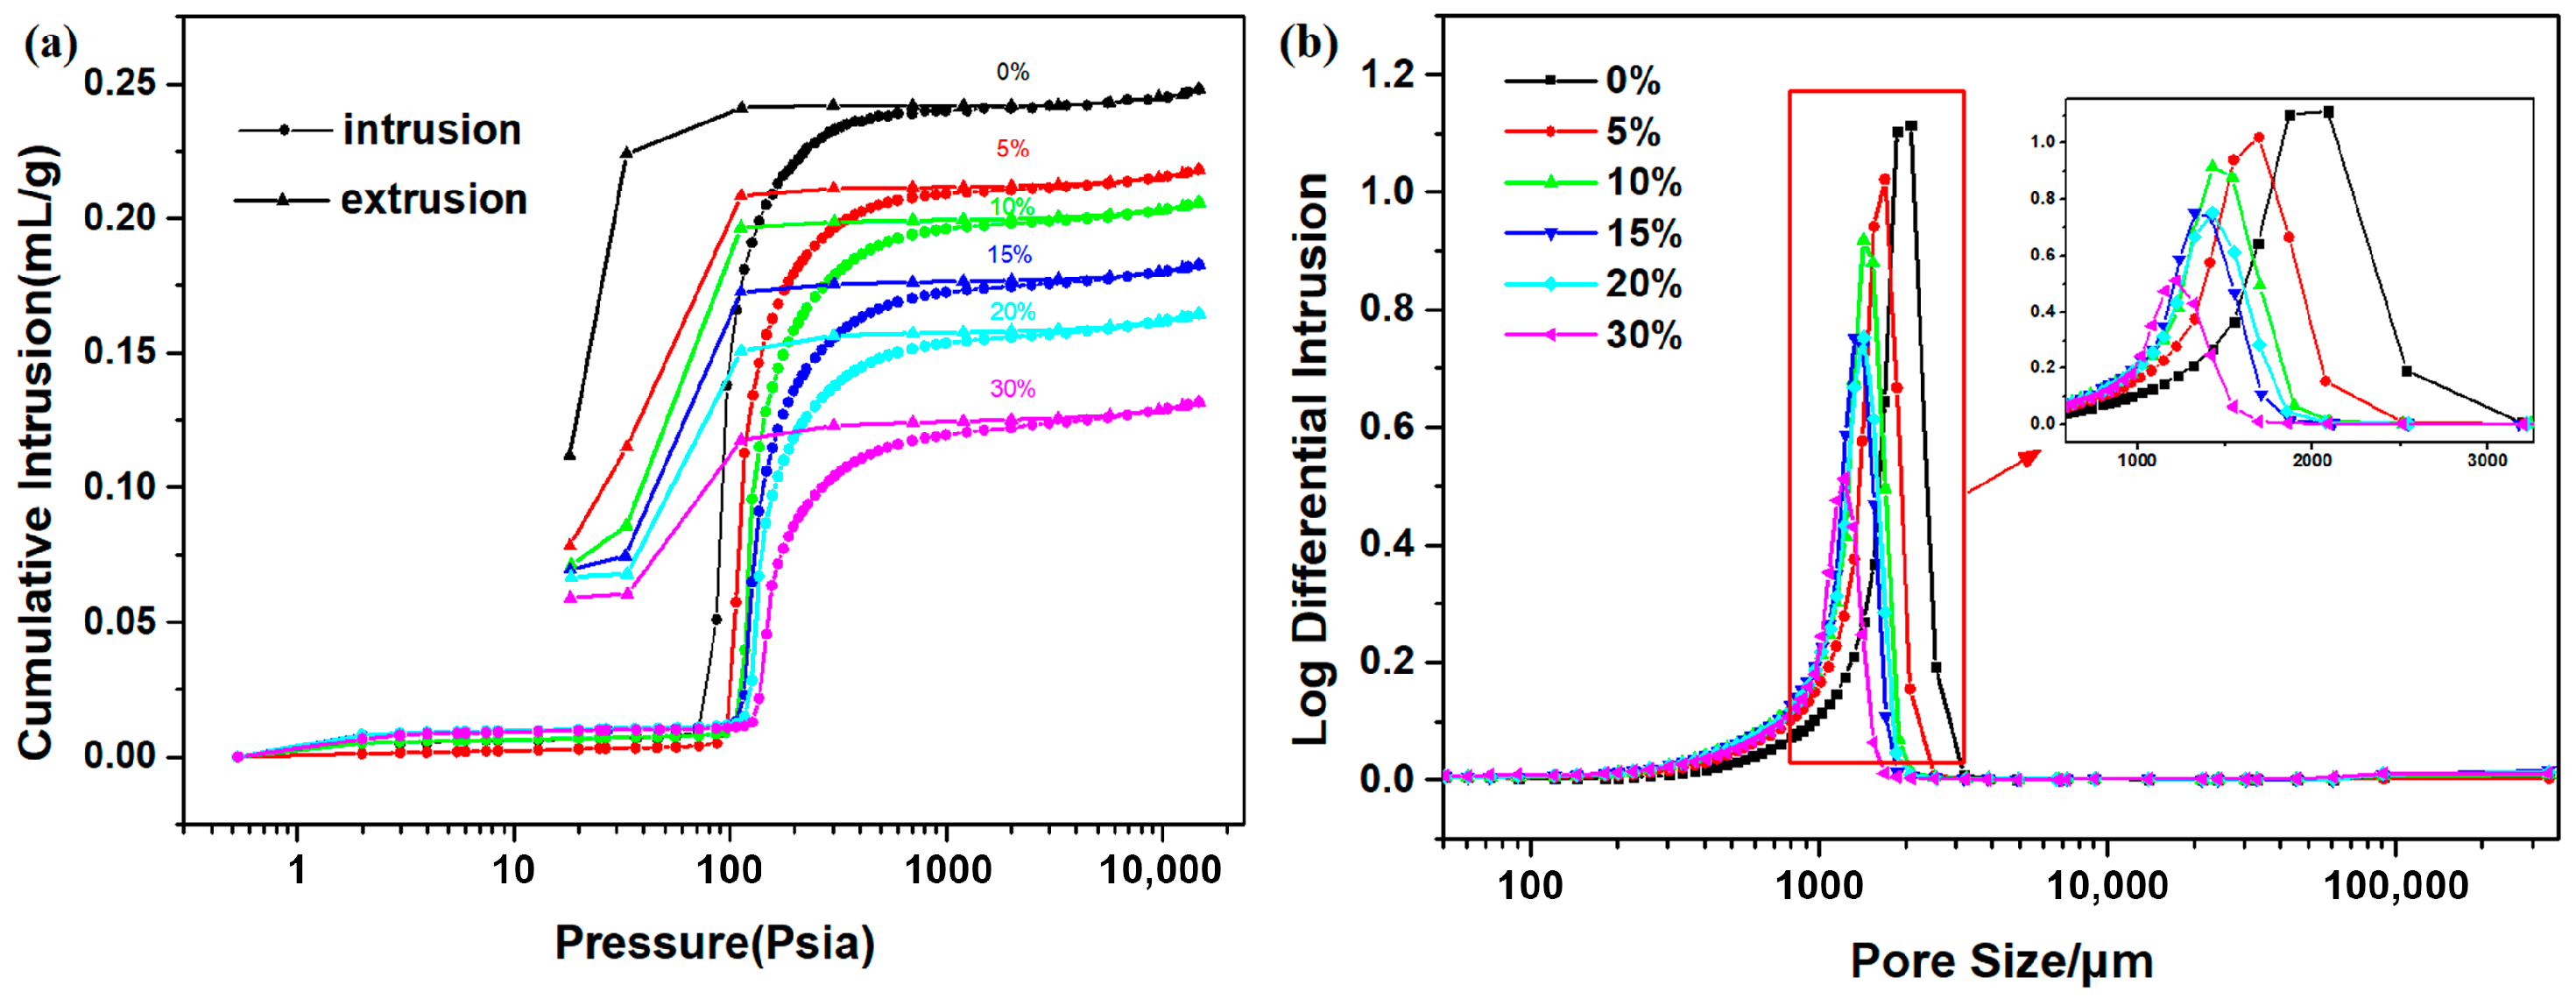
The micropore structure was further characterized using the intrusion and extrusion curves from the mercury porosimeter, as shown in Figure 6a. The extrusion curves of the five materials lag significantly and do not return to zero, indicating that the capillary effect of the micropore channels restricts mercury outflow, leaving some mercury trapped in the material. This confirms that the micropore structure is an interconnected ‘bottleneck pore’ structure. Figure 6b shows the pore size distribution curves of the six materials, revealing a concentrated pore size distribution, indicating uniform micropore formation.

3.3. Tribological Properties

3.3.1. Dry Friction

Figure 7a,b present the dry tribological performance of the materials. The friction coefficient of pure PI increases rapidly to 0.25 during the initial stage and subsequently fluctuates between 0.2 and 0.3. This behavior is attributed to direct solid–solid contact between the pure PI and the steel ball, leading to high friction and significant fluctuation. With the addition of PTFE, the friction coefficient remains low initially owing to its effective friction-reducing properties. At 5% PTFE content, the friction coefficient increases throughout the sliding period. At 10% PTFE, it gradually rises to 0.19 within the first 2000 s, then decreases and stabilizes around 0.18. This suggests that low PTFE content is insufficient to rapidly form and maintain a stable transfer film. In contrast, at higher PTFE contents (15%, 20%, and 30%), the material continuously generates PTFE debris under shear forces, facilitating the formation and maintenance of a transfer film. This results in significantly reduced and stable friction coefficients of 0.082, 0.069, and 0.064, respectively. Figure 7b illustrates the average friction coefficient and wear rate. As the PTFE content increases, the average friction coefficient decreases gradually. The wear rate also decreases initially but increases at 30% PTFE. This trend can be explained by the reduced porosity and lower surface roughness at higher PTFE contents, which contribute to a lower friction coefficient. However, the weak molecular structure of PTFE compromises the load-bearing capacity of the composite. Although friction is reduced, the wear resistance deteriorates, leading to more severe wear at elevated PTFE levels.

3.3.2. Oil-Containing Friction

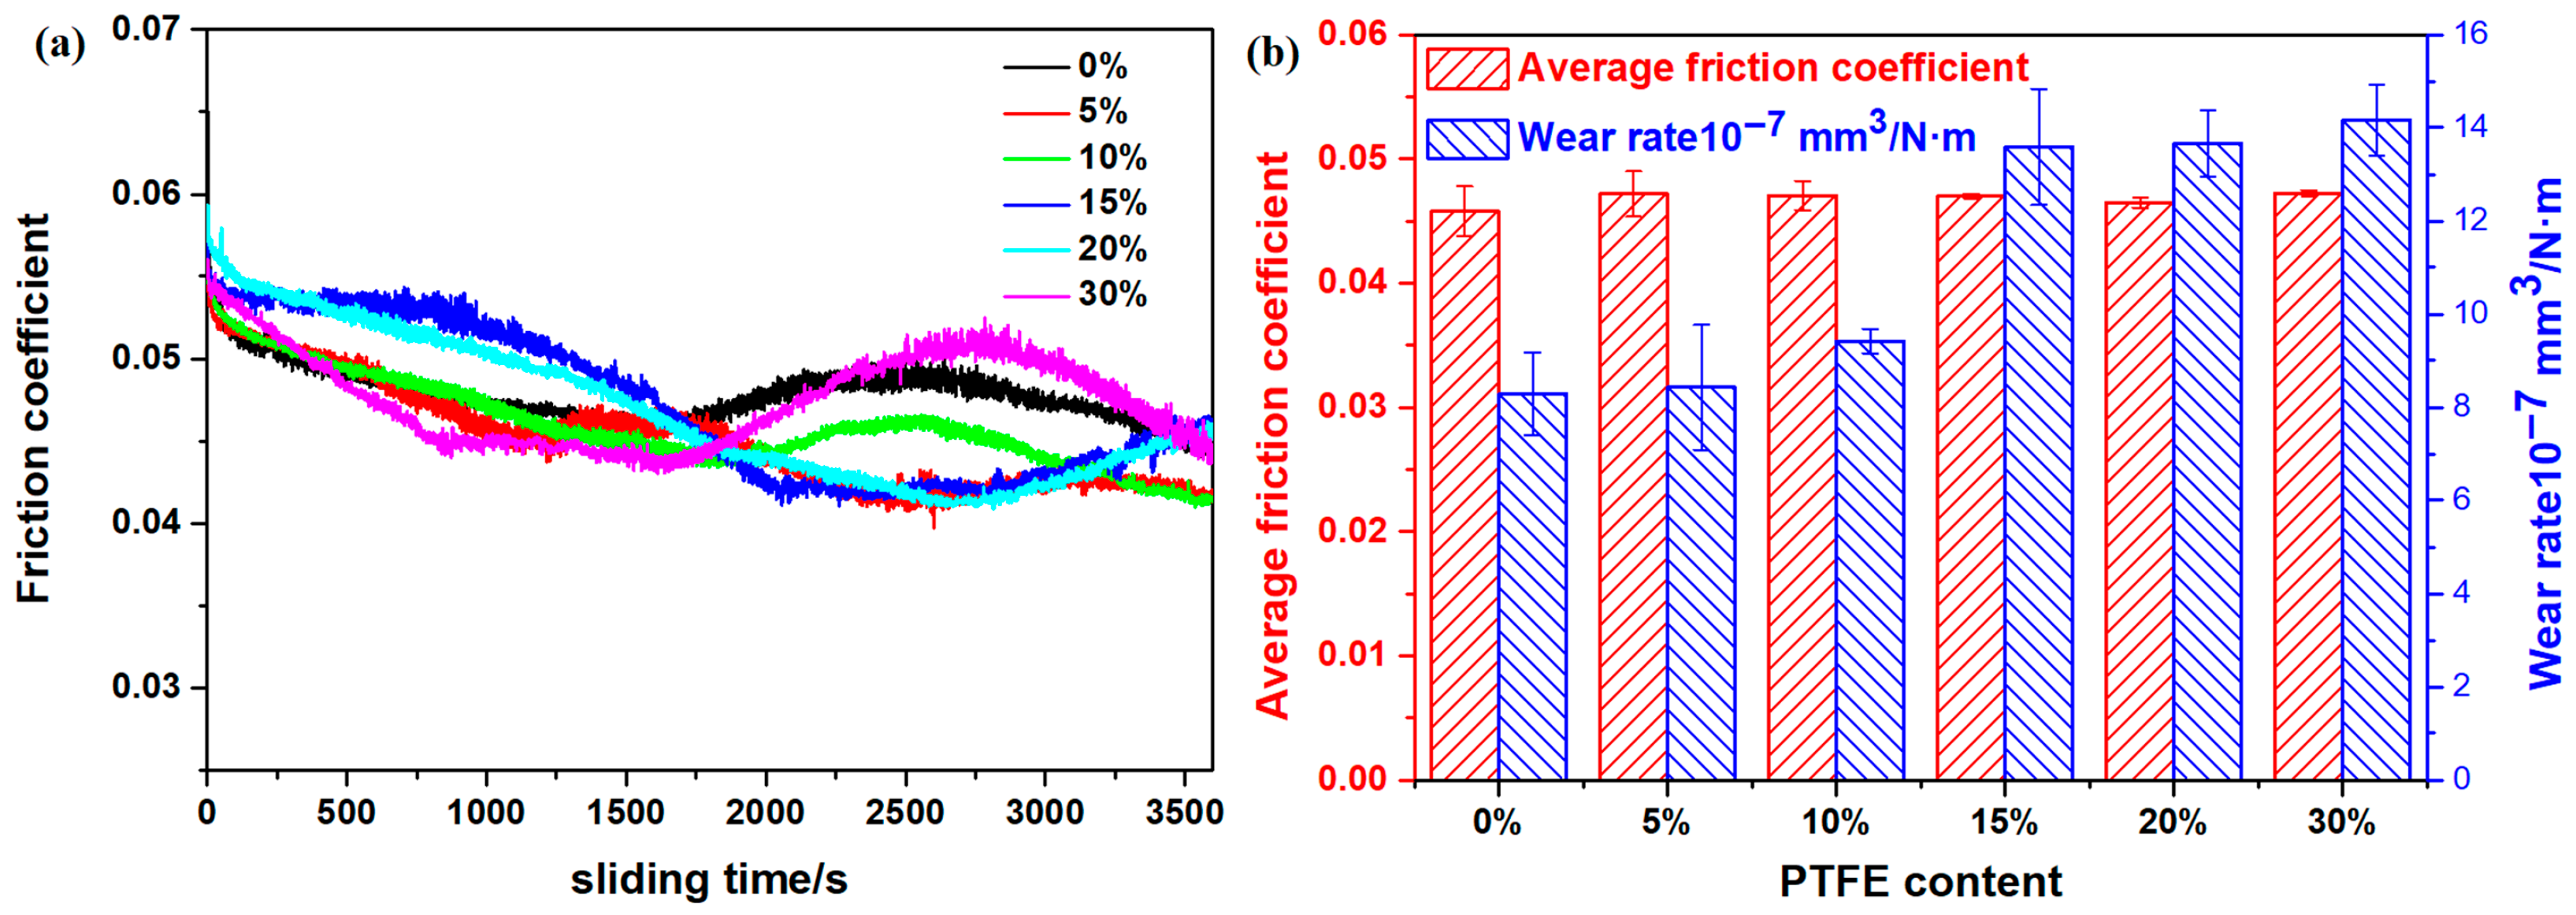
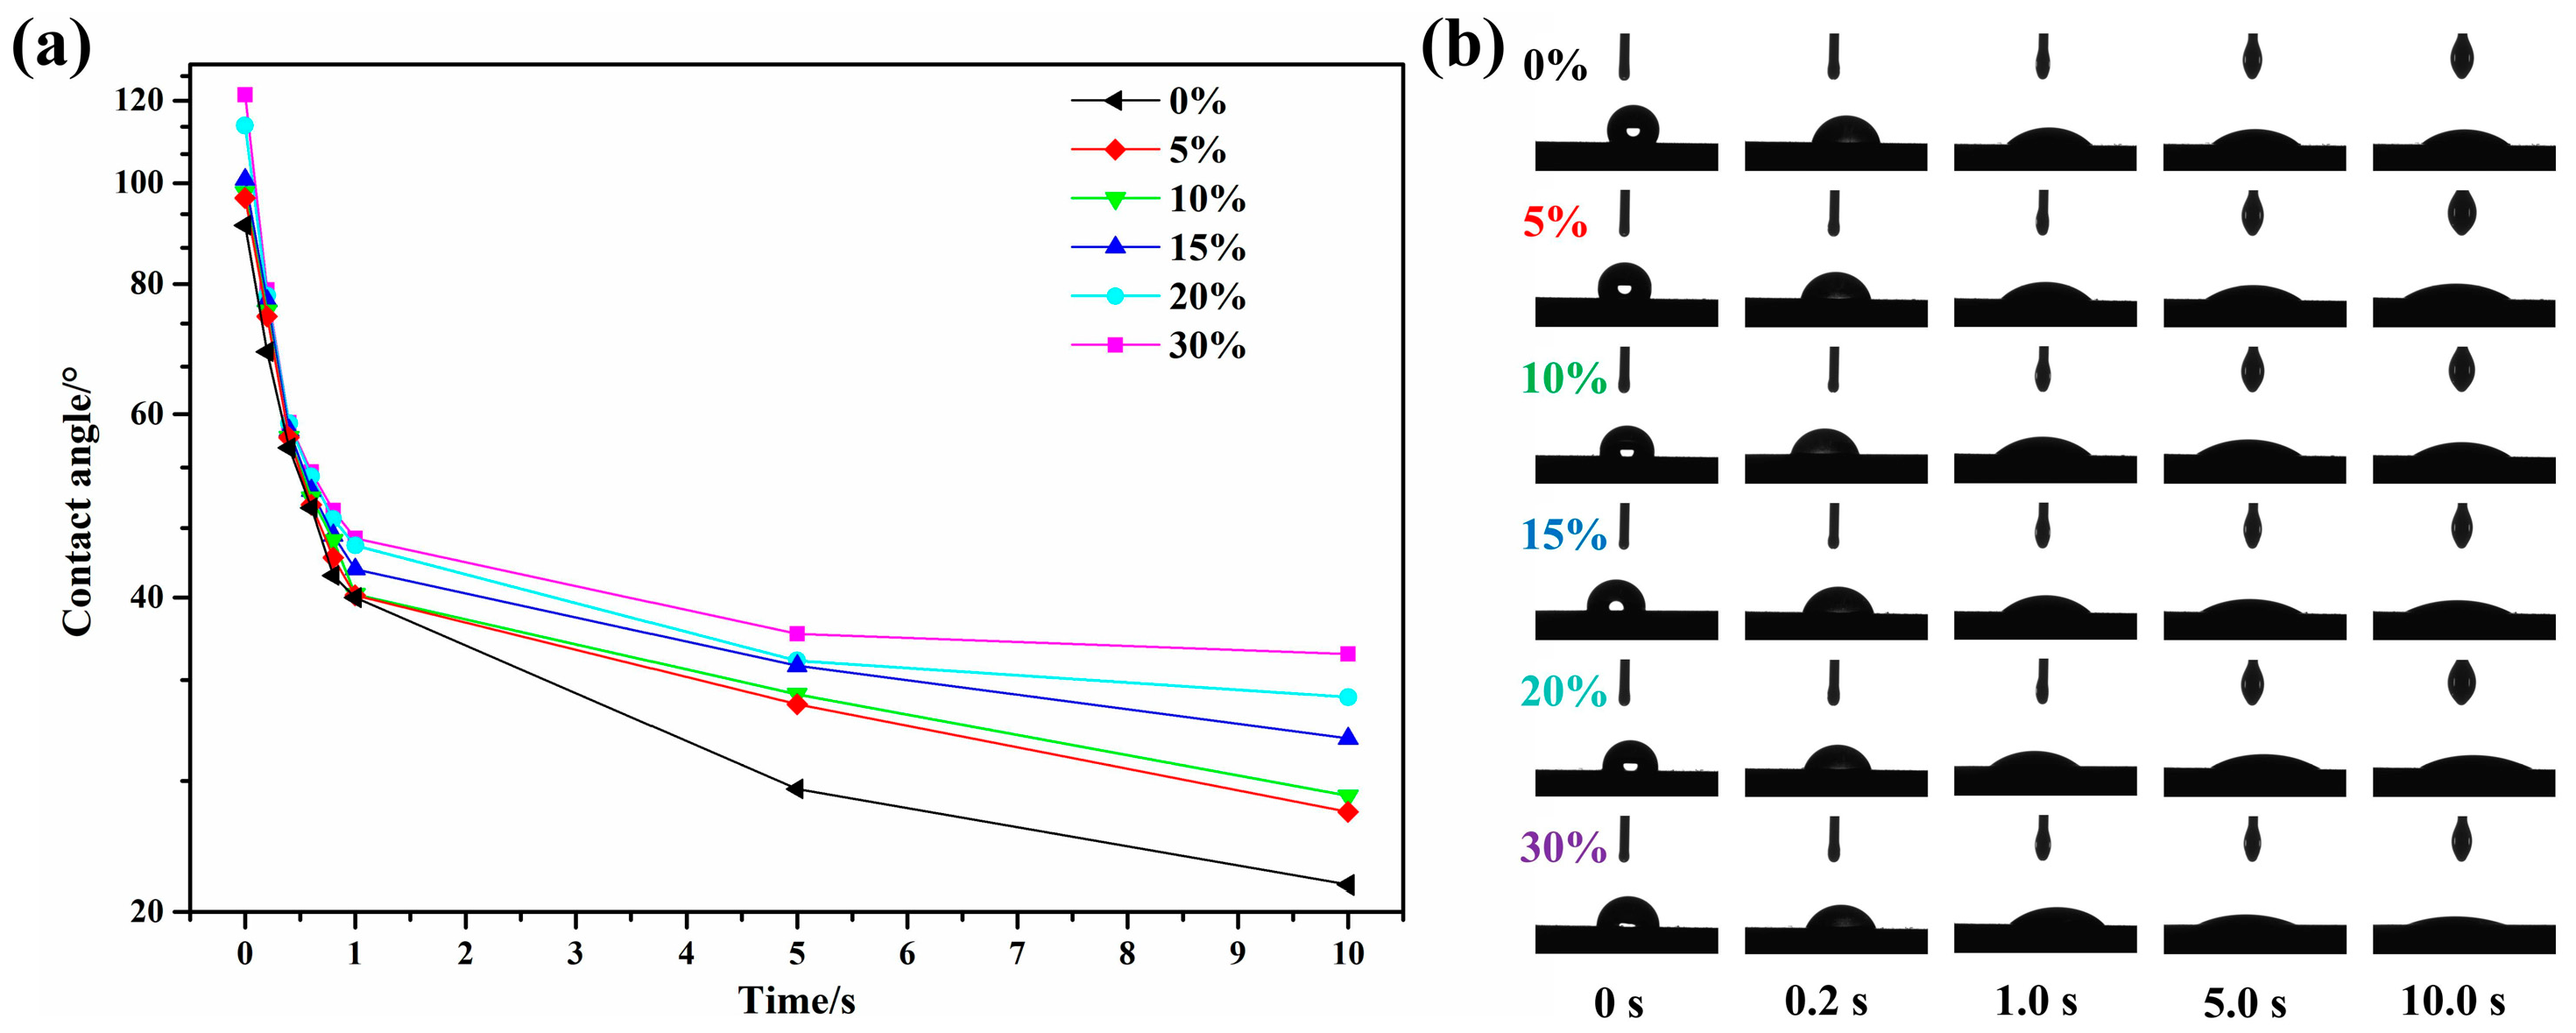
Figure 8 illustrates the oil-containing tribological performance of PPI. Figure 8a shows that the friction coefficient of oil-containing samples remains between 0.04 and 0.06, which is significantly lower compared to that of samples without oil, and the friction curves remain stable. This is because PPI releases lubricating oil stored in its microporous structure to the contact interface under load and frictional heat, forming an oil film. In contrast, PTFE does not form a transfer film. Instead, lubrication is achieved via the interfacial oil film. In addition, the microporous structure of PPI can reabsorb lubricating oil via capillary force. As shown in Figure 9, contact angle measurements of PAO oil on PPI samples were conducted to investigate wettability. The results show that the contact angle decreases rapidly within 1.0 s, indicating good wettability between PPI and PAO oil. This reflects the excellent oil reabsorption capacity of PPI materials. This ensures a release-reabsorption cycle of lubricating oil during long-term friction, enabling the recycling of lubricant and extending lubrication life. Furthermore, increased PTFE content reduces the porosity of PPI, worsening the wettability between PPI and PAO oil and increasing the contact angle.
As depicted in Figure 9b, the average friction coefficient of oil-containing PPI decreases significantly to approximately 0.047. The friction coefficients of PPI with different PTFE contents are very close, indicating that the lubricating oil adsorbed on the friction interface plays a dominant role, with a minor contribution from PTFE. However, the wear rate of OCPPI slightly increases with increasing PTFE content. The wear rates at 0%, 5%, and 10% PTFE are 8.28 × 10⁻⁷ mm3/N·m, 8.43 × 10⁻⁷ mm3/N·m, and 9.42 × 10⁻⁷ mm3/N·m, respectively. In contrast, the wear rates at 15%, 20%, and 30% PTFE content increase to 1.36 × 10⁻⁶ mm3/N·m, 1.37 × 10⁻⁶ mm3/N·m, and 1.42 × 10⁻⁶ mm3/N·m. This indicates that wear resistance gradually decreases when the PTFE content exceeds 10%, due to the poor load-bearing capacity and wear resistance of PTFE.

3.4. Wear and Lubrication Mechanism

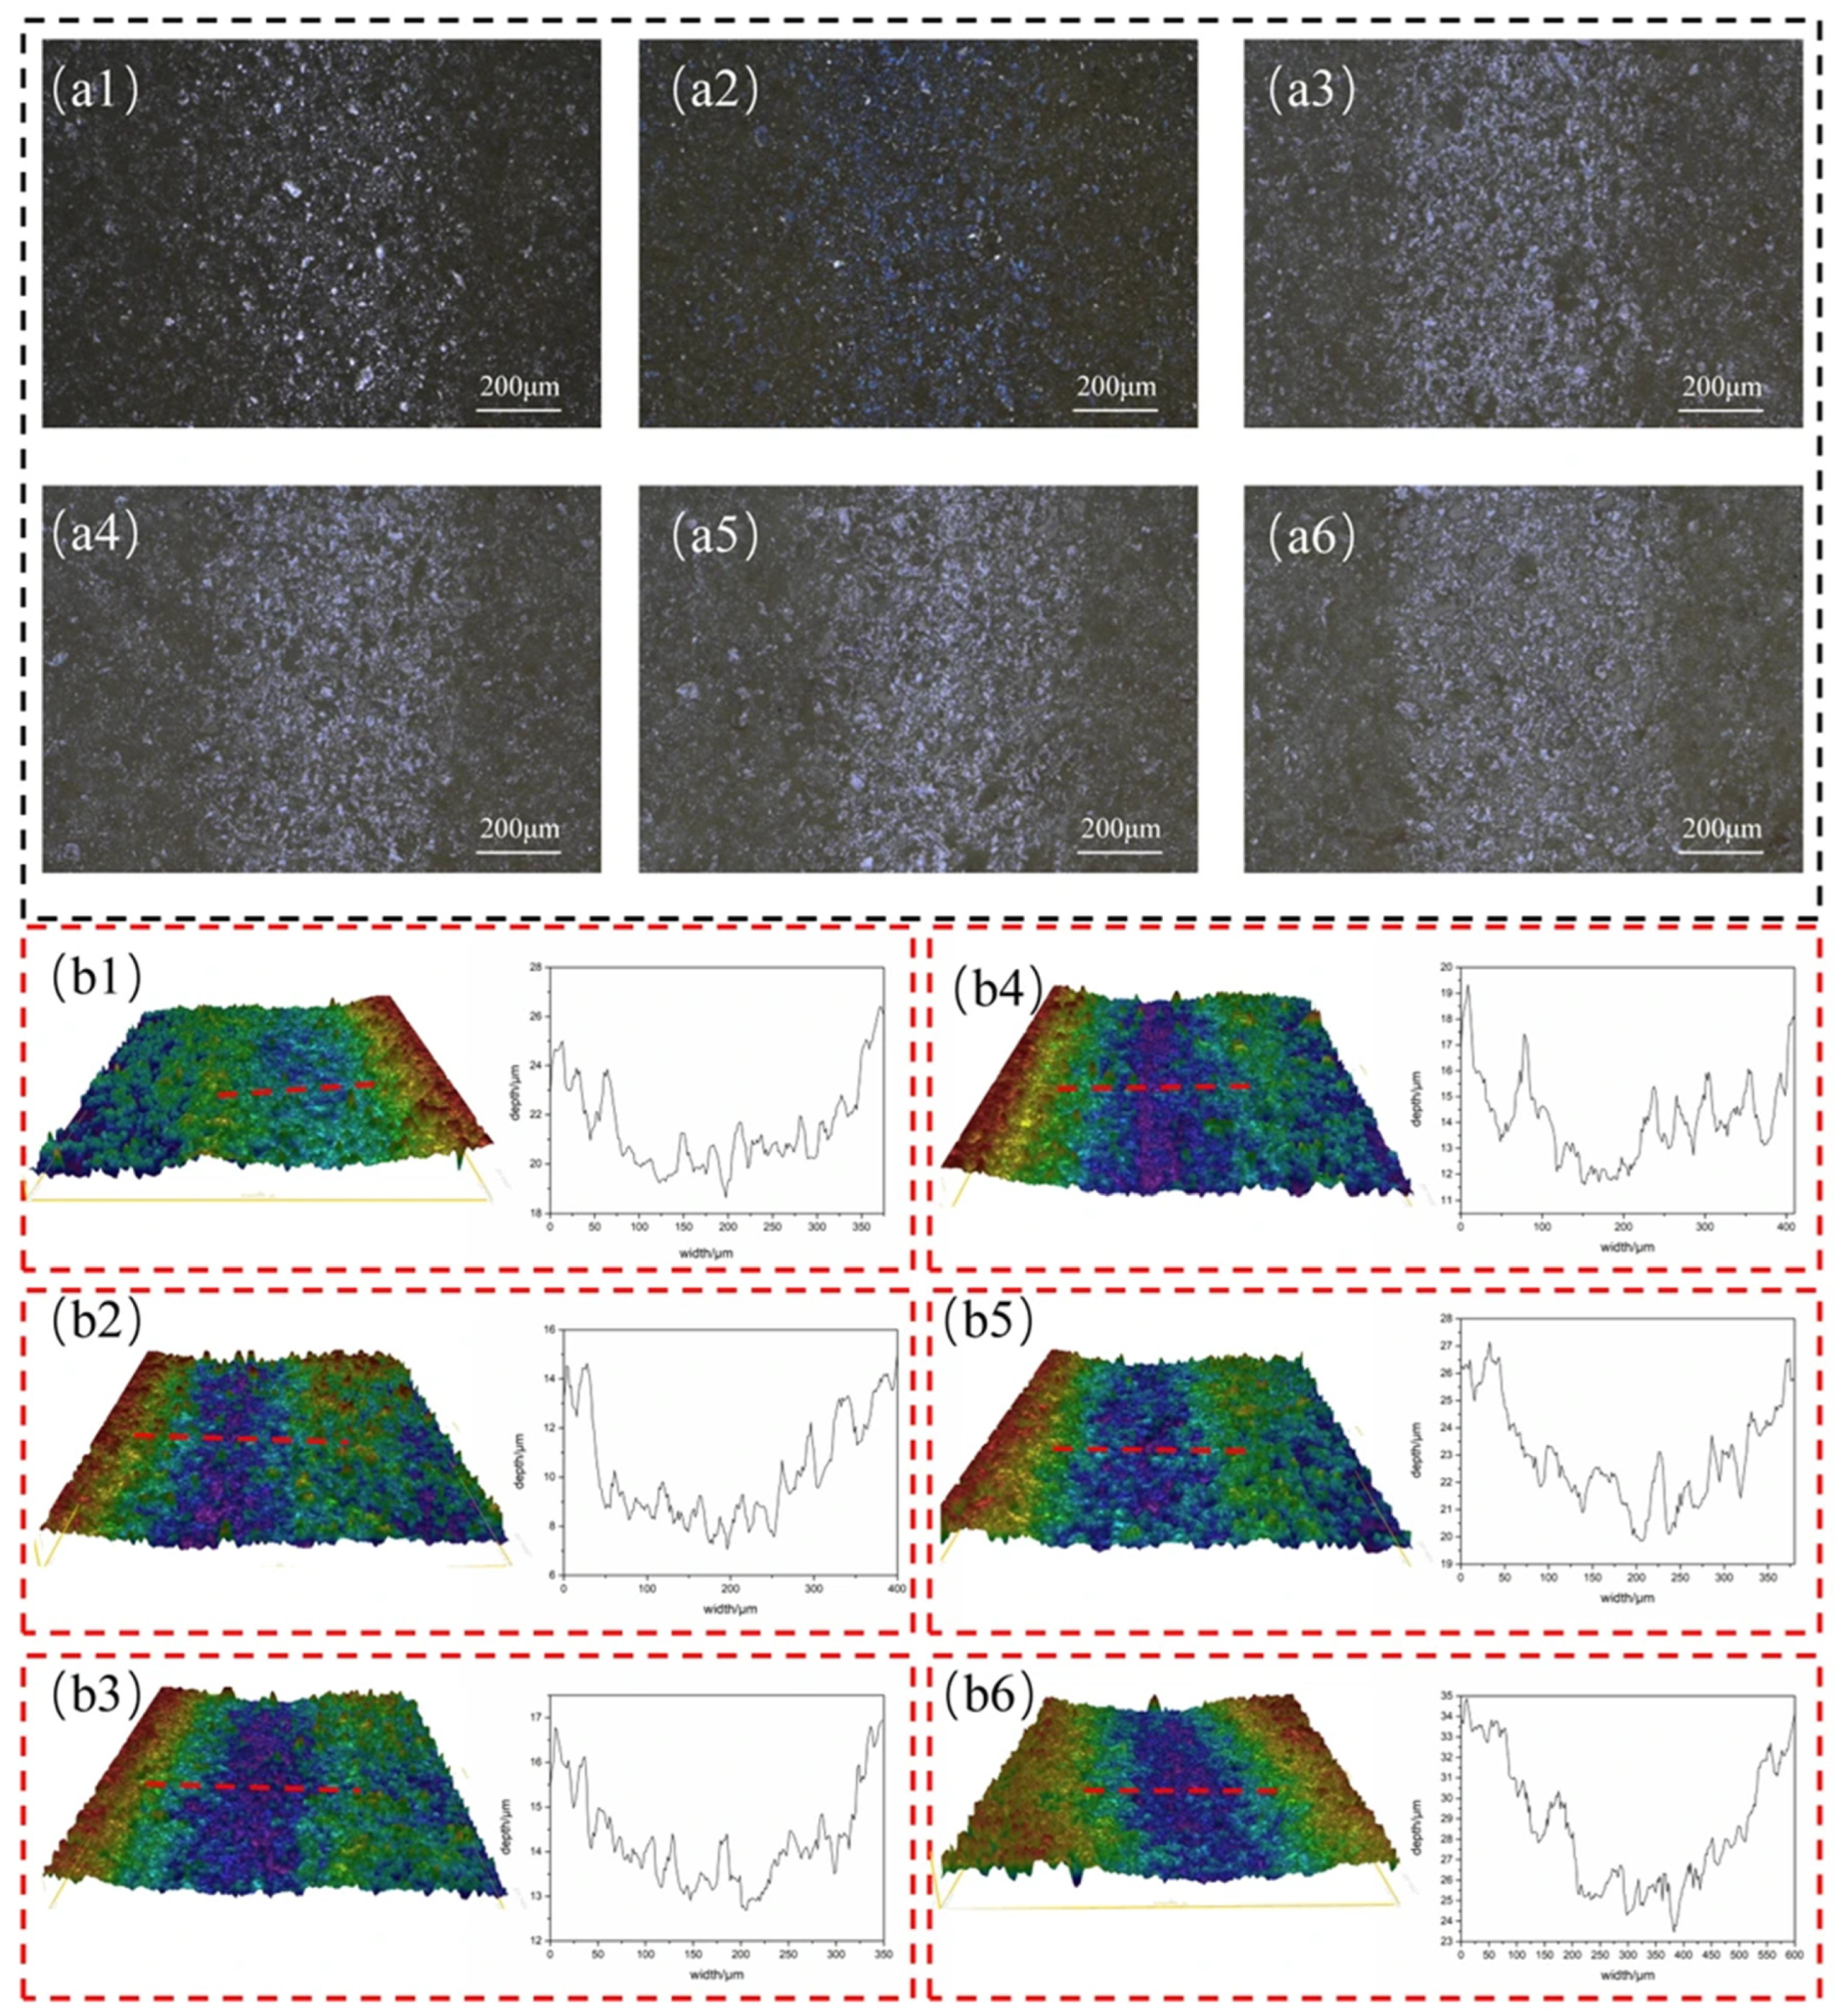
To investigate the tribological mechanism, wear morphologies were observed. Figure 10(a1–a6,b1–b6) show the dry friction wear scars and their 3D morphologies. At 0% and 5% PTFE, severe wear occurs, with obvious transverse cracks in the wear scars, which have a width of approximately 600 μm and a depth of approximately 16 μm. This is because a continuous PTFE transfer film cannot form or is difficult to form. As a result, the PI matrix comes into direct contact with the steel ball, leading to solid–solid friction. Additionally, the high shear strength of PI causes hard particles to be generated during sliding. These particles cause abrasive wear, as shown in Figure 11(a1,a2). In these figures, a large amount of flake and block wear debris accumulates on the steel ball surface, with slight scratches visible. Furthermore, prolonged sliding leads to fatigue wear on the material surface. At 10% PTFE, slight scratches appear on the wear scar along the sliding direction, as shown in Figure 10(a3–a6). At 15%, 20%, and 30% PTFE, only minor pits are observed on the wear scar surface, with a reduced depth of 10 μm. Figure 11(a3–a6) show only a small amount of fine wear debris on the steel ball surface, as PTFE molecular chains break under load, generating debris that gradually forms a transfer film under shear force. This transfer film results in adhesive wear, which significantly reduces both friction and wear [26,27,28,29].
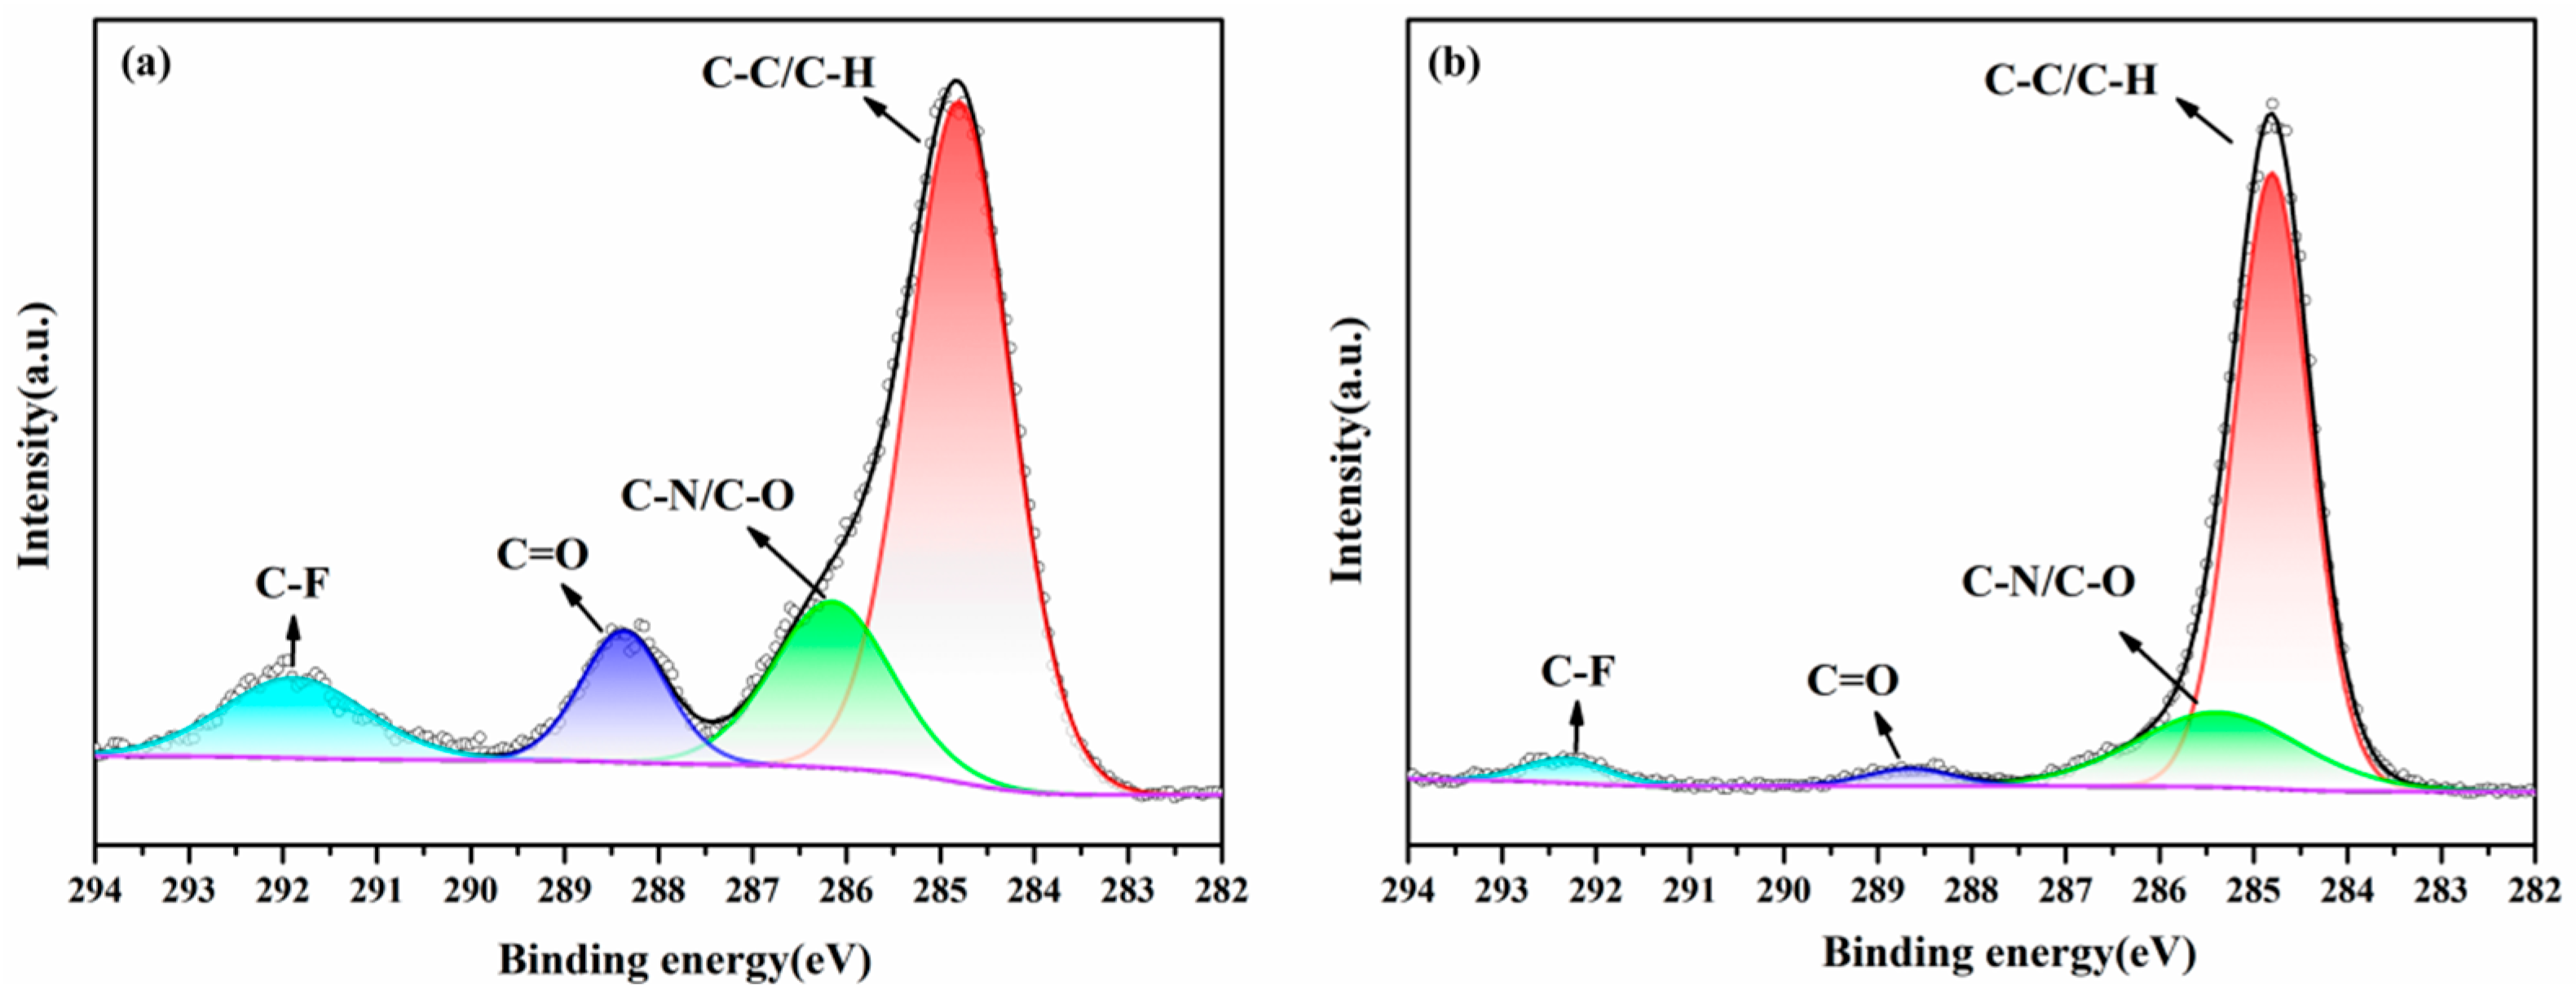
Figure 12 compares the C 1s XPS spectra of mixtures on the steel ball surface, with Figure 12a for pure PI and Figure 12b for PI/15% PTFE. Without PTFE, four C 1s peaks are observed in the binding energy range of 282–290 eV. These peaks are assigned to C-C/C-H at 284.8 eV, C-N/C-O near 285.5 eV, and C=O near 288.4 eV, which are characteristic peaks of PI. After adding PTFE, a new peak appears near 292.0 eV, corresponding to the C-F characteristic peak of PTFE. This indicates that both PI and PTFE form solid transfer films.
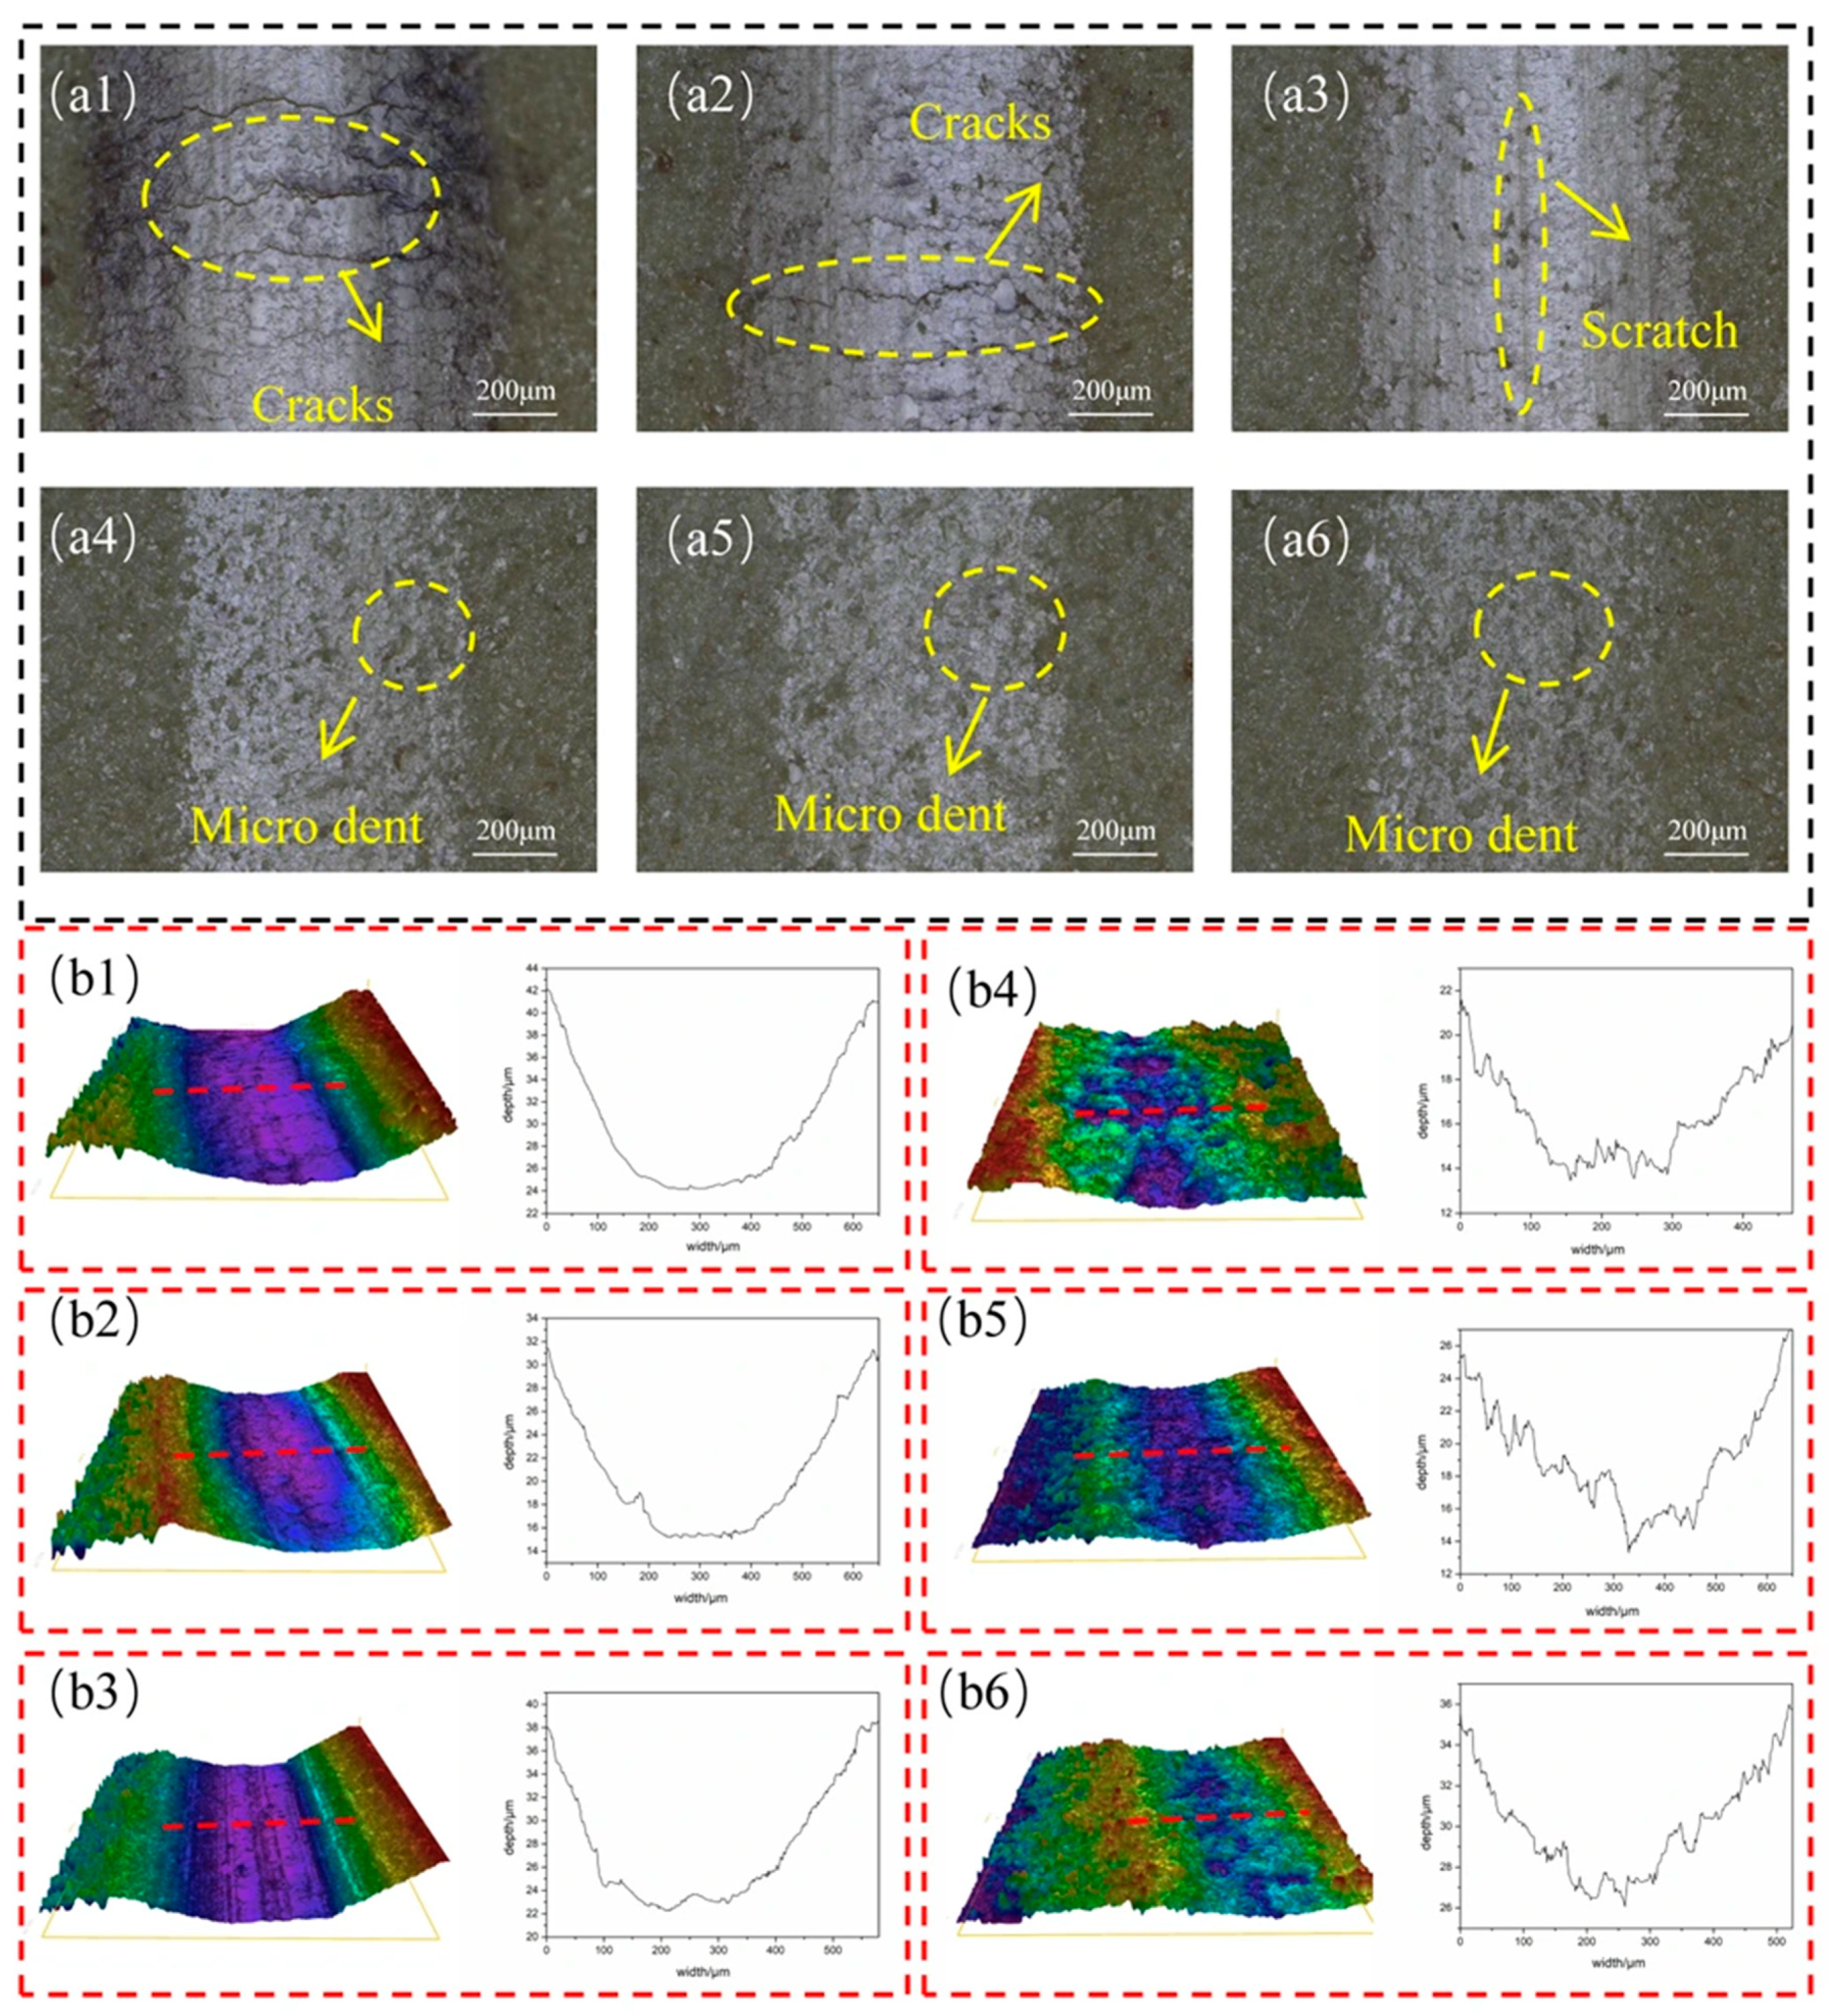
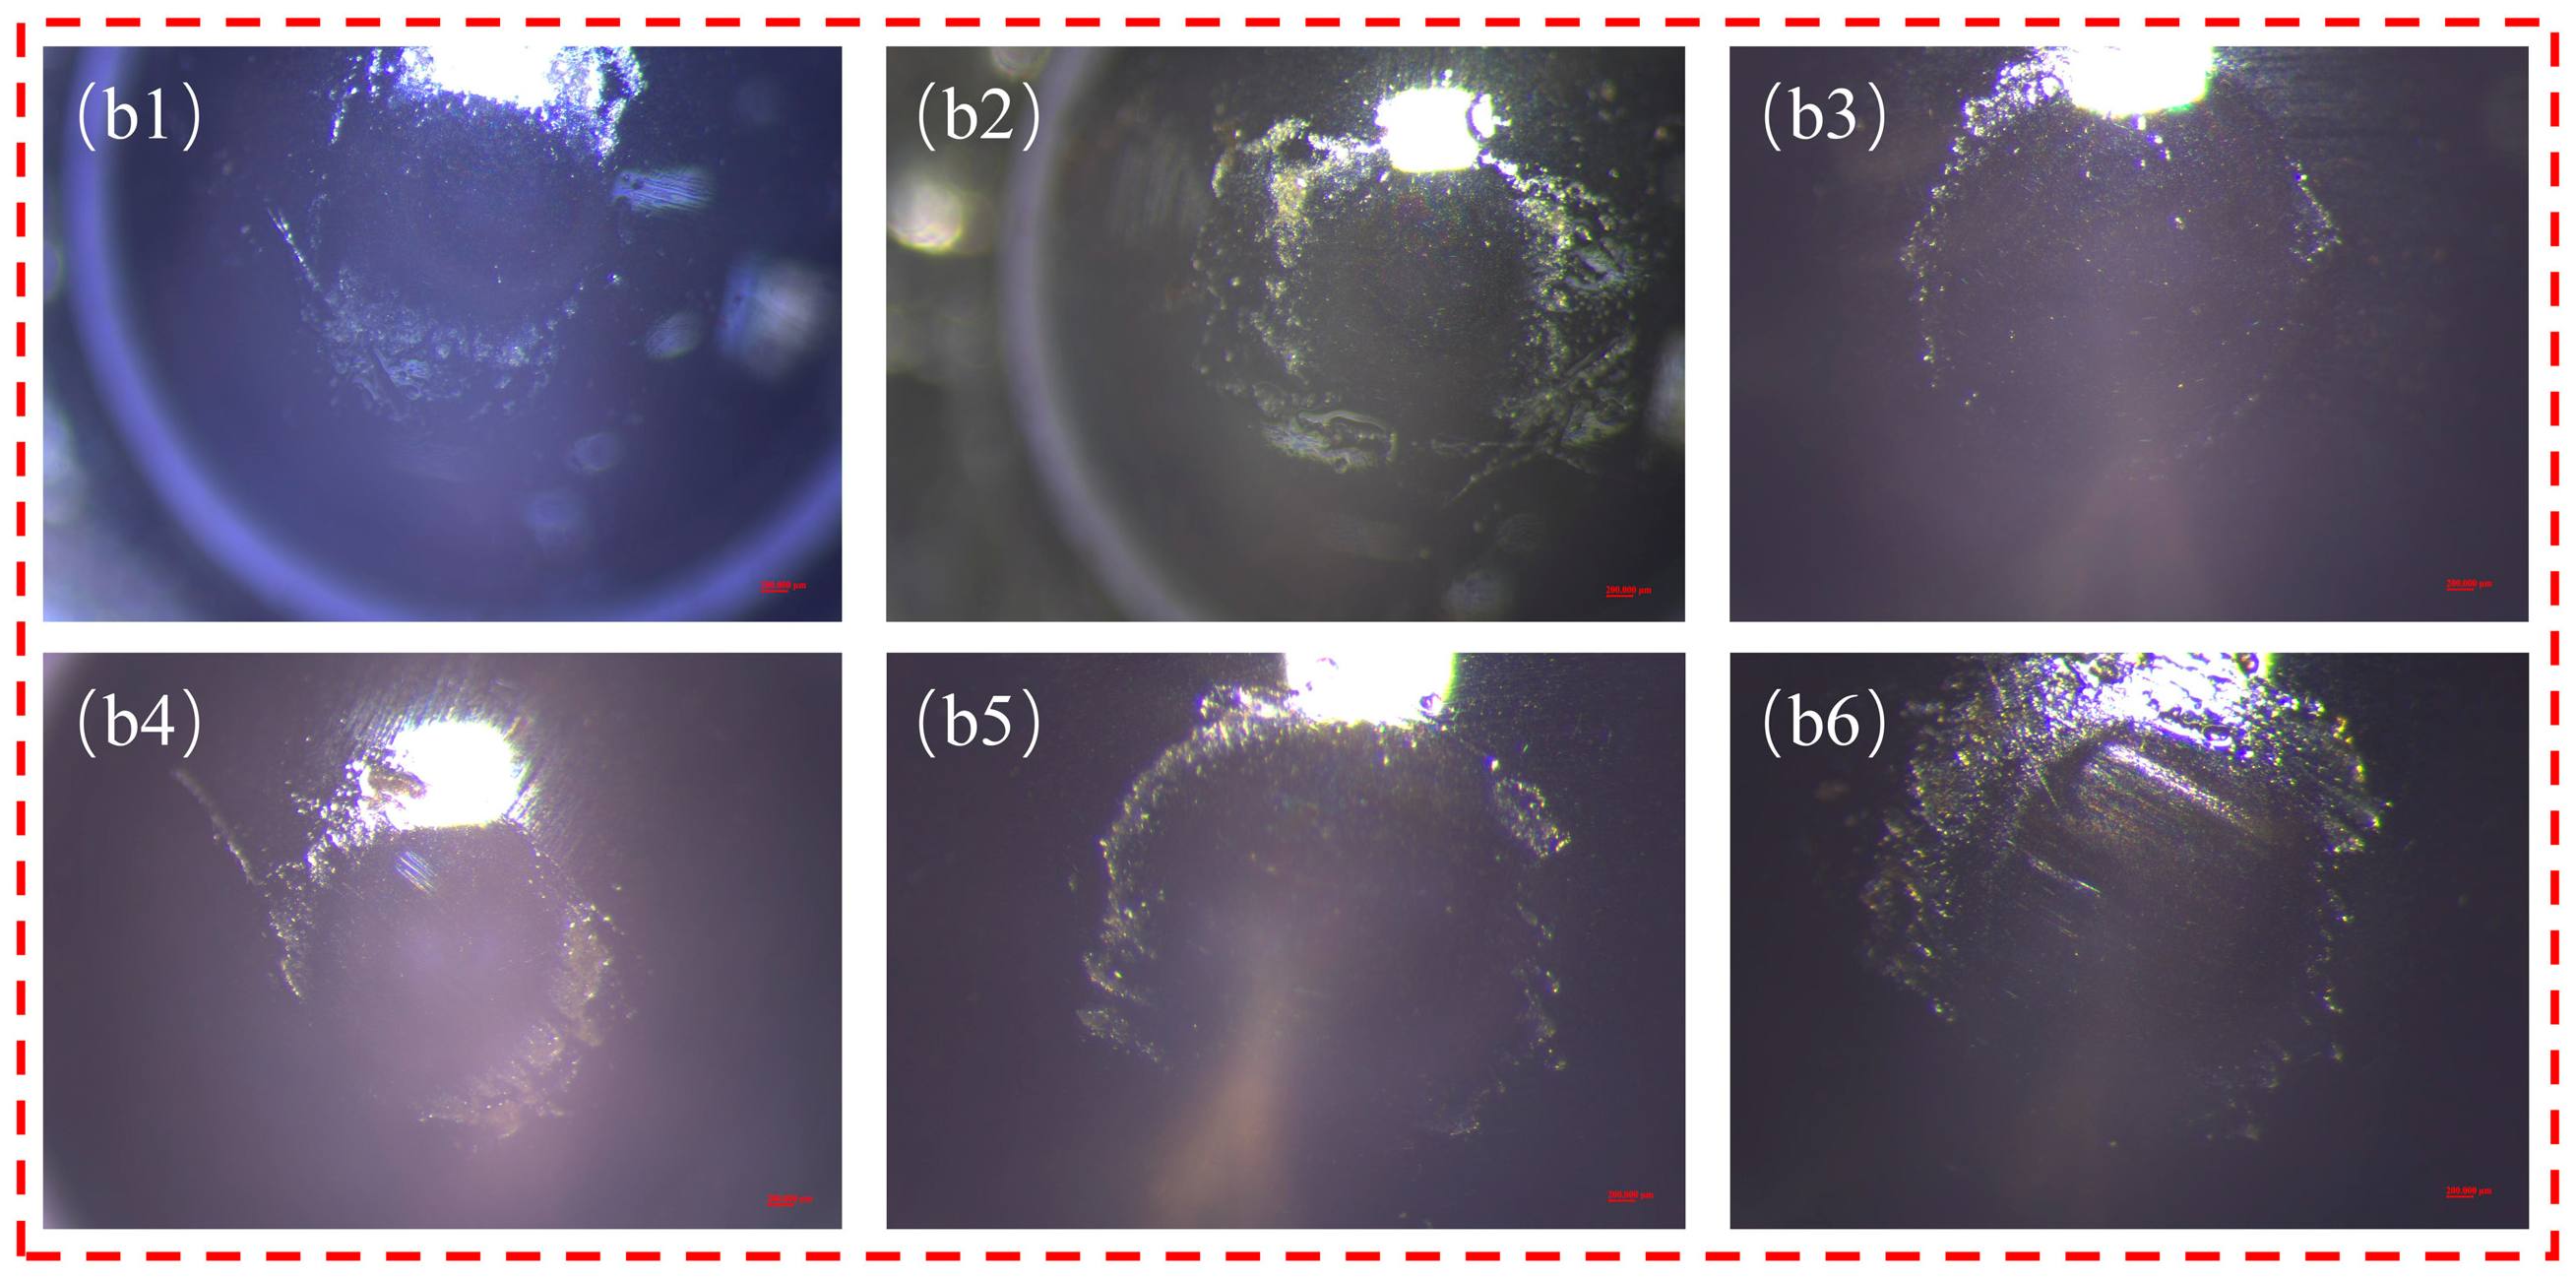
As shown in Figure 13(a1–a6,b1–b6), and Figure 14(b1–b6), wear is significantly reduced after lubricating oil impregnation compared to oil-free PPI, with a relatively smooth wear scar surface, a width of approximately 400 μm, and a depth of approximately 6 μm. A large amount of lubricating oil is also observed on the contact area of the steel ball surface. At PTFE contents above 10%, obvious wear scars form, but the surface remains smooth. There is slight solid contact and gradual formation of a solid PTFE transfer film. At 30% PTFE, the wear scar width is approximately 600 μm, and the depth is approximately 10 μm. Observations of the mixture on the steel ball surface show that a clear transparent oil film forms on the friction surface at low PTFE contents. However, as the PTFE content increases, the oil film becomes turbid with solid wear debris, appearing as sludge. At this point, the friction pair operates under solid–liquid mixed lubrication. This condition is characterized by a certain oil film thickness and slight surface contact, which leads to a slight increase in wear of PPI.
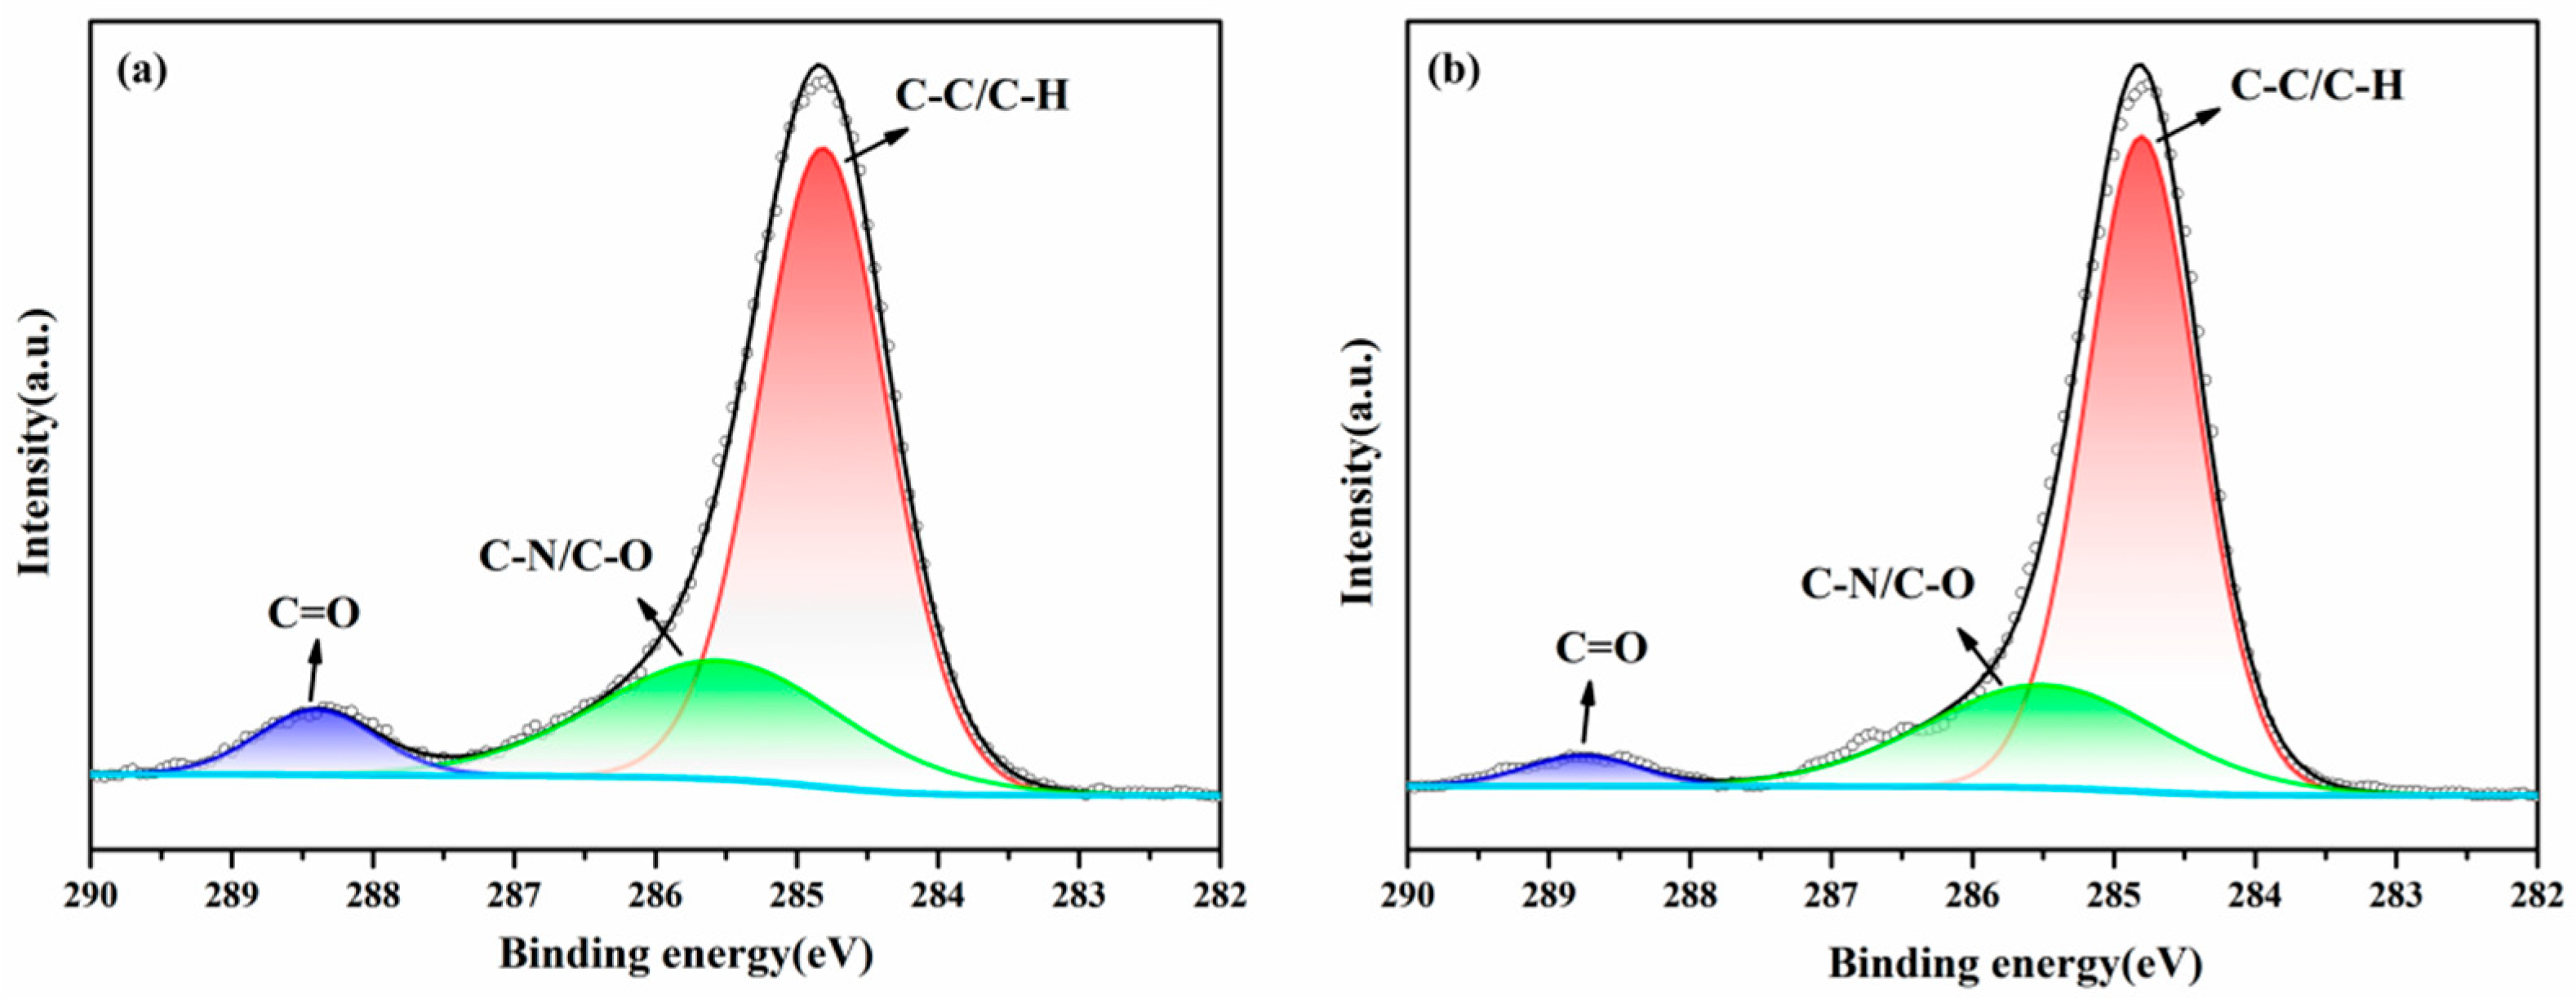
Similarly, as shown in Figure 15, XPS analysis of the mixture on the friction steel ball surface of oil-containing PPI reveals a C-F peak near 292.0 eV. This indicates that PTFE forms a lubricating transfer film at the friction contact interface. In addition, changes in C-C/C-H content before and after PAO oil impregnation are compared in Table 2. For pure PI, the C-C/C-H content increases from 69.1% to 72.6% after PAO impregnation, with slight decreases in C-N/C-O and C=O contents, due to the introduction of a large amount of C-C/C-H from PAO oil. Similarly, for PI/PTFE, the C-C/C-H content increases from 62.1% to 74.5% after PAO impregnation. This increase is accompanied by decreases in the contents of C-N/C-O, C=O, and C-F. These changes indicate that PAO oil is successfully released to the friction contact interface, participating in the formation of a friction mixed film. Moreover, compared to pure PI, the introduction of PTFE reduces the surface energy of the material, which promotes lubricant release and lubricating film formation.
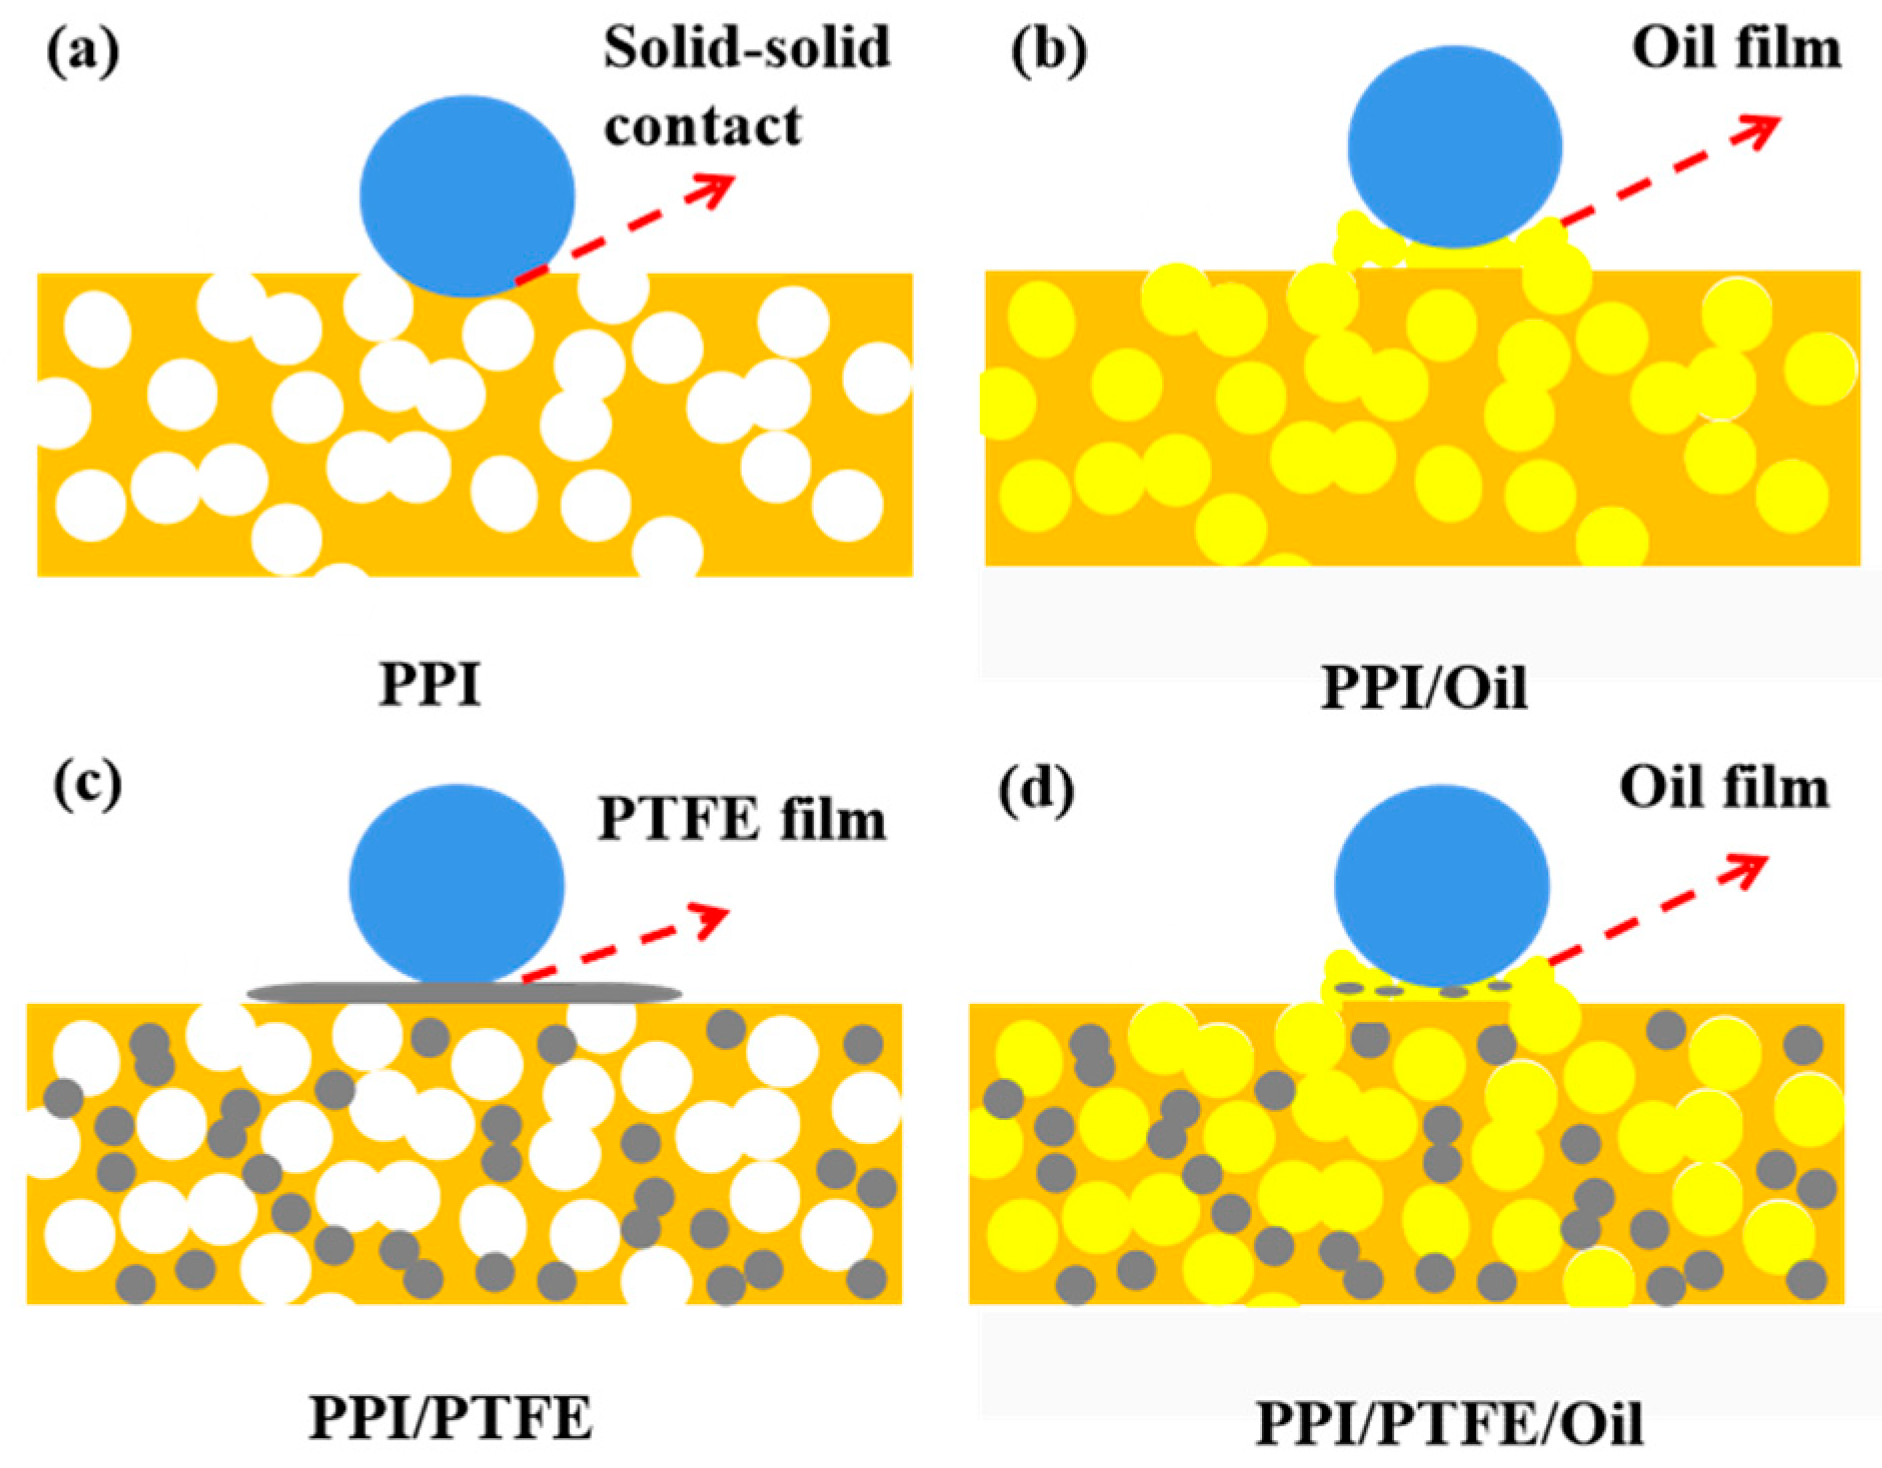
According to the above analysis, the friction lubrication mechanism of PPI/PTFE is shown in Figure 16. The steel ball comes into direct contact with the PPI, causing severe friction and wear, ultimately resulting in fatigue wear. Figure 16b shows a schematic diagram of the mechanism of oil friction. It can be seen that the PAO lubricating oil stored in the porous structure is slowly released to the friction interface under the action of load and frictional heat, forming a lubricating oil film. After adding PTFE modification, the dry friction is illustrated in Figure 16c. The large molecules of PTFE are pulled out of the crystalline region and transferred to the dual plane, forming a PTFE solid transfer film that is highly oriented along the sliding direction. This significantly reduces the degree of friction and wear, resulting in an adhesive wear state. When there was oil friction, as shown in Figure 16d, both the lubricating oil stored in the porous structure is transferred to the contact interface, and a very small amount of PTFE is transferred to the friction interface, but the formation of a continuous film of liquid lubrication is dominant.

4. Conclusions

In this study, PPI/PTFE composites with different porosities were prepared via cold pressing–sintering. The effects of PTFE on micropore characteristics and the tribological mechanism were revealed by investigating the microstructure, oil-containing performance, and friction–wear performance under oil-containing and oil-free conditions. The conclusions are as follows:
(1)
PPI/PTFE forms an interconnected microporous structure. With increasing PTFE content, the pore size and porosity of PPI decrease, and the oil-containing rate also decreases.
(2)
Under dry friction conditions, the friction coefficient of PPI gradually decreases with increasing PTFE content. When PTFE content is below 10%, fatigue wear occurs. When it is above 10%, adhesive wear occurs, with PTFE forming a continuous transfer film. The optimal tribological performance is achieved at 20% PTFE, with the lowest friction coefficient and wear rate.
(3)
Under oil-containing friction conditions, PPI releases lubricating oil stored in its porous structure to the friction interface under frictional heat and load. This forms an oil film that significantly reduces friction and wear. The addition of PTFE can promote lubricant release to a certain extent but also increases the wear rate. Therefore, within the PTFE content range of 0–10%, both the regulation of porosity and good friction–wear performance can be achieved.

Author Contributions

Conceptualization, X.S. (Xiaobo Sun); Methodology, X.S. (Xiaobo Sun); Formal analysis, X.S. (Xiaobo Sun); Investigation, X.S. (Xiaobo Sun), X.S. (Xiaohui Shang), Y.L. and K.L.; Writing—original draft preparation, X.S. (Xiaobo Sun); Writing—review and editing, X.Z., F.C. and K.Y. All authors have read and agreed to the published version of the manuscript.

Funding

This work was supported by the Open Fund Project of Henan High-Performance Bearing Key Laboratory (No. ZYSKF202403), and Youth Science and Technology Fund Project of China Machinery Industry Group Co., Ltd. (No. QNJJ-PY-2024-11).

Data Availability Statement

The original contributions presented in the study are included in the article. Further inquiries can be directed to the corresponding authors.

Conflicts of Interest

Authors Xiaobo Sun, Xiaohui Shang, Yuanyuan Li and Keying Li were employed by the company Luoyang Bearing Research Institute Co., Ltd. The remaining authors declare that the research was conducted in the absence of any commercial or financial relationships that could be construed as a potential conflict of interest.

References

  1. Zhang, D.; Wang, C.; Qing, T.; Wang, Q.; Wang, T. Research progress of porous polymer bearing retainer materials used in aerospace. J. Mech. Eng. 2018, 9, 17–26. [Google Scholar] [CrossRef]
  2. Li, S.; Qu, C.; Shao, M.; Wang, C.; Wang, Q.; Wang, Y. Research progress in tribology of porous polymer self-lubricating composites. Polym. Bull. 2018, 8, 59–62. [Google Scholar] [CrossRef]
  3. Sun, X.; Wang, F.; Ge, S.; Zhang, H.; Wang, Z. Long-life lubricating technology for bearing used in aerospace. Bearing 2012, 3, 60–64. [Google Scholar] [CrossRef]
  4. Bertrand, P. Absorption of Water and Lubricating Oils into Porous Nylon; Nasacr-197344: Uniondale, NY, USA, 1995. Available online: https://ntrs.nasa.gov/citations/19950015966 (accessed on 20 January 2024).
  5. Sathyan, K.; Gopinath, K.; Lee, S.; Hsu, H.Y. Bearing retainer designs and retainer instability failures in spacecraft moving mechanical systems. Tribol. Trans. 2012, 55, 503–511. [Google Scholar] [CrossRef]
  6. Zhang, Y.; Zhang, S.; Zhou, G.; Zhang, J.; Qing, T.; Zhou, N. The tribological properties of porous cotton/phenolic bearing retainer on different surfaces. Proc. Inst. Mech. Eng. Part J J. Eng. 2021, 7, 1470–1477. [Google Scholar] [CrossRef]
  7. Sathyan, K. Processing of cotton-phenolic bearing retainers for optimum performance of spacecraft high-speed rotating systems. Tribol. Trans. 2015, 4, 704–711. [Google Scholar] [CrossRef]
  8. Wang, J.; Zhao, H.; Huang, W.; Wang, X. Investigation of porous polyimide lubricant retainers to improve the performance of rolling bearings under conditions of starved lubrication. Wear 2017, 380, 52–58. [Google Scholar] [CrossRef]
  9. Chen, W.; Zhu, P.; Liang, H.; Wang, W. Molecular dynamics simulations of lubricant recycling in porous polyimide retainers of bearing. Langmuir 2021, 7, 2426–2435. [Google Scholar] [CrossRef] [PubMed]
  10. Zhang, H.; Duan, M.; Qin, S.; Zhang, Z. Preparation and modificaton and porous polyetheretherketon (PEEK) cage material based on fused deposition modeling (FDM). Polymer 2022, 24, 5403. [Google Scholar] [CrossRef]
  11. Sun, X.; Li, Y. Preparation and properties of porous polyimide cage materials with small pore diameter and narrow pore distribution. Bearing 2022, 2, 44–47. [Google Scholar] [CrossRef]
  12. Marchetti, M.; Meusrisse, M.; Vergne, P.; Sicre, J.; Durand, M. Analysis of oil supply phenomena by sintered porous reservoirs. Tribol. Lett. 2001, 3, 163–170. [Google Scholar] [CrossRef]
  13. Marchetti, M.; Meusrisse, M.; Vergne, P.; Sicre, J.; Durand, M. Lubricant supply by porous reservoirs in space mechanisms. Tribol. Ser. 2000, 38, 777–785. [Google Scholar] [CrossRef]
  14. Sun, X.; Shang, X.; Li, Y.; Chu, T.; Yan, Y. Study on material properties of restrictor for bearing assembly. Bearing 2022, 8, 22–25. [Google Scholar] [CrossRef]
  15. Qiu, Y.; Wang, Q.; Wang, C.; Wang, Y. Oil-containing and tribological properties of porous polyimide containing lubricant oil. J. Tribol. 2012, 32, 538–543. [Google Scholar] [CrossRef]
  16. Xu, X.; Shu, X.; Pei, Q.; Qin, H.; Guo, R.; Wang, X.; Wang, Q. Effects of porosity on the tribological and mechanical properties of oil-impregnated polyimide. Tribol. Int. 2022, 170, 107502. [Google Scholar] [CrossRef]
  17. Ye, J.; Li, J.; Tao, Q.; Qing, T.; Huang, H.; Zhou, N. Effects of surface pore size on the tribological properties of oil-impregnated porous polyimide material. Wear 2021, 484, 204042. [Google Scholar] [CrossRef]
  18. Chu, T.; Li, Y.; Mai, N.; Sun, X.; Hu, P.; Xi, B.; Dong, Y. Study on compatibility between porous polyimide cage and space lubricating oil. Bearing 2021, 9, 109–114. [Google Scholar] [CrossRef]
  19. Zhou, N.; Qing, T.; Zhang, S.; Qu, J.; Huang, Z. Research on oil-containing performance of porous polymer materials filled with carbon nanotubes. Lubr. Eng. 2017, 42, 120–123. [Google Scholar] [CrossRef]
  20. Zhang, D.; Wang, T.; Wang, Q.; Wang, C. Selectively enhanced oil retention of porous polyimide bearing materials by direct chemical modification. J. Appl. Polym. Sci. 2017, 134, 45106. [Google Scholar] [CrossRef]
  21. Samyn, P.; De Baets, P.; Schoukens, G. Role of internal additives in the friction and wear of carbon-fiber-reinforced polyimide. Appl. Polym. 2010, 116, 1146–1156. [Google Scholar] [CrossRef]
  22. Wang, F.; Sun, X.; Shi, L. Effect of polytetrafluoroethylene on properties of polyimide cage materials. Bearing 2005, 2, 25–27. [Google Scholar] [CrossRef]
  23. Jiang, Y.; Chen, L.; Xiao, C.; Zhou, N.; Qing, T.; Qian, L. Friction and wear behaviors of steel ball against polyimide-PTFE composite under rolling-sliding motion. Tribol. Lett. 2021, 69, 100. [Google Scholar] [CrossRef]
  24. Yan, P.; Zhu, P.; Gu, H.; Huang, P. Exploration of preparation process of thermoplastic polyimide porous materials. Lubr. Sealing 2007, 01, 79–82+104. [Google Scholar] [CrossRef]
  25. GB/T 21650.1-2008; Pore Size Distribute and Porosity of Solid Materials by Mercury Porosimetry and Gas Adsorption-Part 1: Mercury Porosimetry. China Standards Press: Beijing, China, 2008.
  26. Conte, M.; Igartua, A. Study of PTFE composites tribological behavior. Wear 2012, 296, 568–574. [Google Scholar] [CrossRef]
  27. Biswas, S.; Kalyani, V. Friction and wear of PTFE-a review. Wear 1992, 158, 193–211. [Google Scholar] [CrossRef]
  28. Huang, R.; Ma, S.; Zhang, M.; Yang, J.; Wang, D.; Zhang, L.; Xu, J. Wear Evolution of the glass fiber-reinforced PTFE under dry sliding and elevated temperature. Materials 2019, 12, 1082. [Google Scholar] [CrossRef]
  29. Zhen, J.; Han, Y.; Wang, H.; Jiang, Z.; Wang, L.; Huang, Y.; Jia, Z.; Zhang, R. High temperature friction and wear behavior of PTFE/MoS2 composites. Lubricants 2023, 11, 312. [Google Scholar] [CrossRef]
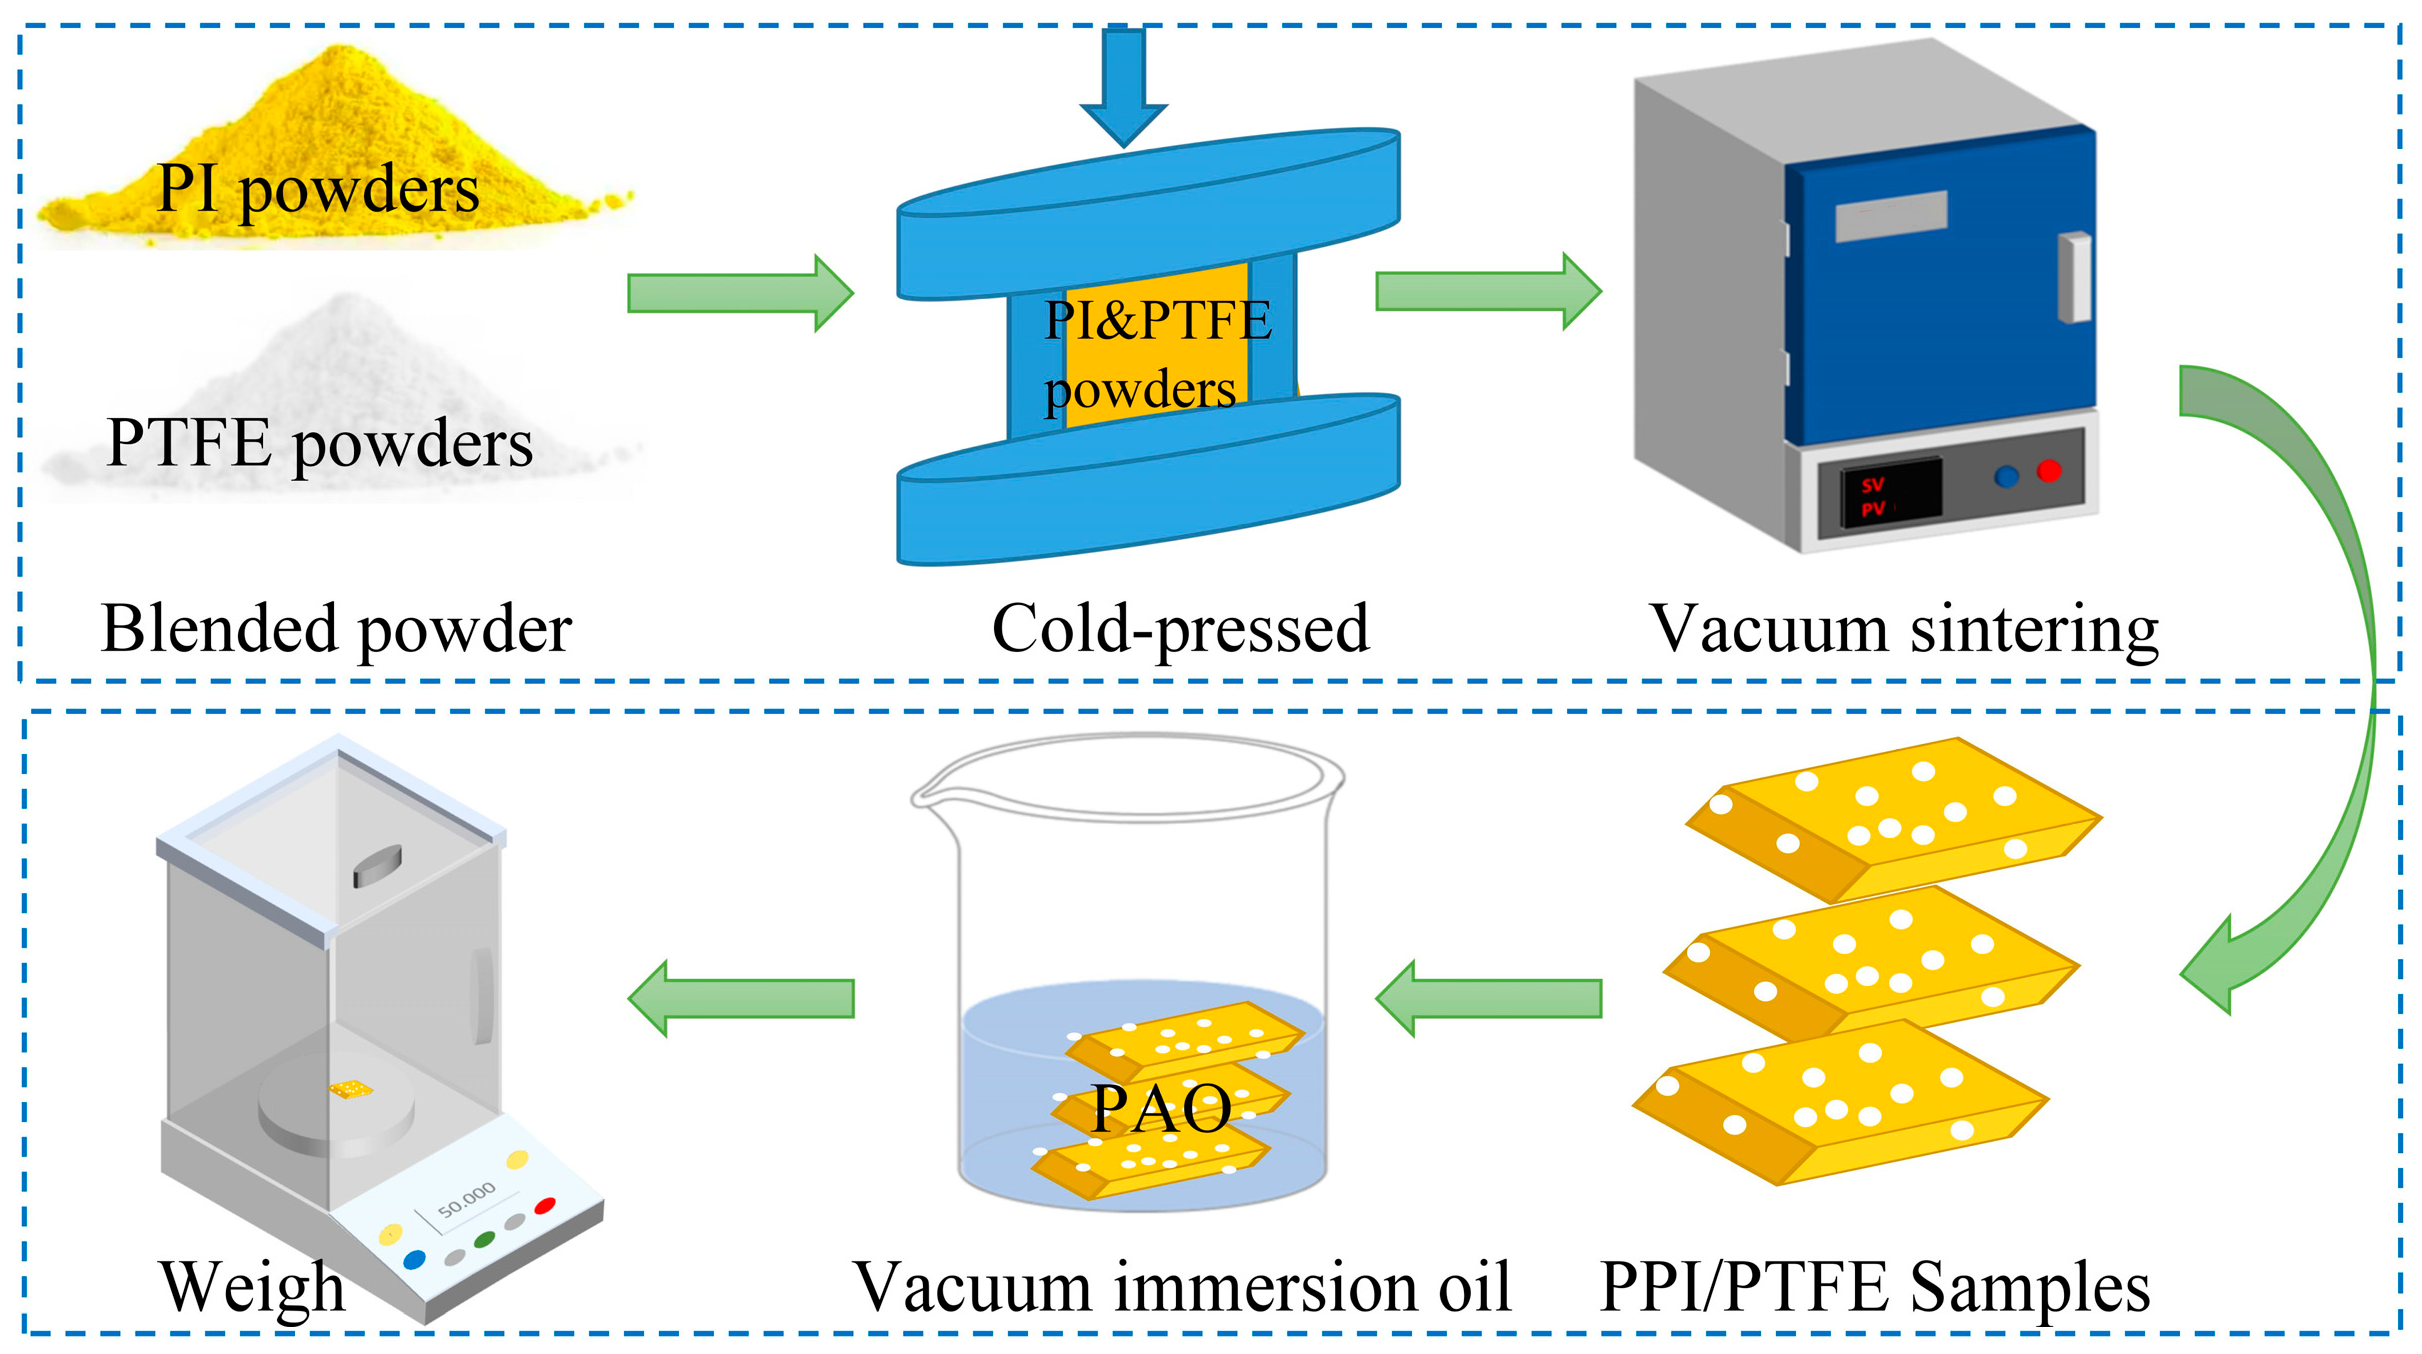
Figure 1. Schematic diagram of the experimental process.
Lubricants 13 00455 g001
Figure 2. Diagram of the friction and wear testing.
Lubricants 13 00455 g002
Figure 3. Mechanical properties of composites with different PTFE contents: (a) Tensile strength, (b) hardness.
Lubricants 13 00455 g003
Figure 4. SEM of PPI with PTFE content of (a1) 0% (a2) 5% (a3) 10% (a4) 15% (a5) 20% (a6) 30%.
Lubricants 13 00455 g004
Figure 5. EDS mapping of PPI with 30% PTFE.
Lubricants 13 00455 g005
Figure 6. (a) Intrusion and extrusion curves and (b) pore size distribution curves of PPI.
Lubricants 13 00455 g006
Figure 7. Dry friction and wear properties of six groups of specimens (a) friction coefficient curves (b) average friction coefficient and wear rate.
Lubricants 13 00455 g007
Figure 8. Oil-containing friction and wear properties of six groups of specimens (a) friction coefficient curves (b) average friction coefficient and wear rate.
Lubricants 13 00455 g008
Figure 9. (a) Curves and (b) dynamic change diagram of contact angle of PPI materials with time.
Lubricants 13 00455 g009
Figure 10. Dry friction wear scars (a1a6) and 3D morphologies (b1b6) of 0%~30% PTFE-modified PPI.
Lubricants 13 00455 g010
Figure 11. Surface morphology of steel balls after friction with PTFE-modified PPI containing 0% (a1), 5% (a2), 10% (a3), 15% (a4), 20% (a5), and 30% (a6) PTFE, respectively.
Lubricants 13 00455 g011
Figure 12. C 1s XPS spectra of mixtures on the steel ball surface: (a) pure PPI, (b) PI/15% PTFE.
Lubricants 13 00455 g012
Figure 13. Oil-containing friction wear scars (a1a6) and 3D morphologies (b1b6) of 0%~30% PTFE-modified PPI.
Lubricants 13 00455 g013
Figure 14. Surface morphology of steel balls after friction with PTFE-modified OCPPI containing 0% (b1), 5% (b2), 10% (b3), 15% (b4), 20% (b5), and 30% (b6) PTFE, respectively.
Lubricants 13 00455 g014
Figure 15. C 1s XPS spectra of mixtures on the steel ball surface (a) pure OCPPI (b) OCPPI/15% PTFE.
Lubricants 13 00455 g015
Figure 16. PPI friction lubrication mechanism diagrams: (a) without PTFE and oil, (b) without PTFE and with PAO oil, (c) with PTFE and without oil, (d) with PTFE and PAO oil.
Lubricants 13 00455 g016
Table 1. Micropore properties and oil-containing rates of OCPPI/PTFE.
PTFE/wt%0%5%10%15%20%30%
Porosity/%25.123.322.820.719.717.2
Pore diameter/μm1.921.561.391.331.261.14
oil-containing rate/%21.319.317.015.414.010.2
Table 2. Changes in C-C/C-H content before and after PAO oil impregnation.
C 1s Component C-C/C-HC-O/C-NC=OC-F
Binding energy (eV) 284.8285.5288.4292.0
Area fraction (%)PI69.124.46.50
PI-PAO72.623.93.50
PI/PTFE62.117.710.010.2
PI/PTFE-PAO74.519.92.43.2
Disclaimer/Publisher’s Note: The statements, opinions and data contained in all publications are solely those of the individual author(s) and contributor(s) and not of MDPI and/or the editor(s). MDPI and/or the editor(s) disclaim responsibility for any injury to people or property resulting from any ideas, methods, instructions or products referred to in the content.