Article

Research on the Optimal Design Approach of the Surface Texture for Journal Bearings

1
School of Mechanical Engineering, University of Shanghai for Science and Technology, Shanghai 200093, China
2
School of Intelligent Emergency Management, University of Shanghai for Science and Technology, Shanghai 200093, China
3
Merchant Marine College, Shanghai Maritime University, Shanghai 201306, China
4
College of Mechanical and Electronic Engineering, Shanghai Jianqiao University, Shanghai 201306, China
*
Author to whom correspondence should be addressed.
Lubricants 2024, 12(4), 111; https://doi.org/10.3390/lubricants12040111
Submission received: 8 March 2024 / Revised: 24 March 2024 / Accepted: 26 March 2024 / Published: 28 March 2024
(This article belongs to the Special Issue Advances in Mixed Lubrication)

Abstract

:
Aiming to improve the comprehensive performance of the journal bearing system, this paper presents a multi-objective adaptive scale texture optimization design approach. A mixed lubrication model for the textured journal bearing system is established by considering the effects of cavitation and roughness. The geometrical parameters of the textures were co-optimized using a multi-objective grey wolf optimizer to obtain the optimal texture schemes that are suitable for different operating conditions. Through this approach, the influences of different texture schemes under transient operating conditions can be investigated. According to the results, it was found that different texture schemes result in different friction reduction effects. Proper surface texture is beneficial in increasing the minimum oil film thickness and reducing the possibility of asperity contact. The adaptive scale texture exhibits strong adaptability and achieves significant hydrodynamic effects. Therefore, the developed approach provides valuable insights for the optimization design of journal bearing systems.

1. Introduction

As a type of rotating component, journal bearings are widely used in various mechanical equipment due to their simple structure, strong load-carrying capacity, and high reliability [1,2]. Their performance directly determines the working efficiency and service life of mechanical devices. However, when operating under low-speed and heavy-load conditions, journal bearing systems often face the issue of insufficient lubrication. This situation can lead to severe wear on the contact surfaces, ultimately resulting in bearing failure. Surface texturing technology has proven to be an effective measure for improving the lubrication performance of friction surfaces, which holds significant practical significance for enhancing the performances of journal bearing systems [3,4,5,6]. In recent years, numerous scholars have conducted extensive research on the optimization design of bearing surface textures, focusing mainly on the optimization of texture shape, distribution location, and size parameters. Studies have shown that not all textures can improve lubrication performance. The optimal tribological performance can be achieved by rationally designing surface textures.
To deeply explore the potential advantages of texturing technology in reducing friction and the improving load-carrying performance, some researchers have conducted related studies and have achieved remarkable results. Chan et al. [7] investigated the effect of conventional texture shape on the load-carrying capacity of journal bearings at different eccentricity ratios. They found that the herringbone-grooved bearings exhibit a superior load-carrying capacity compared to the rectangular-grooved bearings. Subsequently, Shinde et al. [8] conducted a static characteristic analysis of journal bearing systems with rectangular, circular, and triangular micro-textured grooves and ribs using COMSOL software, version 6.2. It was found that the case with rectangular texture grooves had the lowest oil film pressure and power loss. In the aforementioned studies, the texture shapes were single-layer structures. As researchers delved deeper into exploring optimized texture shapes, composite shape textures began to be proposed. Meng et al. [9] studied the influence of composite dimple textures on the frictional behavior of journal bearings. The research showed that introducing composite dimples could generate secondary squeeze film lubrication, resulting in a higher load-carrying capacity and lower friction coefficients. Moreover, Tala-lghil et al. [10] used numerical simulations to investigate the influences of different texture distribution positions on the lubrication performance of journal bearings. The results suggested that the application of complete textures might not effectively enhance the lubrication performance of the bearings. However, the rational design of local textures in the region of decreasing oil film pressure was beneficial for improving the bearing performance. Arif et al. [11] found that the distribution position of textures and the slip boundary conditions collectively affect the performance of journal bearings. Later, Zhang et al. [12] optimized the possible coverage positions of surface textures on journal bearings using a genetic algorithm. The study indicated that the optimal texture coverage area was semi-elliptical, achieving low friction and a high load-carrying capacity at lower eccentricity ratios. Zhang et al. [13] used the particle swarm optimization algorithm to optimize the length of grooves to reduce the friction coefficient of journal bearings, ultimately forming the optimal distribution of grooves.
Based on the above research findings, current texture optimization methods mainly focus on the optimization of the textures’ shape and distribution, with less emphasis on optimizing the texture size parameters. Therefore, this paper innovatively proposes an adaptive scale texture optimization strategy. Unlike traditional approaches that use single objectives and uniform sizes for texture optimization, the proposed strategy employs a multi-objective grey wolf optimization algorithm to dynamically adjust texture sizes based on operating conditions, aiming to maximize the comprehensive lubrication performance of a journal bearing system. Additionally, in contrast to most existing studies that concentrate on assumed steady-state conditions, this study specifically investigated a texture optimization design under transient conditions to explore the frictional characteristics of the bearing system under actual operating conditions in order to obtain more realistic and effective low-friction texture optimization solutions.
It is worth noting that although introducing the adaptive scale texture has significant advantages in improving friction performance and lubrication effect, its preparation process is more complex than that of an ordinary texture, which undoubtedly increases the difficulty of implementing an adaptive scale texture. The surface texture can also introduce some negative effects, such as a reduction in fatigue life and the spalling of the coating surface. These limitations should be acknowledged.

2. Model Description

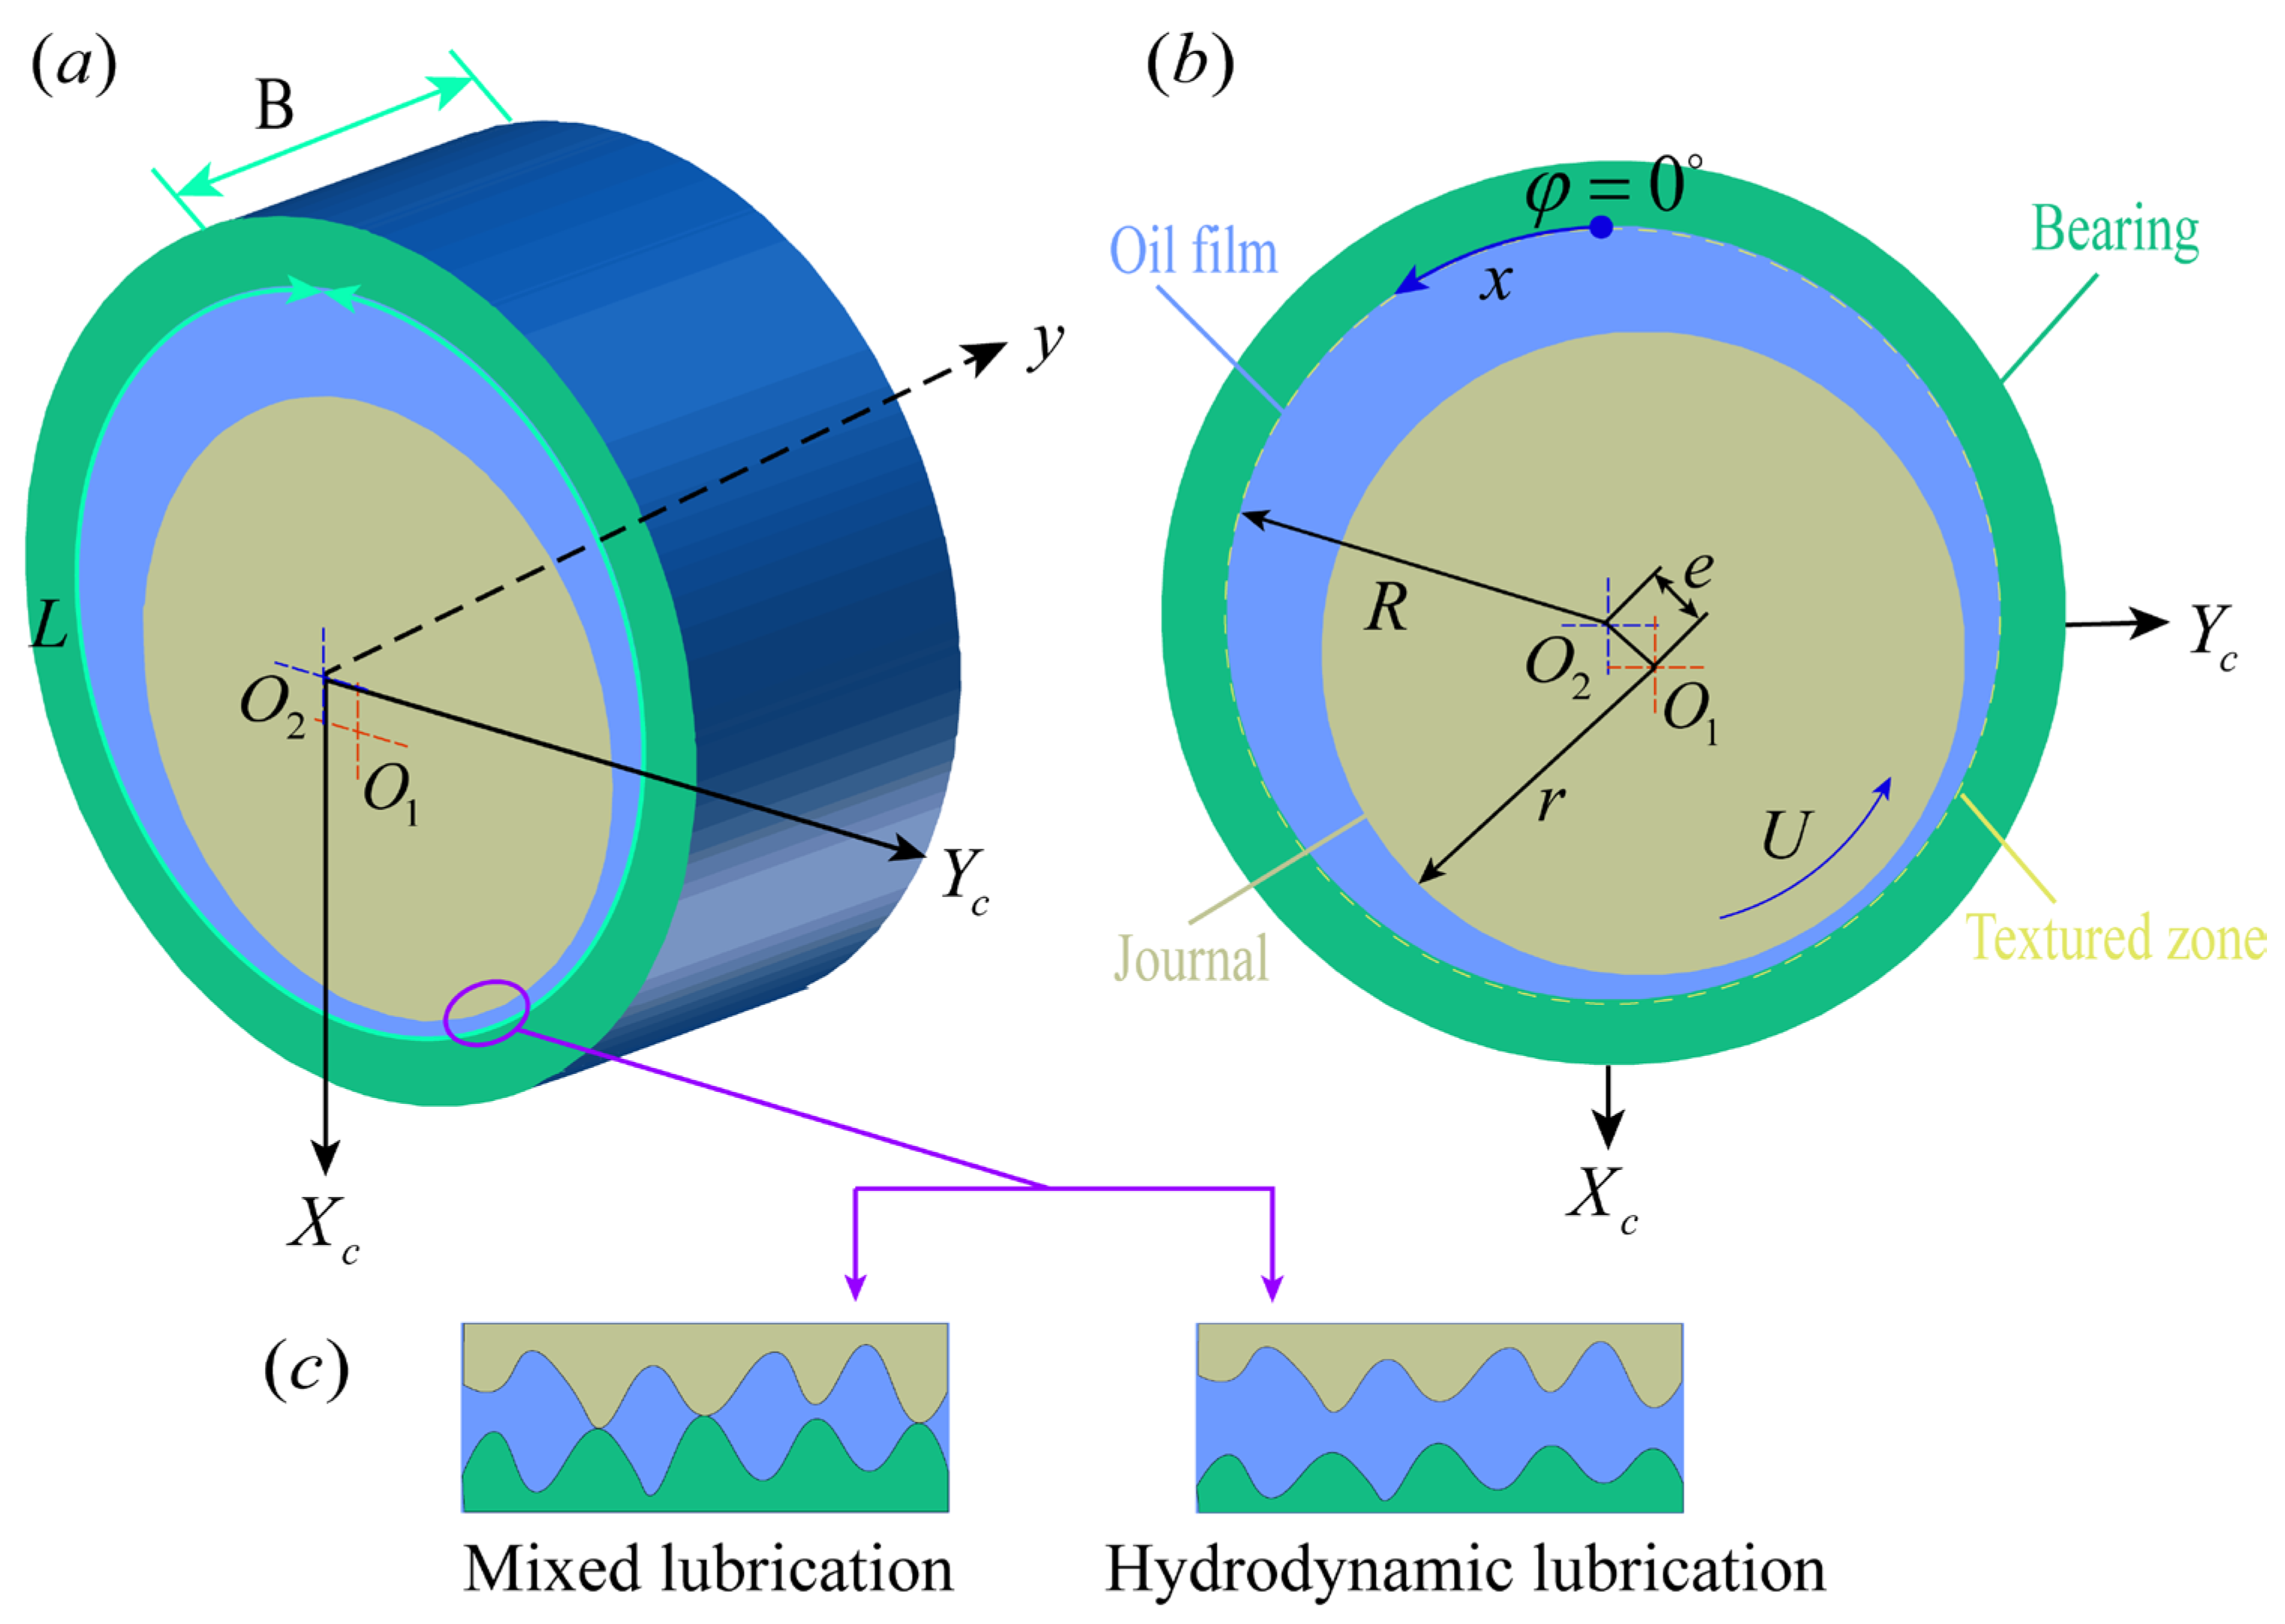
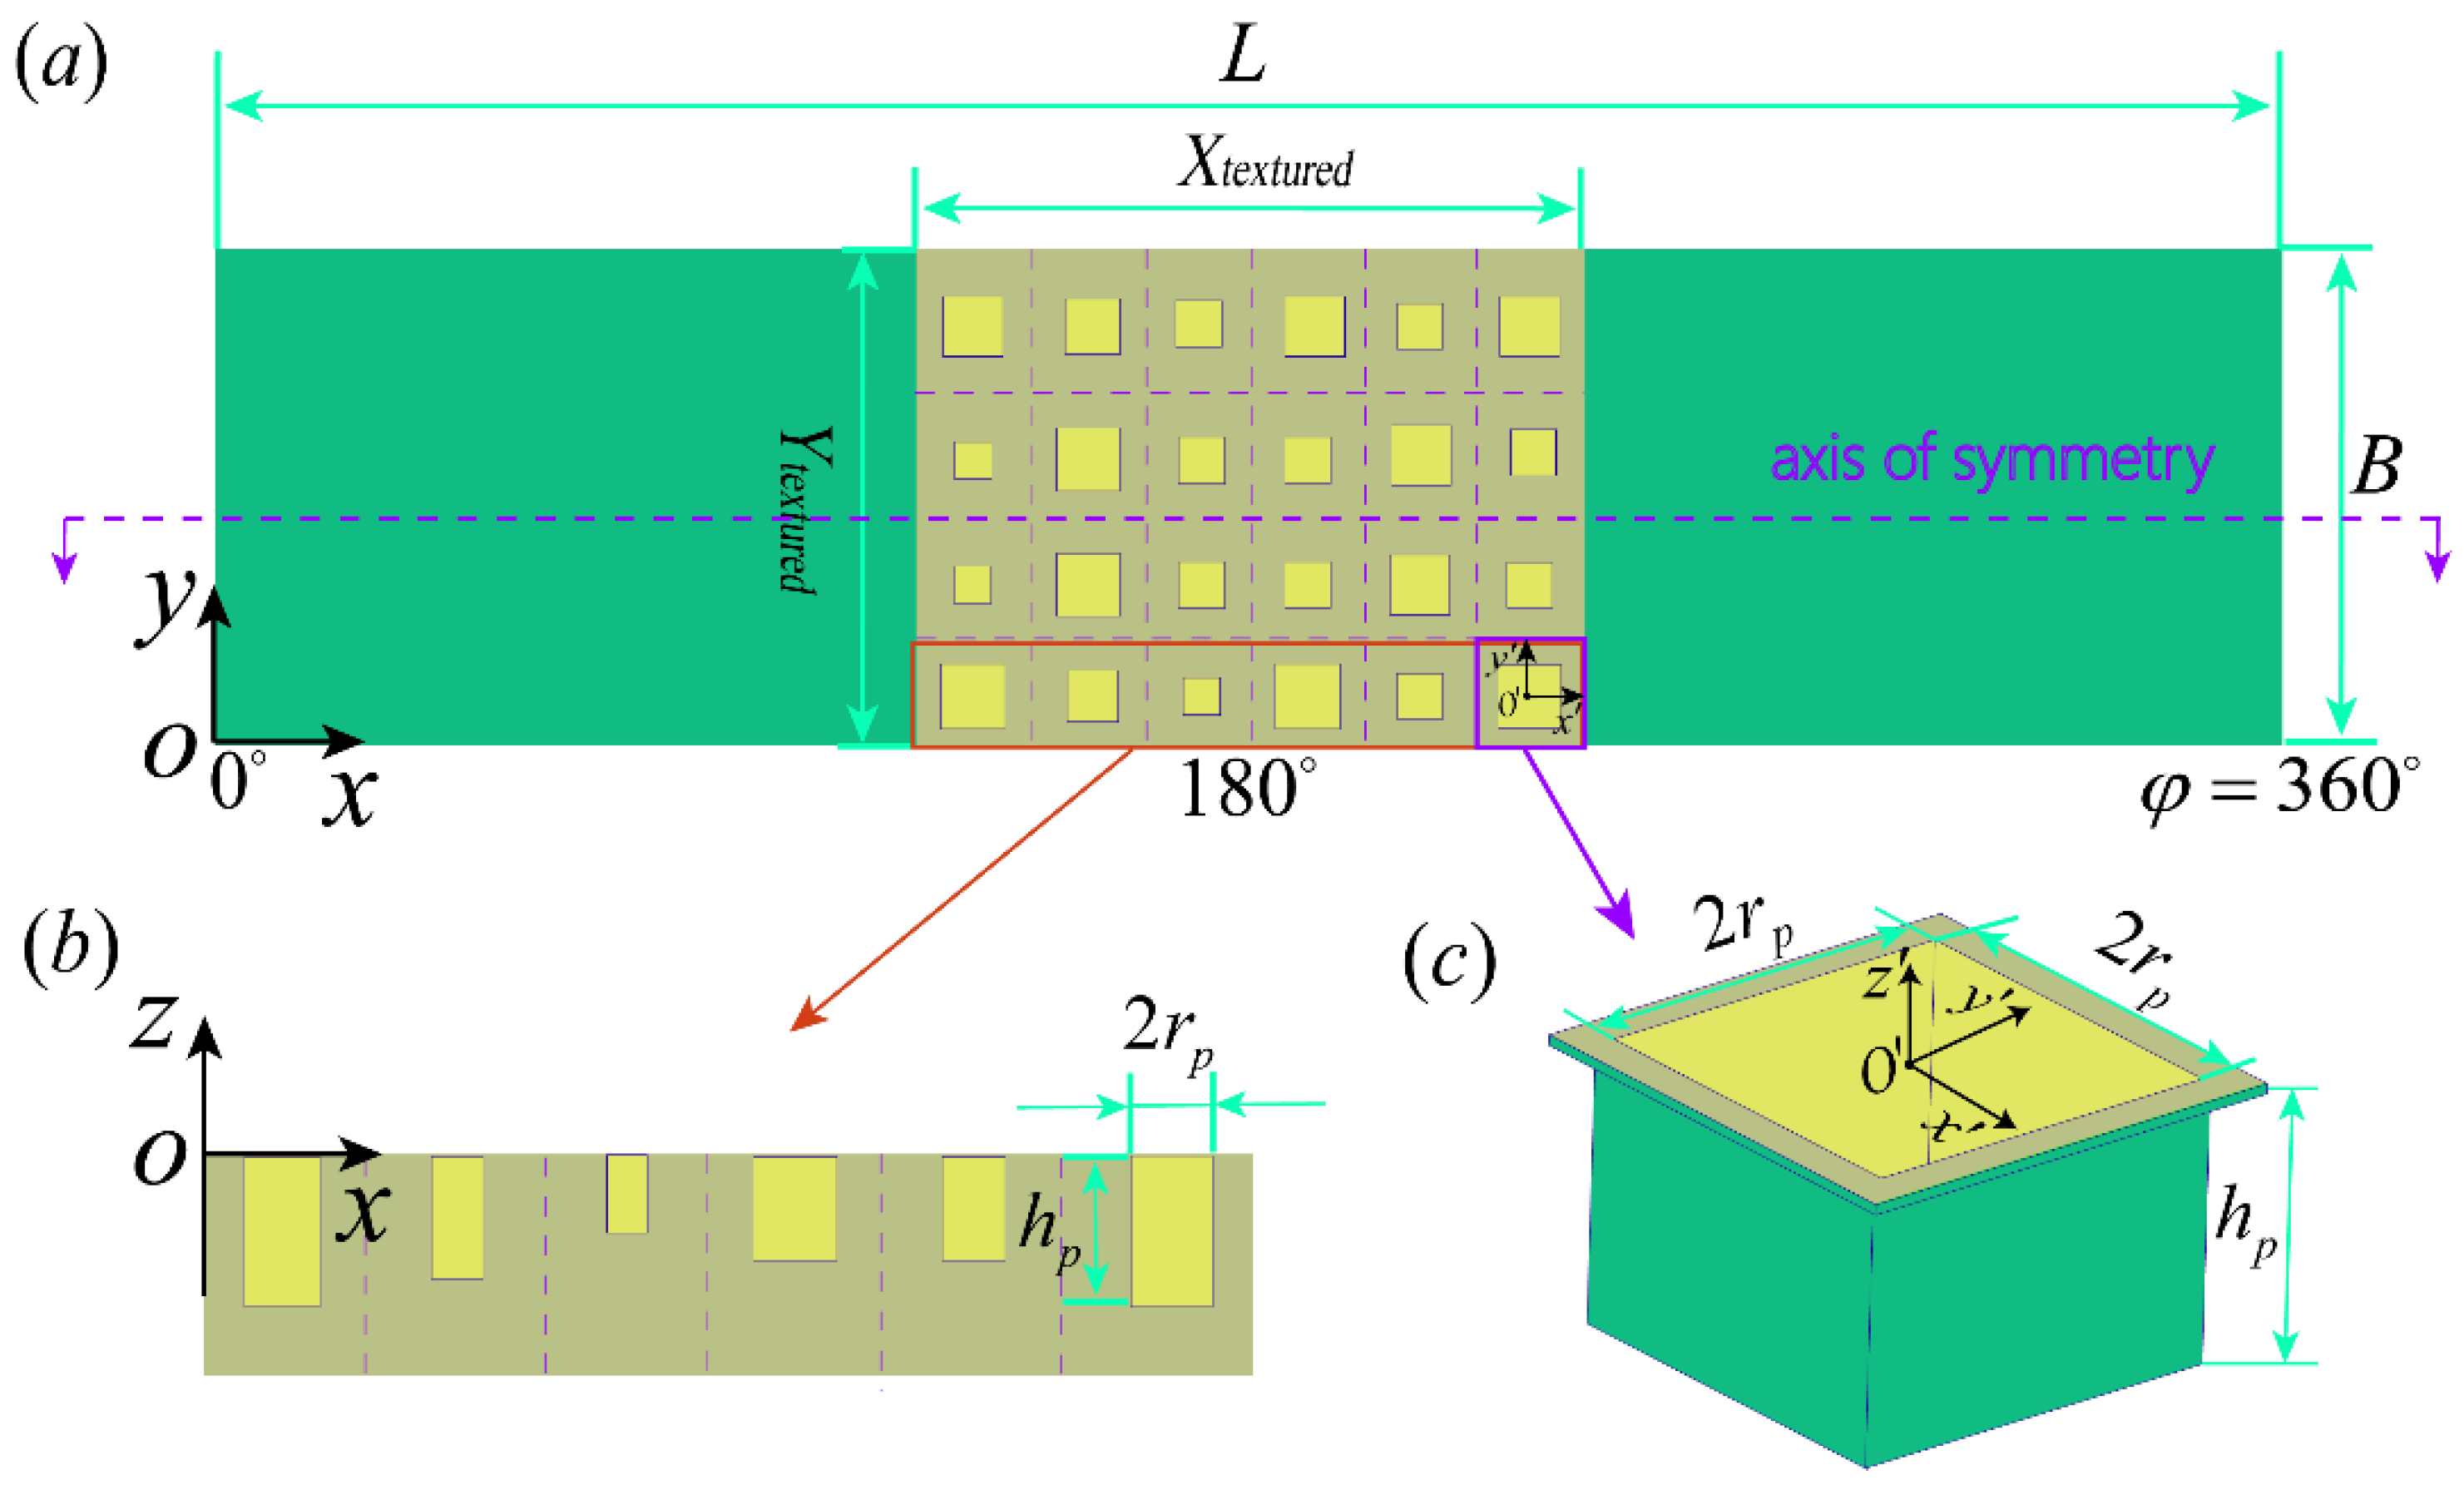
2.1. Geometric Model

Figure 1a,b show a schematic of a textured journal bearing system. The model consists of a journal, a bearing, and a lubricating oil film. L is the circumferential length of the bearing in the x direction, and B is the bearing width in the y direction. The journal and bearing center are denoted by O 1 and O 2 , respectively. It should be noted that two types of coordinate systems are used in this work. The coordinate system composed of x and y is used to obtain the hydrodynamic pressure and oil film thickness distributions, and the coordinate system composed of X C and Y C is used to describe the position of the center of the journal. The journal radius is r , rotating along the counterclockwise direction, the bearing radius is R , and the eccentricity between them is recorded as e . Among them, lubricants play a key role. As shown in Figure 1c, lubricants can effectively separate the two solid surfaces, avoid direct contact with the asperities, and maintain a hydrodynamic lubrication regime; but under the low-speed or heavy-load operating conditions, the hydrodynamic pressure is not enough to support the applied load, and the asperities will come into contact. The journal bearing system will be under the mixed lubrication regime. In addition, the inner surface of the bearing is distributed with micro-textures with different structural parameters, which can also appropriately adjust the flow gap and change the lubrication regime.

2.2. Lubrication Equations

In terms of the bearing system, the cavitation phenomenon is prone to occur in the surface texture regions, which will cause a continuous rupture and reformation of the lubricating film, and the hydrodynamic pressure will also be changed. To obtain the hydrodynamic pressure distribution accurately, this paper uses the Jakobsson–Floberg–Olsson (JFO) [14,15] cavitation model, which contains the JFO cavitation boundary condition. It is worth noting that it deals with cavitation issues in a mass-conserving manner. Meanwhile, the effect of the surface roughness on the lubrication performance can be realized by introducing the flow factor defined by Patir and Cheng [16] into the JFO model. The corresponding equation can be expressed as follows [17,18,19]:
x ϕ x ρ μ h 3 p x + y ϕ y ρ μ h 3 p y = 6 U ϕ c 1 θ ρ h x + 6 U σ 1 θ ρ ϕ s x + 12 ϕ c [ ( 1 θ ) ρ h ] t
with
p + θ p 2 + θ 2 = 0
where p represents hydrodynamic pressure, h denotes the oil film thickness, μ is the viscosity of the lubricant, ρ symbolizes the density of the lubricant, t is the time step, and U denotes the rotational velocity of the journal. The symbol θ represents the cavity fraction, which is affected by the hydrodynamic pressure, as shown in Equation (2). This constraint was proposed in the research of Woloszynski et al. [20] and serves as an effective algorithm for dealing with the cavitation problem. The variable σ is the comprehensive surface roughness, which can be obtained using the expression σ = σ 1 2 + σ 2 2 . σ 1 and σ 2 are the roughness of the journal and the bearing, respectively. Furthermore, the parameters ϕ x and ϕ y are the pressure flow factors, and ϕ s represents the shear flow factor. The relevant calculations of these flow factors can be found in the literature [16,21]. The variable ϕ c denotes the contact factor [22].

2.3. Film Thickness Equation

The oil film thickness is established using the clearance between the journal and the bearing, and its proper characterization is particularly important for lubrication analysis. Since this article focuses on the lubrication characteristics of journal bearings under transient conditions, the journal position continues to change over time under the action of variable loads, which in turn affects the oil film thickness. In addition, as shown in Figure 2a, square textures are introduced on the bearing surface, which will also lead to changes in the oil film thickness. The reason for choosing a square texture is that the adaptive scale texture optimization design method was adopted in this work, in which the depth and width of each texture are variable. Compared to other shapes of textures, square textures have consistent side lengths, allowing for fewer parameters to be introduced into the design variables. As a result, the computational workload of simulation and optimization can be reduced. Therefore, the corresponding expression of the oil film thickness is expressed as follows:
h ( x , y , t ) = C 1 + X c ( t ) c o s 2 π x L + Y c ( t ) s i n 2 π x L + h p , x , y Ω C 1 + X c ( t ) c o s 2 π x L + Y c ( t ) s i n 2 π x L , x , y Ω
with
Ω =   x r p y r p
In Equation (3), C represents the radial clearance of the bearing, which is defined as C = R r . The terms X c ( t ) and Y c ( t ) are the transient positions of the journal center; they are dimensionless and satisfy the following conditions: 0 X c ( t ) 2 + Y c ( t ) 2 1 . h p is the depth of the texture. Furthermore, the symbol Ω is the zone occupied by a single square texture, and its constraint range is described in Equation (4). r p denotes half the texture width. The parameters x and y are located in the local coordinate system with the center of each texture unit as the origin; refer to Figure 2c.

2.4. Asperity Contact Model

When the journal bearing system experiences mixed lubrication, the load is shared through asperity contact load and hydrodynamic support. In this study, the asperity contact pressure was obtained using the classic GT (Greenwood and Tripp) model [23], and the calculation expression is
P a s p = 16 2 π 15 ( η β σ ) 2 σ β E 1 E 2 E 2 1 μ 1 2 + E 1 ( 1 μ 2 2 ) F 2.5 ( λ )
where parameters E 1 and E 2 are the elastic moduli of the journal and bearing, respectively. Parameters μ 1 and μ 2 are the Poisson’s ratios of the journal and bearing, respectively. The variable η is the asperity density, and the variable β is the radius of the curvature of the asperity. Additionally, the parameter λ is defined as the ratio of h to σ , which is called the film thickness ratio. It is an important indicator used to measure the transition between hydrodynamic lubrication and mixed lubrication. Usually, λ > 4 represents the hydrodynamic lubrication regime, while λ 4 represents the mixed lubrication regime. The term F 2.5 ( λ ) is the statistical function of the parameter λ , which can be obtained according to Ref. [24]. The function is as follows:
F 2.5 ( λ ) exp ( 0.48349 1.72838 λ 0.30963 λ 2 ) 4.325 × 10 6 , λ 4 0 , λ > 4
It should be pointed out that both the textured and non-textured regions are rough, and the clearance between the two surfaces (journal and bearing) in the textured region is usually more than 4 times the comprehensive surface roughness ( λ > 4 ) . In the study of Patir and Cheng [16,21], it was found that the roughness of the textured region would have a slightly negligible effect on the lubricating performance. For simplification purposes, only the roughness of non-texture regions was considered, and the asperities involved were assumed to follow a Gaussian distribution. Furthermore, the asperity contact model and the hydrodynamic lubrication model are linked through the Johnson load-sharing concept, which ensures that the model is suitable for analyzing the tribological performances of bearings under mixed lubrication regimes. Table 1 details the material properties and surface topography parameters of the journal and bearing.

2.5. Lubricant Properties

During the simulation process, the load-carrying capacity and friction loss will be affected by the viscosity and density of the lubricant, resulting in the changing lubrication regime. Therefore, changes in lubricant viscosity and density should be correctly characterized. As far as viscosity is concerned, it is mainly determined by temperature and pressure factors and can be calculated using the Vogel equation [25] (viscosity–temperature) and Roelands equation [26] (viscosity–pressure), as shown below:
u 0 = a 0 exp ( T 1 T 2 + T )
μ = u 0 exp ln u 0 + 9.67 ( 1 + 5.1 × 10 9 p ) α 1
where T represents the lubricant temperature. a 0 , T 1 , and T 2 represent the relevant correction parameters when calculating the viscosity. The lubricant was SAE 5W40 oil; therefore, a 0 = 0.04365   m P a · s , T 1 = 1666.15   K , and T 2 = 422.35   K . Furthermore, α is a parameter related to lubricant properties.
Similarly, the effects of pressure and temperature on lubricant density can be expressed using the density–pressure equation involving thermal effects proposed by Dowson et al. [27]:
ρ = ρ 0 1 + 0.6 × 10 9 p 1 + 1.7 × 10 9 p [ 1 β T ( T T 0 ) ]
where ρ 0 is the density of the lubricant when the lubricant pressure is atmospheric pressure and the lubricant temperature is T 0 , and ρ 0 = 850   k g · m 3 . The symbol β T represents the thermal expansion coefficient, and β T = 6.4 × 10 4 K 1 .

2.6. Equation of Dynamics

The lubrication problem of a journal bearing system can be described as a dynamic problem. The journal can be regarded as an equivalent particle with mass M j o u r , and the center of mass is located at the center of the journal. When the journal operates under variable loads, the inertia will affect the motion trajectory of the journal center. To accurately analyze this situation, inertial forces must be taken into account, and Newton’s second equation is used to solve the dynamic problem. In the dynamic analysis, a dynamic balance relationship is established between the applied load, the hydrodynamic support, the asperity contact load, and the inertial force of the journal to determine the journal center positions X c ( t ) and Y c ( t ) . The equation is expressed as follows:
M j o u r 0 0 M j o u r χ ¨ = W l o a d x t W l o a d y t + W h y d x t + W a s p x t W h y d y t + W a s p y t   = W l o a d x ( t ) W l o a d y ( t ) + p + p a s p c o s 2 π x d x d y p + p a s p s i n 2 π x d x d y
where W l o a d x t and W l o a d y t denote the x and y components of the applied load, respectively. The terms W h y d x t and W h y d y t are the x and y components of the hydrodynamic support. Concurrently, the terms W a s p x t and W a s p y t represent the x and y components of the asperity contact load. Additionally, χ is the matrix used to obtain the unknown location information of the journal center, which is expressed as follows:
χ = X c ( t ) Y c ( t )
Therefore, according to Equation (10), the position of the journal center after the load balance can be calculated. As the journal position is determined, lubrication indicators such as oil film thickness, hydrodynamic pressure, and asperity contact pressure can be further updated.

2.7. Performance Parameters

The performances of journal bearing systems are mainly evaluated using the load-carrying capacity, friction, and energy loss. Among them, the load-carrying capacity is the integral sum of the hydrodynamic pressure and the asperity contact pressure in the lubrication region. A large load-carrying capacity helps to form a sufficient film thickness to avoid asperity contact, which is the key to reducing wear. The following expression is expressed as follows:
L C C = ( p + p a s p ) d x d y
In the mixed lubrication regime, the total friction f t o t a l has two sources: one is the viscous friction f h y d , another is the asperity contact friction f a s p . The corresponding expression can be written as
f t o t a l = f h y d + f a s p
where f h y d can be calculated as follows:
f h y d = ( 1 θ ) μ U h ( ϕ f + ϕ f s ) + ( 1 θ ) ϕ f p h 2 p x d x d y
where the terms ϕ f , ϕ f s , and ϕ f p represent friction-induced flow factors.
Meanwhile, f a s p is obtained as follows:
f a s p = κ a s p p a s p d x d y
In the above equation, the parameter κ a s p denotes the asperity friction coefficient, and the value of κ a s p is 0.12 in this simulation [28].
Furthermore, energy loss is predicted through transient process analysis, which is defined as the integral of the power loss with respect to time within an engine cycle, and the expression is written as follows:
E e n e _ l o s s = c y c l e P l o s s d t = c y c l e f t o t a l U d t
where the unit of E e n e _ l o s s is Joule (J). Additionally, P l o s s represents the power loss, which is affected by the total friction and rotational velocity.

3. Texture Design and Optimization Approach

3.1. Optimization Method

To address the optimization problem related to texture scales, this study employed an optimization model based on the grey wolf optimizer (GWO) algorithm [29,30] and integrated it with the mixed lubrication model. This approach aims to collectively enhance the performance of the journal bearing system. The GWO algorithm, inspired by the hunting behavior of grey wolves in nature, mimics their prey-hunting tactics within the search space. Due to its robust global optimization capabilities and swift convergence, the GWO algorithm has gained widespread recognition and application.
In the process of evaluating the journal bearing system performance, multiple metrics must be considered simultaneously. However, these metrics often conflict with each other, making it impossible to achieve optimal values across the board simultaneously. To tackle this challenge, a multi-objective optimization strategy was introduced here. Unlike single-objective optimization problems, multi-objective optimization problems do not generate a unique solution, but instead present multiple candidate solutions, each with advantages and disadvantages in different metrics. To effectively manage this complexity, the concept of Pareto solutions was employed [31,32]. A Pareto solution refers to a set of solutions in a multi-objective optimization problem that are not dominated by any other solution in all objectives. In other words, compared to other solutions, if a solution performs better on at least one objective and does not perform worse on any other objective, it is considered a Pareto solution.
As shown in Figure 3, both objective functions f 1 and f 2 aimed to achieve minimum values. When comparing solutions A and B, if f 1 ( A ) is smaller than f 1 ( B ) and f 2 ( A ) is also smaller than f 2 ( B ) , it indicates that solution A outperforms solution B in terms of overall performance, meaning that solution A dominates solution B, while solution A is not dominated by solution B. Additionally, when comparing solution A with solution C, even though f 2 ( C ) is less than f 2 ( A ) since f 1 ( C ) is greater than f 1 ( A ) , solution C cannot claim to dominate solution A. In this scenario, a special relationship known as non-domination arises between solutions A and C. The set of points corresponding to all non-dominated solutions in the objective space constitutes the so-called Pareto front. These non-dominated solutions may represent the best choices when pursuing multi-objective optimization strategies, as they offer a balance across multiple objectives without being simultaneously outperformed by any other solution in all objectives.
In the multi-objective gray wolf optimization algorithm, each gray wolf individual represents a possible solution, and they gradually approach the prey (optimal solution) by imitating predatory behavior. This process updates the gray wolf’s location with the help of the following specific formulas:
D = | C · X p ( T i t e r ) X ( T i t e r ) |
X T i t e r + 1 = X p T i t e r A · D
where T i t e r represents the current iteration number, A and C symbolize coefficient vectors, X p stands for the position vector of the prey, and X denotes the position vector of the gray wolf.
The vectors A and C in Equations (17) and (18) are described as follows:
A = 2 a · r 1 a
C = 2 · r 2
where the vector a decreases linearly from 2 to 0 during the iteration, and r 1 and r 2 are random vectors between (0, 1). It should be noted that vector A and vector C control different optimization mechanisms. Vector A affects the degree of deviation of the search individual from the target position. When A > 1 , the search individual will deviate from the target position. Since vector A is related to vector a , vector A also shows a gradually decreasing trend. Therefore, when A < 1 , the search individual will converge to the target position and ultimately determine the optimal value of the objective function. In addition, vector C affects the strength of the searchability, making the entire search process more random and avoid falling into the local optimal solution.
The multi-objective gray wolf optimization algorithm is different from other traditional optimization algorithms. It ranks the target solutions and calls the most suitable solution α wolf, followed by γ wolf and δ wolf. The remaining candidate solutions are called ω wolves. This process is guided by the α wolf, γ wolf, and δ wolf, while the ω wolves follow these three wolves to find the global optimal solution. Meanwhile, new solutions are generated through continuous iteration, and the archive is responsible for storing the non-dominated Pareto optimal solutions obtained so far. The relevant iteration formulas can be further written as follows:
D α = C 1 · X α X ,       D γ = C 2 · X γ X ,       D δ = | C 3 · X δ X |
X 1 = X α A 1 · D α ,       X 2 = X γ A 2 · D γ ,       X 3 = X δ A 3 · D δ
X ( T i t e r + 1 ) = X 1 + X 2 + X 3 3

3.2. Design Variables

To maximize the advantages of texture, this study innovatively proposes the following optimization design scheme: as shown in Figure 2a,b, the bearing surface is divided into 40 equal parts along the circumferential direction and 4 equal parts along the width direction, so the whole lubrication area ( 0 ~ 360 ° ) is divided into 160 texture units, which will be the potential locations for all textures to appear. In this design, texture depth and texture width are used as optimization variables at the same time, and the depth and width of each texture are different. Adaptive scale optimization is carried out through specific operating conditions, and the optimal texture size applicable to that operating condition is obtained after continuous iterations. Meanwhile, to save computation time, the symmetric distribution method is used, and only half of the bearing is taken as the optimization model. The variable parameters are set to
x v a r = h p 1 , h p 2 , h p 80 , r p 1 , r p 2 , r p 80 T
          = x a 1 , x a 2 , , x a 80 , x b 1 , x b 2 , , x b 80 T

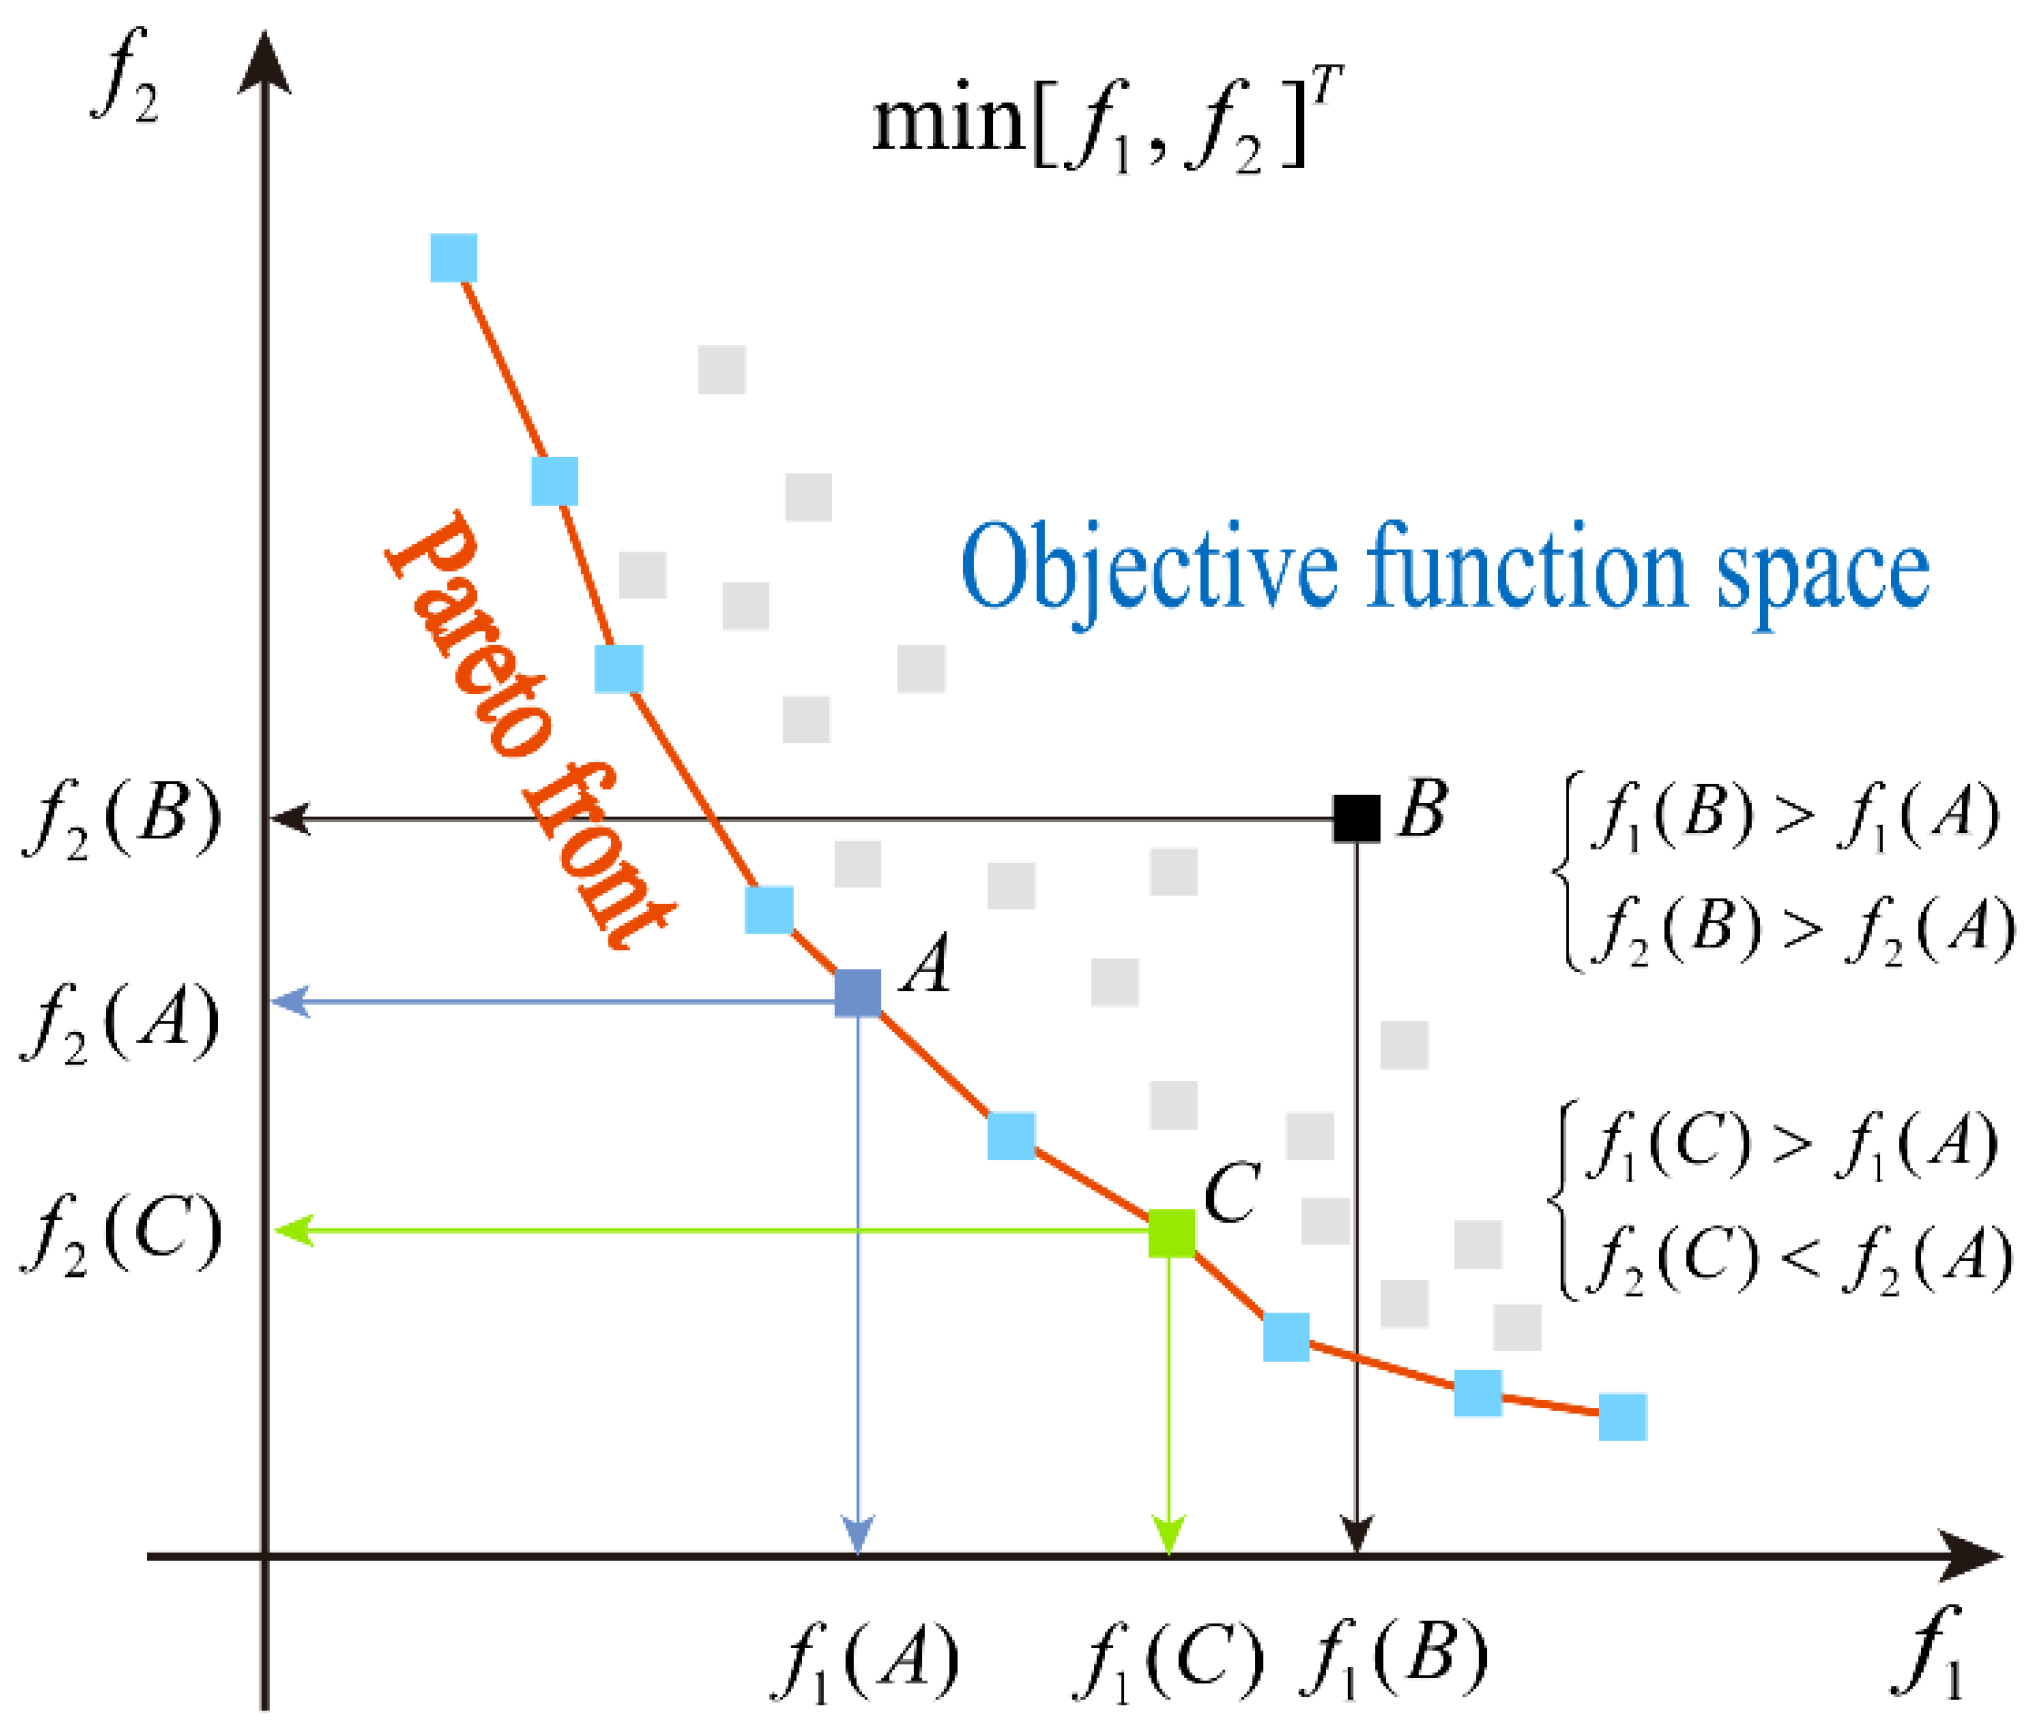
3.3. Optimization Objectives

In this study, the total friction (   f t o t a l ) and load-carrying capacity ( L C C ) were selected as the optimization objectives. Since the optimization process is calculated based on the minimum value of the objective functions and considering the practical significance of the load-carrying capacity, L C C is taken as the evaluation function. Therefore, the expression of the multi-objective optimization model is as follows:
m i n f x v a r = m i n [ f 1 ( x v a r ) , f 2 ( x v a r ) ] T = m i n [   f t o t a l , L C C ] T

3.4. Constraints

Ref. [33] mentioned that due to the influence of fluid inertial force, textures with a depth of more than 10 μ m may cause the Reynolds equation to no longer be applicable. In addition, the texture width should be related to the size of the texture unit and designed within the texture unit. The constraints on the variables are as follows:
s . t .     0 x a i 10   μ m 0 x b i 1.5   mm w h e r e , i = 1,2 , , 80 .
where x a i is the depth of the texture, and x b i represents half of the texture width.

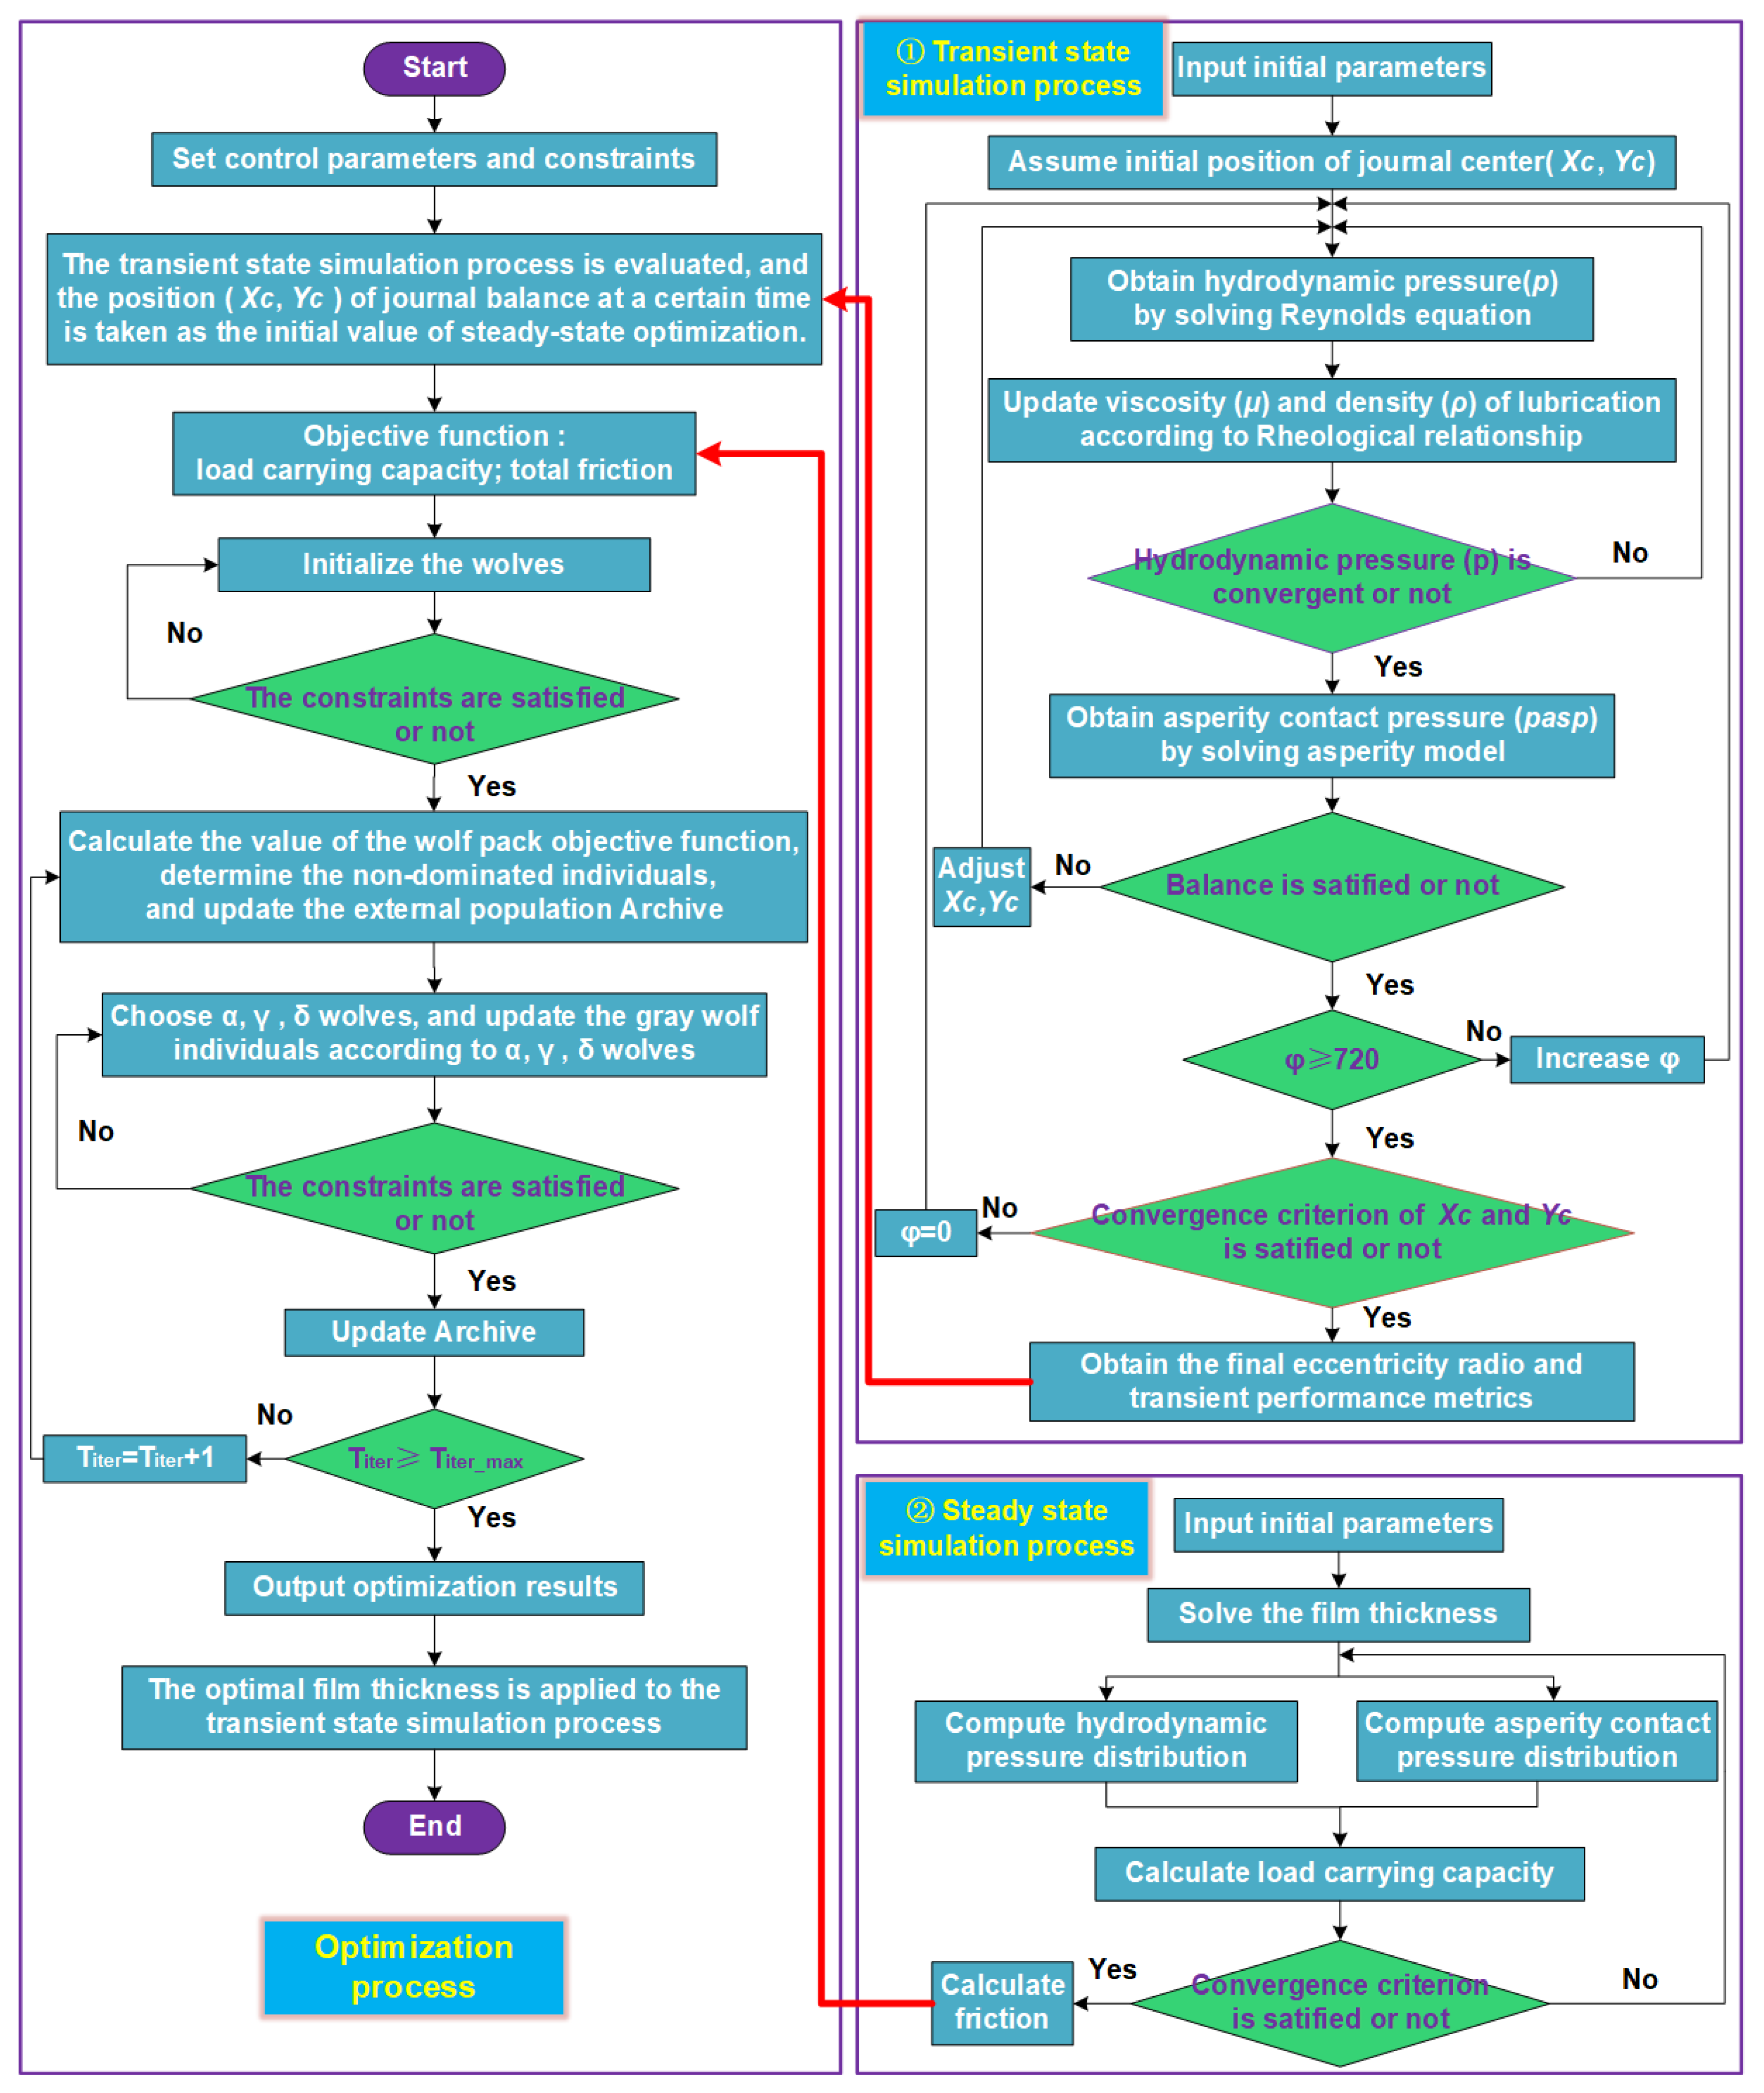
3.5. Optimization Process

Since the mixed lubrication model will be solved thousands of times during the texture-scale optimization process, the use of mesh refinement and mass-conserving cavitation boundary conditions also leads to excessive computational time. As a result, it becomes impractical to optimize the journal bearing system under transient operation. To be able to obtain an efficient optimization method, the optimization process shown in Figure 4 was adopted, involving the following steps:
  • Initialization of algorithm parameters: population size is 50, the maximum number of iterations is 100, the archive is 40, and boundary constraints should be initialized.
  • Transient simulation and evaluation of untextured journal bearing system:
    (a)
    Input the simulation conditions and set the time step to 0.5 crank angle per step. For the journal bearing system during an engine cycle, 0 to 720 degrees is one calculation cycle.
    (b)
    Assume the initial position of the journal center.
    (c)
    Calculate the hydrodynamic pressure using Equations (1)–(4) while updating the viscosity and density according to Equations (7)–(9). If the hydrodynamic pressure converges, the asperity contact pressure is obtained using Equations (5) and (6). If it does not converge, then recalculate.
    (d)
    Determine whether the load is balanced or not; if not, re-adjust the journal center position according to Equations (10) and (11) until it is balanced.
    (e)
    The time steps should be advanced one by one and the whole process repeated until the corresponding calculations are completed.
    (f)
    Evaluate the performance indicators of the lubrication system.
  • Determine the journal center position: the performance at a certain moment in the transient state process is optimized, and the journal center position corresponding to that moment is set as the position during steady-state optimization.
  • Determine the objective function and optimization variables, establish the steady-state optimization model based on Equations (24) and (25), and at the same time, initialize the wolf pack (objective functions) according to Equations (12)–(15).
  • Judge whether the current objective solution satisfies the constraints according to Equation (26). If satisfied, execute the next step; otherwise, return to step (iv) to search again.
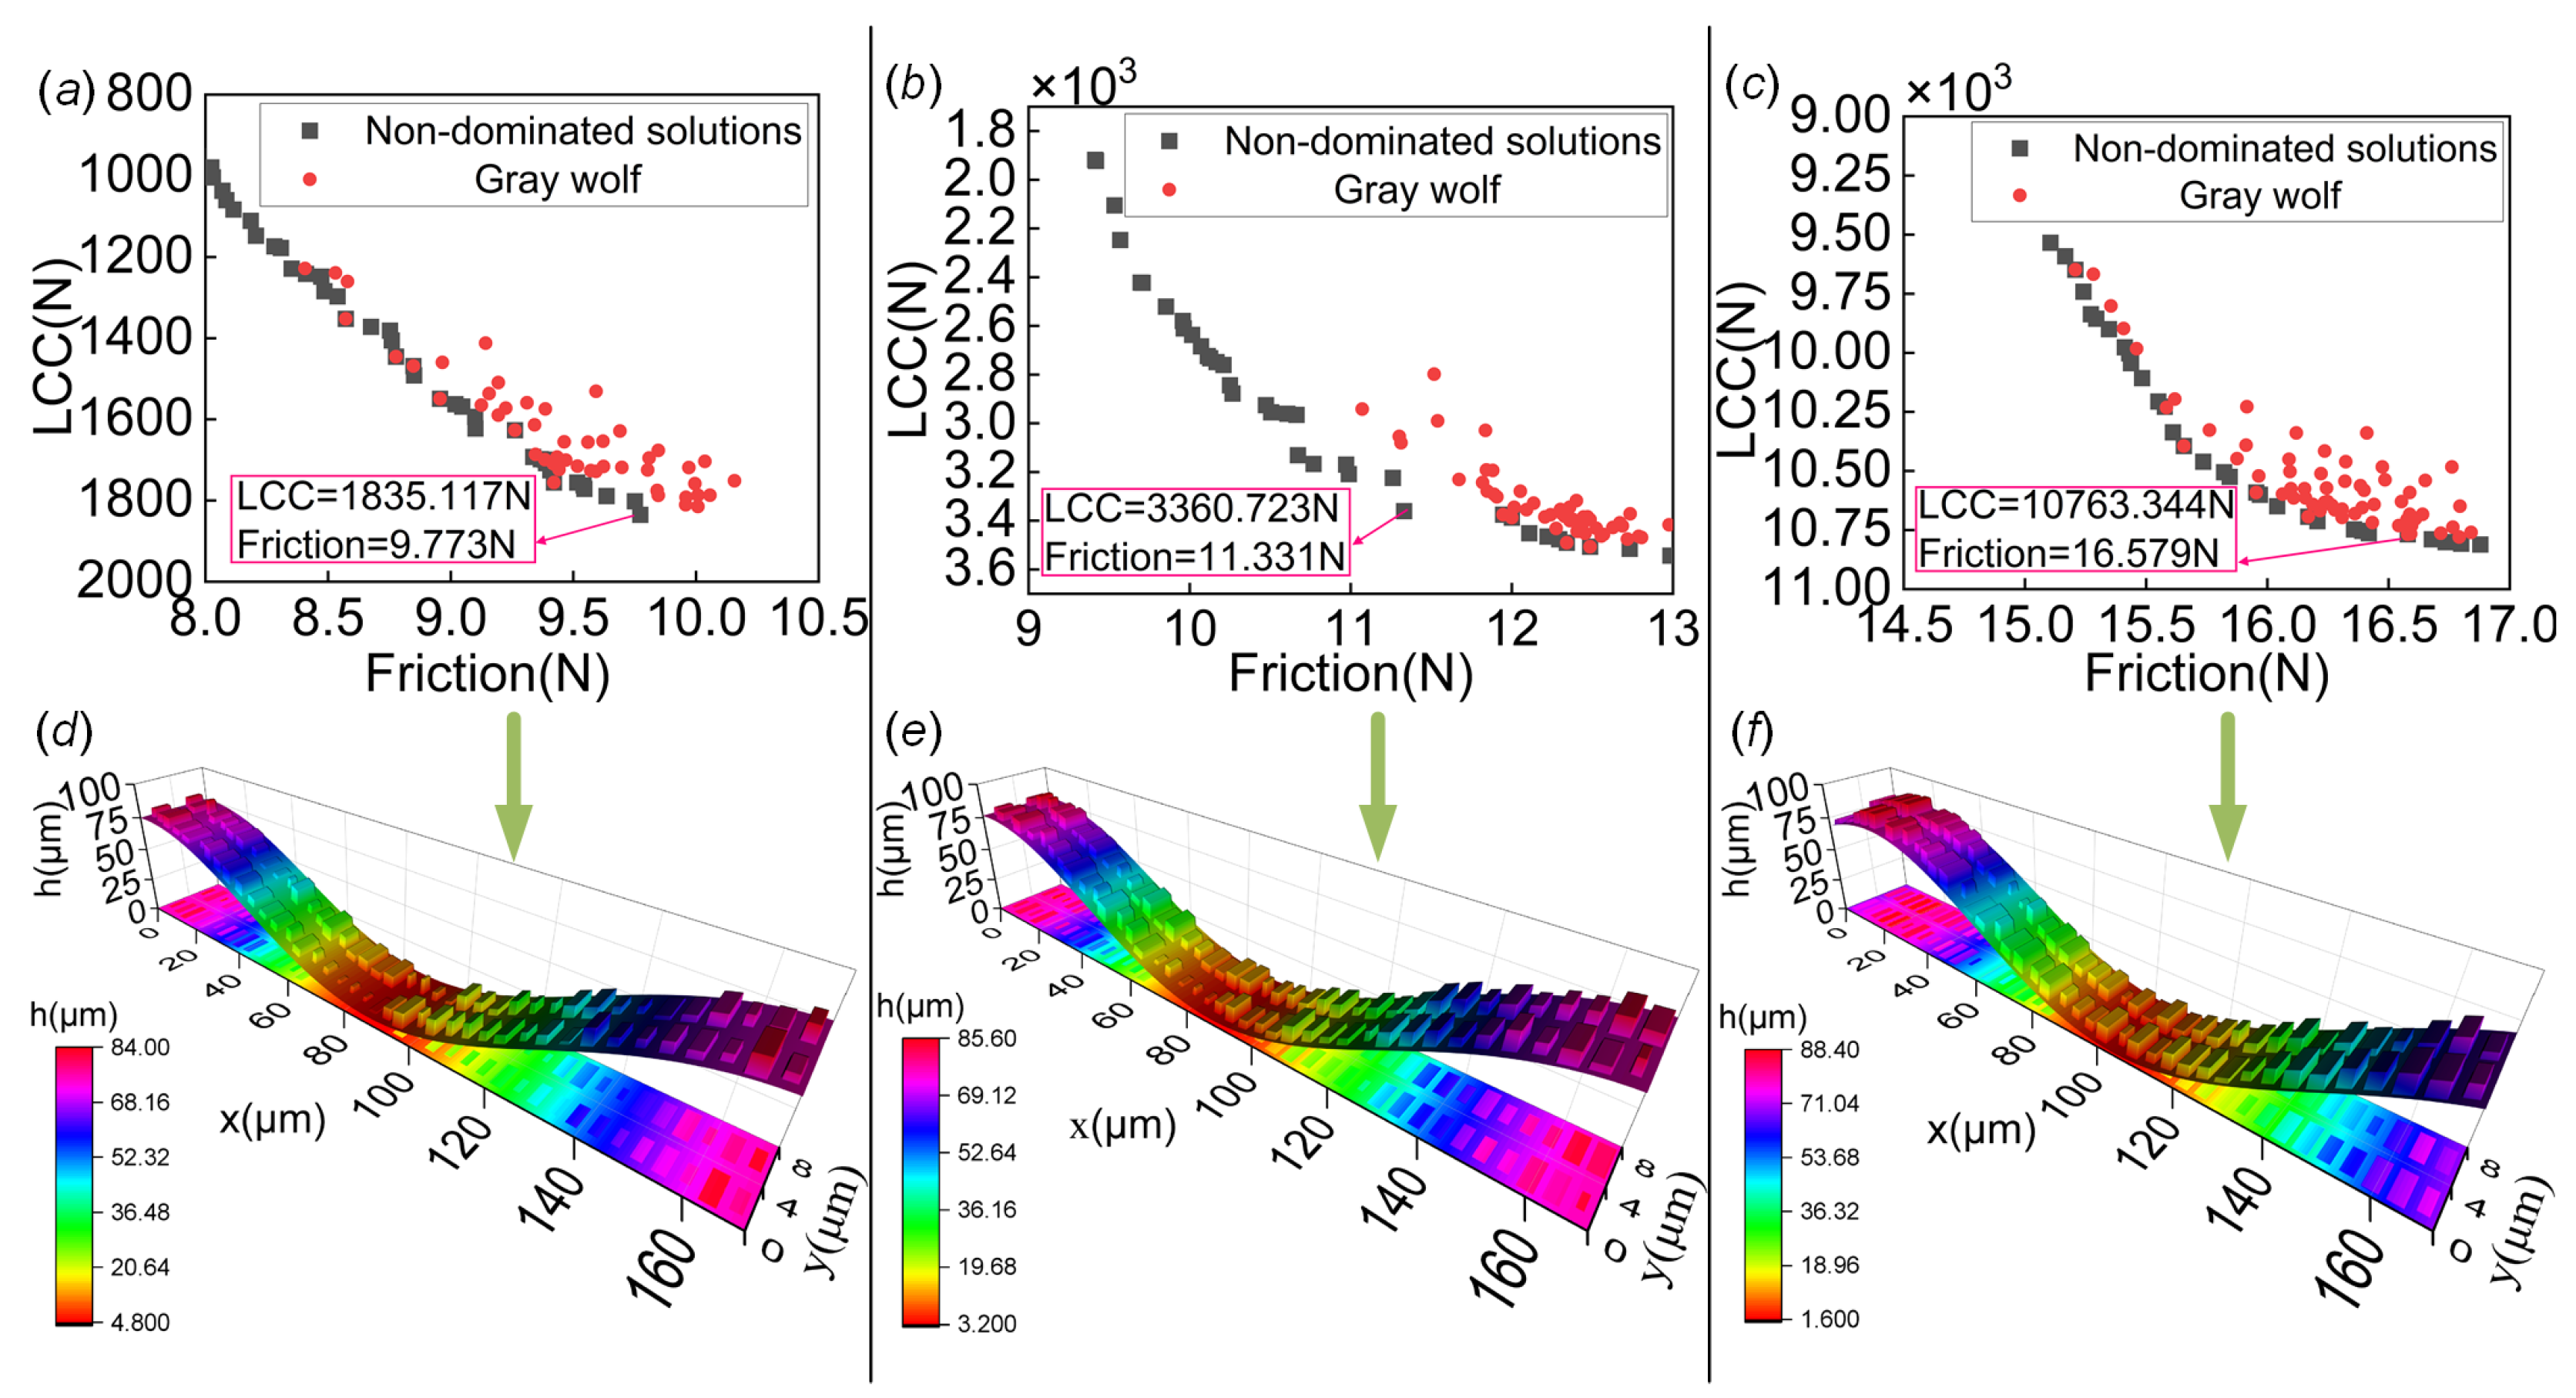
  • Calculate the objective function value according to the iterative Equations (17)–(23), and update the non-dominated solution set and external population archive.
  • Determine whether the constraints and maximum number of iterations are satisfied. If they are satisfied, stop the optimization; otherwise, return to step (vi) to continue the optimization.
  • Output the obtained non-dominated objective solution and optimal texture size.
  • Reapply the obtained optimal texture to the transient simulation process to improve the tribological performance.
It should be mentioned that the calculations of the performance of the journal bearing in this study were programmed using FORTRAN, which is the core component of the numerical analysis. To optimize the surface texture of journal bearings, MATLAB was employed to implement the optimization algorithm. Throughout the optimization process, MATLAB was responsible for calling the FORTRAN-written calculation program, and iteratively adjusting the texture parameters to seek the optimal solution. The combined utilization of FORTRAN and MATLAB capitalized on their respective computational and optimization capabilities, thereby guaranteeing the accuracy of numerical analysis and the effectiveness of the optimization procedure.

4. Results and Discussion

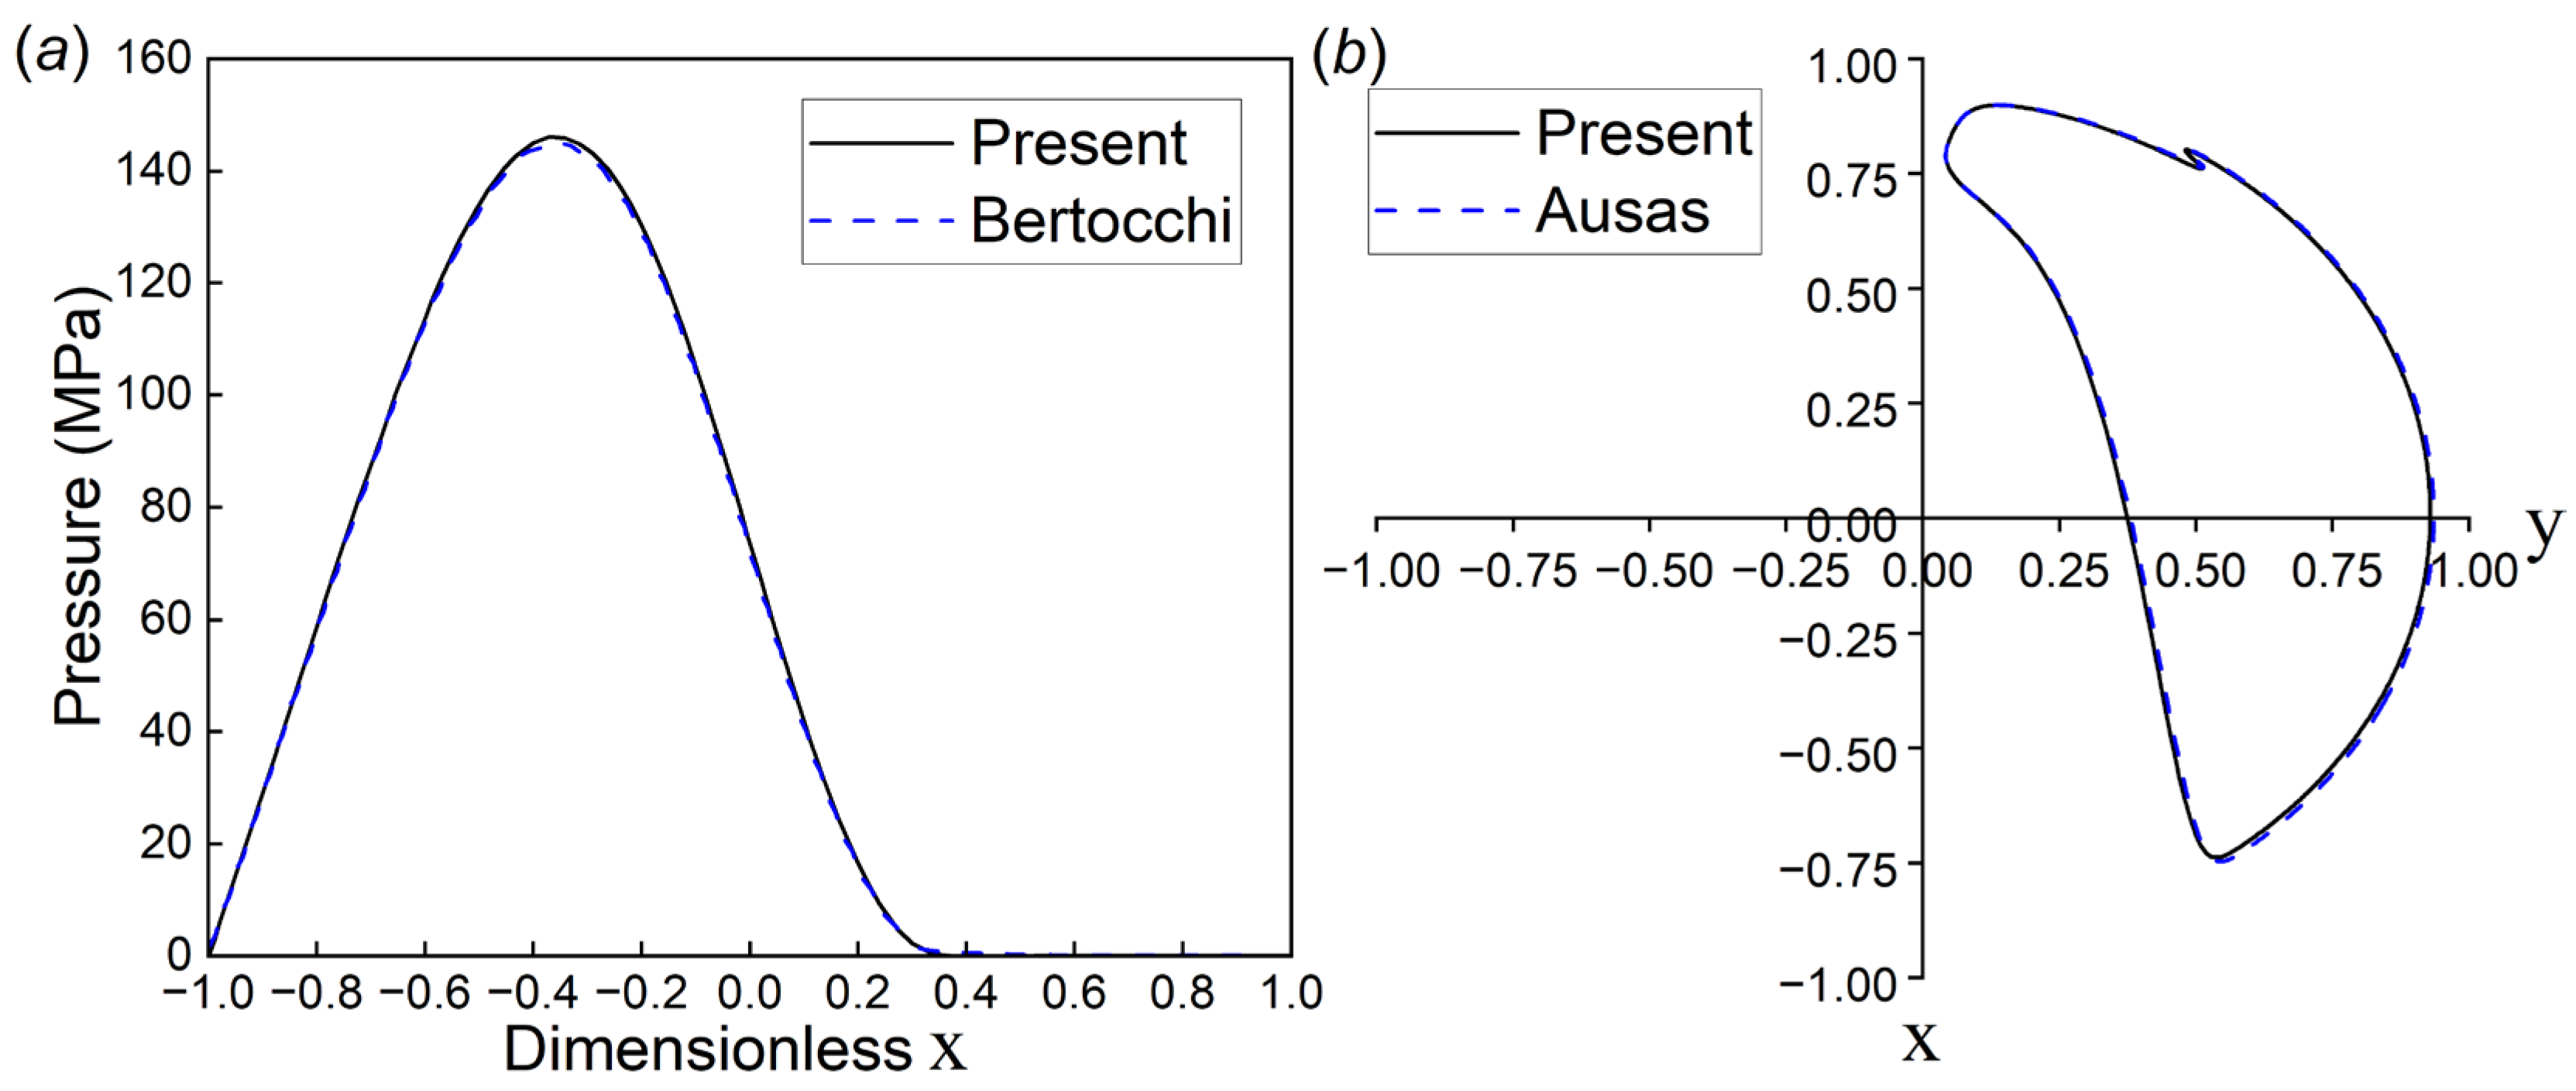
4.1. Model Validation

To ensure the correctness and accuracy of the researched model, this study conducted model validation on both steady-state and transient-state simulations using the two cases shown in Figure 5. For the steady-state validation, the published work by Bertocchi et al. [34] was used as a reference, with the same simulation conditions maintained. As shown in Figure 5a, the results of hydrodynamic pressure obtained from the current model are highly consistent with those in the literature. For the transient-state validation, a dynamically loaded journal bearing case studied by Ausas et al. [35] was utilized, and the comparison results are shown in Figure 5b. It can be observed that the computed results using the current model closely match the research results of Ausas et al., further confirming the reliability of the numerical model.

4.2. Application Example and Discussion

As discussed in the following sections, the mixed lubrication model of the journal bearing system was employed to conduct a transient simulation. The novel adaptive scale texture optimization approach was introduced to explore the friction reduction effect of surface texture under engine-like conditions. The geometric and operating parameters required for transient simulation are listed in Table 1 and Table 2, respectively. At the same time, the simulation work also considered the influence of different applied loads. Figure 6 shows the changes in applied load under low-speed (2000 rpm) and high-speed (4000 rpm) conditions. These data were obtained from the kinetic equation of the mechanism and combustion gas pressure experiments [36]. Additionally, in order to exclude the influence of grid size on the simulation results, 340 × 16, 680 × 32, 1360 × 64, and 2720 × 128 grids were used in the study. The difference between the results of 1360 × 64 and 2720 × 128 grids was within 2%, so the 1360 × 64 grid was chosen to balance the computational accuracy and efficiency.

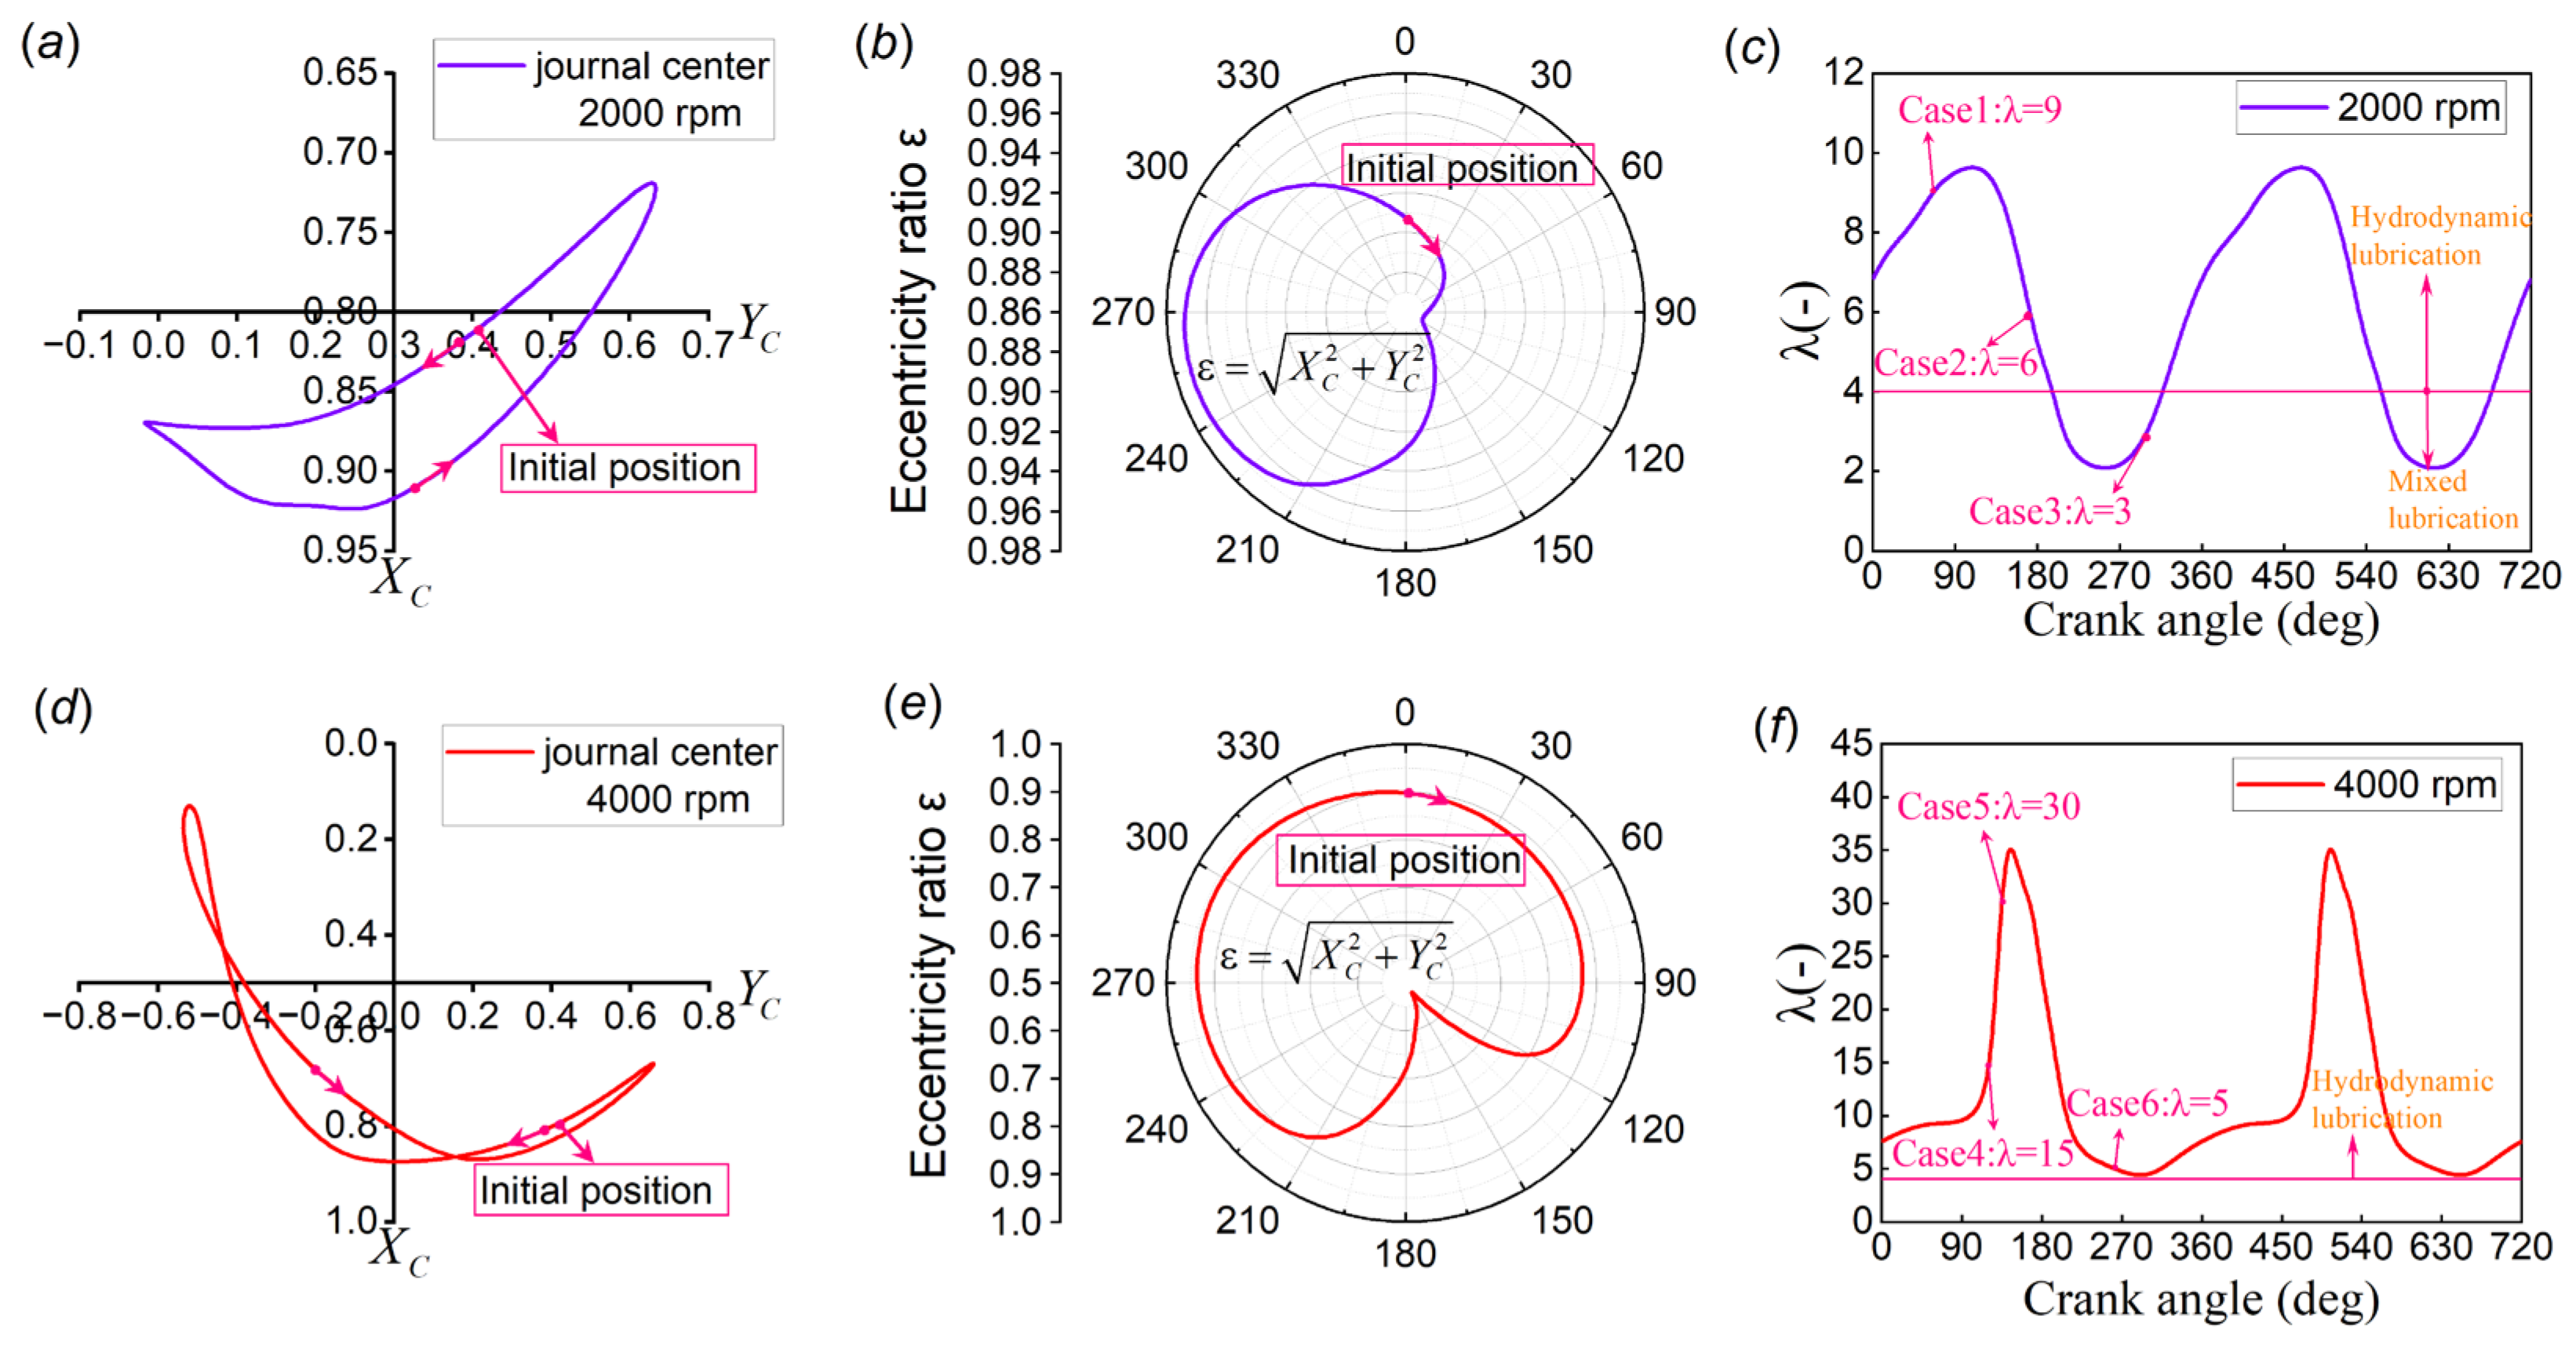
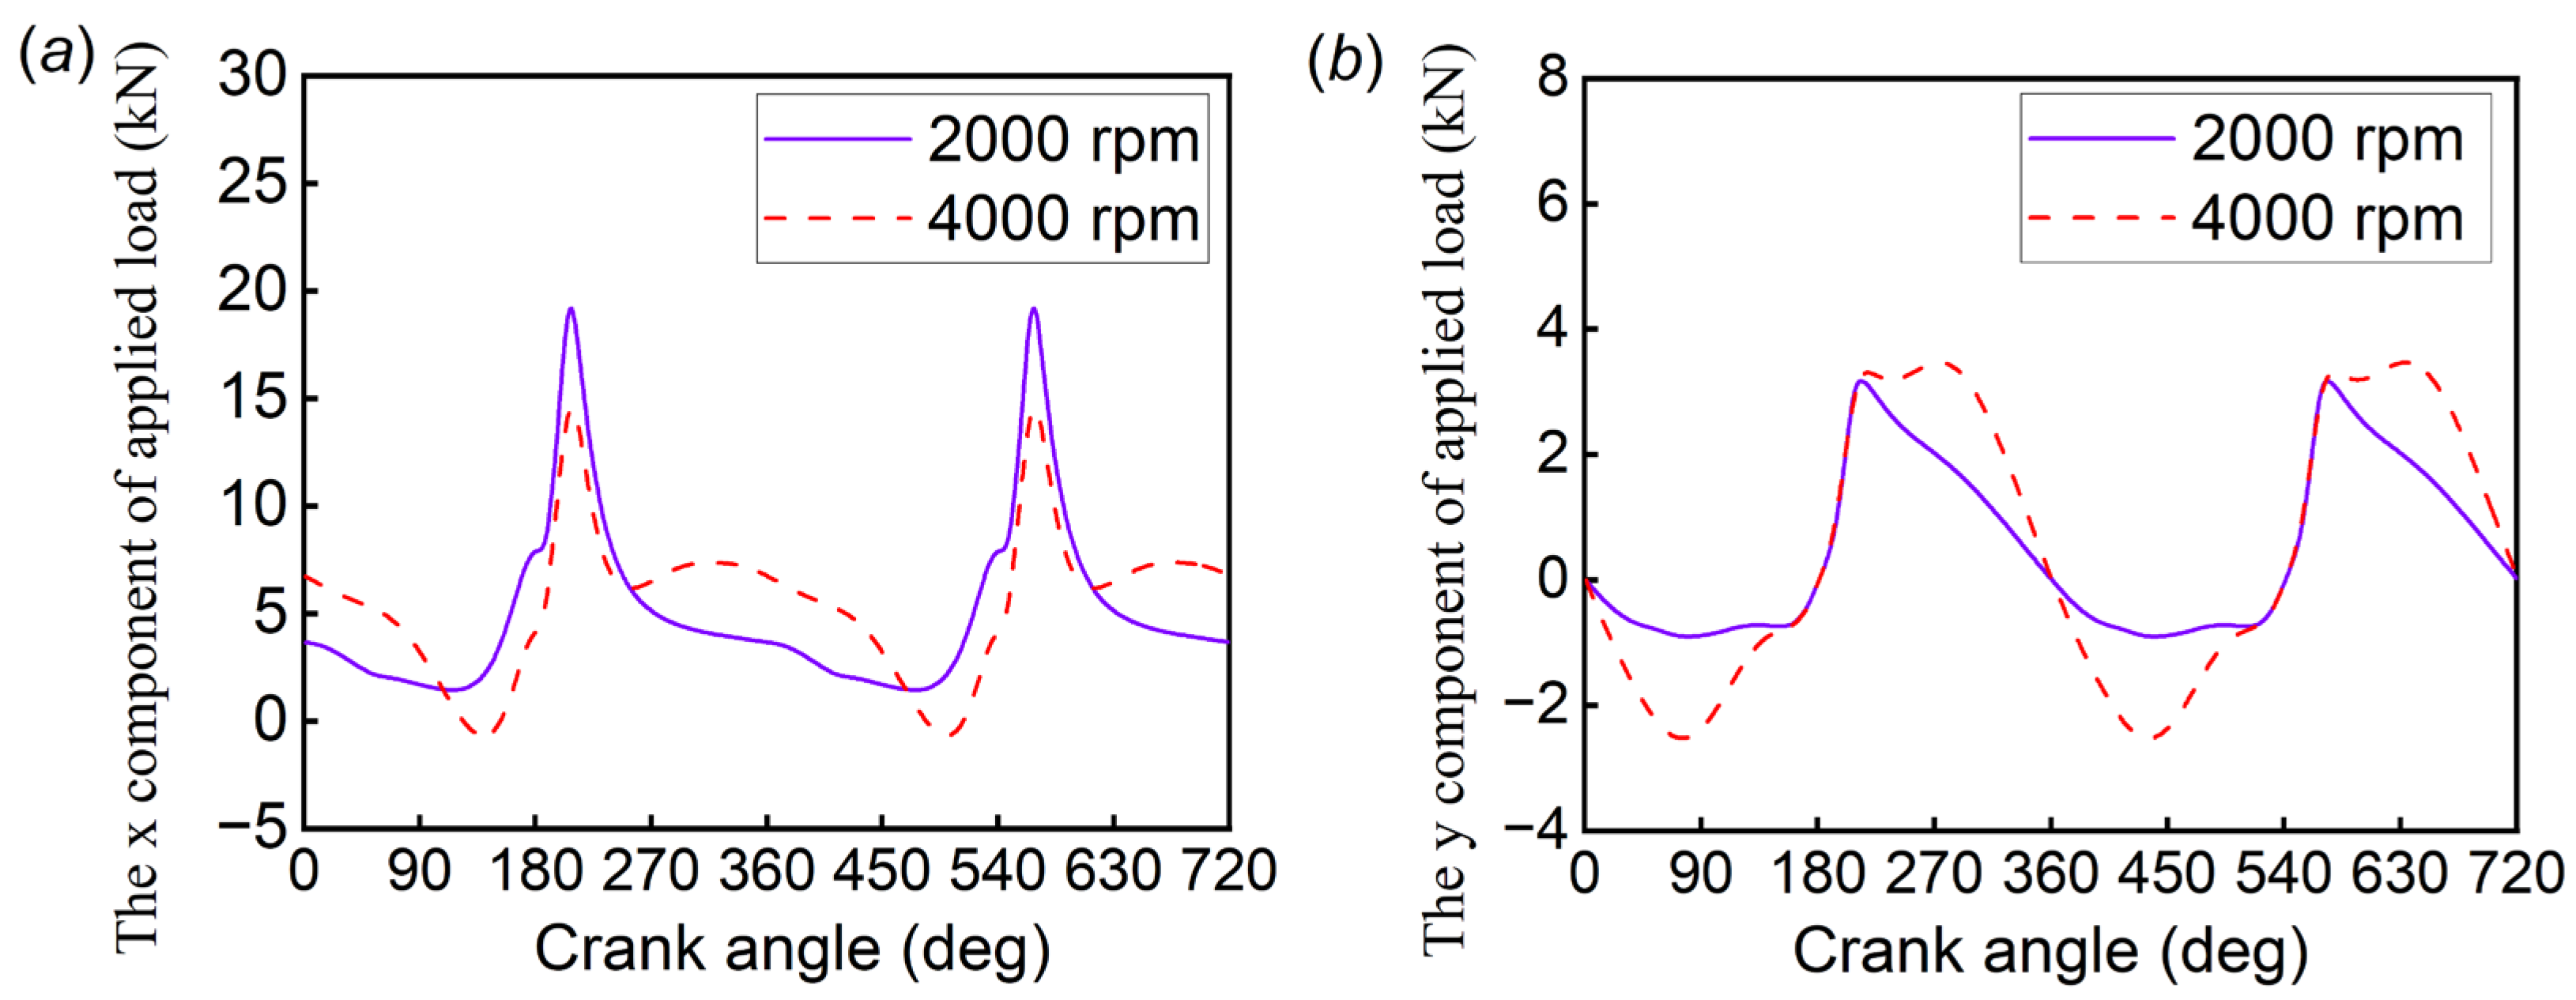
4.2.1. Simulation Results of Untextured Journal Bearing System

Next, simulation results of the non-textured journal bearing system were obtained based on the operating conditions. Figure 7a,b show the variations in the journal center position and eccentricity ratio at 2000 rpm, respectively. It can be observed that the journal center starts to move from the balanced position X c = 0.81029, Y c = 0.40714, and the eccentricity ratio shows a trend of first decreasing, then increasing, and finally decreasing again under the influence of load, with a range of 0.86925 to 0.97171, staying in the high eccentricity ratio ( ε > 0.8) state all the time. Figure 7c shows the variation in the film thickness ratio at 2000 rpm. Initially, the journal bearing system operates under hydrodynamic lubrication due to low loads. Along with the increasing loads, mixed lubrication occurs when the crank angle is at 195 degrees to 316 degrees. Subsequently, the load decreases again and the system returns to the hydrodynamic lubrication state. Due to the symmetry of the load, only the range from 0 degrees to 360 degrees is discussed. Similarly, Figure 7d,e show the variations in the journal center position and eccentricity ratio at 4000 rpm, respectively. It can be seen that the journal center starts to move from the balanced position X c = 0.79541, Y c = 0.41399 and that the trend of the eccentricity ratio is the same as that at 2000 rpm, but with a range of 0.52375 to 0.94018, mostly staying in the medium eccentricity ratio state. Moreover, from Figure 7f showing the variation in the film thickness ratio at 4000 rpm, it can be seen that the entire system operates under the hydrodynamic lubrication state. To achieve a better lubrication performance, three specific journal center positions were optimized at 2000 rpm and 4000 rpm. Table 3 lists the results of the load-carrying capacity and friction of the untextured journal bearing system in different positions as reference values for the optimization.

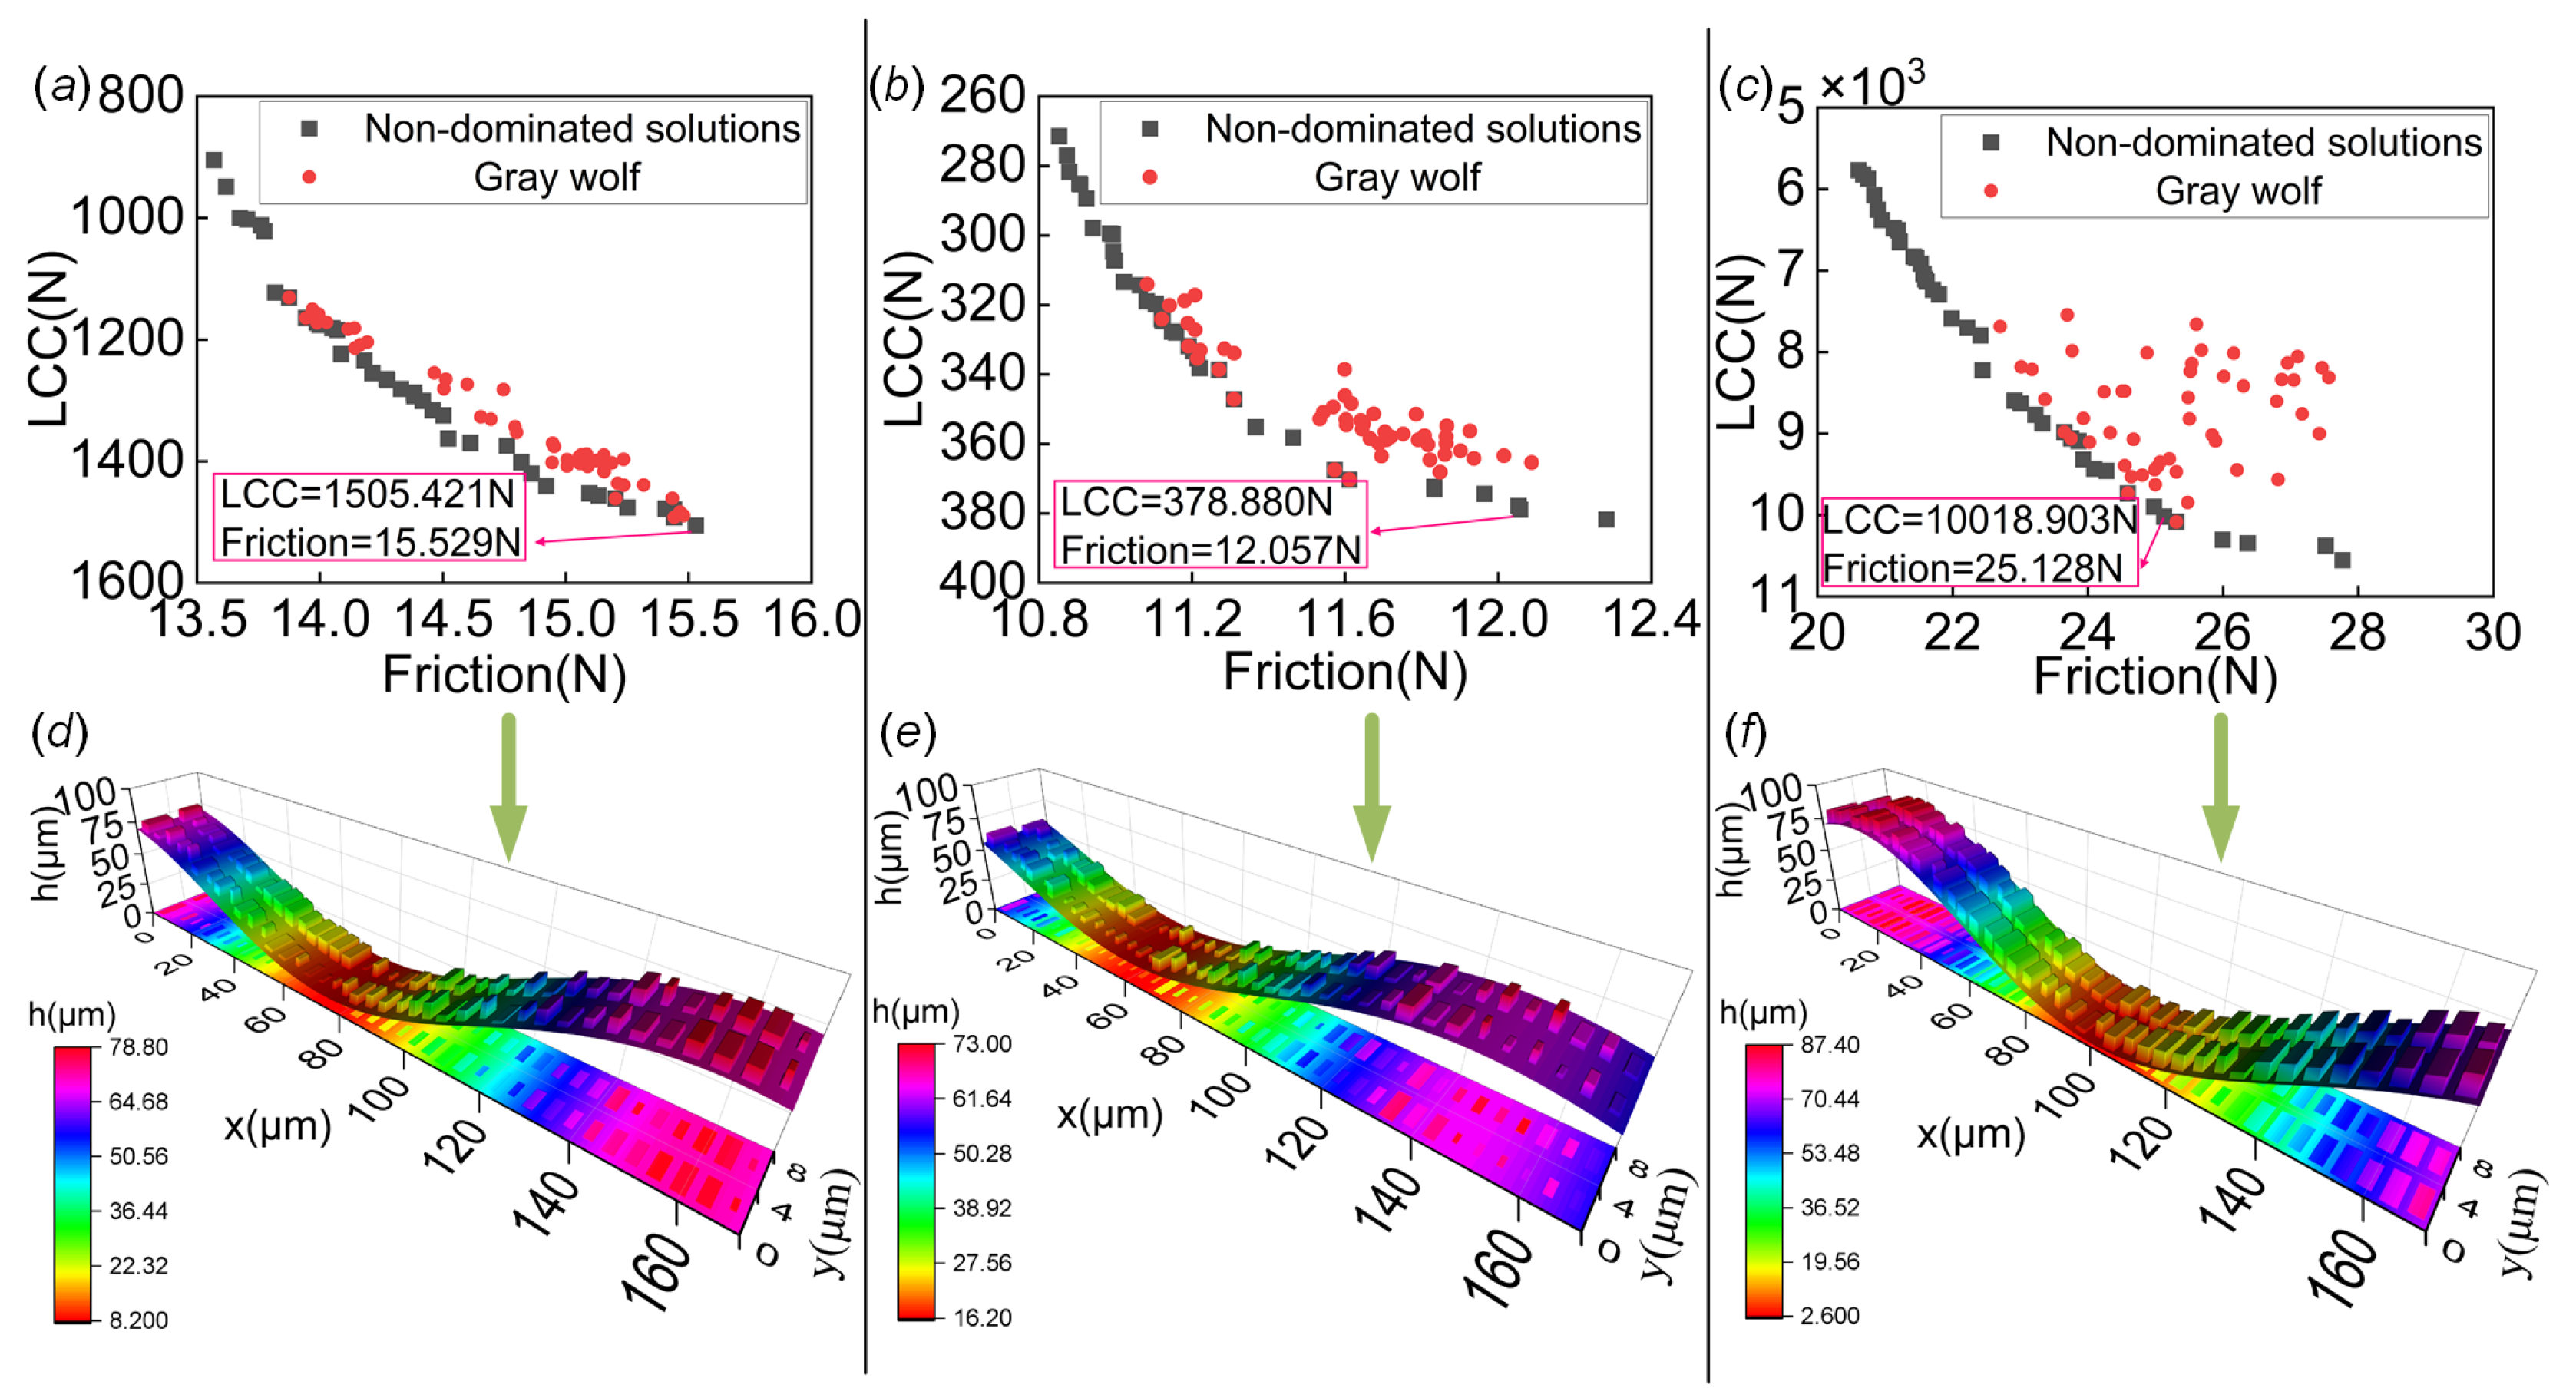
4.2.2. Performance and Texture Optimization Results at 2000 rpm

Figure 8a shows the non-dominated solution set obtained through the multi-objective optimization of the load-carrying capacity and friction in Case 1. According to the definition of non-dominated solutions, every non-dominated solution is equivalent and can be used as a candidate for evaluating performance indicators. To screen out a more ideal solution, the friction coefficient f c o e f was used for further evaluation. The friction coefficient represents the ratio of friction to load-carrying capacity. A lower friction coefficient means a better performance. Therefore, the solution indicated in the figure was selected among all non-dominated solutions. Figure 8d shows this solution’s corresponding optimal square texture profile. The height of each protrusion represents the depth of the texture, and the area without protrusions indicates that the texture depth is 0. The optimal size of each texture is different and is subject to the operating conditions to achieve the optimal adaptation value. This is a way to obtain an adaptive texture scheme by taking global considerations into account. Referring to the data in Table 3, it can be observed that in this case, the load-carrying capacity is increased by 7.1%, and friction is reduced by 10.64% as compared to the untextured journal bearing system. From the analysis of the results, both the load-carrying capacity and friction are significantly improved. Similarly, Figure 8b,c show the non-dominated solution sets obtained through the multi-objective optimization of the load-carrying capacity and friction in Cases 2 and 3, respectively. Figure 8e,f show the optimal square textured contours corresponding to Cases 2 and 3, respectively. Compared to the untextured journal bearing system, Case 2 shows an improvement of 0.66% in the load-carrying capacity and a reduction of 15.24% in friction. In Case 3, there was a significant increase of 15.76% in load-carrying capacity and a substantial decrease of 29.25% in friction. Both scenarios improved the tribological performance of the system to varying degrees and both achieved positive results.

4.2.3. Performance and Texture Optimization Results at 4000 rpm

Figure 9a–c show the non-dominated solution sets obtained through the multi-objective optimization of the load-carrying capacity and friction for Case 4, Case 5, and Case 6, respectively. Figure 9d–f show the corresponding optimal square texture contours for Case 4, Case 5, and Case 6, respectively. It can be seen that there are differences in the optimal textures of the cases, and these differences may be the result of adjustments made to achieve the better load-carrying capacity and friction. In combining the data in Table 3 and comparing it to the untextured journal bearing system, the optimized load-carrying capacity increased by 9.31%, 1.99%, and 13.2%, and the friction was reduced by 6.82%, 3.42%, and 20.89% for Cases 4, 5, and 6, respectively. These optimization results show that the introduction of adaptive scale texture is effective in reducing friction and lubrication.

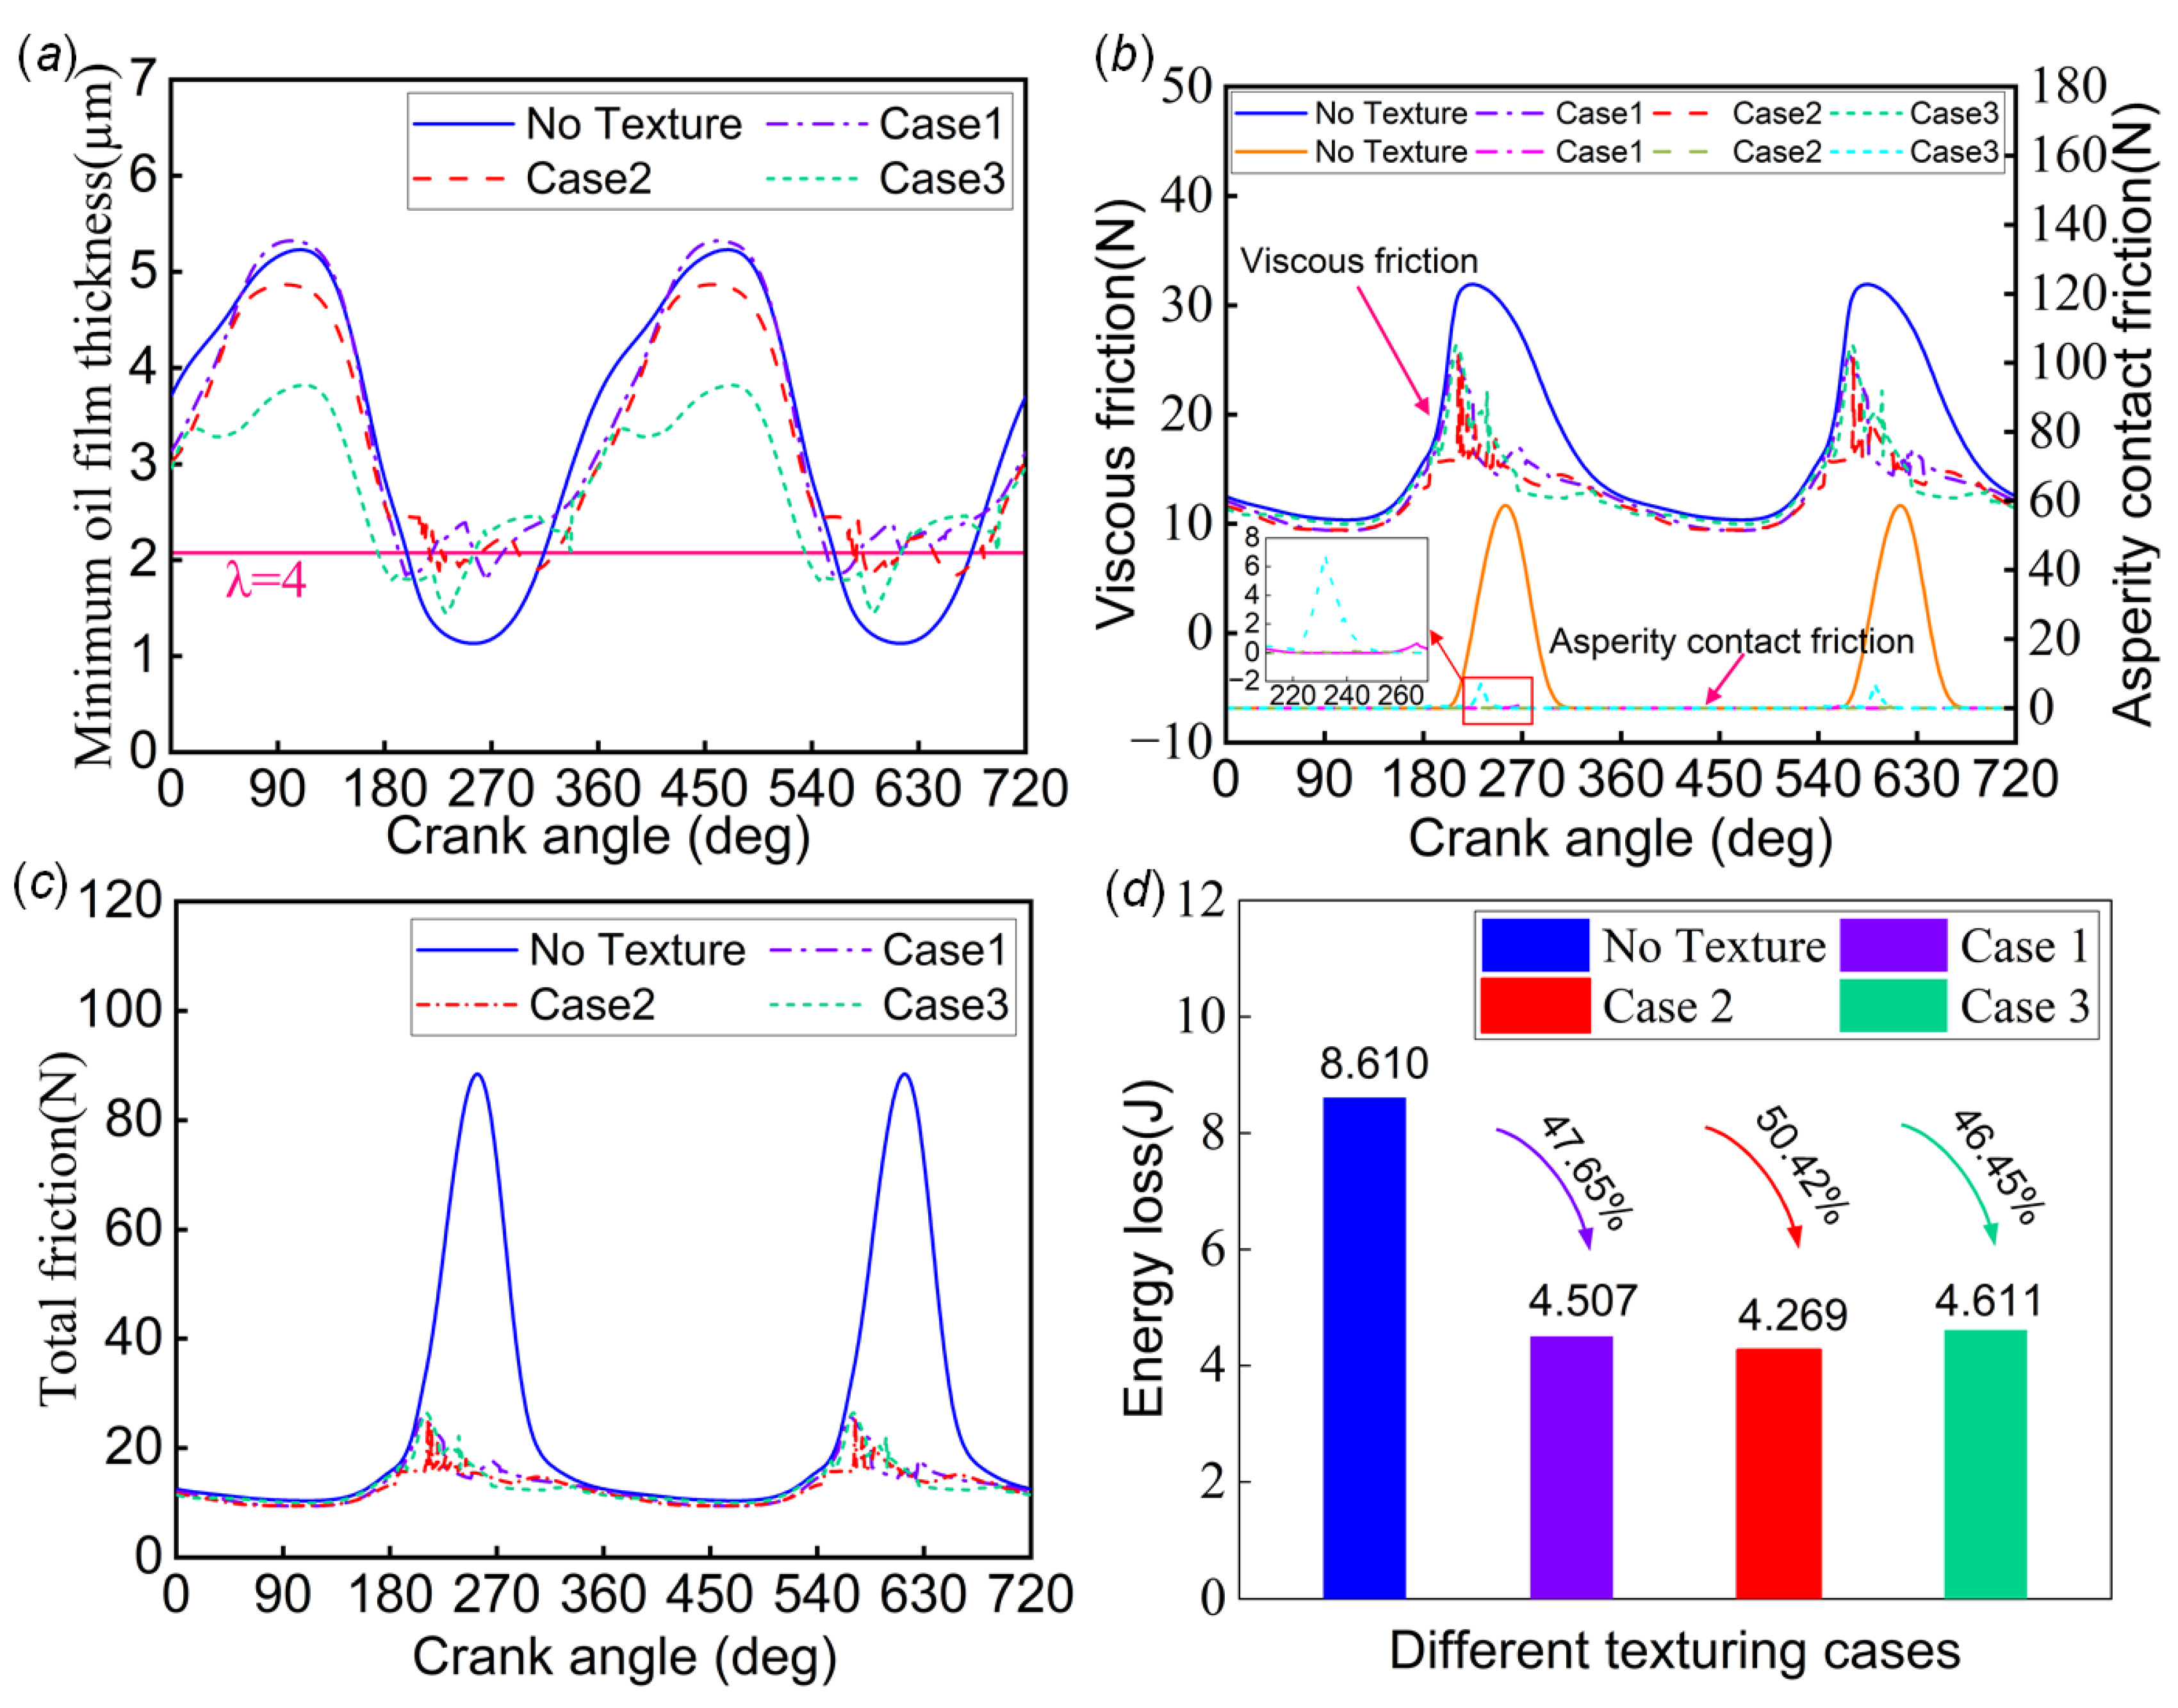
4.2.4. Transient State Simulation Results at 2000 rpm

The operation of a journal bearing system is a dynamic process whereby the load is balanced by constantly adjusting the position of the journal center. The optimum texture at a particular journal center position is not the best choice at other positions, but it is still a better choice. Therefore, the square textures obtained from the optimization of Case 1, Case 2, and Case 3 were subjected to transient simulations at 2000 rpm for evaluation. Figure 10a shows a comparison of the minimum oil film thicknesses for the untextured and textured systems. In the hydrodynamic lubrication stage, the application of surface texture leads to a decreasing trend in the minimum oil film thickness. This phenomenon does not completely indicate that it is unfavorable to the system. The minimum oil film thickness is different from the oil film thickness. The local oil film thickness of the textured system may be higher than that of the untextured system. It is necessary to consider the global range of the oil film thickness. In the mixed lubrication phase, the system-containing textured profiles had a boost to the minimum oil film thickness, and the minimum oil film thickness varied erratically in this phase. Figure 10b shows the results of the variations in viscous friction and asperity contact friction for the untextured and textured systems; all the bearings with textures had less viscous friction than in the untextured case. Case 3 had the least viscous friction when the crank angle was between 0 degrees and 23 degrees and 263 degrees and 360 degrees. Case 2 had the least viscous friction when the crank angle was between 24 degrees and 262 degrees. The textured system also shows a substantial reduction in asperity contact friction compared to the untextured system. Figure 10c depicts a comparison between the untextured and textured systems regarding total friction, illustrating that adaptive square texturing is beneficial for friction reduction. Figure 10d shows a comparison between the untextured and textured systems regarding energy loss. Among all the cases, the texture of Case 2 produced the best tribological performance as it possessed the lowest value of energy loss, which was reduced by 50.42% as compared to the untextured cases.

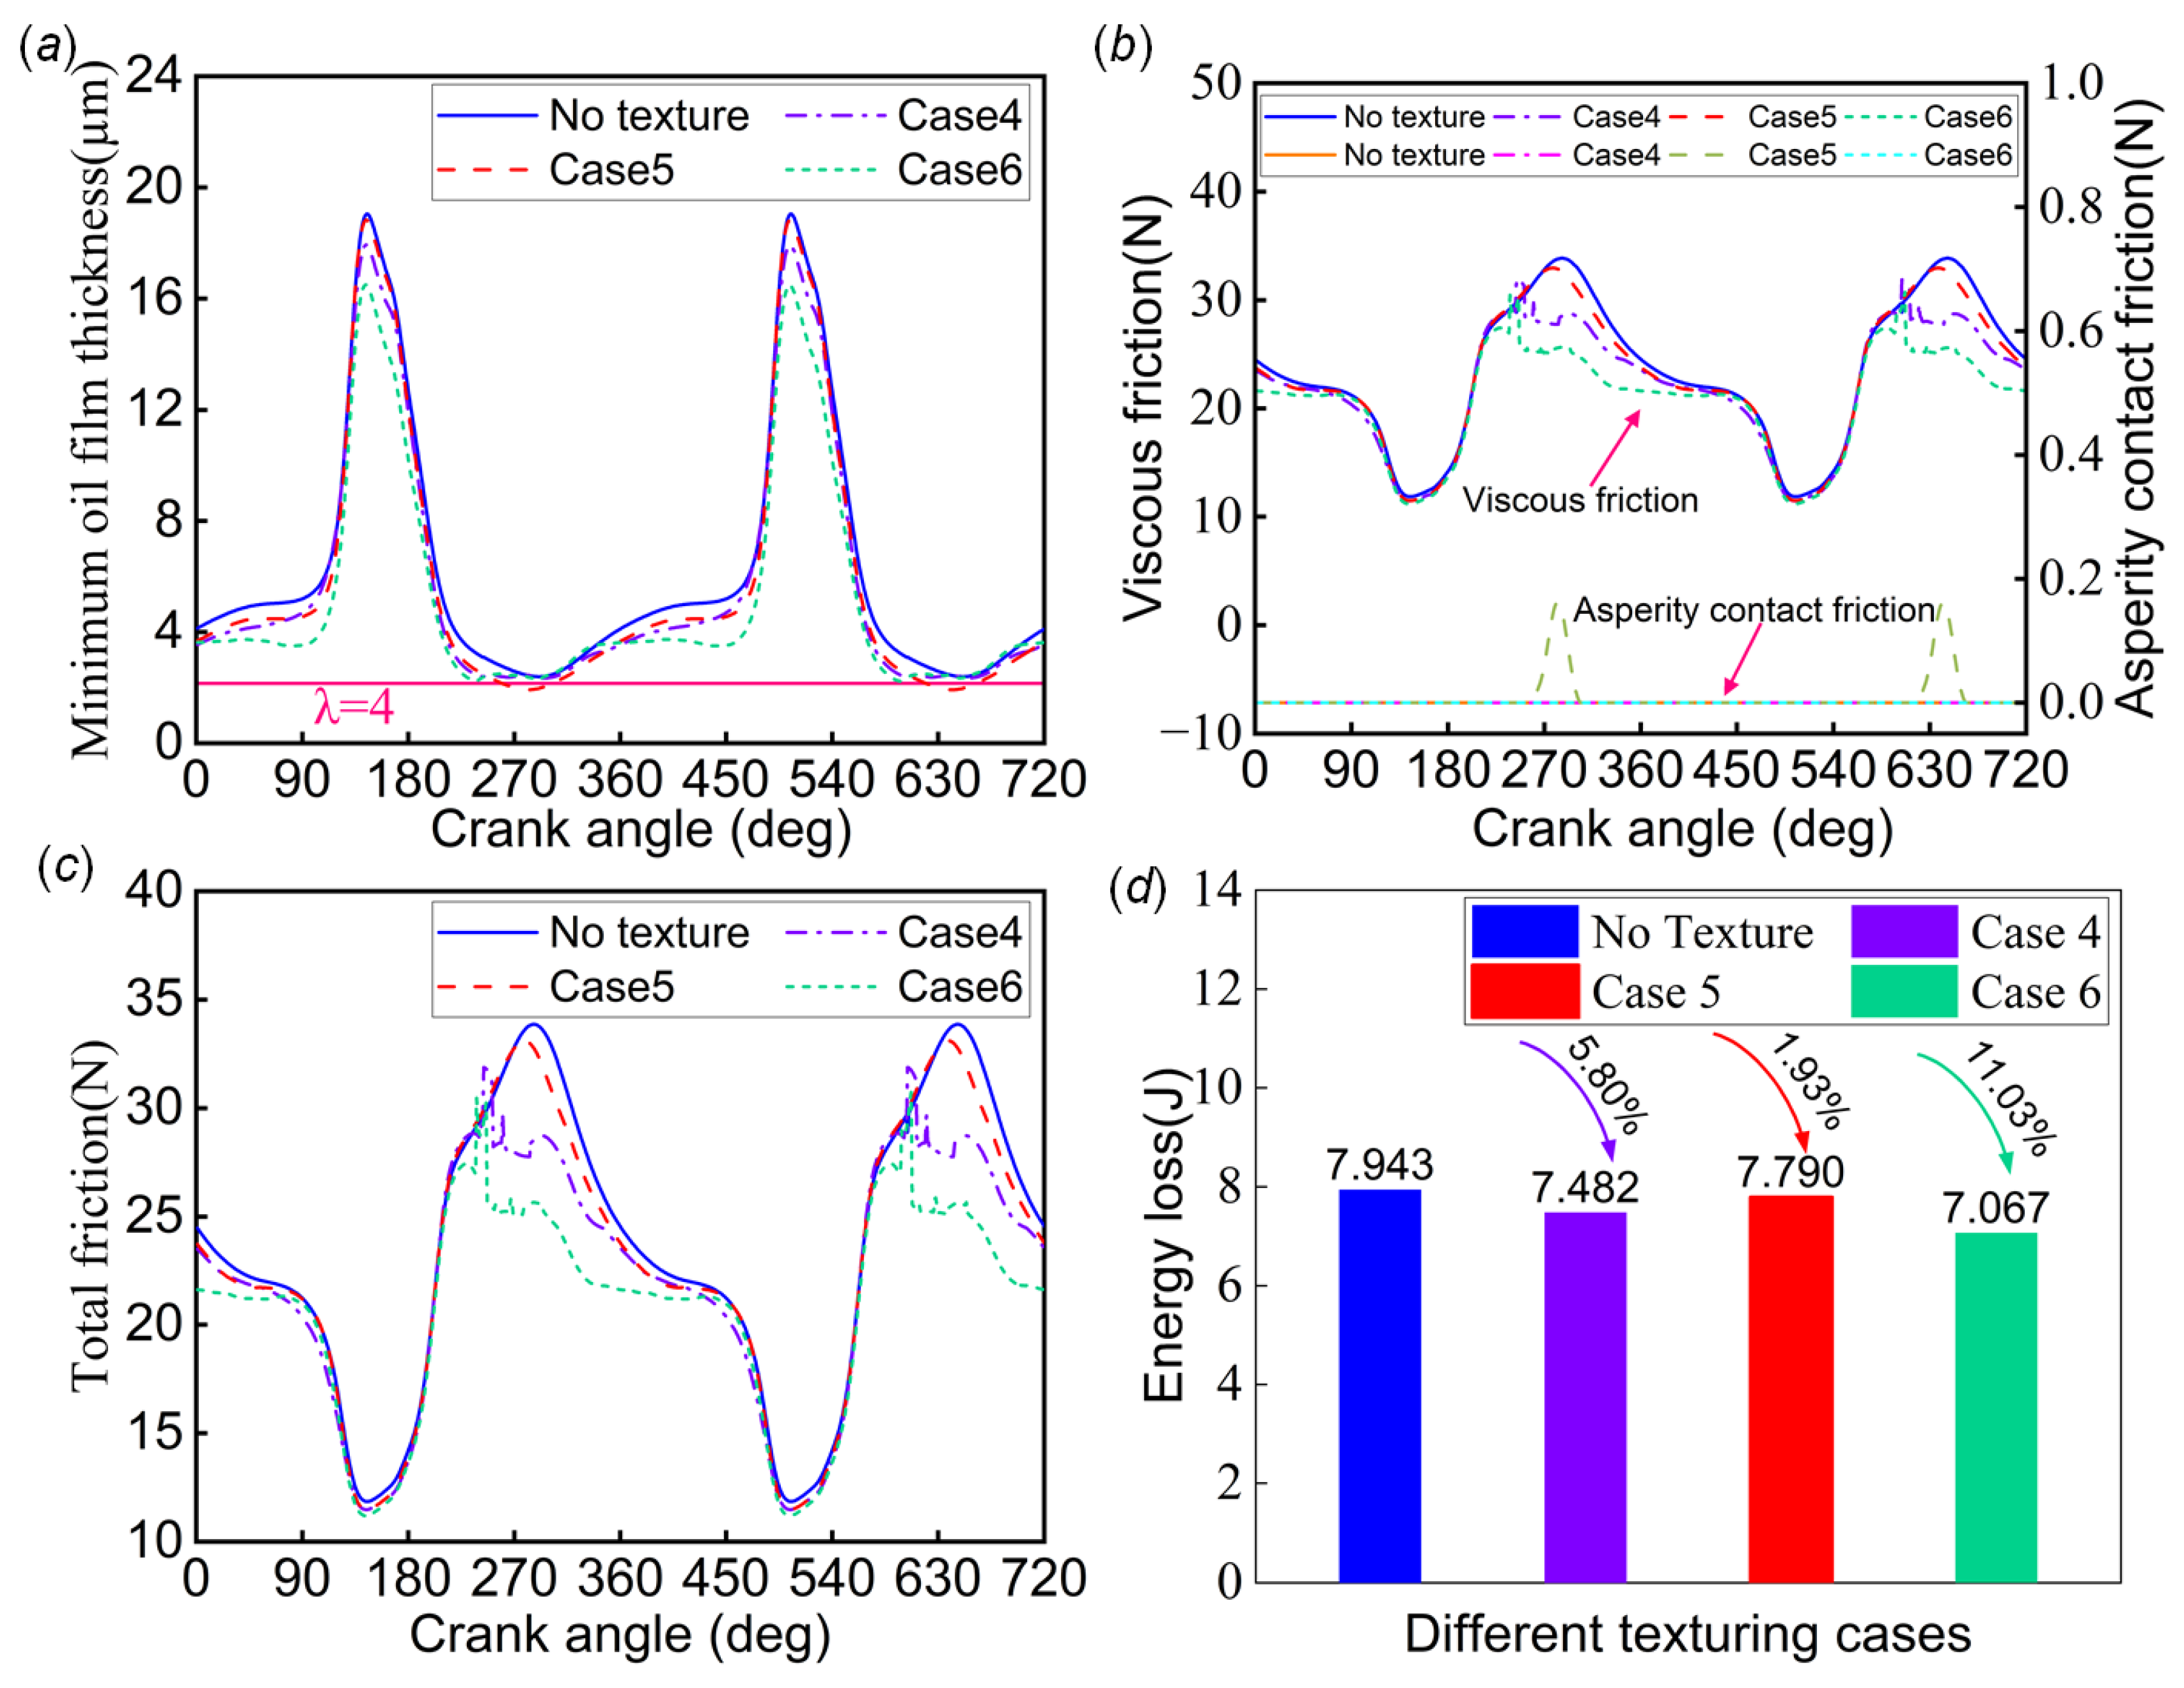
4.2.5. Transient State Simulation Results at 4000 rpm

The same approach was taken to evaluate the square texture obtained from the optimization of Cases 4, 5, and 6 by subjecting them to transient simulations at 4000 rpm. Figure 11a shows a comparison between untextured and textured journal bearing systems in terms of the minimum oil film thickness. It is concluded that the application of the textured bearing system in the hydrodynamic lubrication stage leads to a reduction in the minimum oil film thickness. This is consistent with the results in the previous subsection. It should be noted that the texture application in Case 5 resulted in mixed lubrication in a system that originally experienced only a hydrodynamic lubrication regime. This needs to be evaluated further using the performance metrics on friction in Figure 11b,c. It was found that only Case 5 had a limited asperity contact friction in the process, and the total friction was still dominated by viscous friction. Combined with Figure 10b, it can be found that the total friction force at 4000 rpm was lower than that at 2000 rpm. This result indicates that under the current specific operating conditions, maintaining the system at a higher rotational speed helps reduce the asperity contact friction. Figure 11d compares the energy loss of the untextured and textured journal bearing system systems. The results show that Case 4, Case 5, and Case 6 reduced the energy loss by 5.80%, 1.93%, and 11.03%, respectively. The texturing in Case 6 resulted in lower energy loss values.

5. Conclusions

This paper presents a mixed lubrication model for the journal bearing system, considering the effects of cavitation and surface roughness. The model was used to conduct transient-state simulation research. Simultaneously, a multi-objective optimization method for surface texture design was proposed to enhance the overall performance of a journal bearing system. Based on this method, an adaptive scale square texture with a better comprehensive performance was obtained. Furthermore, to address the difficulty in optimizing the transient-state process of the journal bearing system, the performance optimization at a specific moment during the transient-state process was transformed into a steady-state model for independent optimization. Multiple sets of optimization plans were then created to ensure a reasonable evaluation. This study confirms that the proposed optimization approach significantly reduces the optimization time. The following conclusions were drawn from the optimization analysis:
  • Different texture schemes will lead to different friction reduction effects. The optimal texture scheme at a specific journal center position may not be optimal at other positions, and a comprehensive evaluation in transient-state simulation is required.
  • The variations in texture dimension parameters and operating conditions can lead to different tribological performances. Therefore, during the design phase of surface texture, it is recommended to conduct a comprehensive analysis of various parameters.
  • At low speed (2000 rpm), the journal center is often in a high eccentricity ratio state. However, at high speed (4000 rpm), the journal center is often in a moderate eccentricity ratio state. The high-speed state helps to avoid the generation of asperity contact friction force.
  • Adaptive scale texture exhibits strong adaptability and achieves remarkable friction reduction benefits at both 2000 rpm and 4000 rpm speeds.
  • A reasonable surface texture is advantageous in increasing the minimum oil film thickness and reducing the probability of asperity contact during the mixed lubrication phase.
The multi-objective adaptive scale texture optimization design method provides a new idea for enhancing the performance of journal bearing systems and holds significant guiding significance for the future optimization designs of journal bearing systems.

Author Contributions

Conceptualization, C.G. and Y.C.; methodology, C.G.; validation, C.G.; formal analysis, Y.C.; investigation, D.Z.; resources, C.G.; data curation, C.G.; writing—original draft preparation, Y.C.; writing—review and editing, C.G. and D.Z.; visualization, Y.C.; supervision, C.G.; project administration, C.G.; funding acquisition, C.G. All authors have read and agreed to the published version of the manuscript.

Funding

This study was sponsored by the National Natural Science Foundation of China (No. 52305207) and the Shanghai Sailing Program (No. 19YF1434500).

Data Availability Statement

The data used to support the findings of this study are available from the corresponding author upon request.

Conflicts of Interest

The authors declare no conflicts of interest.

References

  1. Kumar, A.; Sharma, S.C. Textured conical hybrid journal bearing with ER lubricant behavior. Tribol. Int. 2019, 129, 363–376. [Google Scholar] [CrossRef]
  2. Zhou, G.; Wu, K.; Pu, W.; Li, P.; Han, Y. Tribological modification of hydrogenated nitrile rubber nanocomposites for water-lubricated bearing of ship stern shaft. Wear 2022, 504–505, 204432. [Google Scholar] [CrossRef]
  3. Etsion, I. Improving Tribological Performance of Mechanical Components by Laser Surface Texturing. Tribol. Lett. 2004, 17, 733–737. [Google Scholar] [CrossRef]
  4. Gropper, D.; Wang, L.; Harvey, T.J. Hydrodynamic lubrication of textured surfaces: A review of modeling techniques and key findings. Tribol. Int. 2016, 94, 509–529. [Google Scholar] [CrossRef]
  5. Wang, W.; He, Y.; Zhao, J.; Mao, J.; Hu, Y.; Luo, J. Optimization of groove texture profile to improve hydrodynamic lubrication performance: Theory and experiments. Friction 2018, 8, 83–94. [Google Scholar] [CrossRef]
  6. Hingawe, N.D.; Bhore, S.P. Tribological performance of a surface textured meso scale air bearing. Ind. Lubr. Tribol. 2019, 72, 599–609. [Google Scholar] [CrossRef]
  7. Chan, C.-W.; Han, Y.-F.; Wang, Z.; Wang, J.; Shi, F.; Wang, N.; Wang, Q.J. Exploration on a Fast EHL Computing Technology for Analyzing Journal Bearings with Engineered Surface Textures. Tribol. Trans. 2014, 57, 206–215. [Google Scholar] [CrossRef]
  8. Shinde, A.; Pawar, P.; Gaikwad, S.; Kapurkar, R.; Parkhe, A. Numerical Analysis of Deterministic Micro-Textures on the Performance of Hydrodynamic Journal Bearing. Mater. Today Proc. 2018, 5, 5999–6008. [Google Scholar] [CrossRef]
  9. Meng, F.M.; Zhang, L.; Liu, Y.; Li, T.T. Effect of compound dimple on tribological performances of journal bearing. Tribol. Int. 2015, 91, 99–110. [Google Scholar] [CrossRef]
  10. Tala-Ighil, N.; Fillon, M.; Maspeyrot, P. Effect of textured area on the performances of a hydrodynamic journal bearing. Tribol. Int. 2011, 44, 211–219. [Google Scholar] [CrossRef]
  11. Arif, M.; Kango, S.; Shukla, D.K. Investigating the effect of different slip zone locations on the lubrication performance of textured journal bearings. Ind. Lubr. Tribol. 2021, 73, 872–881. [Google Scholar] [CrossRef]
  12. Zhang, H.; Hafezi, M.; Dong, G.; Liu, Y. A Design of Coverage Area for Textured Surface of Sliding Journal Bearing Based on Genetic Algorithm. J. Tribol. 2018, 140, 061702. [Google Scholar] [CrossRef]
  13. Zhang, X.; Liu, C.; Zhao, B. An optimization research on groove textures of a journal bearing using particle swarm optimization algorithm. Mech. Ind. 2021, 22, 1. [Google Scholar] [CrossRef]
  14. Jakobsson, B.; Floberg, L. The Finite Journal Bearing, Considering Vaporization; Gumperts Förlag: Mississauga, ON, Canada, 1957. [Google Scholar]
  15. Olsson, K.-O. Cavitation in Dynamically Loaded Bearings; Scandinavian University Press: Oslo, Norway, 1965. [Google Scholar]
  16. Patir, N.; Cheng, H. Application of average flow model to lubrication between rough sliding surfaces. J. Tribol. 1979, 101, 220–229. [Google Scholar] [CrossRef]
  17. Gu, C.; Meng, X.; Xie, Y.; Zhang, D. Mixed lubrication problems in the presence of textures: An efficient solution to the cavitation problem with consideration of roughness effects. Tribol. Int. 2016, 103, 516–528. [Google Scholar] [CrossRef]
  18. Gu, C.; Zhang, D.; Jiang, X.; Meng, X.; Wang, S.; Ju, P.; Liu, J. Mixed EHL Problems: An Efficient Solution to the Fluid–Solid Coupling Problem with Consideration of Elastic Deformation and Cavitation. Lubricants 2022, 10, 311. [Google Scholar] [CrossRef]
  19. Gu, C.; Sheng, X.; Zhang, D.; Meng, X. Thermal mixed elastohydrodynamic lubrication modeling and analysis of the lubricated non-conformal contacts with non-Gaussian surface roughness and coating. Tribol. Int. 2024, 194, 109541. [Google Scholar] [CrossRef]
  20. Woloszynski, T.; Podsiadlo, P.; Stachowiak, G.W. Efficient Solution to the Cavitation Problem in Hydrodynamic Lubrication. Tribol. Lett. 2015, 58, 18. [Google Scholar] [CrossRef]
  21. Patir, N.; Cheng, H. An average flow model for determining effects of three-dimensional roughness on partial hydrodynamic lubrication. J. Tribol. 1978, 100, 12–17. [Google Scholar] [CrossRef]
  22. Wu, C.; Zheng, L. An average Reynolds equation for partial film lubrication with a contact factor. J. Tribol. 1989, 111, 188–191. [Google Scholar] [CrossRef]
  23. Greenwood, J.A.; Tripp, J.H. The Contact of Two Nominally Flat Rough Surfaces. Proc. Inst. Mech. Eng. 1970, 185, 625–633. [Google Scholar] [CrossRef]
  24. Meng, X.; Gu, C.; Xie, Y. Elasto-plastic contact of rough surfaces: A mixed-lubrication model for the textured surface analysis. Meccanica 2016, 52, 1541–1559. [Google Scholar] [CrossRef]
  25. Harigaya, Y.; Suzuki, M.; Toda, F.; Takiguchi, M. Analysis of oil film thickness and heat transfer on a piston ring of a diesel engine: Effect of lubricant viscosity. J. Eng. Gas Turbines Power 2006, 128, 685–693. [Google Scholar] [CrossRef]
  26. Roelands, C.J.A.; Winer, W.O.; Wright, W. Correlational aspects of the viscosity-temperature-pressure relationship of lubricating oils (Dr In dissertation at Technical University of Delft, 1966). J. Tribol. 1971, 93, 209–210. [Google Scholar] [CrossRef]
  27. Dowson, D.; Higginson, G.R. Elastohydrodynamic Lubrication: The Fundamentals of Roller and Geer Lubrication; Pergamon Press: Oxford, UK, 1966. [Google Scholar]
  28. Tomanik, E. Friction and wear bench tests of different engine liner surface finishes. Tribol. Int. 2008, 41, 1032–1038. [Google Scholar] [CrossRef]
  29. Mirjalili, S.; Saremi, S.; Mirjalili, S.M.; Coelho, L.d.S. Multi-objective grey wolf optimizer: A novel algorithm for multi-criterion optimization. Expert Syst. Appl. 2016, 47, 106–119. [Google Scholar] [CrossRef]
  30. Mirjalili, S.; Mirjalili, S.M.; Lewis, A. Grey Wolf Optimizer. Adv. Eng. Softw. 2014, 69, 46–61. [Google Scholar] [CrossRef]
  31. Mirjalili, S.; Gandomi, A.H.; Mirjalili, S.Z.; Saremi, S.; Faris, H.; Mirjalili, S.M. Salp Swarm Algorithm: A bio-inspired optimizer for engineering design problems. Adv. Eng. Softw. 2017, 114, 163–191. [Google Scholar] [CrossRef]
  32. Tang, H.; Ren, Y.; Kumar, A. Optimization tool based on multi-objective adaptive surrogate modeling for surface texture design of slipper bearing in axial piston pump. Alex. Eng. J. 2021, 60, 4483–4503. [Google Scholar] [CrossRef]
  33. Lyu, B.; Jing, L.; Meng, X.; Liu, R. Texture Optimization and Verification for the Thrust Bearing Used in Rotary Compressors Based on a Transient Tribo-Dynamics Model. J. Tribol. 2022, 144, 081801. [Google Scholar] [CrossRef]
  34. Bertocchi, L.; Dini, D.; Giacopini, M.; Fowell, M.T.; Baldini, A. Fluid film lubrication in the presence of cavitation: A mass-conserving two-dimensional formulation for compressible, piezoviscous and non-Newtonian fluids. Tribol. Int. 2013, 67, 61–71. [Google Scholar] [CrossRef]
  35. Ausas, R.F.; Jai, M.; Buscaglia, G.C. A mass-conserving algorithm for dynamical lubrication problems with cavitation. J. Tribol. 2009, 131, 031702. [Google Scholar] [CrossRef]
  36. Gu, C.; Meng, X.; Zhang, D.; Xie, Y. A transient analysis of the textured journal bearing considering micro and macro cavitation during an engine cycle. Proc. Inst. Mech. Eng. Part J J. Eng. Tribol. 2017, 231, 1289–1306. [Google Scholar] [CrossRef]
Figure 1. (a,b) Schematic of a textured journal bearing system; (c) overview of the lubrication regimes.
Lubricants 12 00111 g001
Figure 2. (a) Unfolded schematic of journal bearings with square textures; (b) depth of the texture; (c) schematic of square texture unit.
Lubricants 12 00111 g002
Figure 3. Overview of a multi-objective Pareto front.
Lubricants 12 00111 g003
Figure 4. Flowcharts of texture design and optimization approach.
Lubricants 12 00111 g004
Figure 5. Validation cases: (a) comparison of hydrodynamic pressure results under steady-state conditions and (b) comparison of journal center evolution results under transient-state conditions.
Lubricants 12 00111 g005
Figure 6. The variations in applied load at different speeds: (a) the x component, (b) the y component.
Lubricants 12 00111 g006
Figure 7. Results of untextured journal bearing system at 2000 r p m : (a) journal center position; (b) eccentricity ratio; (c) film thickness ratio. Results of untextured journal bearing system at 4000 r p m : (d) journal center position; (e) eccentricity ratio; (f) film thickness ratio.
Lubricants 12 00111 g007
Figure 8. Non-dominated solutions under different cases: (a) Case 1 ( λ = 9 ); (b) Case 2 ( λ = 6 ); (c) Case 3 ( λ = 3 ). Texture profiles under different cases: (d) Case 1 ( λ = 9 ); (e) Case 2 ( λ = 6 ); (f) Case 3 ( λ = 3 ).
Lubricants 12 00111 g008
Figure 9. Non-dominated solutions under different cases: (a) Case 4 ( λ = 15 ); (b) Case 5 ( λ = 30 ); (c) Case 6 ( λ = 5 ). Texture profiles under different cases: (d) Case 4 ( λ = 15 ); (e) Case 5 ( λ = 30 ); (f) Case 6 ( λ = 5 ).
Lubricants 12 00111 g009
Figure 10. Comparison of simulation results for untextured and textured journal bearing systems at the speed of 2000 r p m : (a) minimum oil film thickness; (b) viscous friction and asperity contact friction; (c) total friction; (d) energy loss.
Lubricants 12 00111 g010
Figure 11. Comparison of simulation results for untextured and textured journal bearing systems at the speed of 4000 r p m : (a) minimum oil film thickness; (b) viscous friction and asperity contact friction; (c) total friction; (d) energy loss.
Lubricants 12 00111 g011
Table 1. Material properties and surface topography parameters of the journal and bearing.
ParametersValue
Journal   elastic   modulus / E 1 200   G P a
Bearing   elastic   modulus / E 2 65   G P a
Journal   Poisson s   ratio / μ 1 0.3
Bearing   Poisson s   ratio / μ 2 0.3
Surface   roughness   of   journal / σ 1 0.36   μ m
Surface   roughness   of   bearing / σ 2 0.407   μ m
η 0.04394   μ m 2
β 5.9874   μ m
η β σ 0.1430
Table 2. Geometric and operating parameters.
ParametersValue
Bearing   circumference / L 170   m m
Bearing   width / B 16   m m
Bearing   radial   clearance / C 40   μ m
Journal   mass / M j o u r 3.2   k g
Lubricant   temperature / T 80   ° C
Rotational   speed   of   the   journal / U 2000   r p m ,   4000   r p m
Table 3. Load-carrying capacity and friction results of the untextured journal bearing system at different journal center positions.
SpeedType Journal   Center   Position   ( X c , Y c ) L C C (N) F r i c t i o n (N)
Case 1   ( λ = 9 )(0.87287, 0.0898)1713.44010.937
2000   r p m Case 2   ( λ = 6 )(0.91307, 0.10068)3338.53313.369
Case 3   ( λ = 3 )(0.72001, 0.63188)9298.23823.432
Case 4   ( λ = 15 )(0.74153, −0.27986)1377.17716.666
4000   r p m Case 5   ( λ = 30 )(0.39056, −0.44479)371.48612.484
Case 6   ( λ = 5 )(0.76242, 0.53588)8851.23131.765
Disclaimer/Publisher’s Note: The statements, opinions and data contained in all publications are solely those of the individual author(s) and contributor(s) and not of MDPI and/or the editor(s). MDPI and/or the editor(s) disclaim responsibility for any injury to people or property resulting from any ideas, methods, instructions or products referred to in the content.

