Article

Stability Analysis of the Output Speed in a Hydraulic System Powered by an Inverter-Fed Motor

1
School of Intelligent Manufacturing, Long Dong University, Qingyang 745000, China
2
School of Mechanical and Electronic Engineering, Xi’an University of Architecture and Technology, Xi’an 710055, China
*
Author to whom correspondence should be addressed.
Lubricants 2024, 12(3), 64; https://doi.org/10.3390/lubricants12030064
Submission received: 4 January 2024 / Revised: 9 February 2024 / Accepted: 17 February 2024 / Published: 21 February 2024

Abstract

:
The stability of the output speed of a hydraulic system has a great influence on the working performance of hydraulic equipment. It changes with the system working conditions. The increase in leakage caused by the wear of the hydraulic kinematic pair and the slip of the motor lead to the instability of the output speed. Although the hydraulic system can satisfy the output requirements of the active control scheme with ex ante decision making or the passive feedback control strategy with ex post compensation, it also causes an increase in system complexity and manufacturing cost. The speed stiffness as a basic characteristic of the output of the hydraulic system has not been sufficiently investigated and evaluated. In this paper, the IFMDH (inverter-fed, motor-driven hydraulic) system is taken as the object, and the coupling relationship of each link of the system is revealed by mathematical modelling. The reliability of the model is verified under a wide range of speed and load variations in combination with experiments. By redefining the speed stiffness quantification method, the effects of load conditions, motor stiffness, and speed ratio at the output end on the speed stability of the system are discussed in conjunction with the system coupling mechanism model. The conclusions show that the motor stiffness and the addition of a speed reducer have a significant effect on the system speed stiffness, where changing the output speed ratio has a significant effect on the speed stiffness. The conclusions of the study provide technical support for the rapid design, selection, and system optimisation of hydraulic systems in common scenarios.

1. Introduction

The advancement of hydraulic transmission technology has significantly contributed to enhancing human productivity. The electromechanical hydraulic system has undergone the growth of various control technologies, including throttling speed control, load-sensitive control, variable displacement control, variable speed control, composite speed control, an asymmetric system, etc. [1,2,3,4,5]. Consequently, the system performance and efficiency have considerably improved. In particular, the advancement of direct pump control technology utilising an inverter-fed motor as its core allows for the energy regulation of an electromechanical hydraulic system to shift from process control to power output control. This facilitates a system energy supply on demand, preventing throttling losses. The IFMDH (inverter-fed, motor-driven hydraulic) systems, as a representative of direct pump control technology, are gaining increasing attention due to their energy-saving and environmentally friendly features, compact design, high power output, and easy controllability. As a result, they are now widely used in a variety of industrial [6,7] and agricultural equipment [8,9], such as continuous mining machines, shield machines, tunnelling machines, soybean combine harvesters, agricultural machinery walking chassis, etc.
The transmission of an IFMDH system involves various forms of physical field coupling. The nonlinear coupling between physical fields of the same and different types is intricate and closely linked, creating a ‘butterfly effect’ scenario [10]. To guarantee the stability of the output speed of the system, it is crucial to assess the performance of the IFMDH system. The output speed stability of the IFMDH system is influenced by different factors, including system leakage caused by the wear of kinematic pairs, motor slip rate, fluid elastic deformation, and flexible couplings. Mechanical transmission systems do not face similar challenges. These factors often lead to a loss of flow variables during the transmission.
The energy efficiency features of the IFMDH system are intricately connected to its dynamic behaviours. The dynamic of the IFMDH system undergoes changes because of the energy state adjustments in each physical field, causing variations in its behaviour when operating conditions are variable. This is demonstrated through subsystem power flow convergence, spillover, and dissipation [11]. In the pursuit of investigating the coupling mechanism of the hydraulic system and output speed stability, researchers from domestic and international institutions have carried out extensive studies, yielding productive results.
To accurately predict or control the system behaviour and to grasp the coupling relationship of each link, accurate mathematical modelling of the operation process of the electromechanical–hydraulic system is required [12,13]. Current mathematical models of systems and their key components can be categorised according to their basic principles: numerical fitting models, analytical models, and mechanistic models. Numerical fitting models and analytical models are wholly or partly based on the approximate fitting of specific forms of equations to describe the loss characteristics of components, which cannot fully reveal the deep system operation mechanism. Mechanistic models reveal more about the causal relationship of the system dynamics behaviour, which is significant for studying the system dynamics behaviour and improving the system characteristics. However, due to the problems of large model error, an unclear mechanism of nonlinear parameter change, numerous system parameters that mostly rely on empirical acquisition, and a slow model solution speed, the modelling process is complicated and difficult, which leads to the limitation of the application and promotion of mechanistic models.
Jeong [14] provided a mathematic description of the first-principle-based characteristics of different nonlinear losses in piston hydraulic motors. Geng [15] described the nonlinear characteristics of the hydraulic components based on the first principle description and discussed the influence of the mechanical characteristics of load on the nonlinear dynamics of the system. Kumar et al. [16] explored how the system performs regarding energy efficiency and dynamic features during the unloading and intermittent operation of hydraulic pumps. And, the dynamic performance and energy efficiency of the hydraulic drive system are compared. Vaezi et al. [17] investigated the nonlinear characteristics of electromagnetic proportional valves in wind turbine drive systems over a wide range of operating voltages, and, based on a segmented affine system, segmentation and parameter identification of the system were carried out in conjunction with experiments. Sun et al. [18] assessed the impact of random fluctuating loads on the output speed of hydraulic top drives in oil hydraulic drilling rigs, achieving stable control of the system output speed through electrohydraulic proportional control. Although the above literature well explains the mechanism of the flow loss of the system or hydraulic components, it does not propose a method for evaluating the speed change.
Zhao et al. [19] pointed out that the mismatch between the load characteristics and the drive mode is the main reason for the inefficiency of the system through modelling and experiments. Gu et al. [10] enhanced the online identification technique of kinetic stiffness graphical representation by examining the relationship between internal and external characteristics of speed fluctuations in the electromechanical–hydraulic system. They also discussed the inter-coupling relationship between electromechanical–hydraulic systems. Kumar investigated the steady-state performance [20] and dynamic characteristics [21] of a closed hydraulic multi-pump drive system for two different modes of operation, a single-motor drive and dual-motor drive, through modelling and experimentation. Meanwhile, Gu et al. [22] explored the issue of speed stiffness in hydraulic machine milling systems, identifying a quadratic connection between variations in the pressure motor’s displacement and the volumetric speed control circuit’s speed stiffness. Xu [23] presented a theory for measuring the volume loss of piston pumps, accounting for lubrication clearance. Furthermore, they explored the non-linear correlation between the displacement and efficiency of the pumps.
In the IFMDH system, the speed of the system varies with load conditions due to the influence of motor slip, hydraulic element leakage, and other factors. Whether it is the active control scheme of pre-decision-making or the passive feedback control strategy of post-compensation [24], the control purpose is achieved by eliminating the control error. Different control schemes improve the output state by compensating for the system input in real time, and the output speed of the control system achieves the expected goal, which also causes an increase in system complexity and manufacturing cost. Therefore, without the help of various control methods, improving the stability of the system output speed by optimising the system configuration will greatly improve the reliability and economy of the system. As the basic attribute of evaluating the output of a hydraulic system, speed stiffness has not been paid enough attention. How to improve the speed stiffness of the system is also an urgent problem to be solved. In this paper, the modelling of the IFMDH system is the main topic, focusing on the analysis of the influence of system configuration, electric motor characteristics, and load conditions on the output speed stiffness of the hydraulic system.

2. System Introduction

The core components of the hydraulic system that realise the system functions include the inverter for speed control, the inverter motor for electromechanical coupling, the hydraulic pump and hydraulic motor that provide the interfaces for machine–hydraulic coupling and hydraulic–machine coupling, and the load components. In order to more accurately describe the system dynamic characteristics of the causal relationship, in addition to the motor, pump, and motor involved in the energy domain conversion of the functional interface, the links of the connection interface on the system dynamic characteristics of the impact also need to be considered. The coupling relationship of each link is shown in Figure 1. The two couplings and a section of hydraulic piping are used to achieve mechanical power and hydraulic power connection and transfer, respectively.
In the system composed of functional parts and interface components, the functional parts (which provide the coupling interface of different energy domains) are characterised by realising the coupling of energy from different energy domains, such as the conversion of electrical energy into mechanical energy and the conversion of mechanical energy into hydraulic energy. The functional coupling interfaces can cause losses in the transmission of system flow variables due to the presence of slip, leakage, etc. The interface element mainly realises the energy transfer; due to the elastic deformation of the elastic element contained therein, it will play the role of storage and buffer for the transfer of flow variables.

3. Mathematic Description of the IFMDH System

The inverter-fed motor as a system power source and its dynamic characteristics and speed stiffness on the output speed of the IFMDH system have the most direct impact. The motor torque characteristic equation is derived from the asynchronous motor operating state equation as Equation (1) [25]:
T e = m n p 2 π f s U s 2 R r / S [ ( R s + R r S ) 2 + ( X l s + X l r ) 2 ]
where m is the number of phases, n p is the number of pole pairs, U s is the stator voltage, f S is the synchronous frequency, R S is the stator resistance, R r is the rotor resistance, X l s is the stator leakage inductance, X l r is the rotor leakage reactance, and S is the slip ratio. This equation describes the quantitative relationship between the output speed of an ideal inverter motor and the load torque when the alternating frequency and voltage of the power supply are determined.
The actual dynamic of the inverter-fed motor is affected by inertia, damping, etc. The output shaft of the inverter-fed motor is connected to the coupling to satisfy the power balance relationship of Equation (2):
T e = J e ω ˙ e + B e ω e + K P ( ω e d t ω p d t )
where T e is the actual output torque of the motor, J e is the rotational inertia of the motor, ω e is the instantaneous rotational angular speed of the motor, B e is the motor damping, K P is the elasticity coefficient of the elastic coupling between the motor and the pump, and ω p is the instantaneous rotational speed of the pump. The equation ω e d t ω p d t represents the cumulative angular difference between the motor output shaft and the hydraulic pump input shaft, i.e., the real-time deformation of the elastic coupling on the motor side.
Equation (3) describes the dynamic behaviour of the mechanical transmission part of the hydraulic pump during operation.
K P ( ω e d t ω p d t ) = J p ω ˙ p + B p ω p + D p P
where J p is the pump moment of inertia, B p is the pump rotational damping, i.e., the mechanical loss coefficient associated with the speed, D p is the pump displacement, and P is the system pressure. The left side of the equation shows the torque output from the motor-side coupling, and the right side shows the dynamics of the hydraulic pump.
Equation (4) describes the dynamic behaviour of the mechanical transmission part of the hydraulic motor during operation.
D m P = J m ω ˙ m + B m ω m + K m ( ω m d t ω T d t )
where D m is the motor displacement, J m is the motor moment of inertia, ω m is the instantaneous rotation angular speed of the motor, K m is the elasticity coefficient of the coupling between the motor and the load, and ω T is the instantaneous rotation angular speed of the load. ω m d t ω T d t represents the cumulative angular difference between the output shaft of the hydraulic motor and the load shaft, i.e., the real-time deformation of the elastic coupling on the load side. The left side of the equation shows the theoretical torque of the hydraulic motor and the right side shows the dynamic process of the hydraulic motor.
The dynamics of the system load can be described by Equation (5).
K m ( ω m d t ω T d t ) = J T ω ˙ T + B T ω T + T l
where J T is the load rotational inertia, B T is the load rotational damping, and Tl is the load torque. The left side of the equation shows the real-time output torque of the load-side coupling, and the right side shows the dynamics of the load motion.
The flow equation for a hydraulic pump can be written as follows.
D p ω p = Q p + G 1 ω p + C w p ω p + C p p P + C p ( ω p , P )
The left side of Equation (6) is the theoretical flow of the pump, and the first term Q p on the right side is the actual flow of the pump. The second term is the flow loss due to compression of the piston pump, and G 1 = z p V p ( 1 1 e P 0 P 1 E d p ) 2 π is the compression loss coefficient [26,27]. The third and fourth terms are the flow loss due to pump speed and pressure, and C w p and C p p are the coefficients of piston pump flow loss related to speed and pressure, respectively. C p ( ω p , P ) is the test flow correction.
The flow equation for a hydraulic motor is shown as Equation (7).
D m ω m = Q m C w m ω p C p m P C m ( ω m , P )
The left side of Equation (7) is the theoretical displacement of the motor, and the first term Q m on the right side of the equation is the actual flow of the pump. The second and third terms are the flow loss due to piston pump speed and pressure, respectively, and C w m and C p m are the coefficients of piston pump flow loss with respect to speed and pressure, respectively. C m ( ω m , P ) is the test flow correction of the hydraulic motor.
Equation (8) is the flow equation of the hydraulic pipe.
Q p = Q m + G 2 P ˙
where G 2 = V p E ef is the compression loss coefficient, which describes the change in line hydraulic fluid volume due to changes in line pressure [26]. Equations (6)–(8) are combined to obtain Equation (9) as follows.
( D p G 1 C ω p ) ω p = ( D m + C ω m ) ω m + ( C p m + C p p ) P + G 2 P ˙ + C m + C p
Equations (2)–(5) and (9) constitute the state equations of the system. The damping of each link of the system, as well as the flow correction coefficient C m and C p , change weakly with the operating conditions. Considering the simplified model, due to the small variation in damping and flow correction coefficients with operating conditions, they are interpreted as constants, and their effects on the system dynamics are not considered for the time being. Laplace transformations are performed for (2)~(5) and (9), respectively.
T e = J e ω e s + B e ω e + K p s ( ω e ω p )
K p s ( ω e ω p ) = J p ω p s + B p ω p + D P P
D m P = J m ω m s + B m ω m + K m s ( ω m ω T )
K m s ( ω m ω T ) = J T ω T s + B T ω T + T l
( D p G 1 C ω p ) ω p = ( D m + C ω m ) ω m + ( C p m + C p p ) P + G 2 P s + C m + C p s
Rearranging Equations (10)–(14) according to the law of cause and effect results in
ω e = H 11 ω p + H 12 T e
ω p = H 21 ω e H 22 P
ω m = H 31 ω T + H 32 P
ω T = H 41 ω m H 42 T l
P = H 51 ω p H 52 ω m H 53 ( C m + C p )
where H 11 = K p J e s 2 + B e s + K p , H 12 = s J e s 2 + B e s + K p ;
H 21 = K p J p s 2 + B p s + K p , H 22 = D p s J p s 2 + B p s + K p ;
H 31 = K m J m s 2 + B m s + K m , H 32 = D m s J m s 2 + B m s + K m ;
H 41 = K m J T s 2 + B T s + K m , H 42 = s J T s 2 + B T s + K m ;
H 51 = D p G 1 C ω p G 2 s + C p m + C p p , H 52 = D m + C ω m G 2 s + C p m + C p p , H 53 = 1 G 2 s 2 + ( C p m + C p p ) s .
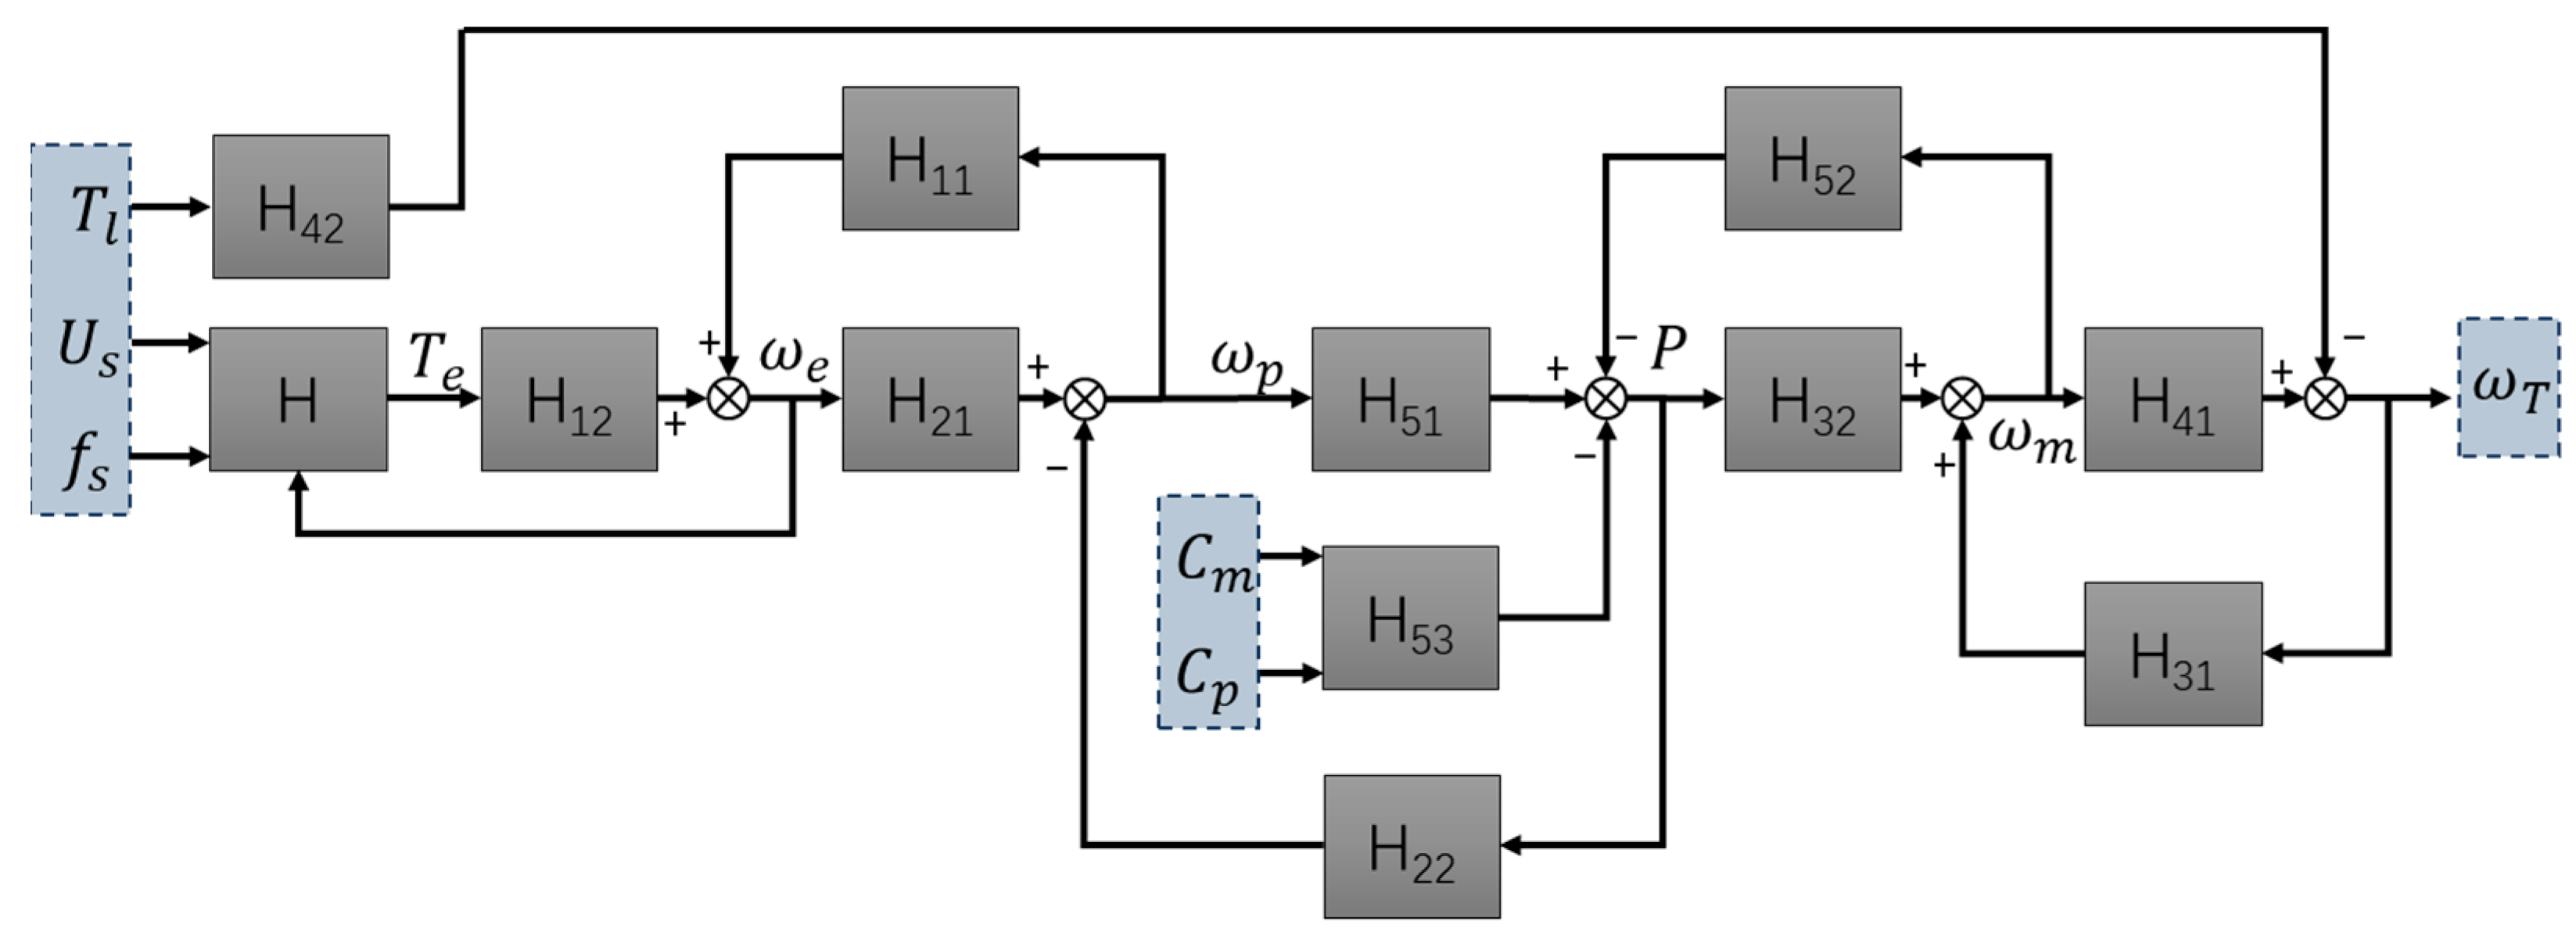
Observing Equations (15)–(19), the system variables interact with each other. The coupling relationship is complex, where each variable, through the characterisation of the system-specific transfer function H i j , affects other parameters and is affected by the role of other parameters of the system. In accordance with (1), (15)–(19) described in the interactions between the variables, this can be due to the coupling relationship between the various parts of the IFMDH system as shown in Figure 2.
Since the motor output torque T e and speed ω e relationship is also subject to the Equation (1) (asynchronous motor torque characteristics) constraints, a system block diagram with H is used to indicate the constraint relationship. The above model is the mathematical model of the IFMDH system. The inputs to the system include supply voltage U s , supply operating frequency f s , and load torque T l , and the flow correction coefficients C m and C p depend on the operating conditions of the system. The output is the load speed ω T . The system shown in Figure 2 is a typical multi-input, single-output system. When the parameters of the system are determined, given the power supply voltage and frequency, the output dynamic and steady-state characteristics of the system are shown by the speed change of the external load, which is consistent with the actual situation of the research object.
Observing the transfer function of each link, there are time-varying parameters in the mechanical and hydraulic coupling link, which are affected by the working conditions, and it is necessary to update the time-varying parameters in real time according to the real-time working conditions of the system during the simulation process.

4. Parameter Identification

The accumulation of time in the use of hydraulic components causes the degradation of their performance. Microscopically, this is manifested in the wear of the motion pairs, which leads to an increase in the motion gap and an increase in leakage. In serious cases, it may even cause functional failure of the components. The amount of leakage at the coupling interface is influenced by the operating conditions. The actual flow of piston pumps and piston motors is closely related to the system pressure and speed. Therefore, it is necessary to experimentally determine the flow loss coefficients and flow correction coefficients in piston pumps and hydraulic motors. The flow characteristics of the piston pumps and motors in the model object are measured by tests.
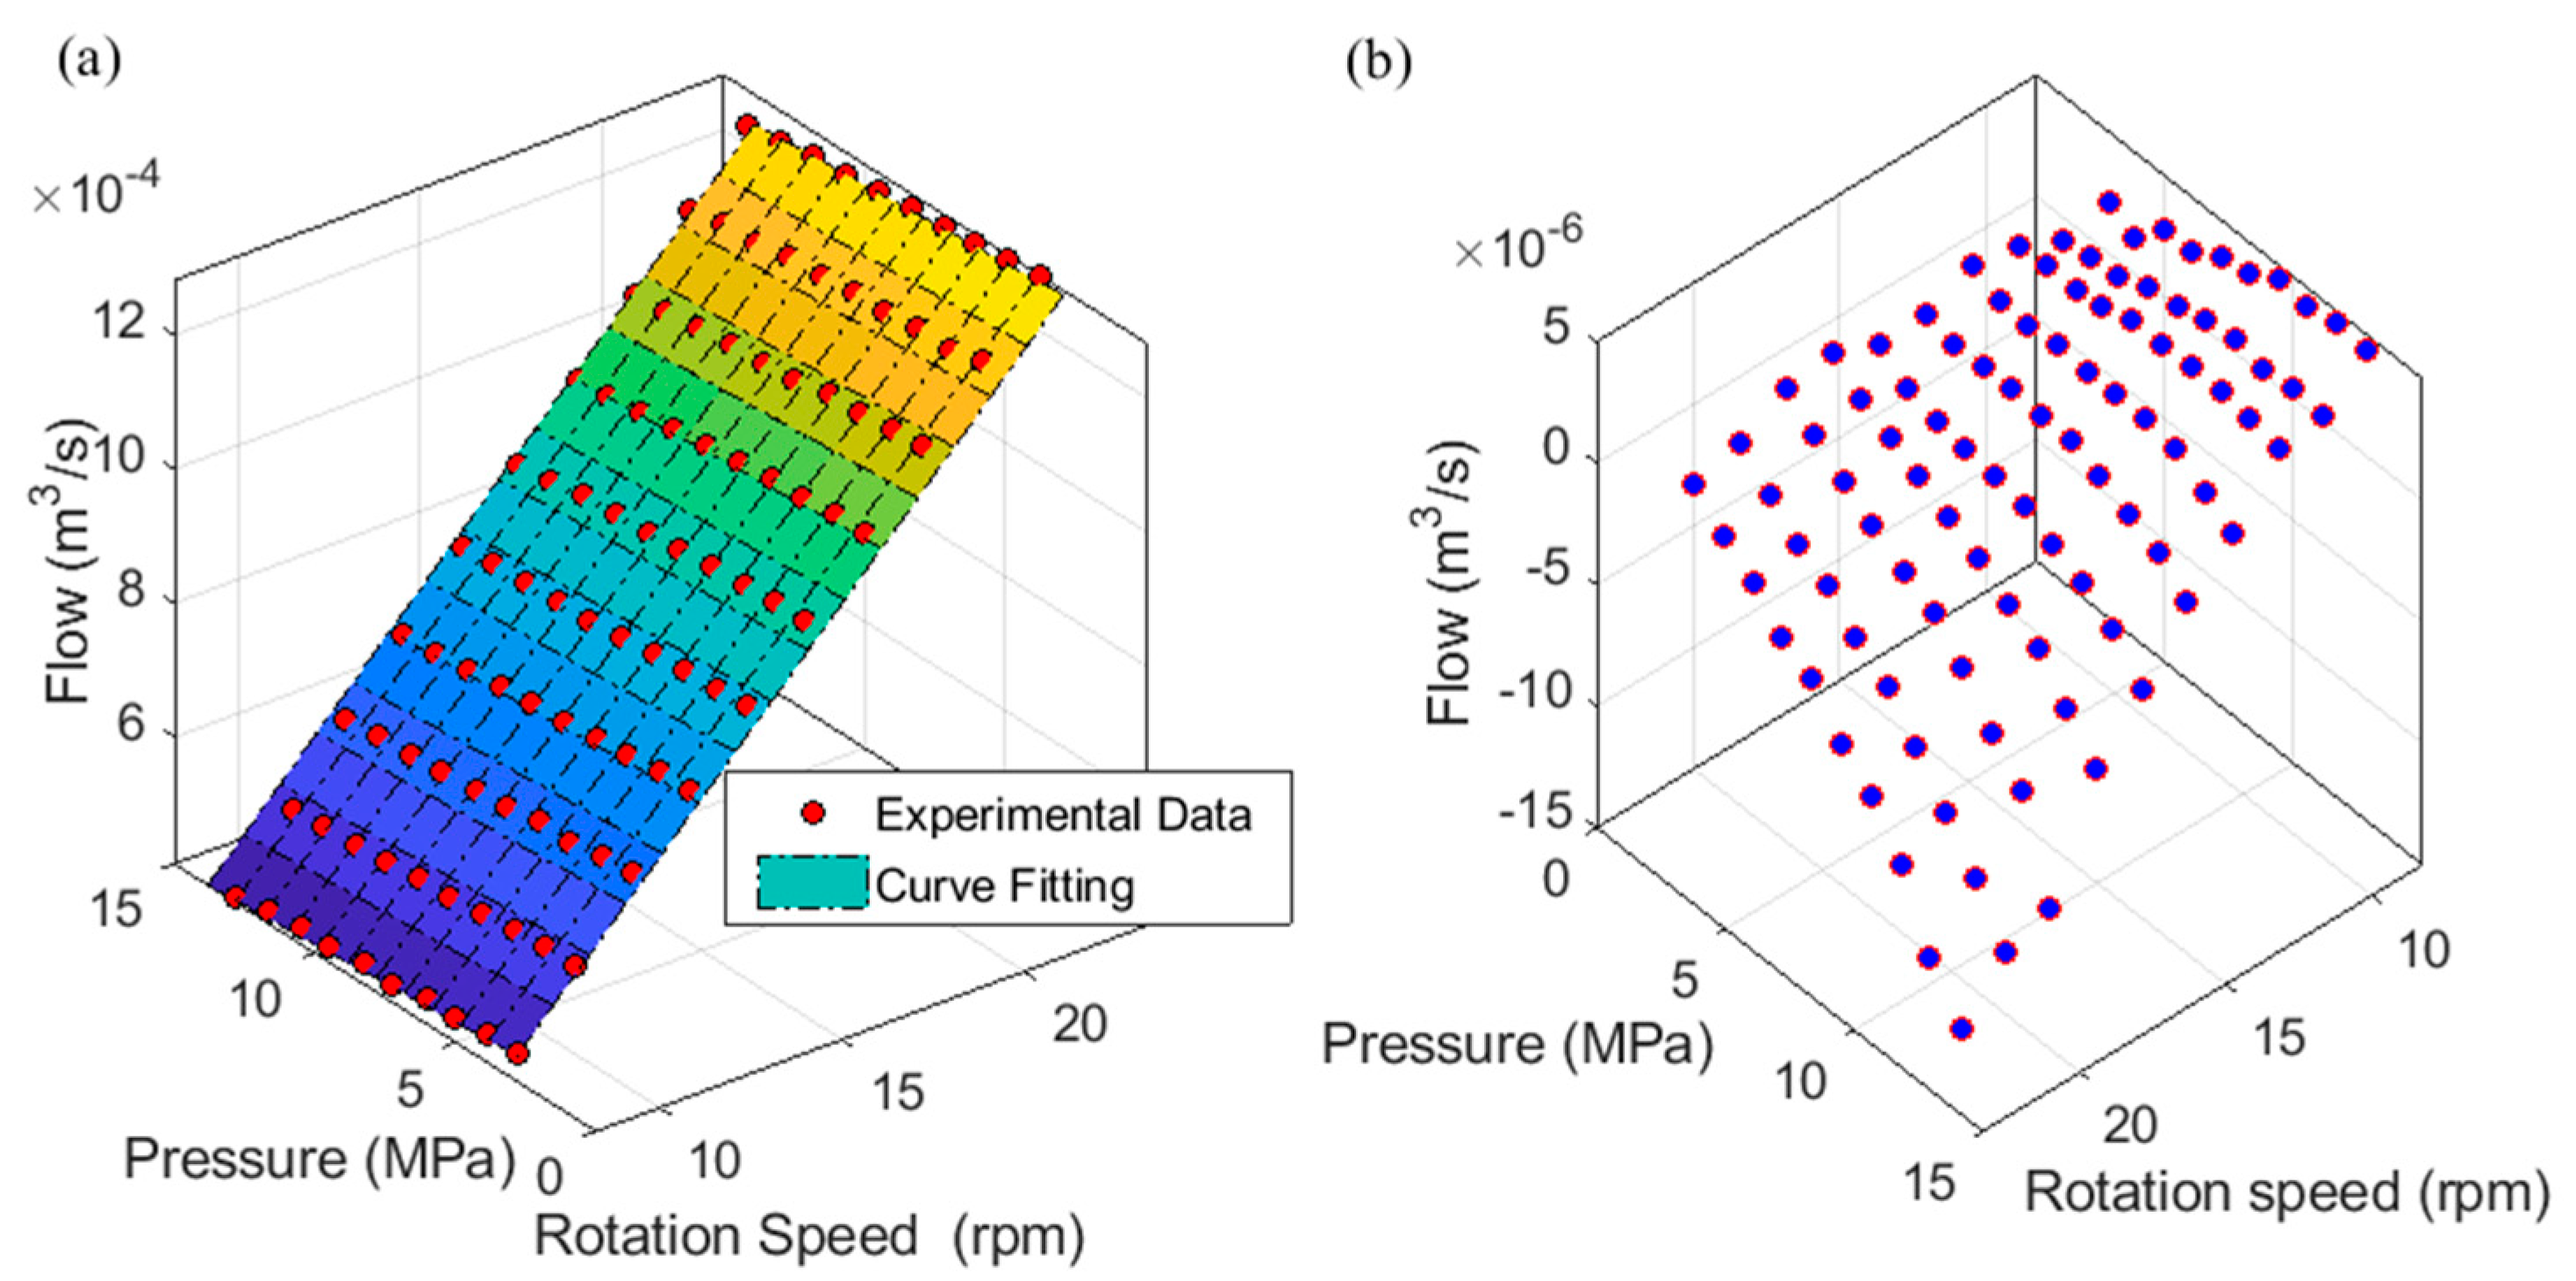
In order to achieve the identification of the key node parameters, according to the piston pump flow in Equation (6), a test is designed to identify the parameters of the equation. The least squares method is used to solve the optimal fitting of the speed- and pressure-related flow loss coefficients C ω p and C p p , and the flow correction coefficients C p are also calculated. Figure 3a shows the comparison of the fitted planes of the flow of the piston pump obtained by the least squares method and the test data, and Figure 3b shows the flow correction coefficients, i.e., the residuals of the fitted results and the test results.
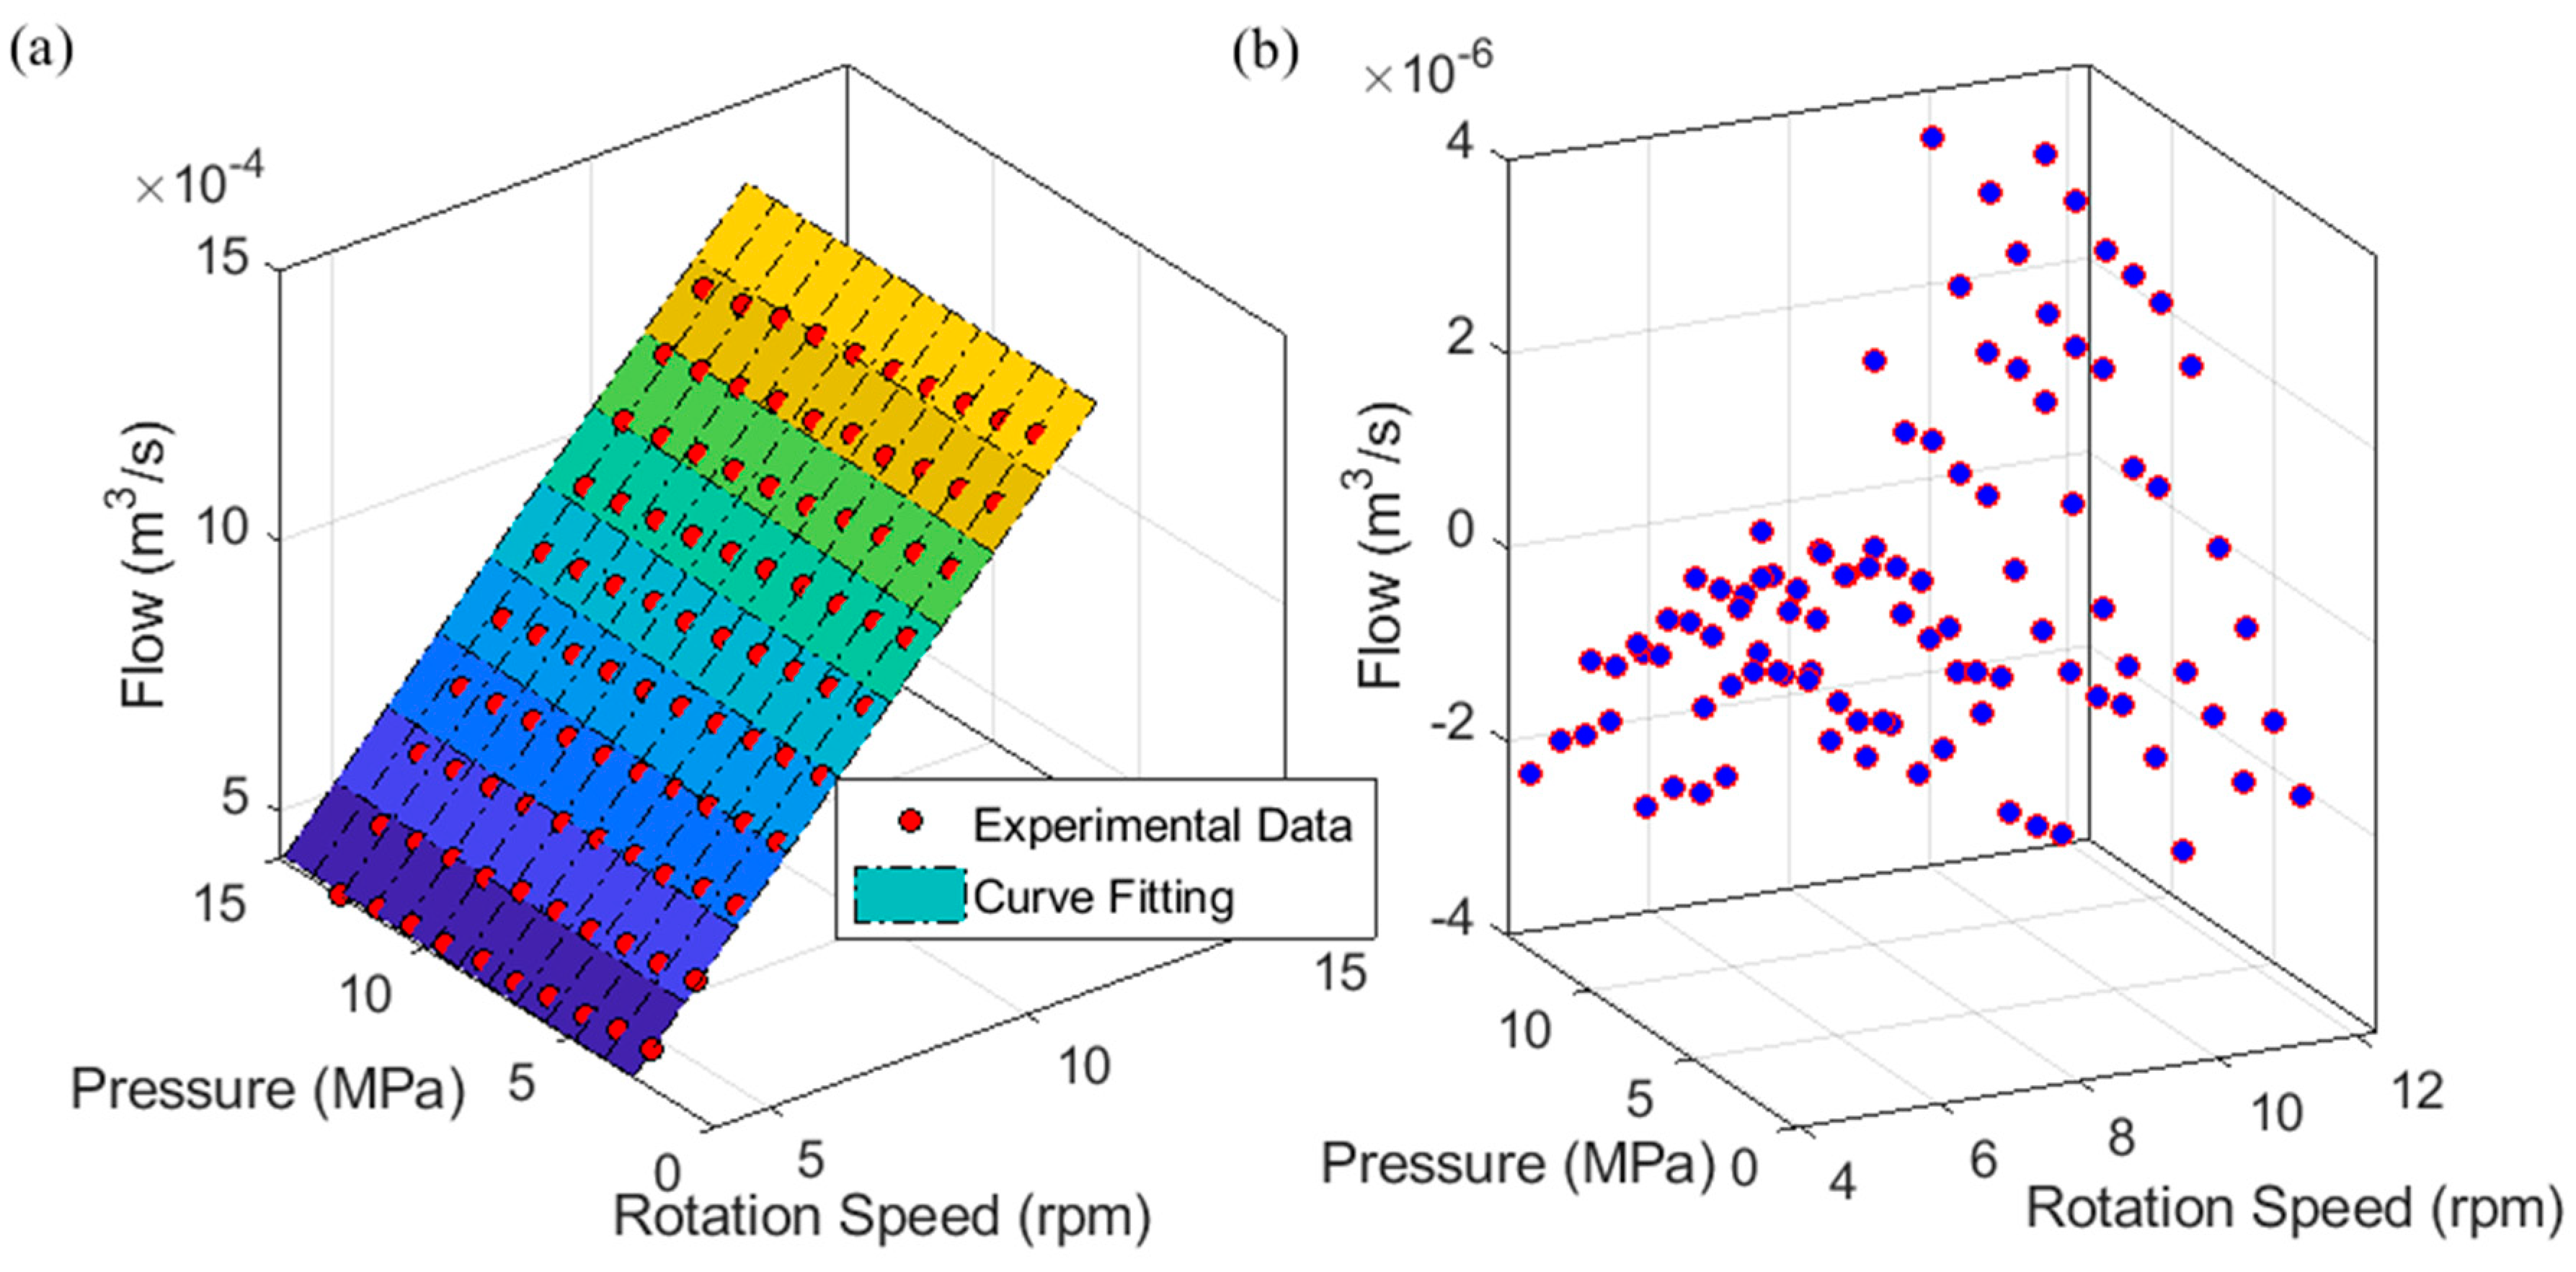
Similarly, the critical parameters of the hydraulic motor are identified based on the flow in Equation (7) and the identification results are shown in Figure 4. The corresponding identification results are given in Table 1. According to the test results, the system pressure and flow are not independent changes, and the system speed increase will cause the system pressure to increase. At the same time, the system pressure becomes larger, which will cause the output speed to decrease. The coupling relationship of the hydraulic part is complex, in accordance with the relationship described in Figure 2.

5. Simulation and Experimental Verification

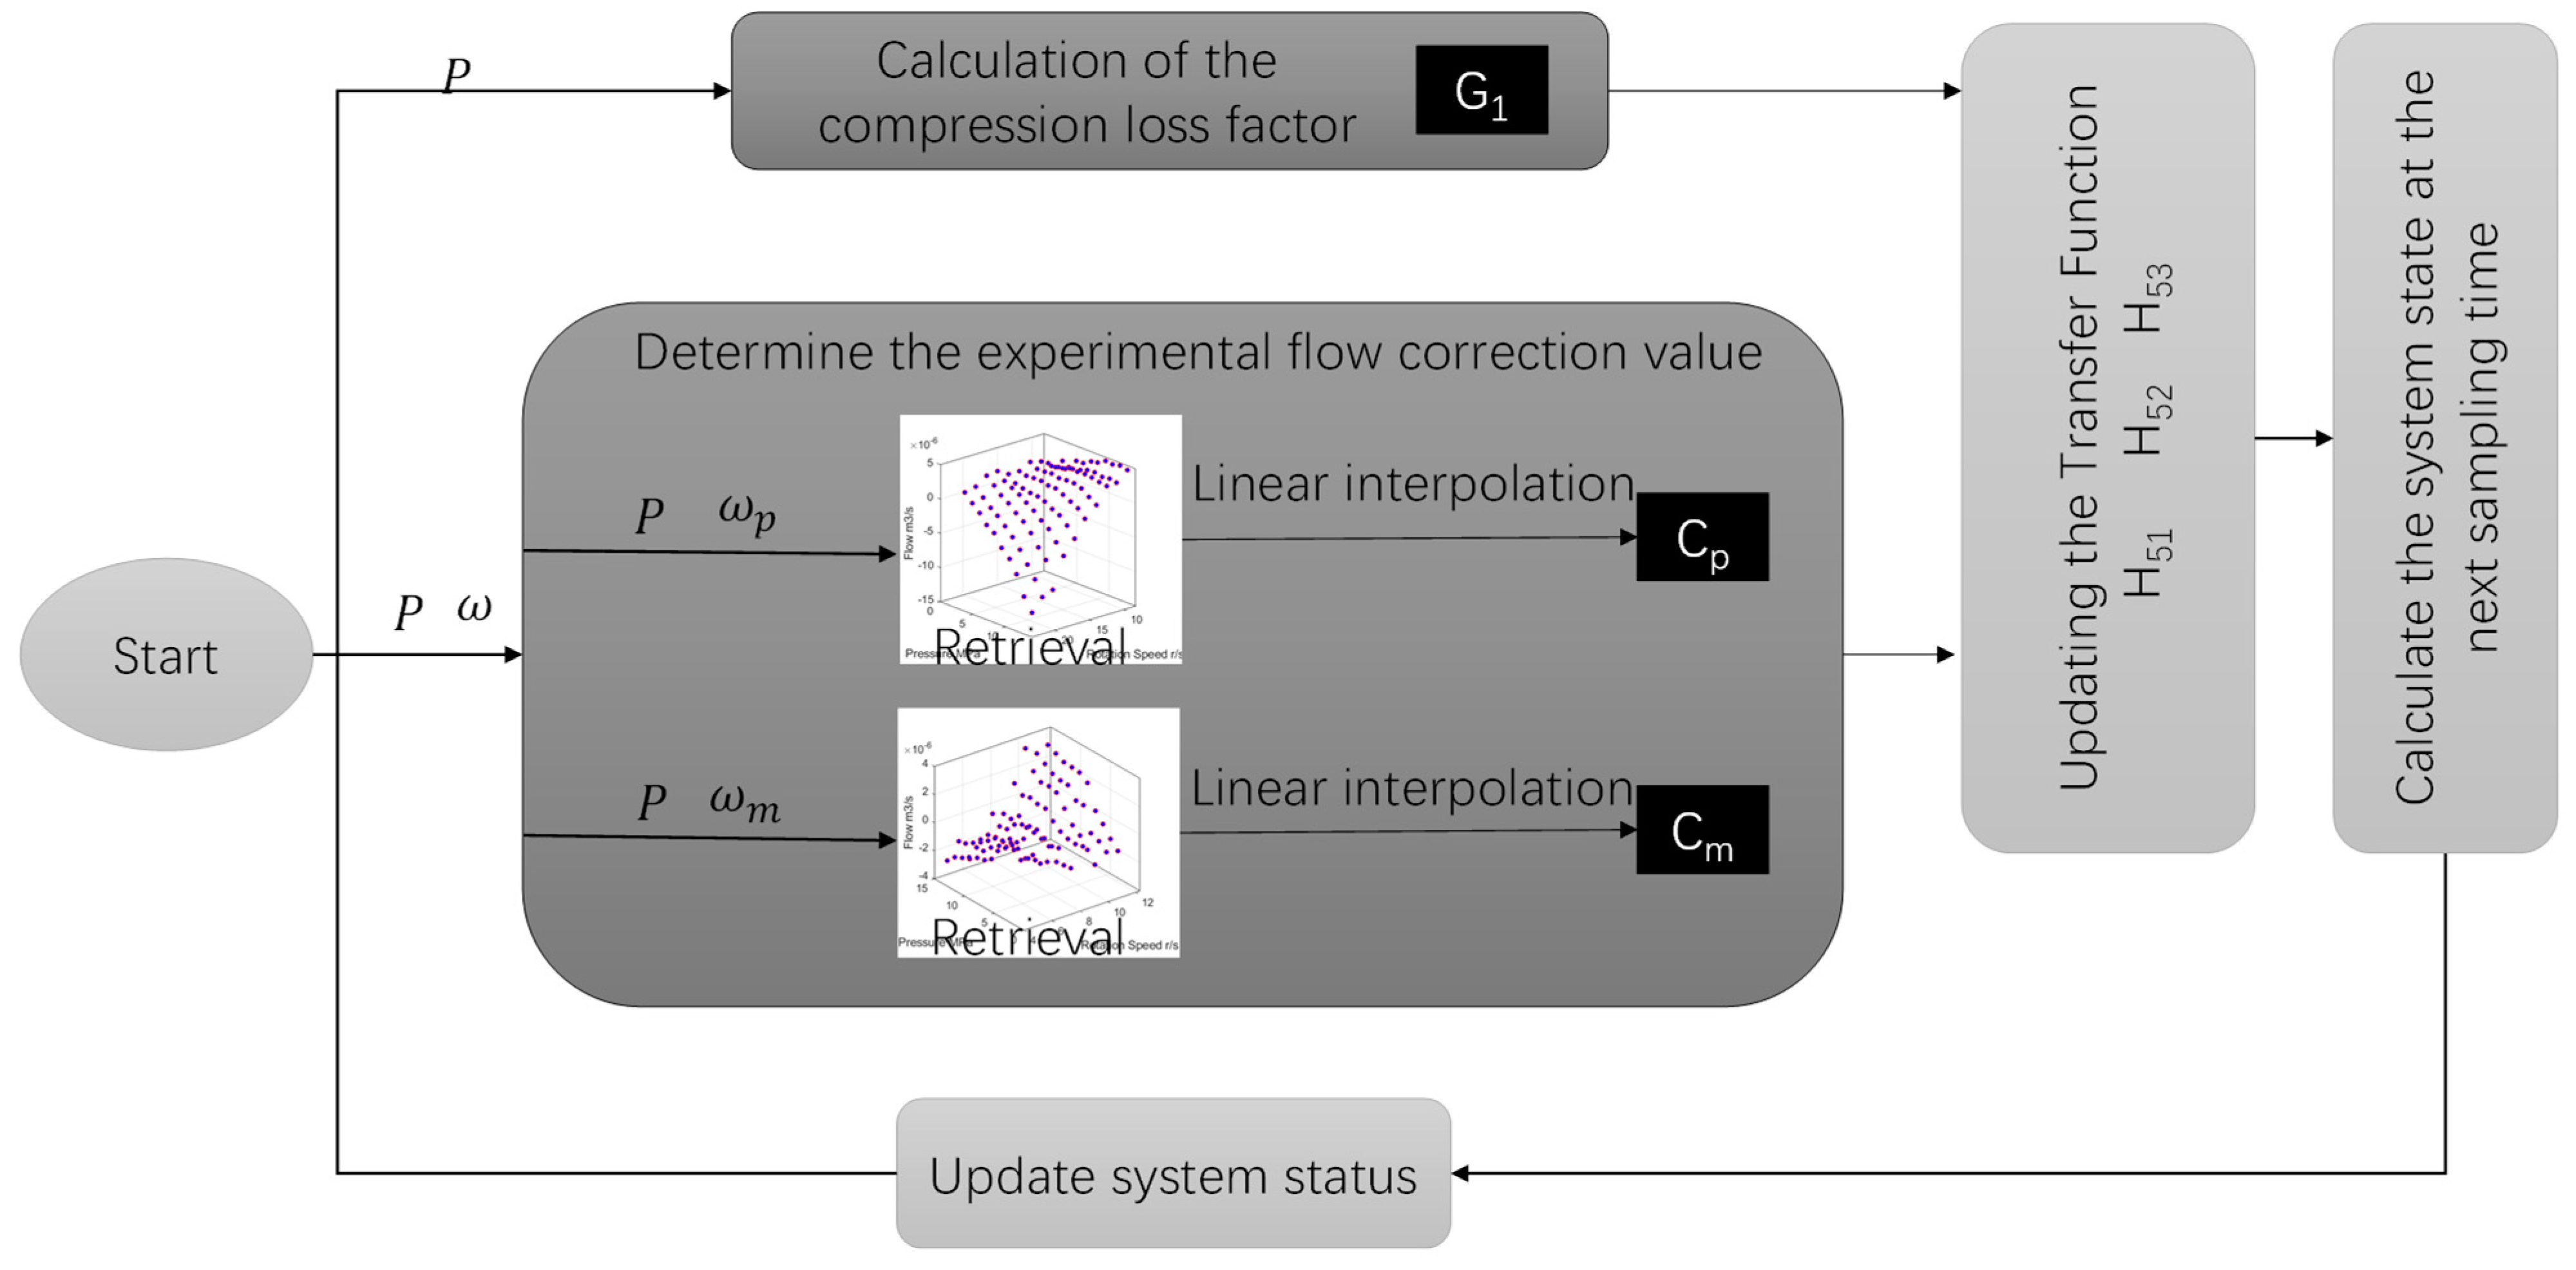
The simulation of the experiments of the system is carried out based on the results of the system parameter identification in Section 3 and the mathematical model in Section 2. All calculations and simulations in this paper are completed in MATLAB version R2018a and the corresponding Simulink. The main parameters are shown in Table 2. It should be noted that, during the simulation, Equations (15)–(18) can be realised directly by the Transfer Fcn module for each link dynamic. For the non-linear link present in Equation (19), the S-function module is used to realise its function, and the specific flow is shown in Figure 5.
During the simulation, there are time-varying parameters controlled by the system state variables in the transfer functions H51, H52, and H53, and the inputs of the link H53, which need to be updated in real time according to the system state. By the S-function module, the system state variables are acquired in real time, the system state variables are used as the retrieval and calculation criteria for the relevant time-varying parameters, and the time-varying parameters in the system are updated in each calculation cycle according to the flow shown in Figure 5 before participating in the simulation calculation.
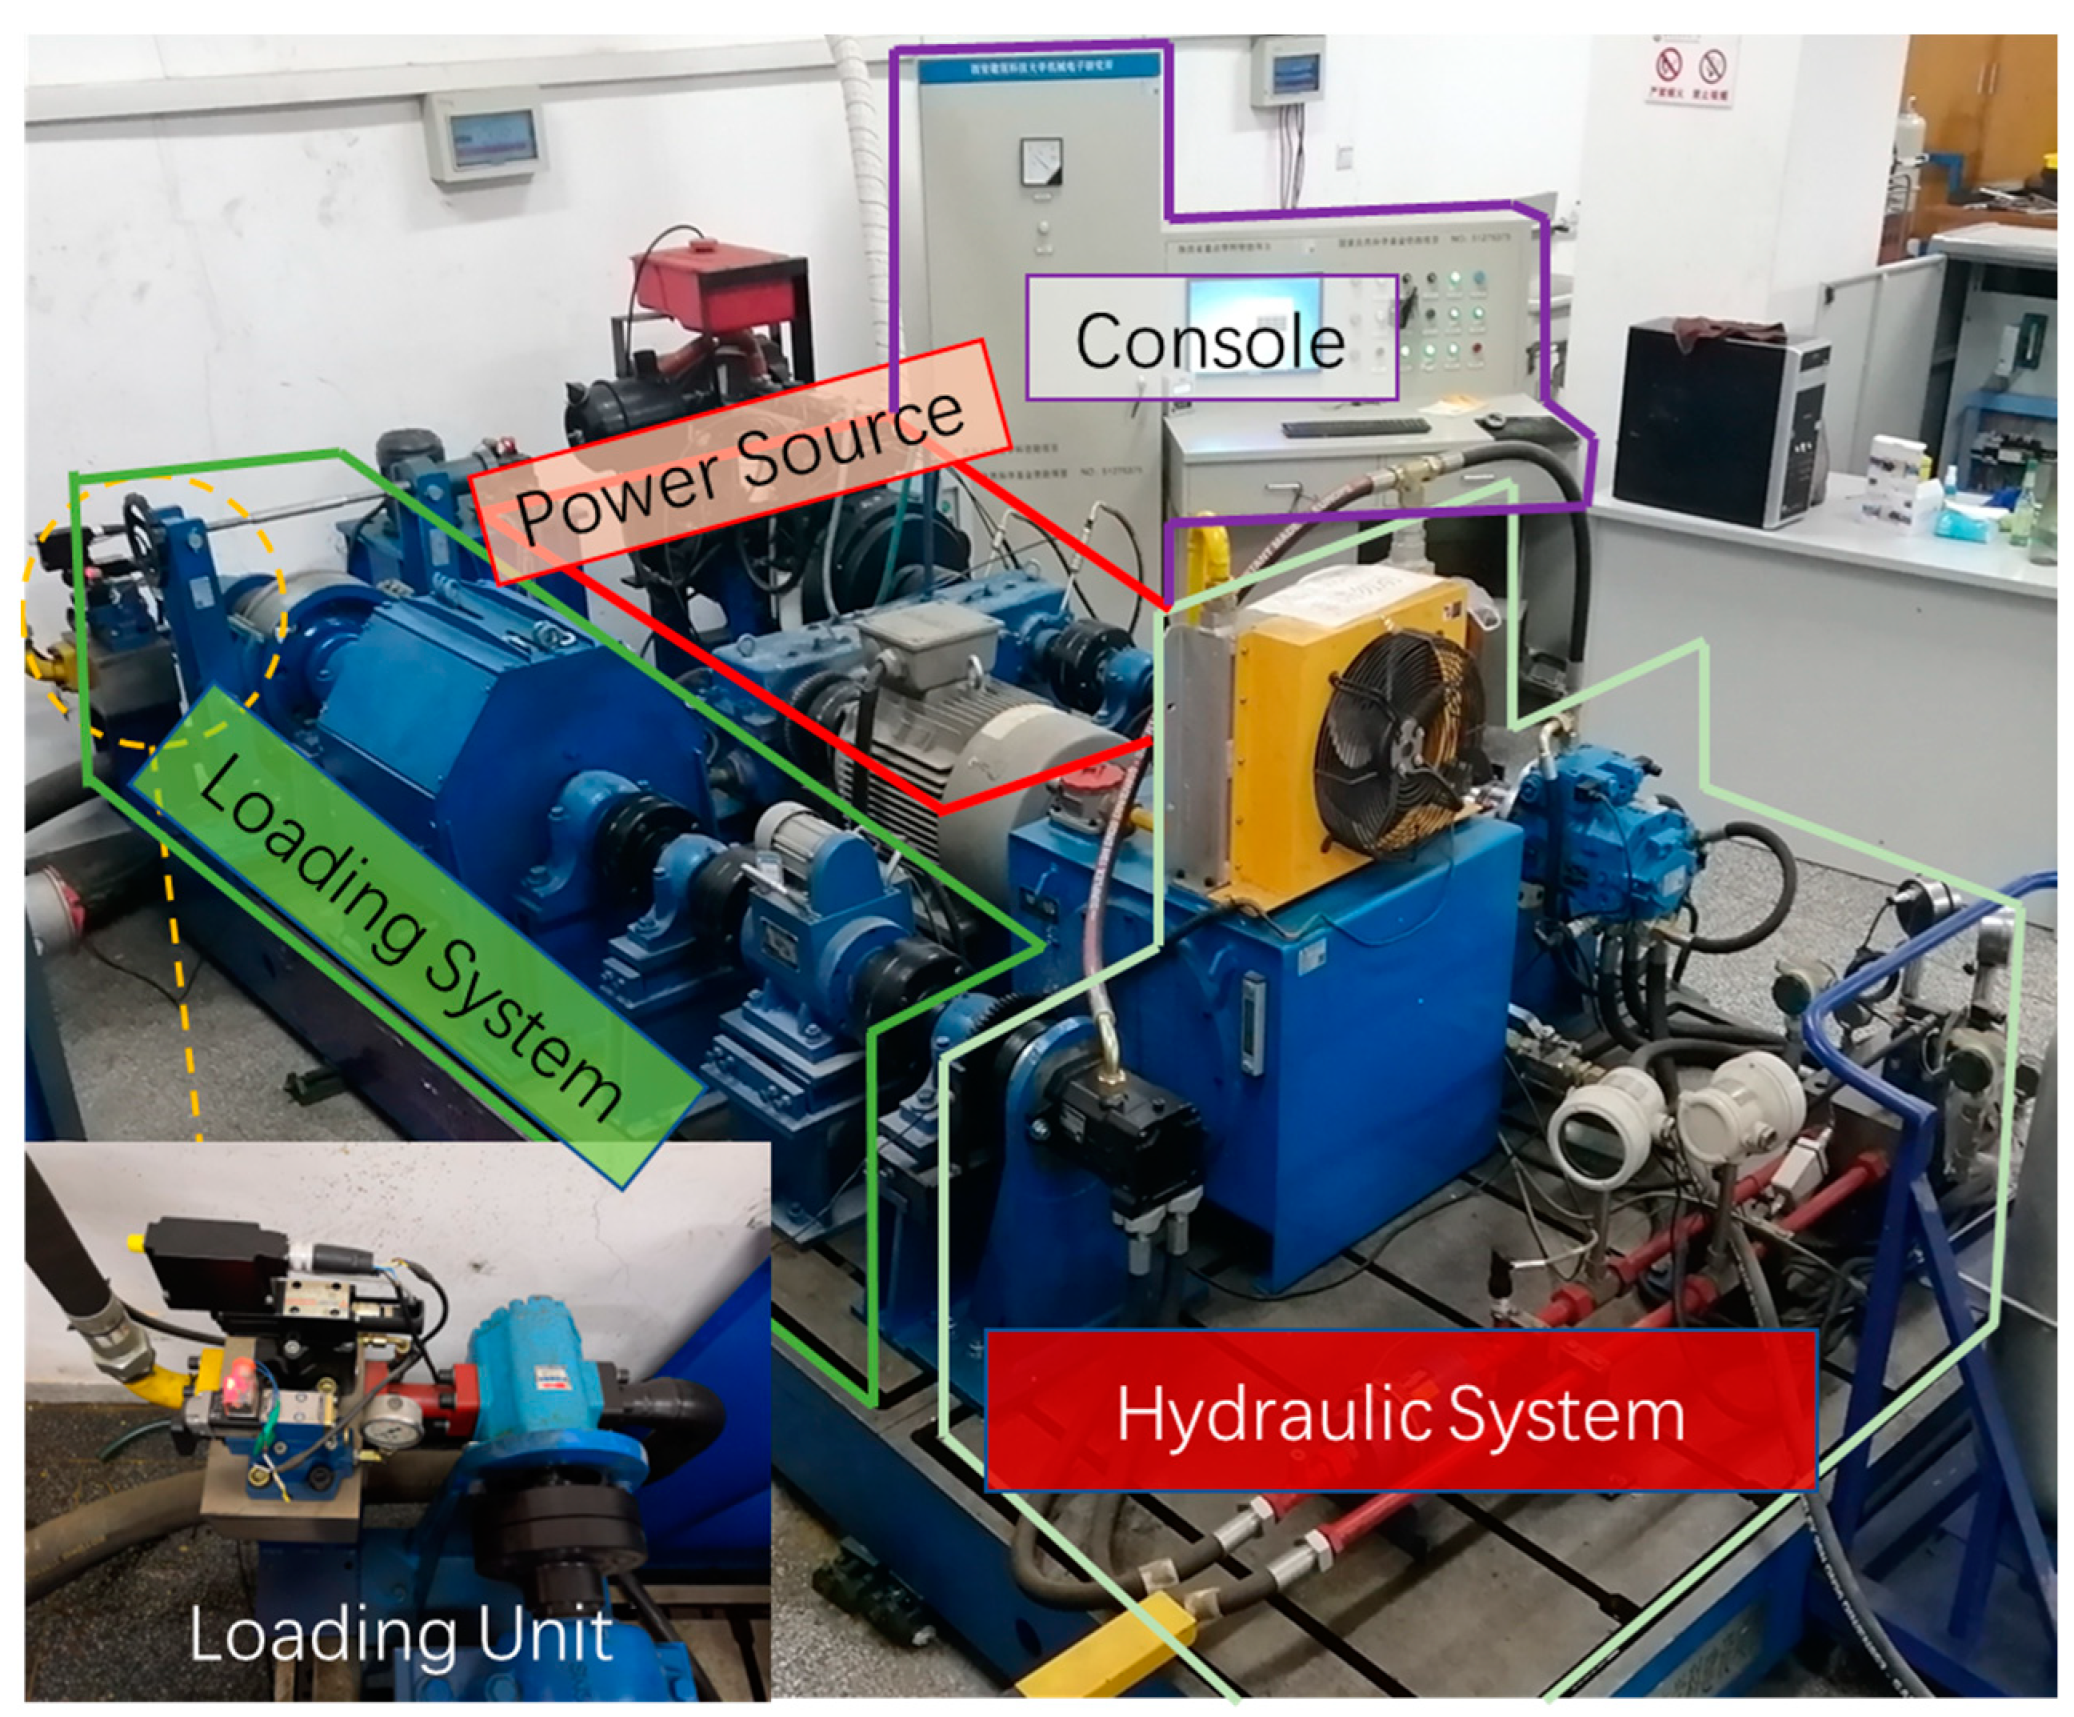
Figure 6 shows a physical photo of the test bench. The power source has a mixed drive output of the inverter motor and internal combustion engine. During the test, the clutch on the internal combustion engine side of the combiner box is disconnected and only the output of the inventor motor is retained. At the same time, the model needs to consider the ramp-up ratio id of the combiner box to the motor output speed. The inverter is set to a constant voltage-to-frequency ratio mode with linear characteristics, where the input voltage U s of the motor is linearly related to the frequency f s . Table 3 shows the main technical parameters of the key components and sensors.
During the experiments, the pressure and flow signals were collected using a data acquisition card of PCI1715u with a sampling frequency of 2560 Hz. The rotation speed and torque signals were obtained through serial communication.
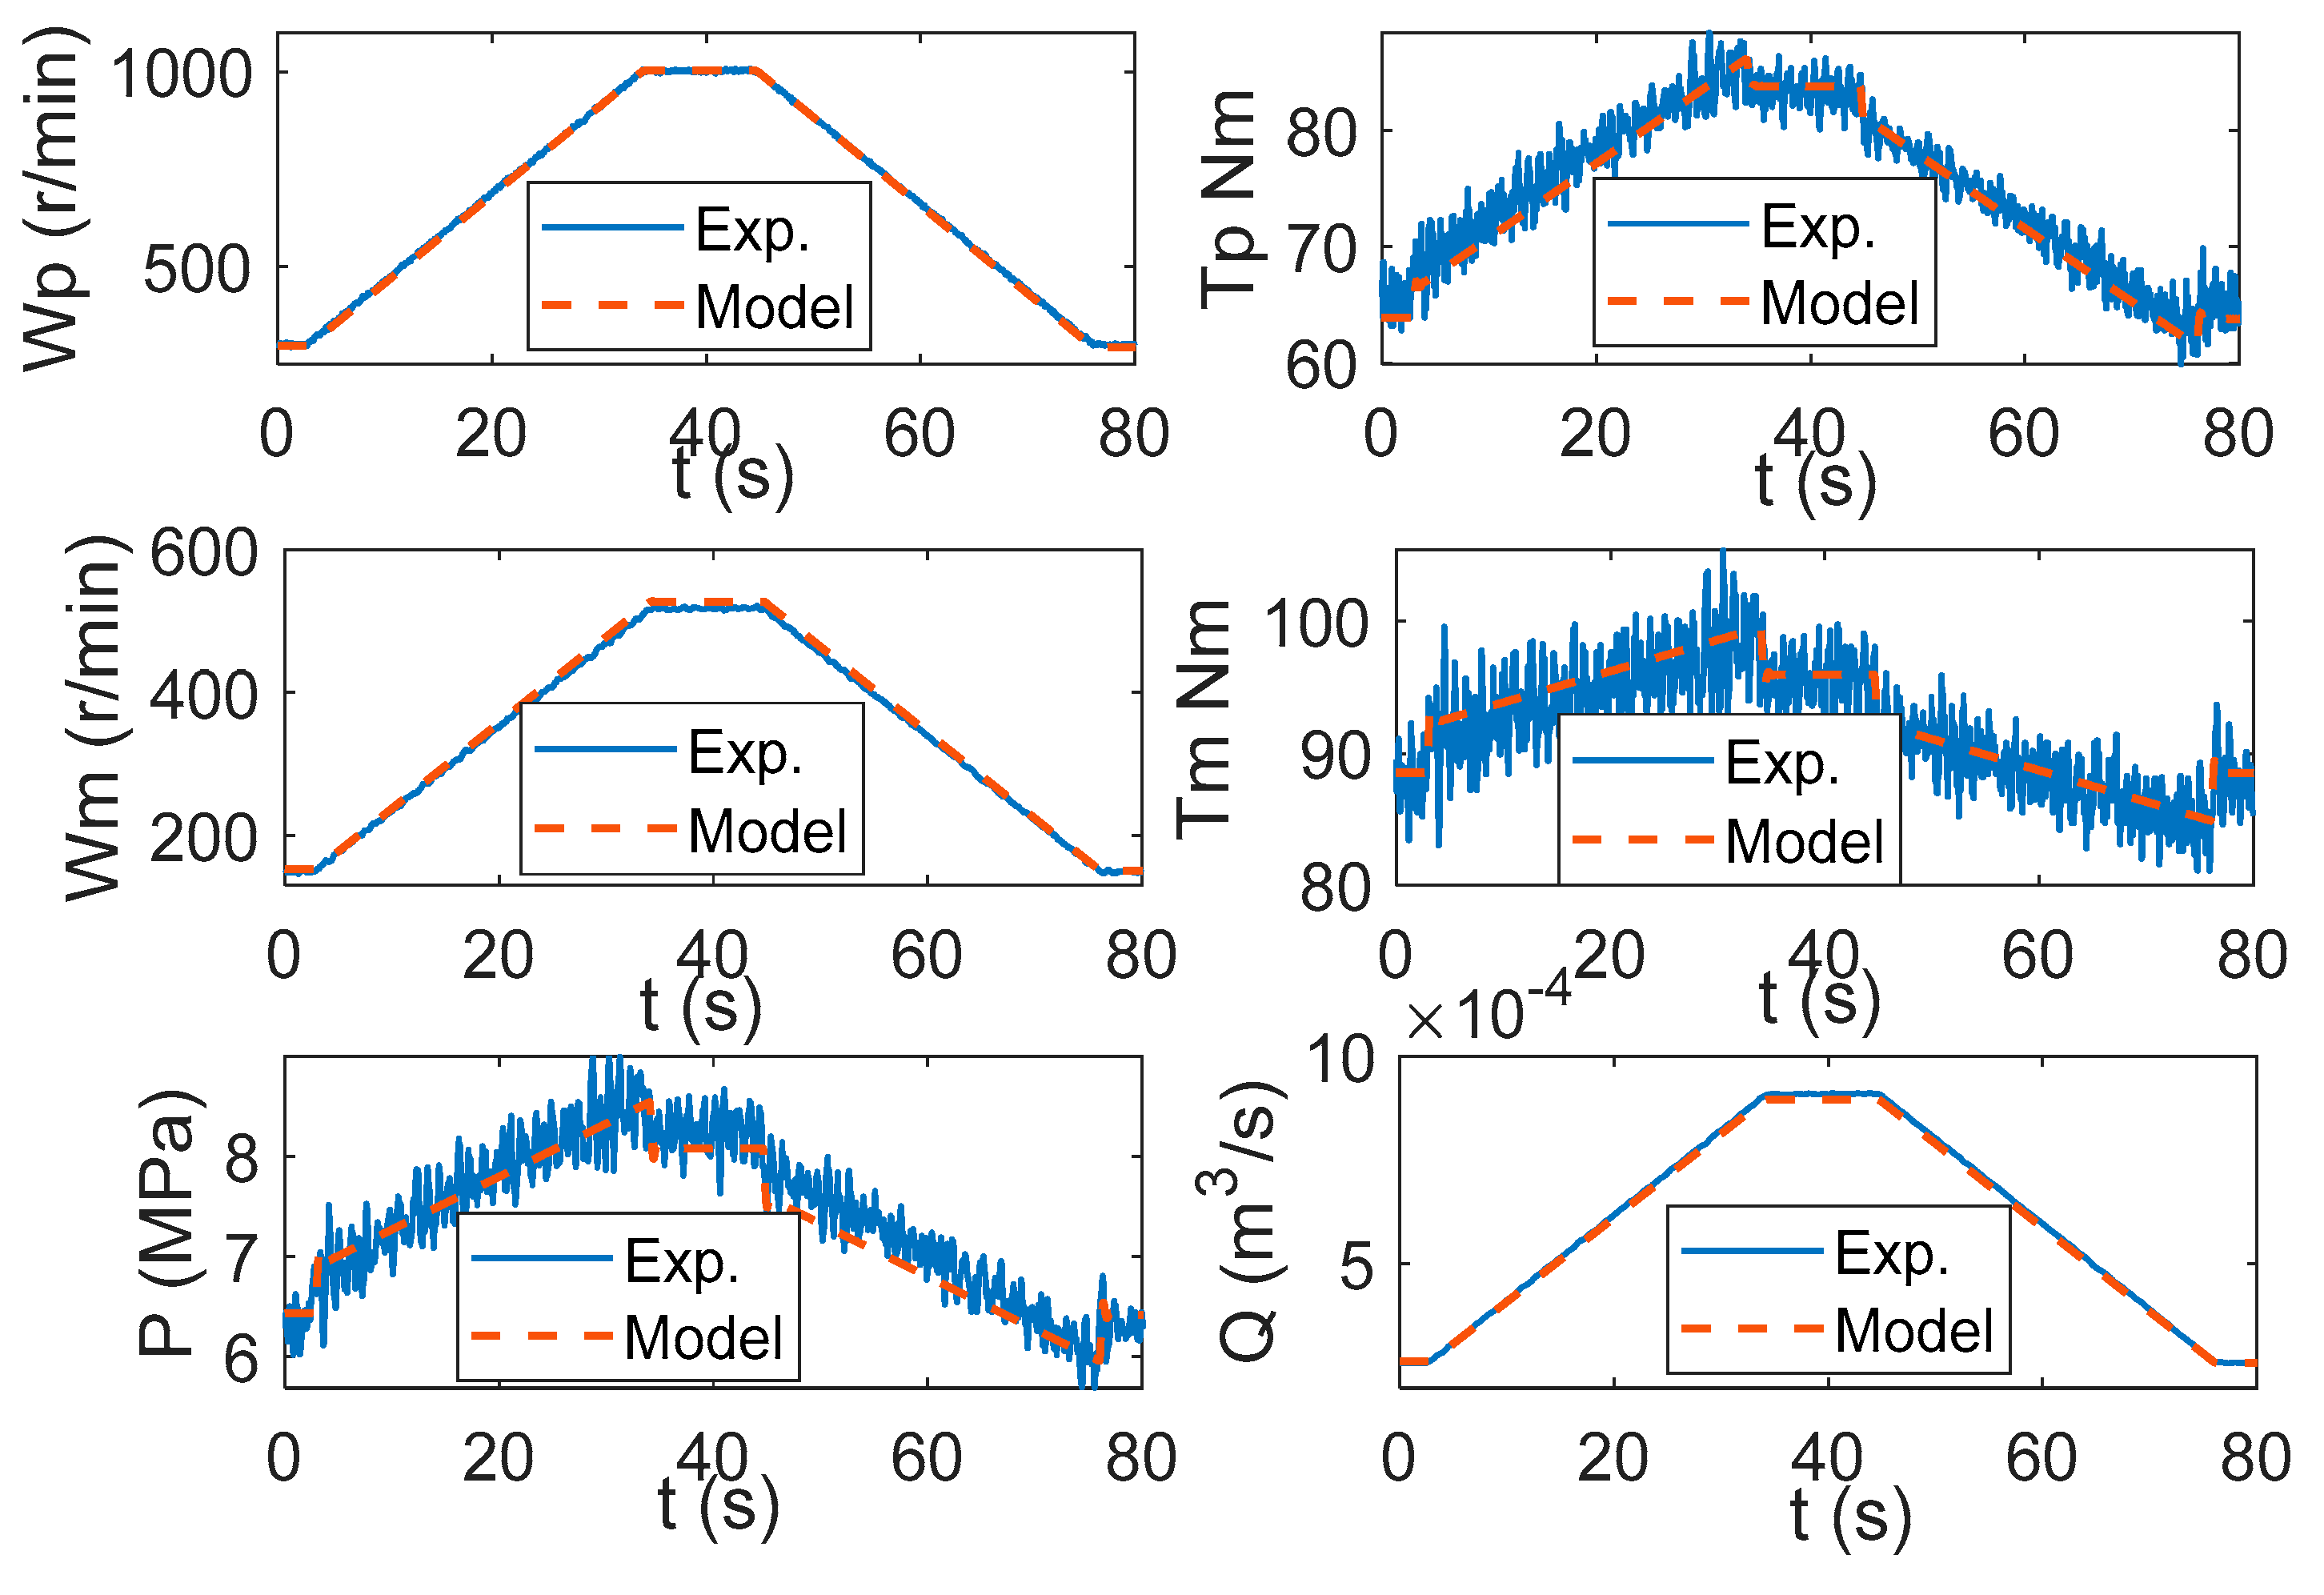
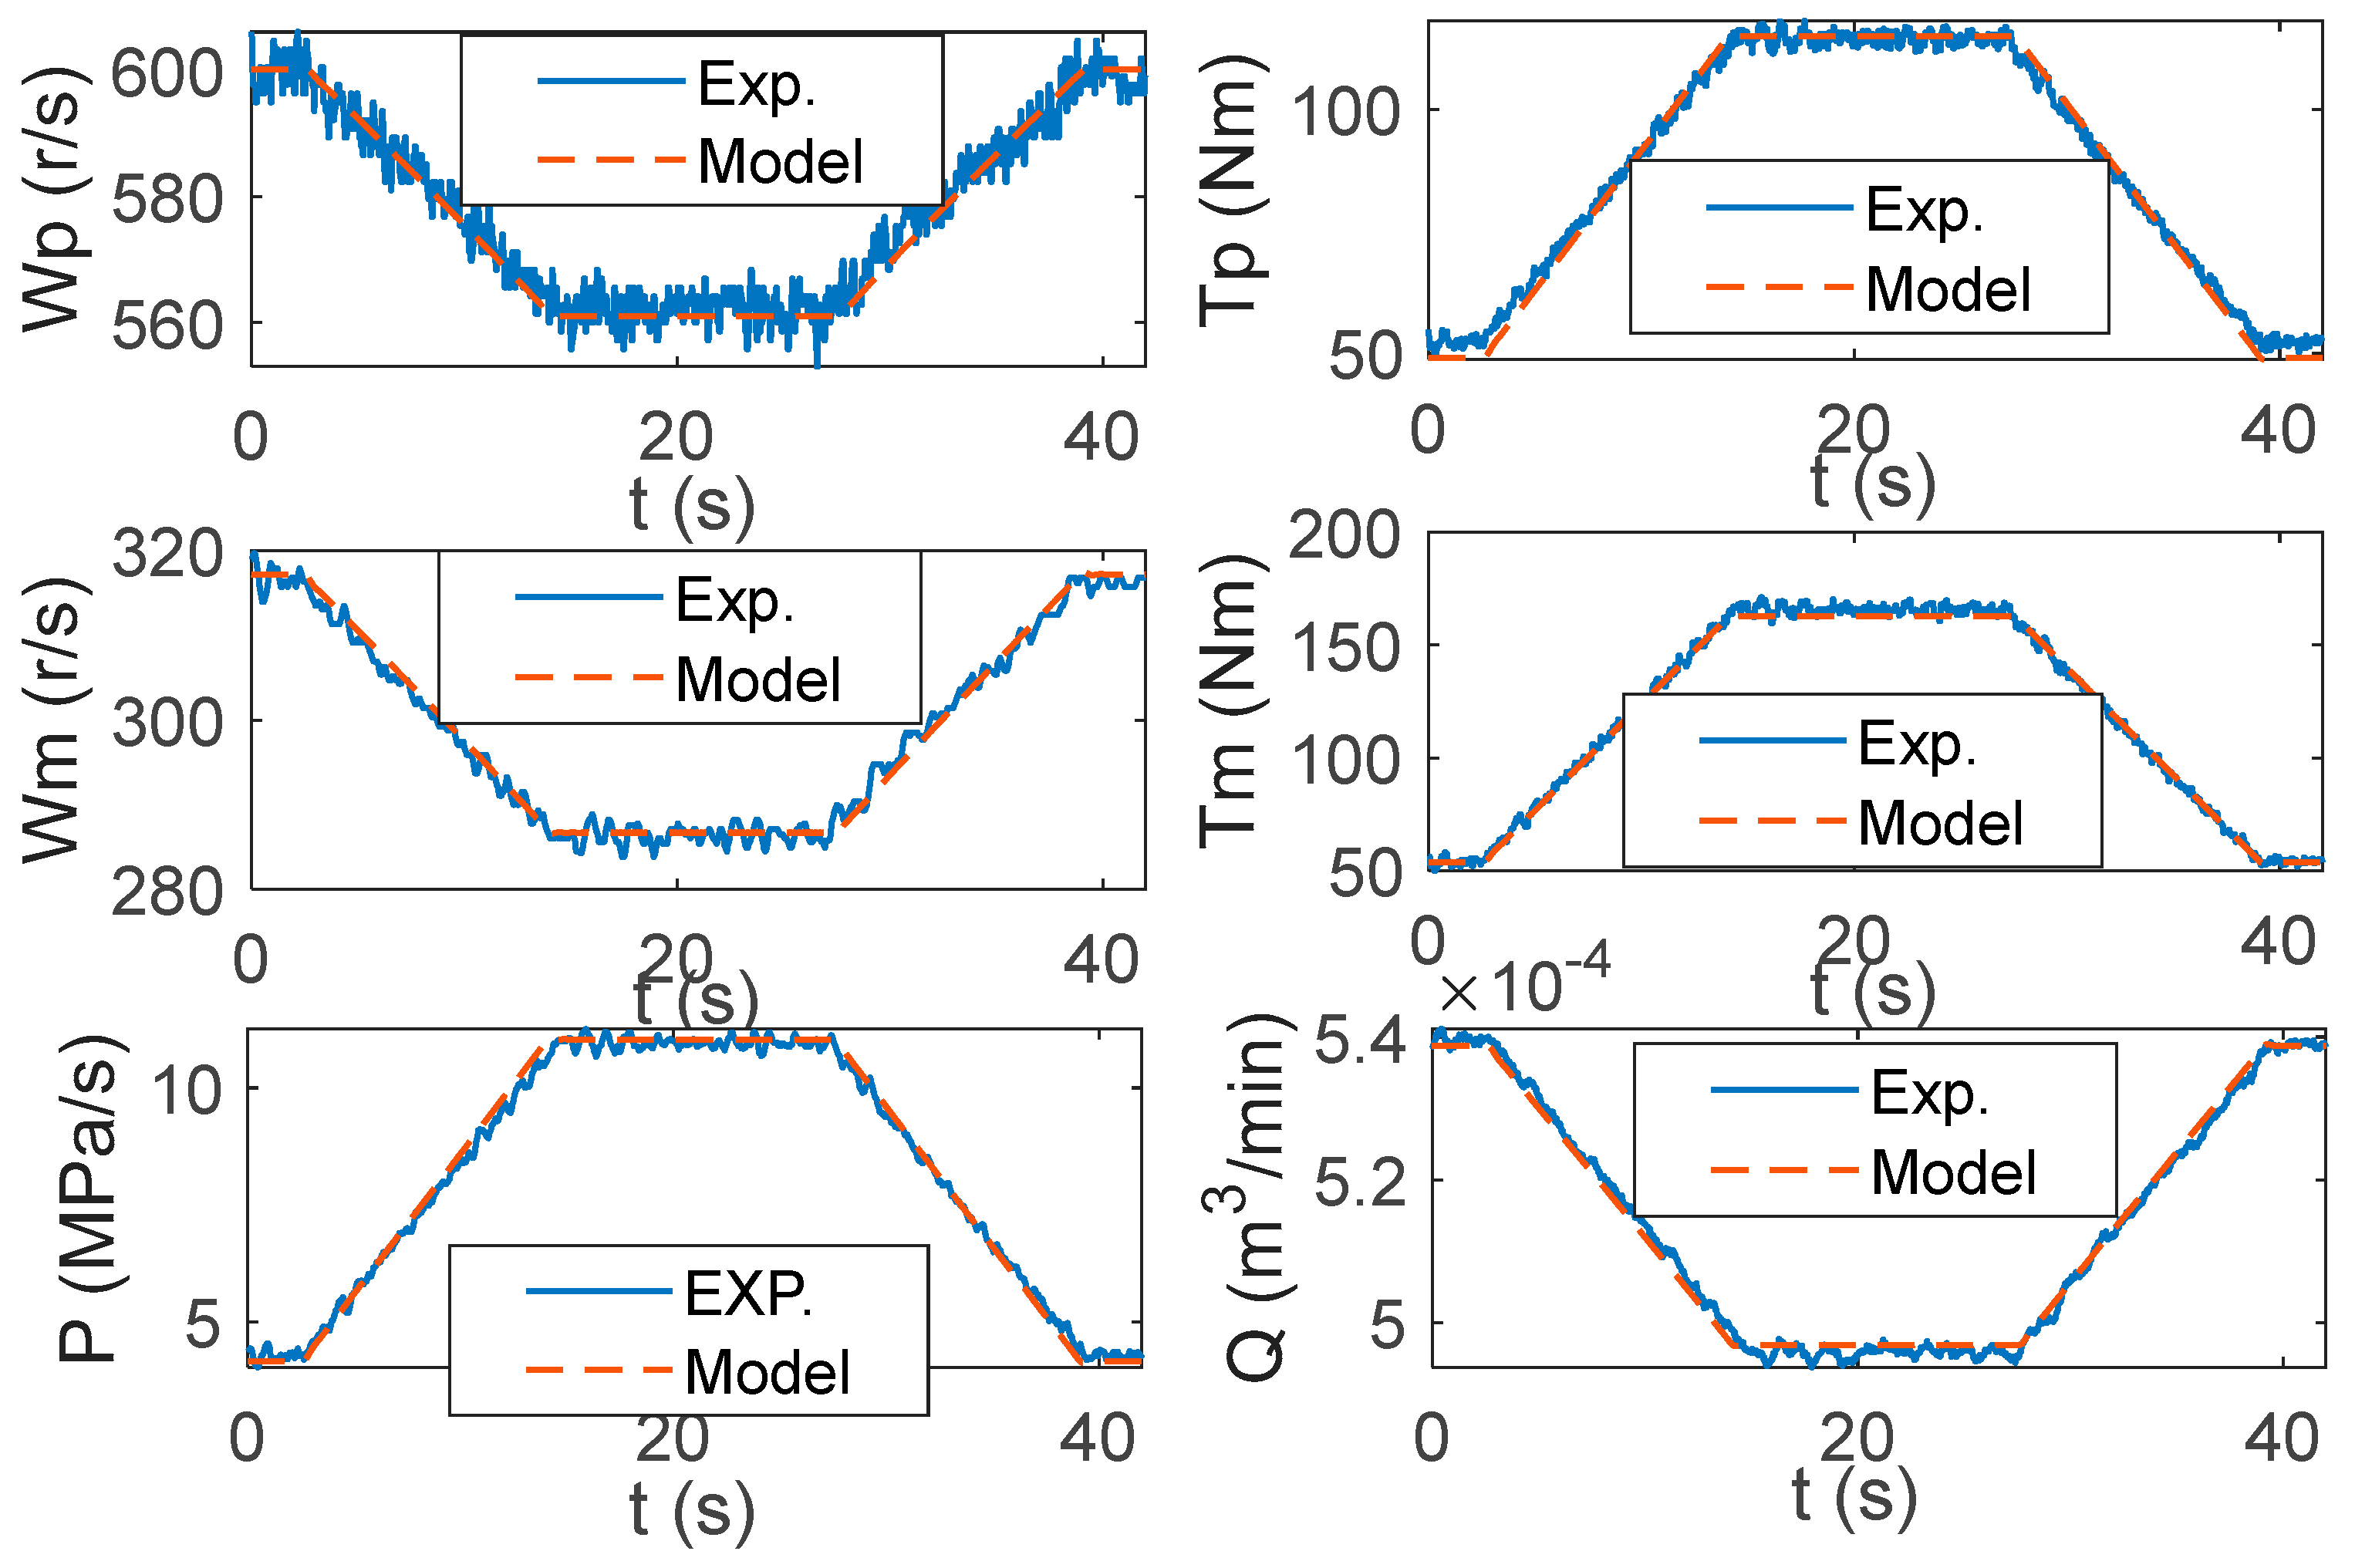
Details of the three experimental cases are given in Table 4. To verify the reliability of the model, we conducted the experiments shown in Table 3 in both the test bench and the simulation model. Figure 7 and Figure 8 compare the ramp acceleration and ramp loading experimental results with the simulation results.
Varying speed operation: Keeping the load input at 0.8 V. The accuracy of the model over a wide range of rotational speed variations was verified by adjusting the inverter input and controlling the motor speed variation (both deceleration and acceleration). When the system accelerates from 280 rpm to 1000 rpm, the torque or pressure of each sub-system exhibits step characteristics at the beginning and the end because the rotational speed is affected by the inertia of the system. When the system speed accelerates, the powertrain needs to output additional torque to increase the system kinetic energy. On the contrary, the torque of the dynamical system is small. The model accurately reproduces the state variables under large-scale speed operating conditions.
Varying load operation: Keeping the inverter input constant. The system input torque (both loading and unloading) was controlled by adjusting the load-proportional valve voltage to vary continuously (0.4 V–0.8 V) to verify the accuracy of the model when the system load was operated over a wide range. As the system load was increased from a 50 Nm ramp to 170 Nm, the speed or flow of each subsystem decreased slightly due to motor stiffness and hydraulic system leakage. On the contrary, as the load decreased, the system speed recovered.
Observing Figure 7 and Figure 8, there are microscopic differences between the simulation results and the experiment results. There are many fluctuations in the experiment results. The reason for the fluctuation in the measurement results is due to the mixing of high-frequency noise in the measurement process on the one hand and, on the other hand, it is caused by the system working process and its coupling interface working structure [6,9,14]. Accurate modelling of variable fluctuation processes in hydraulic systems is still a hot research topic at the forefront. The model established in the manuscript is a macroscopic study of the trend of the system variables and, in order to improve the speed and efficiency of the model, the modelling process is necessary to simplify the physical model and the model does not model the variable fluctuations generated by the coupling interface.
The experimental and simulation results show that the coupling model built in this article can accurately describe the macro-nonlinear behaviours of the system over a wide range of speed regulations and a wide range of variable loads. The experimental results verify the validity of the model.

6. Evaluation of System Output Speed Stability and Analysis of the Influencing Factors

6.1. Evaluation of System Output Speed Stability

Stiffness first appeared in the disciplines of structural mechanics and mechanics of materials to describe the ability of a structure or material to resist elastic deformation. It reflects the relationship between displacement and load and is a physical quantity used to characterise the ease of elastic deformation of a system structure or component. In electro-mechanical hydraulic systems, system speed changes with load due to changes in motor slip, leakage, and other factors. Extending the concept of stiffness to the electro-mechanical hydraulic system, the ability of the system speed to resist load changes can be called the system speed stiffness. The current definition of system speed stiffness has more forms, but most of them do not take into account the influence of the system damping and no-load leakage on the stiffness, so this paper defines the hydraulic system speed stiffness as Equation (20).
K s = T ref Δ ω = T l + T ideal ω ideal ω l
where ω ideal indicates the output speed of the system in the ideal state. The ideal state refers to the system when it is unloaded, without calculating the volume loss, as well as all the mechanical losses of the system, where the motor is used to drive the load at the synchronous speed of the magnetic field of the load speed of the system. T ideal is for the system when it is unloaded, where the power source output torque is ideally converted to the equivalent torque of the load side; that is,
ω ideal = ω E i d i h i l
T ideal = T E i d i h i l
where ω E indicates the motor stator magnetic field speed, T E indicates the motor output electromagnetic torque when the system is unloaded, i d indicates the output power speed ratio of the power source, i h indicates the variable speed ratio of the hydraulic link, and i l indicates the speed ratio of the load output. Equation (20) shows that the greater the static stiffness of the system speed, the greater the ability of the system to resist the decrease in the system output speed caused by the external load T l .

6.2. Analysis of Factors Affecting the Speed Stiffness of the System

The load speed is calculated as shown in Equation (23).
ω l = ω e i d D p D m η p η m i l
where ω e is the motor output shaft speed and i l is the speed ratio of the mechanical output end of the system (e.g., the speed ratio of the output wheel end of the hydraulic travelling system). According to Equation (23), the use of high-performance hydraulic components, through the improvement of hydraulic components with precision, reduces the leakage in the working process and improves the volume efficiency of the pump η p and volume efficiency of the motor η m to improve the system rigidity of the most direct and commonly used means.
The rotational speed loss due to the elastic element in the mechanical transmission part is extremely small and can be ignored. However, the electromechanical coupling interface and the mechano-hydraulic coupling interface will produce more obvious speed and flow loss. Firstly, the load of the hydraulic system determines the system pressure, and the system pressure affects the volume efficiency of the hydraulic system. The highest volume efficiency of the system is achieved at high-speed and light-load conditions. Hydraulic component volumetric efficiency monotonically decreases with an increasing load. Therefore, the hydraulic speed drops in addition to the system component performance, but also due to the load conditions. According to this feature, changing the speed ratio i l , through the gear reducer on the hydraulic system output speed, increases the drop torsion and can change the system output’ end speed’s static stiffness. Similarly, increasing the system at all levels of the transmission ratio can also significantly reduce the actual load torque of the motor shaft output so that the system works in the higher stiffness of the high-speed light-load conditions, thus achieving the purpose of enhancing the static stiffness of the system speed. Secondly, changing the mechanical characteristics of a more “hard” motor, directly enhancing ω e , is also a way to increase the speed stiffness of the system.

6.3. Inference Verification

In combination with the verified model of the IFMDH system in Chapter 5 and the affecting factors of speed stiffness in Section 6.2, quantitative analyses are carried out on the effects of changes in the three parameters, namely the system speed, the motor stiffness, and the deceleration ratio at the output end, respectively, on the speed stiffness of the system.

6.3.1. Effect of Motor Speed on the System Speed Stiffness

Figure 9a shows the mechanical characteristic curves of the inverter-fed motor under different frequency working conditions according to the constant voltage–frequency ratio mode. Obviously, under the constant voltage–frequency ratio control mode, the driving ability of the motor is different. The higher the motor working frequency, the higher the output speed, and the stronger the load-carrying ability at the same time. Figure 9b shows the relationship between load and system speed drop, where the horizontal coordinate can be understood as stress and the vertical coordinate speed change can be understood as strain. With an increase in load and increase in power frequency, the absolute output speed drop of the system increases. Although the motor stiffness is nearly the same under different power supply frequencies, the efficiency difference of the hydraulic system under different working conditions leads to different speed stiffnesses of system.
Figure 9c shows the system speed static stiffness under different load conditions. The speed stiffness of the system is smaller in the low-frequency working condition of the power supply, and it decreases faster with an increase in the load. Under light-load and high-speed operation conditions, K s is maximum. But, with an increase in load, K s gradually decreases.

6.3.2. Effect of E-Motor Stiffness on the Speed Stiffness of the System

Figure 10 analyses the effect of E-motors with different mechanical characteristics on the output speed difference and speed stiffness of the system. Figure 10a shows the mechanical characteristic curves of the inverter-fed motors E-motor1 and E-motor2 in constant voltage–frequency ratio mode at a power supply frequency of 27.74 Hz. The maximum output torque of the two motors is the same but, under the same load operation conditions, the change in rotational speed of E-motor2 is smaller than that of E-motor1, i.e., E-motor2 has a smaller slip than E-motor1. Figure 10b shows the load versus system speed drop. Under 0 Nm load operation conditions, the absolute rotational speed drop of E-motor1 and E-motor2 are the same at nearly 48 rpm. Under 200 Nm load operation conditions, the absolute rotational speed drop of E-motor2 is 243 rpm and the absolute rotational speed drop of E-motor1 is 262 rpm. The rotational speed drop of E-motor1 is more than that of E-motor2. As the load increases, the difference in the rotational speed drop of E-motor2 over E-motor1 becomes larger and larger, which is reflected in the rotation speed of the output of the hydraulic system. The difference in the output speed of the two motor-driven hydraulic systems is increasing as the load increases.
Figure 10c shows the effect of different motor mechanical characteristics on the output speed stiffness of the system. The speed stiffness of the system with E-motor2 has fewer differences than the system with E-motor1 under the same speed and load conditions. The above analysis shows that the speed stiffness of the system cannot be improved significantly by improving the mechanical characteristics of the motors to reduce the operating slip rate.

6.3.3. Influence of the Speed Ratio at the Output on the Speed Stiffness of the System

Hydraulic travelling mechanisms or low-speed, heavy-duty equipment usually have a reducer in series after the hydraulic motor at the actuating end of the hydraulic system to reduce the output speed and increase the output torque. In general, the efficiency of the single-stage cylindrical gear reducer is 97~98%, the two-stage reduction configuration is selected for the output reducer, and the mechanical efficiency is calculated to be 96%. When the load torque is 25 Nm, 50 Nm, 75 Nm, and 100 Nm, and the reduction ratio at the output side is 1, 2, and 4, respectively, the output speed of the control system is 400 rpm, and the influence of the reduction ratio at the output side on the speed and speed stiffness of the system is further investigated.
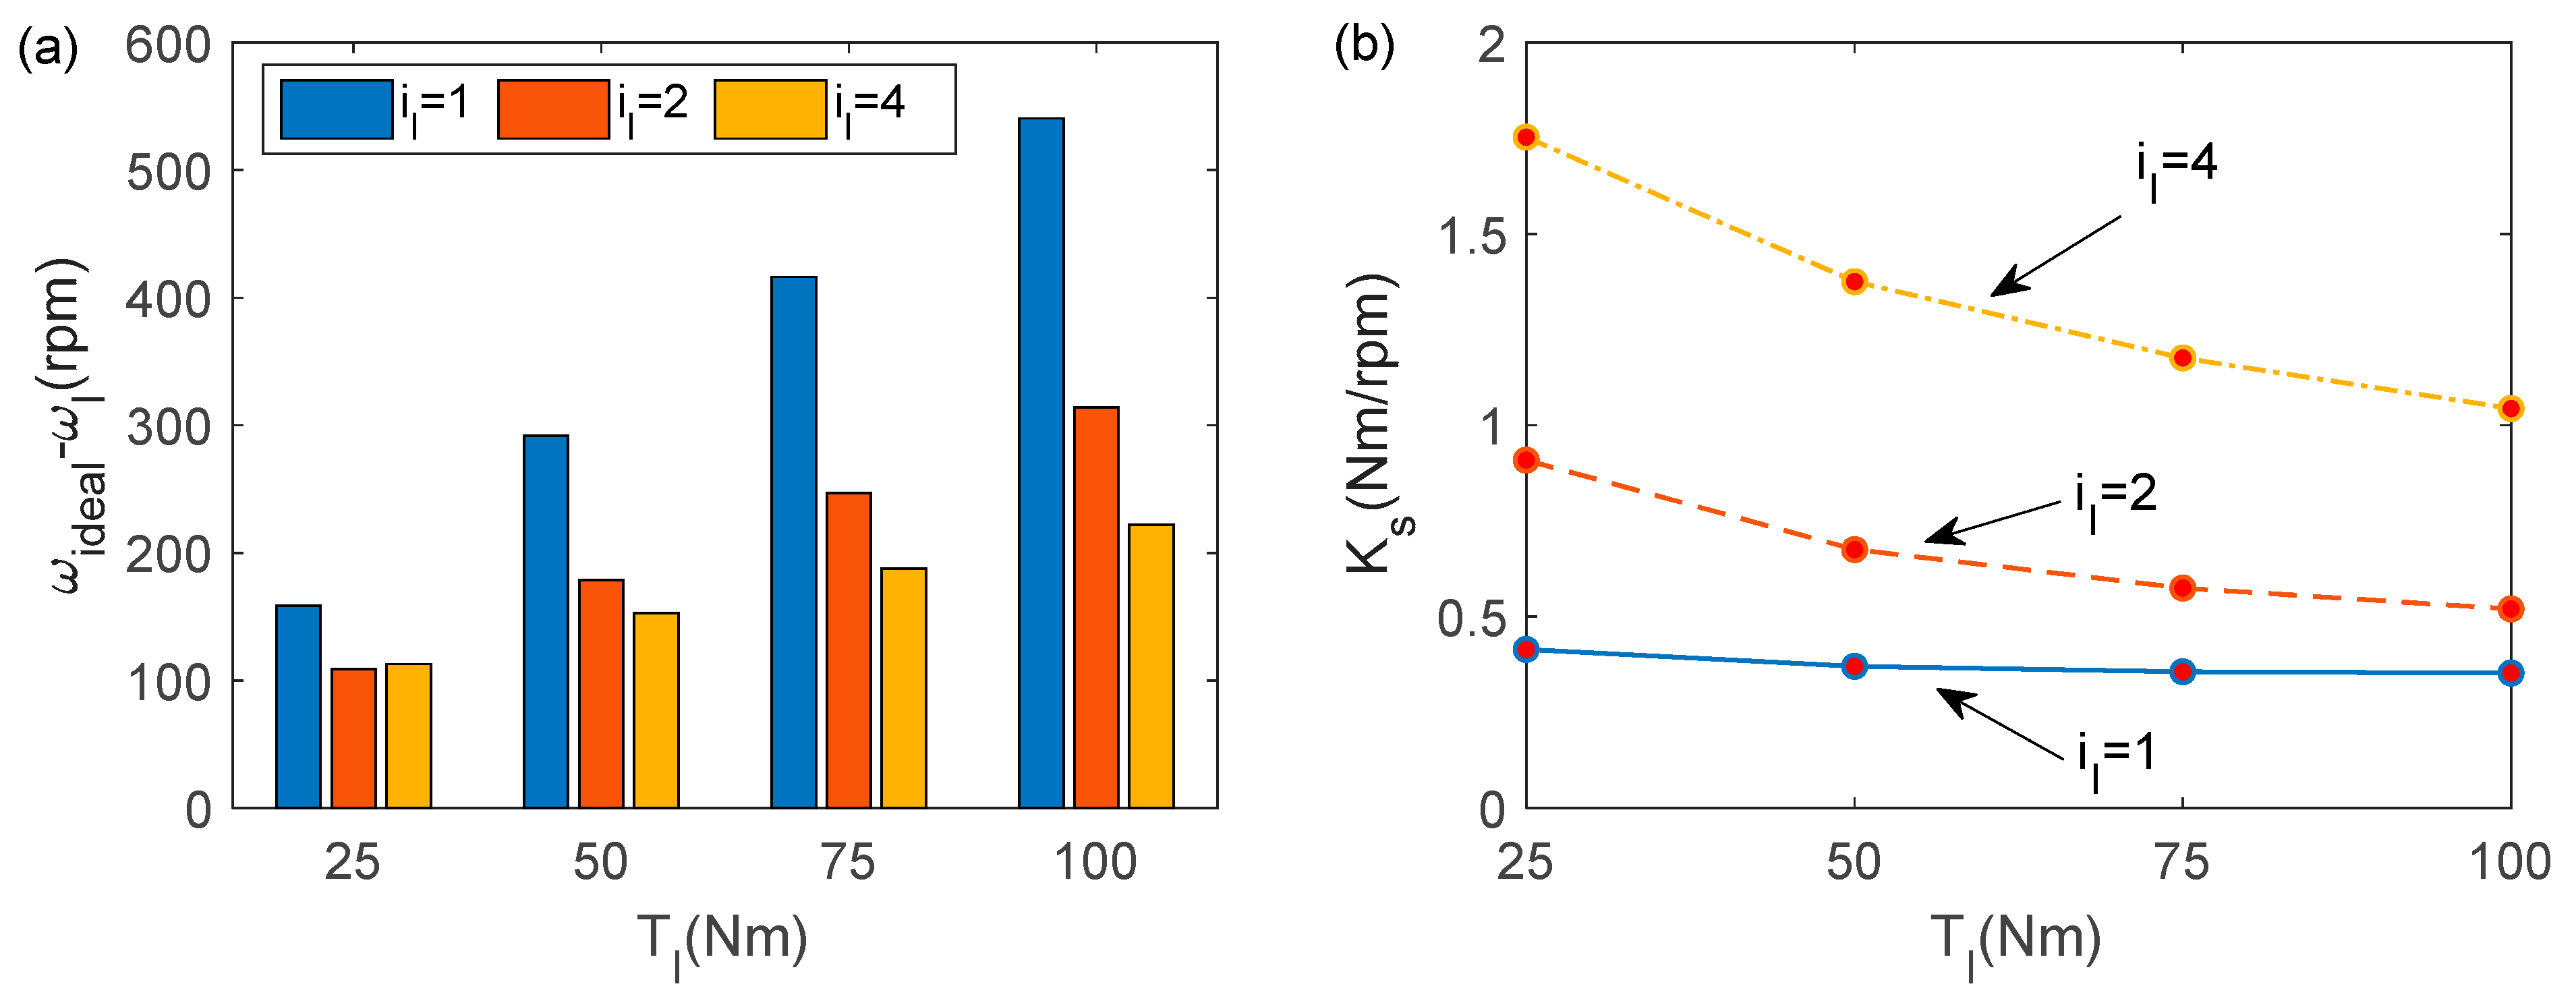
Once the reducer has been configured, the hydraulic system must operate at a higher speed range to ensure that the output parameters meet the requirements of the working conditions. The simulation results of the speed variation and speed stiffness of the system are shown in Figure 11 and Figure 12, respectively, with the hydraulic motor and reducer as the output. Figure 11a shows that, as the reduction ratio increases, the absolute speed drop of the motor caused by the same load decreases. This is because the reducer reduces the output torque of the motor under the same working conditions, which is equivalent to reducing the original system load and increasing the speed. As a result, the speed drop of the system becomes smaller.
Figure 12a shows that the output speed drop caused by the load decreases with an increase in the reduction ratio due to the effect of speed reduction and torque increase. The output speed reducer effectively suppresses the absolute amount of output speed drop caused by the load. The ability to inhibit changes in system speed becomes stronger with a larger reduction ratio. The speed reducer’s deceleration effect reduces the absolute amount of speed dropout at the output end proportionally as the reduction ratio increases. Additionally, the speed stiffness at the output end becomes larger, as shown in Figure 12b. The speed stiffness at the output end of the speed reducer increases more than the motor end speed stiffness. Combining both effects, different reduction ratios (i2 = 2, i3 = 4) increase the stiffness of the system speed by nearly 4 and 16 times, respectively. It can be concluded that the increase in speed stiffness is proportional to the square of the reduction ratio.
From the above analysis, the following conclusions can be obtained: the addition of a reducer at the output of the hydraulic system can effectively improve the system speed stiffness and, the larger the reduction ratio, the higher the speed stiffness of the system.

7. Discussion

Hydraulic component leakage and motor slip are unavoidable, and they will both affect the stability of the system output speed. At present, speed stiffness as a fundamental property of the output of a hydraulic system has not received enough research and attention. However almost all hydraulic systems place demands on output velocity stability, obviously through the active control scheme of ex ante decision making or the passive feedback control strategy of ex post compensation to meet the output requirements, but it will inevitably result in increased manufacturing costs, maintenance, and repair technology difficulties. However, if the system output speed stiffness can meet the output requirements through reasonable selection and design at the beginning of the design, and, even for some scenarios, can be used to enhance the system speed stiffness instead of closed-loop control, it will be very meaningful to improve the overall reliability of the system and maintenance costs. Furthermore, when the system is degraded, the speed stiffness can also be used as a macro-indicator to measure the deterioration of the internal coupling interface of the system and to supervise the operational health of the system.
This study provides technical support for the rapid design, selection, system optimisation, and health management of hydraulic systems in common scenarios. It will play a positive role in enhancing the overall performance of hydraulic systems. Applied research in this area will be the focus of our research team in the future.

8. Conclusions

The output speed in a hydraulic system powered by an inverter-fed motor changes with the system operation conditions, and its stability has a great influence on the working performance of hydraulic equipment. The main results and contributions of this paper can be concluded as follows:
  • The coupling relationship of the IFMDH system is described by a mathematic model, and the proposed model decouples the coupling relationship between the variables of the system. The accuracy of the IFMDH system model is verified by experiments. This model can accurately describe the macro-nonlinear behaviours of the system over a wide range of speed regulations and a wide range of variable loads.
  • Speed stiffness as an evaluation index can be used to monitor the working conditions of hydraulic components. When the wear of hydraulic components increases, the system leakage increases. The system shows a decrease in speed stiffness and degradation of system output performance. The redefined speed stiffness of the IFMDH system shows a good evaluation ability.
  • Under the same load condition, the higher the rotational speed, the greater the speed stiffness. When the motor operating frequency is unchanged, the load increases and the system speed stiffness becomes smaller. Enhancing the mechanical characteristics of the motor and reducing the motor slip can enhance the system speed stiffness and improve the system output speed characteristics.
  • The addition of a speed reducer at the output of the hydraulic system has the greatest effect on the system speed stiffness. The larger the reduction ratio, the higher the output stiffness. The system speed stiffness and the square of the deceleration ratio approximately satisfy the linear relationship.

Author Contributions

Investigation, B.G., Q.J. and L.G.; resources, B.G. and L.G.; writing—review and editing, B.G., J.W., X.L. and J.G. All authors have read and agreed to the published version of the manuscript.

Funding

This work was supported by the Doctoral Fund of Longdong University (Grant No. XYBYZK2223); the Science and Technology Project of Gansu Province (Basic Research Plan) (Grant No.23JRRM737); Key R & D plan of Gansu Province (Grant No. 23YFNM0002); Gansu Provincial Commissioner for Science and Technology Special (Grant No.23CXGM0002); Qingyang Science and Technology Plan Project (Grant No.QY-STK-2023A-009); Qingyang Key R&D Programme (Agriculture) (Grant No. QY-STK-2023A-080).

Data Availability Statement

The data presented in this study are available upon request from the corresponding author. The raw/processed data needed to reproduce these findings cannot be shared publicly at this time, as they are also part of an ongoing study.

Conflicts of Interest

The authors declare no conflicts of interest.

Nomenclature

Symbolic VariableParametersUnit
ω e The instantaneous rotational speed of the E-motorrad/s
ω p The instantaneous rotational speed of the pumprad/s
ω m The instantaneous rotational speed of the motorrad/s
ω T The instantaneous rotational angular speed of the loadrad/s
B e The E-motor dampingNm·s/rad
B p The pump rotational dampingNm·s/rad
B T The load rotational dampingNm·s/rad
C w m The coefficients of hydraulic motor flow loss related to speedm3·rad/s2
C p m The coefficients of hydraulic motor flow loss related to pressurem3/(Pa·s)
C w p The coefficients of piston pump flow loss related to speedm3·rad/s2
C p p The coefficients of piston pump flow loss related to pressurem3/(Pa·s)
C p ( ω p , P ) The test flow correction of pumpm3/s
C m ( ω m , P ) The test flow correction of motorm3/s
D p The pump displacementm3/s
D m The motor displacementm3/s
f S The synchronous frequencyHz
G1The compression loss coefficientm3/(rad·s)
G2The compression loss coefficient of oilm3/Pa
J e The rotational inertia of the E-motorkg·m2
J p The pump moment of inertiakg·m2
J m The motor moment of inertiakg·m2
J T The load rotational inertiakg·m2
K P The elasticity coefficient of the elastic coupling between the motor and the pumpNm/rad
K m The elasticity coefficient of the coupling between the motor and the loadNm/rad
n p The number of pole pairs-
T e Electromagnetic torqueNm
TlThe load torqueNm
U s The stator voltageV
PThe system pressurePa

References

  1. Quan, Z.; Quan, L.; Zhang, J. Review of energy efficient direct pump controlled cylinder electro-hydraulic technology. Renew. Sustain. Energy Rev. 2014, 35, 336–346. [Google Scholar] [CrossRef]
  2. Kalaiselvan, A.S.V.; Subramaniam, U.; Shanmugam, P.; Norbert, H. A comprehensive review on energy efficiency enhancement initiatives in centrifugal pumping system. Appl. Energy 2016, 181, 495–513. [Google Scholar]
  3. Xu, B.; Shen, J.; Liu, S.; Su, Q.; Zhang, J. Research and Development of Electro-hydraulic Control Valves Oriented to Industry 4.0: A Review. Chin. J. Mech. Eng. 2020, 33, 13–32. [Google Scholar] [CrossRef]
  4. Lyu, L.; Chen, Z.; Yao, B. Advanced Valves and Pump Coordinated Hydraulic Control Design to Simultaneously Achieve High Accuracy and High Efficiency. IEEE Trans. Control. Syst. Technol. 2021, 29, 236–248. [Google Scholar] [CrossRef]
  5. Quan, Z.; Ge, L.; Wei, Z.; Li, Y.W.; Quan, L. A Survey of Powertrain Technologies for Energy-Efficient Heavy-Duty Machinery. Proc. IEEE 2021, 109, 279–308. [Google Scholar] [CrossRef]
  6. Liu, Q.; Zhou, L.; Bo, X.; Zhang, C. Four-port Hydraulic Transformer with Inlet and Outlet Equal Flow and Its Efficiency Characteristics. Int. J. Fluid Mach. Syst. 2020, 13, 506–516. [Google Scholar] [CrossRef]
  7. Hoang, C.H.; Rangarajan, S.; Manaserh, Y.; Tradat, M.; Mohsenian, G.; Choobineh, L.; Ortega, A.; Schiffres, S.; Sammakia, B. A review of recent developments in pumped two-phase cooling technologies for electronic devices. IEEE Trans. Components, Packag. Manuf. Technol. 2021, 11, 1565–1582. [Google Scholar] [CrossRef]
  8. Un-Noor, F.; Wu, G.; Perugu, H.; Collier, S.; Yoon, S.; Barth, M.; Boriboonsomsin, K. Off-Road Construction and Agricultural Equipment Electrification: Review, Challenges, and Opportunities. Vehicles 2022, 4, 780–807. [Google Scholar] [CrossRef]
  9. Cheng, C.; Fu, J.; Su, H.; Ren, L. Recent Advancements in Agriculture Robots: Benefits and Challenges. Machines 2023, 11, 48. [Google Scholar] [CrossRef]
  10. Gu, L.; Yang, B. A Cooperation Analysis Method Using Internal and External Features for Mechanical and Electro-Hydraulic System. IEEE Access 2019, 7, 10491–10504. [Google Scholar] [CrossRef]
  11. Li, D.; Guo, F.; Xu, L.; Wang, S.; Yan, Y.; Ma, X.; Liu, Y. Analysis of Efficiency Characteristics of a Deep-Sea Hydraulic Power Source. Lubricants 2023, 11, 485. [Google Scholar] [CrossRef]
  12. Irizar, V.; Andreasen, C. Hydraulic pitch control system for wind turbines: Advanced modeling and verification of an hydraulic accumulator. Simul. Model. Pract. Theory 2017, 79, 1–22. [Google Scholar] [CrossRef]
  13. Pourmovahed, A.; Beachley, N.; Fronczak, F. Modeling of a Hydraulic Energy Regeneration System: Part II—Experimental Program. Trans. ASME 1992, 114, 160–165. [Google Scholar] [CrossRef]
  14. Jeong, H. A novel performance model given by the physical dimensions of hydraulic axial piston motors-Model derivation. J. Mech. Sci. Technol. 2007, 21, 83–97. [Google Scholar] [CrossRef]
  15. Geng, B.; Gu, L.; Liu, J. Quasi-LPV system modeling and identification of a variable speed electro-mechanical and hydraulic MISO system. Proc. Inst. Mech. Eng. Part B J. Eng. Manuf. 2022, 237, 291–304. [Google Scholar] [CrossRef]
  16. Kumar, A.; Dasgupta, K.; Das, J. Achieving constant speed of a hydrostatic drive using controlled operation of the pump and enhancing its energy efficiency. ISA Trans. 2019, 90, 189–201. [Google Scholar] [CrossRef]
  17. Vaezi, M.; Izadian, A. Piecewise Affine System Identification of a Hydraulic Wind Power Transfer System. IEEE Trans. Control. Syst. Technol. 2015, 23, 2077–2086. [Google Scholar] [CrossRef]
  18. Sun, Y.; Shi, Y.; Wang, Q.; Yao, Z. Study on speed characteristics of hydraulic top drive under fluctuating load. J. Pet. Sci. Eng. 2018, 167, 277–286. [Google Scholar] [CrossRef]
  19. Zhao, K.; Liu, Z.; Yu, S.; Li, X.; Huang, H.; Li, B. Analytical energy dissipation in large and medium-sized hydraulic press. J. Clean. Prod. 2015, 103, 908–915. [Google Scholar] [CrossRef]
  20. Kumar, N.; Dasgupta, K. Steady-state performance investigation of hydrostatic summation drive using bent-axis hydraulic motor. Proc. Inst. Mech. Eng. Part C J. Mech. Eng. Sci. 2015, 229, 3234–3251. [Google Scholar] [CrossRef]
  21. Kumar, N.; Dasgupta, K.; Ghoshal, S. Dynamic analysis of a closed-circuit hydrostatic summation drive using bent axis motors. Proc. Inst. Mech. Eng. Part I J. Syst. Control. Eng. 2015, 229, 761–777. [Google Scholar] [CrossRef]
  22. Gu, H.; Jiao, S. Investigation into speed stiffness form milling system of totally-hydraulic milling machine. Chin. J. Constr. Mach. 2010, 8, 14–16+34. [Google Scholar]
  23. Bing, X.; Hu, M.; Zhang, J.; Su, Q. Characteristics of volumetric losses and efficiency of axial piston pump with respect to displacement conditions. J. Zhejiang Univ. Sci. A 2016, 17, 186–201. [Google Scholar]
  24. Xie, H.; Tang, Y.; Shen, G.; Li, X.; Bai, D. Part I: Journal of Systems and Engineering, C.; Command filtered adaptive backstepping control for high-accuracy motion tracking of hydraulic systems with extended state observer. Proc. Inst. Mech. Eng. Part I J. Syst. Control. Eng. 2021, 236, 654–668. [Google Scholar]
  25. Gao, J.; Wang, X.; Li, F. Analysis of AC Machines and Their Systems, 2nd ed.; Tsinghua University Press: Beijing, China, 1993; pp. 318–327. [Google Scholar]
  26. Geng, B.; Gu, L.; Liu, J. Novel Methods for Modeling and Online Measurement of Effective Bulk Modulus of Flowing Oil. IEEE Access 2020, 8, 20805–20817. [Google Scholar] [CrossRef]
  27. Geng, B.; Gu, L.; Liu, J.; Shi, Y. Dynamic modeling of fluid nonlinear compression loss and flow loss oriented to fault diagnosis of axial piston pump. Proc. Inst. Mech. Eng. Part C J. Mech. Eng. 2021, 235, 3236–3251. [Google Scholar] [CrossRef]
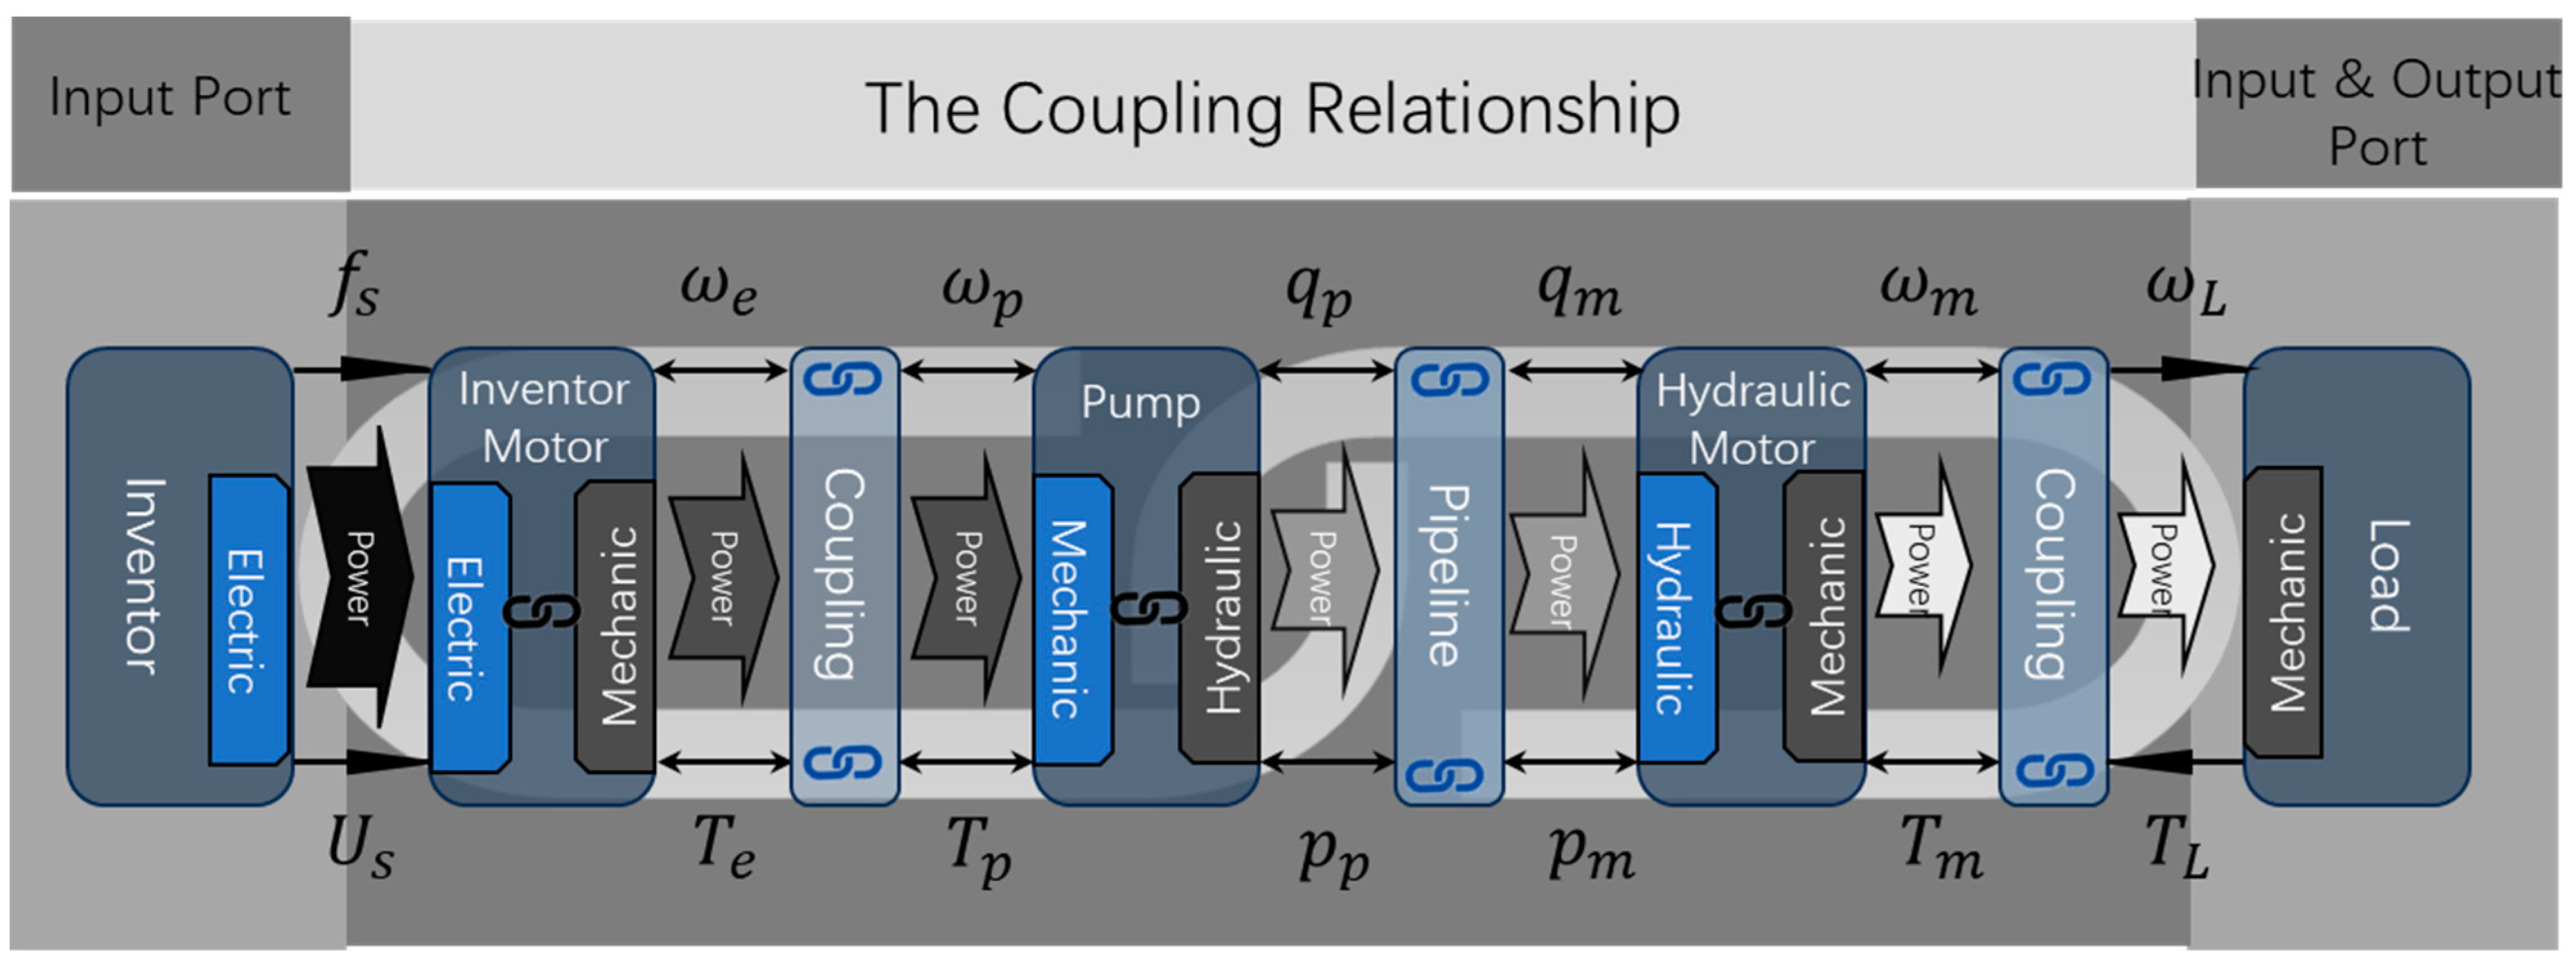
Figure 1. Hydraulic system coupling relationship.
Lubricants 12 00064 g001
Figure 2. The coupling relationship between the various parts of the hydraulic system.
Lubricants 12 00064 g002
Figure 3. The pump identification results. (a) Fitting planes. (b) The flow correction coefficients.
Lubricants 12 00064 g003
Figure 4. The motor identification results. (a) Fitting planes. (b) The flow correction coefficients.
Lubricants 12 00064 g004
Figure 5. Update process of time-varying parameters in system simulation.
Lubricants 12 00064 g005
Figure 6. A photo of the test bench.
Lubricants 12 00064 g006
Figure 7. Comparison of test and simulation results for case 1.
Lubricants 12 00064 g007
Figure 8. Comparison of test and simulation results for case 2.
Lubricants 12 00064 g008
Figure 9. Effect of motor speed on the system speed stiffness. (a) The E-motor mechanical characteristics curve. (b) Load vs. system speed change. (c) Speed stiffness of the system under different load operation conditions.
Lubricants 12 00064 g009
Figure 10. Effect of E-motor stiffness on the speed stiffness of the system. (a) The E-motor mechanical characteristics curve. (b) The load versus system speed drop. (c) Speed stiffness of the system under different load operation conditions.
Lubricants 12 00064 g010
Figure 11. Effect of end reduction ratio on motor-side speed stiffness in hydraulic systems. (a) The load versus system speed drop. (b) Speed stiffness of the system under different load operation conditions and speed ratio.
Lubricants 12 00064 g011
Figure 12. Effect of end reduction ratio on the output speed stiffness of a hydraulic system. (a) The load versus system speed drop. (b) Speed stiffness of the system under different load operation conditions and speed ratio.
Lubricants 12 00064 g012
Table 1. Identification results of the pump and motor.
Parameters C ω p ( m 3 / r ) C p p ( M P a m 3 / s ) C ω m ( m 3 / r ) C p m ( M P a m 3 / s )
Value4.236 × 10−7−3.392 × 10−123.121 × 10−68.214 × 10−13
Table 2. The main parameters of the system.
ParameterValueParameterValue
D p 55 mL D m 49 mL
J p 0.0554 kg·m2 J m 0.0644 kg·m2
J e 0.524 kg·m2 K m 1400 Nm/rad
K p 1400 Nm/rad B e 0.041 Nm/rad
B p 0.039 Nm/rad B m 0.043 Nm/rad
Table 3. The main technical parameters of the key components and sensors.
Key Component/SensorTechnical ParameterContent
Inverter-fed motorTypeSiemens 1LG0206-4AA70-Z
Rated power30 KW
Rated speed1470 r/min
Hydraulic pumpTypeHPV55-02RE1X300E
Displacement0–55 mL
Rated pressure42 MPa
Maximum speed3300 r/min
Hydraulic motorTypeHMV105-02E1C
Displacement35–105 mL
Rated pressure42 MPa
Maximum speed3500 r/min
Gear motorTypeCBY4150-A3Fl
Displacement50 mL
Rated pressure20 MPa
Maximum speed2000 r/min
Proportional relief valveTypeATOS AGMZO-TERS-PC-20/315/Y
Specification (diameter)20
Maximum regulating pressure /bar315
Linearity (% of maximum pressure)≤0.1
Repeat accuracy (% of maximum pressure)≤0.2
Flow sensorTypeKarl BEM300
Range0–150 L/min
Maximum pressure25 MPa
Pressure transducerTypeHYDAC HDA4844-A-400-Y00
Range0–60 MPa
Overload pressure80 MPa
Speed and torque sensorTypeJCZ2
Rated speed0–4000 rpm
Table 4. Experimental description and purposes.
No.OperationExperimental Description and Purposes
Case 1Varying speed operationKeep the load input at 0.8 V. Vary the motor speed (including deceleration and acceleration) to check the accuracy of the model over a wide speed range.
Case 2Varying load operationKeep the inverter input constant. Control the system input torque (both loaded and unloaded) by adjusting the load proportional valve voltage to vary continuously (0.4 V–0.8 V) to verify the accuracy of the model when the system load is operated over a wide range.
Disclaimer/Publisher’s Note: The statements, opinions and data contained in all publications are solely those of the individual author(s) and contributor(s) and not of MDPI and/or the editor(s). MDPI and/or the editor(s) disclaim responsibility for any injury to people or property resulting from any ideas, methods, instructions or products referred to in the content.