Abstract
Magnesium (Mg) and graphene in alloy formulations are of paramount importance for lightweight engineering applications. In the present study, ZE10 Mg-alloy-based nanocomposites reinforced with graphene nanoplatelets (GNPs) having a thickness of 10–20 nm were fabricated via ultrasound-assisted stir casting. The effect of GNP contents (0.25, 0.5, and 1.0 wt.%) on the microstructure, Vickers hardness, and tensile properties of nanocomposites was investigated. Further, tribological studies were performed under a ball-on-disc sliding wear configuration against a bearing ball counterbody, at room and elevated temperatures of 100 °C and 200 °C, to comprehend temperature-induced wear mechanisms and friction evolution. It was revealed that the GNP addition resulted in grain coarsening and increased porosity rate of the Mg alloy. While the composites exhibited improved hardness by 20–35% at room temperature and 100 °C, a minor change was observed in their hardness and tensile yield strength values at 200 °C with respect to the GNP-free alloy. A notable improvement in lowering and stabilizing friction (coefficient of friction at 200 °C~0.25) and wear values was seen for the self-lubricating GNP-added composites at all sliding temperatures. The worn surface morphology indicated a simultaneous occurrence of abrasive and adhesive wear mode in all samples at room temperature and 100 °C, while delamination and smearing along with debris compaction (tribolayer protection) were the dominant mechanisms of wear at 200 °C. Inclusively, the results advocate steady frictional conditions, improved wear resistance, and favorable wear-protective mechanisms for the Mg alloy–GNP nanocomposites at room and elevated temperatures.
1. Introduction
The demand for lightweight, high-strength, and wear-resistant metallic materials has been rising across multiple industries such as aerospace and automotive [1]. This demand plays a crucial role in enhancing both fuel efficiency and structural integrity, and it is anticipated to continue growing to align with the emission standards imposed by regulatory authorities [2,3]. In this regard, magnesium (Mg) alloys, as the lightest structural metals, could be promising candidates for replacing denser materials such as steel and aluminum (Al) in such applications [4,5]. As an important class of engineering material with the properties of low density, high strength-to-weight ratio, and excellent dimensional stability, Mg and its alloys are commonly utilized in aeronautical, automotive, military, and electronic industries as well as medical implants [6,7]. Additionally, the recyclability of Mg and its alloys holds significant importance in furthering the aim of creating a sustainable and human-centered world [8,9]. About 90% of commercial Mg alloys combining sufficient room temperature strength, ductility, and improved corrosion resistance are cast alloys. The most widely used traditional Mg alloys are aluminum–zinc (AZ60, AZ91) and aluminum–manganese (AM50, AM60) systems because of their presence of Al for enhanced castability [10]. However, the formation of a thermally unstable β-phase, i.e., Mg17Al12, in these systems restricts their use for applications such as automotive powertrain components requiring high strength and wear resistance at elevated temperatures [11,12]. Due to poor mechanical properties of Mg-Al alloys, which arise due to the dramatic softening of the Mg17Al12 phase above 125 °C, Al-free Mg–rare earth (RE) systems including QE22 (Mg-Ag-RE), WE43 (Mg-Y-RE), and ZE10 (Mg-Zn-RE) alloys have attracted considerable interest for high-temperature applications. The enhanced high-temperature mechanical properties of such non-conventional Mg alloys are usually ascribed to the precipitation hardening of thermally stable RE-based compounds [13,14,15].
To further improve the specific strength and wear resistance of Mg alloys without compromising ductility, various Mg matrix nanocomposites, in which different nanoscale fillers such as SiC, Al2O3 nanoparticles, and carbonaceous reinforcements (carbon nanotubes and graphene) are added into Mg-based matrices, have been developed [16,17,18,19,20]. The introduction of micron-sized reinforcements into Mg alloys is generally accompanied by serious deterioration of the ductility. Among many potential nanoscale reinforcements, graphene nanoplatelets (GNPs) consisting of a few two-dimensional single graphene layers, where the carbon atoms are densely packed in a hexagonal lattice, have been widely considered to be one of the most effective fillers for Mg matrix composites due to the extraordinary physical and mechanical properties of graphene [21,22,23,24,25]. Along with their strengthening effect, the inherent solid lubrication effect of 2D GNPs on Mg and its alloys due to the ease of shearing (weak van der Walls forces between layers) graphene layers during sliding was also reported, and the results showed that the friction and thus the wear rate of these composites could be significantly reduced with the addition of GNPs at temperatures up to 500 °C [26,27,28,29,30]. Nevertheless, the performance of composite materials is influenced by various factors, such as the fabrication method, reinforcement content, dispersion capability, dimensions, aspect ratio, alignment of reinforcements within the matrix, and interaction between the reinforcement and matrix. Achieving a uniform dispersion of GNPs in composites poses a well-known challenge due to their tendency to cluster, driven by their high surface-to-volume ratio and strong van der Waals forces. Additionally, their low surface activity results in insolubility in many matrices, creating a weak matrix–GNP interface. These clustered GNPs can act as sources of cracking, potentially reducing ductility and the effectiveness of strengthening mechanisms, particularly the Orowan strengthening and grain refinement effects on the microstructure.
Most studies on the fabrication of Mg-GNP nanocomposites focused on powder metallurgy routes, e.g., ball milling followed by sintering, which has proven efficiency in terms of providing a uniform dispersion of ultrafine particles in the matrix. Furthermore, it is sometimes inevitable to employ casting for the mass production of complex-shaped engineering components. However, in this case, the clustering tendency of GNPs becomes more complicated owing to the poor wettability of carbon by liquid Mg, which will also decrease the matrix-reinforcement interfacial bonding, hence decreasing the strength. Therefore, the conventional stir casting method has been commonly adopted with several additional techniques, namely multi-step dispersion routes, such as disintegrated melt deposition [31] and ultrasonic agitation [32], to improve the degree of GNP dispersion in the performed works. In addition, it is noted that the application of such fabrication routes may be restricted for Mg-Al matrices due to the potential chemical attack between GNPs and molten Al as these form quite brittle Al4C3 interlayers deteriorating the interfacial bonding. The open literature sources suggest that the use of GNP reinforcement in Al-free Mg alloys has been rarely studied, and those studies employing powder-metallurgy-based fabrication methods concentrated on only the investigation of mechanical properties. Kumar et al. [10] found that the addition of 0.2 wt.% GNPs (6–10 nm in thickness and 15 µm in average lateral size) into Mg-3Sn alloy improved the microhardness and ultimate tensile strength by 7.8 and 9%, respectively. Wang et al. [33] reported that the yield strength and toughness of Mg-5.20Zn-0.33Zr (ZK60) alloy were enhanced with 0.1 wt.% GNP (3–10 nm in thickness, 1–7 µm in lateral size) content by 52 and 19%, respectively. However, to the best of our knowledge, no attempt has been made to investigate the effect of GNPs on the mechanical and wear behavior of Al-free Mg matrix composites fabricated by solidification processes to produce complex-shaped parts until now. Moreover, exploiting GNP-reinforced Al-free Mg-RE matrix nanocomposites for high-temperature applications and revealing their potential in the simultaneous enhancement of strength and wear performance is of great significance.
Accordingly, we attempted to first seek the feasibility of introducing the GNP reinforcement into an Al-free Mg-RE alloy under ultrasonic-assisted stir casting in the present work. The influence of GNP content on the microstructure, mechanical properties, and both ambient and elevated-temperature dry sliding wear behavior of the self-lubricating nanocomposites was investigated. The main wear mechanisms in the tested samples were also analyzed in conjunction with the worn surface examinations.
2. Experimental Section
ZE10 Mg alloy, which mainly contains Zn for the effective strengthening of Mg alloys via solid solution and precipitation hardening along with some REs, was chosen as the matrix material for the composite fabrication, and its chemical composition is given in Table 1, based on arc spark optical emission spectrometry (Ametek-Spectro, Spectrolab M9, Chelmsford, MA, USA). Commercially available GNPs (99% purity and 100 m2/g BET surface area) with a thickness of 10–20 nm and 14 µm average lateral size were utilized as the reinforcement.

Table 1.
Chemical composition of ZE10 alloy (wt.%).
As schematically illustrated in Figure 1, the fabrication of the self-lubricating nanocomposites consisted of two stages. In the first stage, approximately 1.5 kg of the ZE10 alloy was melted in a steel mold (110 mm diameter and 150 mm height) at 700 °C using an electric resistance furnace, and mechanical mixing was applied with a steel stirrer at 1000 rpm for 5 min. Meanwhile, the GNPs were introduced into the molten matrix via a vortex generated by mechanical stirring. In the second stage, the molten composite was ultrasonically agitated with a sonicator (Hielscher UIP 1500 hd with a titanium sonotrode, in which the amplitude was set to 30 µm) for an additional 5 min along with mechanical stirring. The Ar/1%SF6 gas was used for shielding during the composite casting process. As soon as the stirrer and sonotrode were removed from the melt, the mold containing the liquid nanocomposite was directly submerged into a water tank for rapid solidification to retain the distribution of GNPs since they tend to be pushed ahead of the solidification front and form clusters at the grain boundaries in the case of conventional solidification. The casting temperature was selected based on the use of an open casting system, which permits mechanical and ultrasonic stirring. To prevent equipment damage from high temperatures, it was decided not to surpass 700–750 °C. Following the stirring process (where the reinforcement is incorporated into the matrix), the temperature could have been increased to enhance the wettability before solidification. However, this would have required additional time, and there was a risk of reinforcement agglomeration. Therefore, the decision was made to promptly solidify the melt after the stirring was finished to maintain dispersed reinforcements.
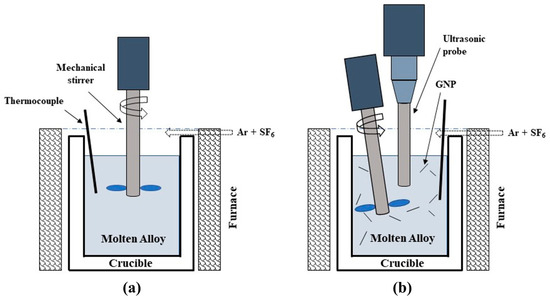
Figure 1.
Schematic experimental setup for (a) stir casting for 5 min and (b) ultrasonic-assisted stir casting for an additional 5 min to uniformly disperse the GNPs into ZE10 alloy.
The self-lubricating nanocomposites were fabricated with approximately 0.25, 0.5, and 1.0 wt.% GNP contents. The choice of reinforcement content was based on the authors’ previous experience which resulted in GNPs floating on the surface and led to a significant clustering at contents above 1 wt.%. On the other hand, at very low contents (<0.2 wt.%), it is difficult to observe any change in the properties considering potential losses during handling and production. Therefore, we limited the contents of GNPs used between 0.25 and 1.0 wt.%. Unreinforced ZE10 reference alloy was also prepared based on similar processing parameters used in the nanocomposite fabrication for comparison purposes.
The bulk densities of the cast matrix alloy and nanocomposites were quantified according to Archimedes’ principle in order to evaluate their porosity levels. The metallographic samples that were cut from the castings were ground and polished with grinding papers ranging from 400 to 2500 grit size and a 1-micron water-free diamond suspension, respectively. The polished samples were then subjected to etching for a few seconds in an acetic picral solution to determine the average grain sizes based on the linear intercept method. The microstructural examinations were carried out using an optical microscope (Leica DMI5000, Leica, Wetzlar, Germany) and scanning electron microscope (SEM, FEI Quanta FEG 250, Madrid, Spain and Hitachi TM1000, Hitachi, Tokyo, Japan) equipped with an energy dispersive X-ray spectroscopy (EDX) instrument. The phase identification of the cast samples was accomplished using an X-ray diffractometer (XRD, Philips X’pert PRO from PANalytical with Siemens Bruker D5005 analyzer) with the following diffraction parameters: Cu Kα radiation (30 mA, 40 kV, λ = 0.1542 nm) in a θ − 2θ° scan with a step size of 0.02° and a count time of 0.4 s.
Eight Vickers hardness (HV) measurements were performed on each set of cast samples under a load of 3 kg at room temperature (RT) and 100 and 200 °C using a tribometer (CETR-Bruker equipped with a Vickers HT Mitutoyo indenter). This selected temperature range is thought to be comparable to the temperatures at which many commercial Mg alloys operate. For the determination of the mechanical properties, dog-bone-shaped tensile specimens with 6 mm gauge diameter and 30 mm gauge length were machined from the castings based on the DIN 50125 standards. Five tensile specimens were tested under a strain rate of 10−3 s−1 using a universal testing machine at RT.
Disc specimens of 15 mm diameter and 7 mm height were cut from fabricated materials for the investigation of their dry uni-directional circular sliding wear response via a ball-on-disc test. The disc surfaces were polished down to 1 µm finish and cleaned with acetone to remove any contamination. The device used for the hardness tests was also employed in the wear tests at the same temperature range. The discs were worn three times (average value reported) for each case against a fresh 10 mm diameter 10 r6 steel ball with a hardness of 62 HRC under 2 N normal load along a wear track with a radius of 5 mm, and the coefficient of friction (CoF) values versus time were recorded. The sliding speed and distance were 0.1 m/s and 300 m, respectively. The tests were performed at RT, 100 °C, and 200 °C. The heating rate was 6 °C/min. The test procedure and apparatus details can be found in our previously published report [34]. The volume loss and worn surface analyses were performed utilizing a 3D profilometer (Bruker Contour GT-K) and SEM equipped with EDX, respectively, following the completion of wear tests.
3. Results and Discussion
3.1. Material Characterization
The polarized optical microstructural images of the ZE10 reference alloy and GNP-reinforced self-lubricating nanocomposites, which reveal the grain sizes and morphology, are presented in Figure 2. It is evident from this figure and the calculated average grain sizes and porosity rates in Table 2 that the incorporation of GNPs into the ZE10 alloy led to considerable grain coarsening and increased porosity rate. Contrary to the grain refinement usually seen in metal matrix nanocomposites with reinforcement addition [35], the grain coarsening observed here is consistent with the results of an earlier study on SiC-nanoparticle-reinforced ZE10 composites [36]. The grain coarsening due to the GNP additions could be attributed to the deactivation of Zr with an alloy content of 0.065 wt.% (Table 1) as Zr is likely to form stable compounds with some elements including C and suppress the grain refining effects of both Zr and GNPs [37,38]. The increased number of micro-voids is thought to be related to the potential air entrapment and agglomeration tendency of GNPs at increasing contents due to their high specific surface area and poor wettability by liquid Mg. The SEM micrographs of the ZE10 alloy and ZE10/GNP self-lubricating nanocomposites in Figure 3 illustrate the reinforcement distribution throughout the matrix alloy with apparent clusters. The EDX analysis in Figure 3e suggests that the C-element-rich dark area (Spot 1) may correspond to a single or a small cluster of GNPs that was evenly embedded into the matrix. It is also noticed that the secondary phases containing rare earth and other alloying elements generally accumulated around those GNPs in all nanocomposites as exemplified in Spot 2 (Figure 3e). This could indicate that the GNPs were mainly pushed into the secondary phases rather than primary Mg grains at the solidification front, thus leading to coarser grains degrading the grain pinning effect. In addition, the presence of GNPs in the composites was confirmed by the XRD patterns of unreinforced alloy and ZE10/GNP self-lubricating nanocomposites as shown in Figure 4. Apart from the α-Mg phase, the GNPs were identified as single peaks at approximately 26 degrees in the XRD analysis of nanocomposites.
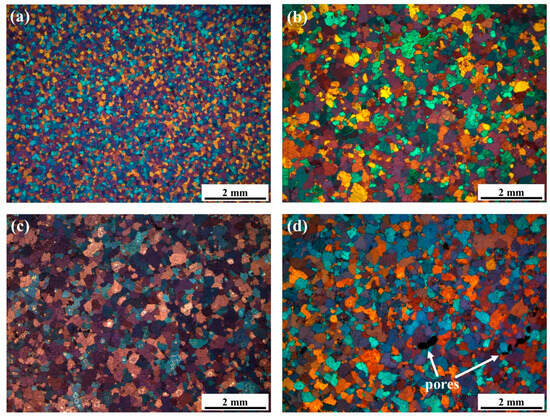
Figure 2.
Optical macrographs of cast (a) ZE10 reference alloy, (b) ZE10/0.25 wt.%GNP, (c) ZE10/0.5 wt.%GNP, and (d) ZE10/1.0 wt.%GNP nanocomposites.

Table 2.
Average grain sizes and porosity rates of cast matrix and nanocomposite samples.
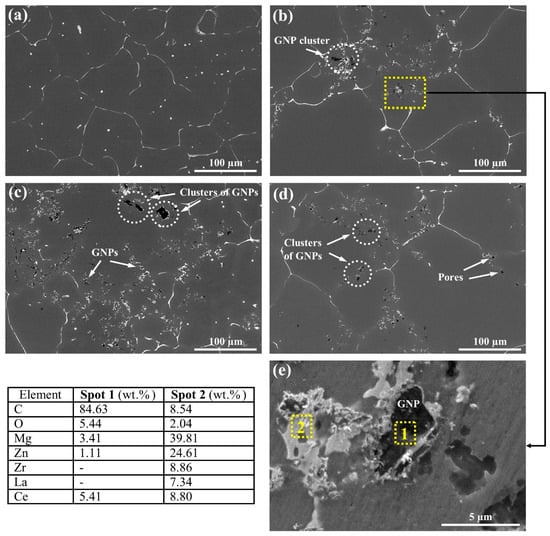
Figure 3.
SEM images of cast (a) ZE10 reference alloy, (b) ZE10/0.25 wt.%GNP, (c) ZE10/0.5 wt.%GNP, and (d) ZE10/1.0 wt.%GNP nanocomposites and (e) EDX analysis of a selected region in the ZE10/0.25 wt.%GNP nanocomposite (b).
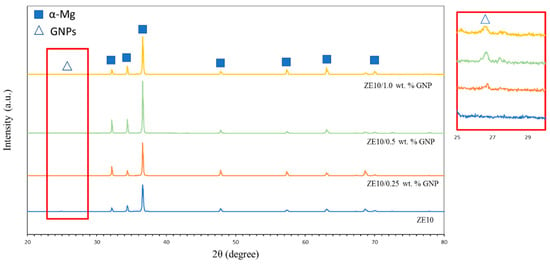
Figure 4.
XRD patterns of ZE10 reference alloy and ZE10/GNP nanocomposites.
3.2. Mechanical Properties
Figure 5 shows the Vickers hardness values (averaged) of the ZE10 reference alloy and GNP-reinforced nanocomposites at various temperatures. A consistent reduction in hardness is observed for all alloys with rising temperatures. This observation indicates the absence of any abrupt decline in hardness due to thermal softening within the specified temperature range and points to a better quality of fabricated samples. As can be seen in the figure, the hardness of the ZE10 matrix alloy was improved by 23% and 34% compared to those of both the ZE10/0.25 wt.%GNP and ZE10/0.5 wt.%GNP nanocomposites and ZE10/1.0 wt.%GNP nanocomposites, respectively, at RT. It is known that there are two major effects on the hardness and strength enhancement in metal matrix composites reinforced with nano-sized fillers. These are grain refinement and hindered dislocation motion (also known as Orowan strengthening) by harder reinforcement additions [39]. Since the grain coarsening was observed with increasing GNP contents in the present study, Orowan strengthening is therefore expected to play the main role in the hardness improvement [40]. However, the hardening by GNPs appeared to be limited at the contents above 0.25 wt.% at RT and 100 °C, which can be attributed to inefficiencies in distributing the clusters or any caused agglomerations of GNPs (Figure 3) and increased porosity level (Table 2). In addition, all samples exhibited similar hardness values at 200 °C possibly due to matrix softening.
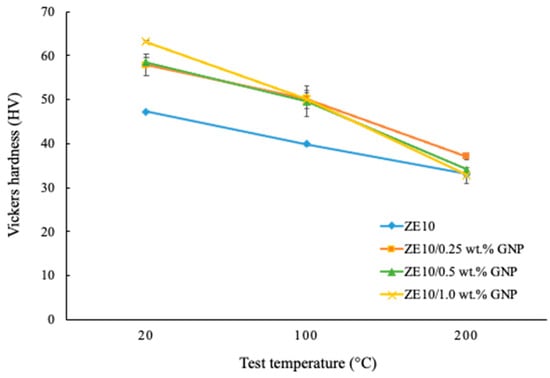
Figure 5.
Hardness values of ZE10 reference alloy and ZE10/GNP nanocomposites at various test temperatures.
Table 3 displays the average values of 0.2% proof stress (PS), ultimate tensile strength (UTS), and failure strain for the unreinforced ZE10 matrix alloy and self-lubricating nanocomposites. The representative stress versus strain curves of four different samples at RT are also presented in Figure 6. It is clear that the incorporation of GNPs into the ZE10 matrix did not enhance the 0.2% PS and invariably decreased the UTS and ductility. The highest average 0.2% PS value of ZE10/0.25 wt.%GNP composite compared to those of all nanocomposites is likely to be due to its lowest porosity level and clustering of reinforcements, as stated earlier. Furthermore, the observed decreasing ductility with increasing reinforcement contents is an expected outcome as the brittle GNPs tended to agglomerate, diminishing the interfacial bonding efficiency [41]. Such agglomerates are illustrated in the tensile fracture surfaces of composite samples in Figure 7b–d. It is noted that all samples exhibited both cleavage steps and dimples with tear ridges resulting in the combination of brittle and ductile fractures. Based on the dimples and tear ridges that were noticed in the vicinity of GNP agglomerates (Figure 7c,d), it is thought that those agglomeration sites were unlikely to provide sufficient resistance to crack propagation during loading. Considering the grain coarsening by GNP additions, casting defects, matrix-reinforcement incorporation, and wetting issues, it is suggested that GNP addition could not impose significant effects on enhancing the tensile properties of the ZE10 alloy processed in the liquid state.

Table 3.
Tensile properties (averaged values) of ZE10 alloy and its nanocomposites reinforced with GNPs at RT.
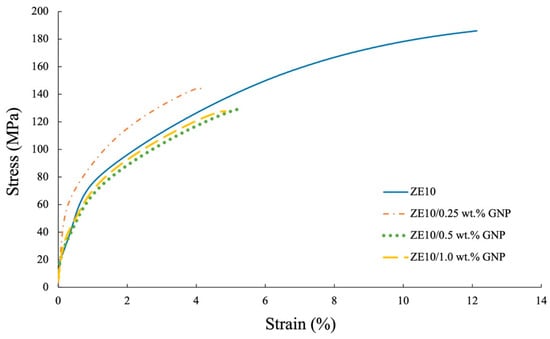
Figure 6.
Representative tensile stress–strain curves of ZE10 alloy and its nanocomposites reinforced with GNPs.
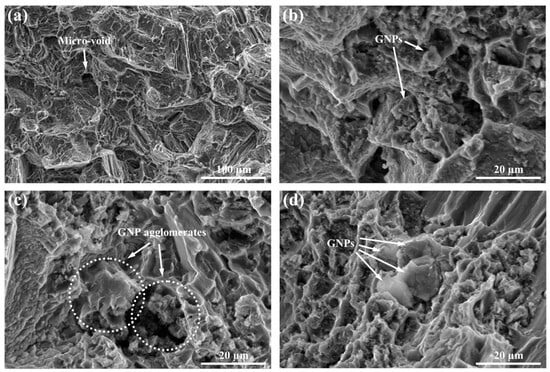
Figure 7.
SEM images of fracture surface morphology of tensile samples: (a) ZE10 reference alloy, (b) ZE10/0.25 wt.%GNP, (c) ZE10/0.5 wt.%GNP, and (d) ZE10/1.0 wt.%GNP nanocomposites.
3.3. Tribological Properties
Figure 8 shows the average COF values recorded during the sliding wear tests of all specimens at various temperatures. It is seen that the introduction of GNPs positively affects the CoF of the ZE10 Mg alloy, lowering and stabilizing it at all sliding temperatures. The reduction in CoF value was approximately 12% at RT and 100 °C and 20% at 200 °C. This could be due to the favorable effect of graphene’s solid lubricity and due to the formation of protective and self-lubricating tribofilm surfaces, as reported in previous studies [30,42,43,44]. Nonetheless, the nanocomposites with 0.25 and 0.5 wt.% GNPs generally exhibited the lowest CoF accompanied by lower deviations in values over all temperature ranges, implying a fair repeatability of the results compared to 1.0 wt.% GNP. Moreover, this also points to the fact that the self-lubricating behavior declines above 0.5 wt.% GNP addition, possibly due to the limitations imposed by GNP agglomeration in the nanocomposites. It is interesting that the CoF values of nanocomposites and the reference alloy distinctly increased at 100 °C by ~40% (~0.47, for Mg-GNPs) compared with their corresponding values at RT (~0.34, for Mg-GNPs). This could be explained by the metal softening which further reduces the interfacial strength and raises the number of microscopic asperities, hence raising the apparent surface contact area at elevated temperatures [45,46]. However, at 200 °C, all the nanocomposites demonstrated a very stable CoF around ~0.25.
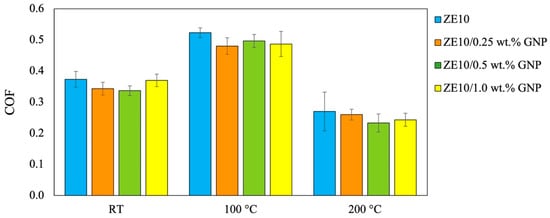
Figure 8.
Comparison of the COF values of the samples based on varying GNP content and test temperature.
In terms of the friction evolution curve (Figure 9), a distinct trend can be noticed for the materials sliding at varied temperatures. In the case of RT sliding, a shorter running-in period of around 800 s was evident, and the nanocomposites stabilized around ~0.33 for the rest of the tests. With the increase in test temperature to 100 °C, the CoF values of all samples initially appeared to be around 0.2 but steadily rose in the closer range until 800 s (initial running-in), followed by a sharp rise (final running-in), and stabilized at around 1600 s at the CoF value of ~0.47, hence indicating a total running-in lasting around 1600 s. It could be assumed that the contact surface at this stage is covered by environmental pollutants and tends to undergo preconditioning (of microgeometry) before the actual mating surface can be conformed/reached [47,48]. Running-in is usually characterized by an unsteady friction stage and substantial wear/material removal, as seen for nanocomposites sliding at RT and 100 °C (Figure 9).
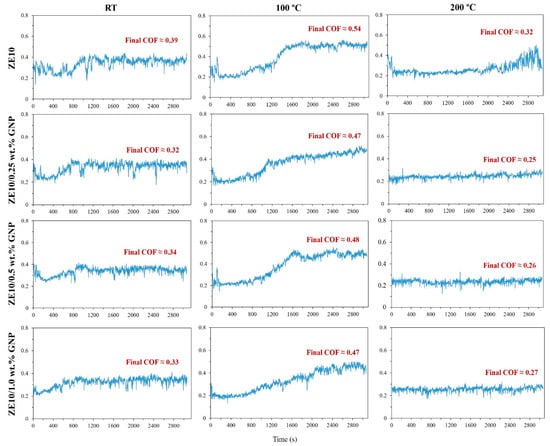
Figure 9.
Representative COF versus sliding time curves of ZE10 alloy and its nanocomposites during their ball-on-disc wear tests.
At a temperature of 200 °C, all specimens exhibited their lowest and most consistent CoF. Elevated temperatures can lead to the formation of graphene-rich tribolayers (graphene as a 2D material offers low shear stress and, thus, easy sliding) on mating surfaces, resulting in decreased CoF due to their self-lubricating properties, preventing direct contact between mating surfaces. Tribolayer or film formation occurs due to the high shear forces induced by countersurface movement and localized heating, which causes the delamination, overlap, and welding together of GNPs [49]. Similar behavior for the formation of oxide layers on metal surfaces at elevated temperatures was also reported in the literature [50,51,52]. Consequently, in our study, the increase in test temperature from 100 °C to 200 °C is likely to accelerate the rate of protective tribolayer formation, leading to the creation of more stable GNP-based tribofilms and a significant reduction in CoF values for the samples. The preservative characteristics of GNPs have been documented to endure up to approximately 500 °C. Beyond this temperature threshold, GNPs experience oxidation, leading to a deterioration in their lubricating properties [53]. Notably, there was no observable running-in phase for the nanocomposites at this stage. In contrast, the unmodified reference Mg alloy experienced a running-in period lasting approximately 200 s, marked by an initial peak in CoF value of around 0.4, which later stabilized to approximately 0.25 before rising to about 0.4 by the end of the test. Furthermore, the self-lubricating nanocomposites demonstrated a remarkably stable CoF evolution, maintaining a value of around 0.25, as opposed to the pronounced fluctuations observed in the reference alloy after 1800 s of sliding. This hints towards better performance of GNPs as HT lubricant (especially at 200 °C) aiding in a smoother transition. The lack of running-in and smooth frictional transitions for similar sliding conditions for the solid lubricated samples have been described by co-authors in their previous studies [48,54].
The volumetric wear loss of all samples tested at the indicated temperatures is presented in Figure 10. The wear resistance of both the reference alloy and GNP nanocomposites gradually improved as the test temperature was elevated. This observation is consistent with the results of previous investigations which suggest that a protective tribolayer could govern the wear behavior of Mg alloys below a normal load of 25 N based on the same contact geometry at wear temperatures up to 250 °C [50,51,55]. EDX analysis (Figure 11) indicated the presence of oxygen on the wear track surface following elevated-temperature sliding, likely resulting from surface oxidation during sliding. It is believed that these generated oxides underwent compaction, as observed in SEM images, contributing to the formation of a tribolayer and a reduced wear rate. It is worth noting that oxides of graphene possess solid lubricant properties due to their layered structure, facilitating easy sliding between layers. Additionally, the formation of certain solid oxides like zinc oxide (ZnO) can probably enhance lubrication due to their high ionic potential, which correlates with lower friction coefficients [56,57].
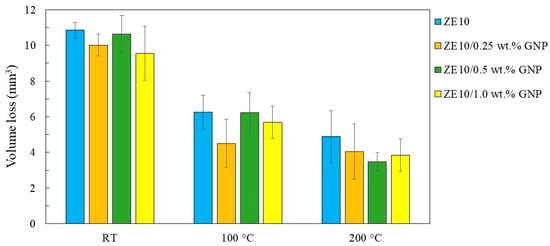
Figure 10.
Volume loss values of ZE10 reference alloy and ZE/GNP nanocomposites after wear tests at various temperatures.
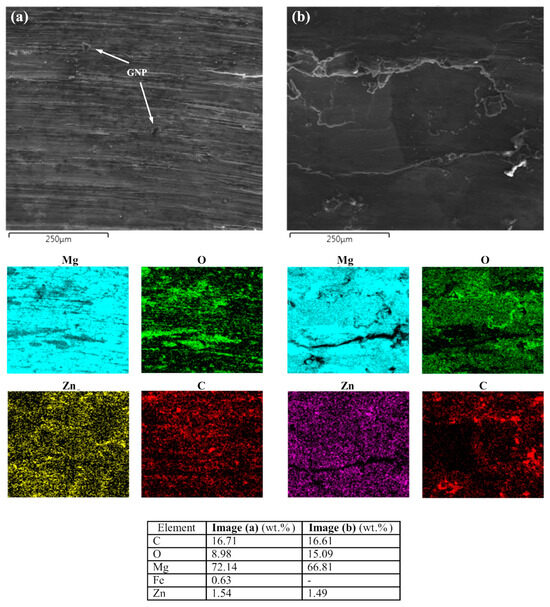
Figure 11.
EDX elemental mapping and analysis of wear scars in the surface of ZE10/0.25 wt.%GNP nanocomposite discs after the wear tests at (a) 100 °C and (b) 200 °C.
The nanocomposites reinforced with GNPs displayed a relatively lower wear rate compared to the ZE10 reference alloy at all test temperatures, which suggests the favorable effect of GNPs on enhancing wear resistance. If compared to the ZE10 reference alloy at RT, the nanocomposites showed a decrease in the wear rate ranging from 2% to 12%, and the ZE10/1.0 wt.%GNP sample had the lowest wear rate value (average) with the largest deviation that is likely to be due to the higher porosity rate and GNP clusters (agglomeration). This trend is consistent with the hardness test outcomes at RT (Figure 5). At 100 °C, the ZE10/0.25 wt.%GNP sample displayed about 28% wear rate reduction compared to that of the ZE10 alloy, while the calculated volumetric loss of nanocomposites with 0.5 wt.% and 1.0 wt.% GNPs decreased by only 1% and 9%, respectively. The significant improvement in the wear resistance of 0.25 wt.% GNP composite can be attributed to the relatively homogeneous and effective reinforcement distribution into the matrix. However, the composite having 0.5 wt.% GNPs showed the highest wear resistance among all samples with about 29% volumetric loss reduction compared to that of the reference alloy at 200 °C. Furthermore, the samples with 0.25 wt.% and 1.0 wt.% GNPs exhibited a decrease in the volume loss of around 17% and 22%, respectively. It is likely that the contact surface of the ZE10/0.5 wt.%GNP sample was covered by more graphene flakes as a solid lubricant and the oxidation played a substantial role in the enhancement of wear resistance like in the CoF results when the temperature rose to 200 °C. Notably, the trend for the wear volume loss of nanocomposites is in agreement with their CoF values at 200 °C (Figure 8). It is noteworthy that both the reference alloy and the nanocomposites exhibit an enhanced wear rate as the test temperature rises, indicating the high-temperature stability of the matrix. However, this improvement in the case of reference alloy comes at the cost of an unstable evolution of friction and unfavorable wear mechanisms, particularly at 200 °C, attributed to the absence of graphene’s lubricating effect. Additionally, occasional longer running-in periods are observed for the reference alloy. In contrast, GNP nanocomposites prove advantageous, showcasing consistent and low friction with almost no running-in, especially at 200 °C. In addition, protective occurring mechanisms of wear (explained later) can be seen in Figure 12 and Figure 13 for the nanocomposites, hinting towards protection of both the tribo-pairs.
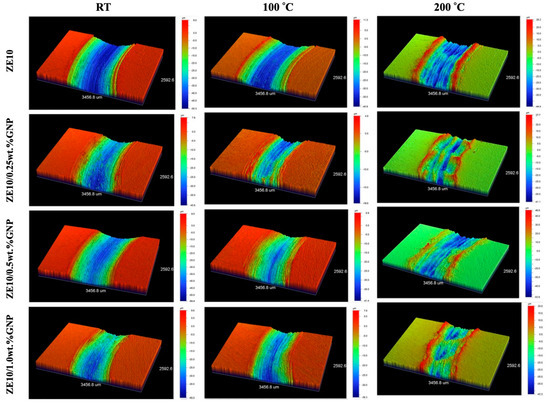
Figure 12.
Three-dimensional cross-sectional profilometer images of ZE10 alloy and its GNP-reinforced nanocomposites after the wear tests at indicated temperatures (in this representation, each row corresponds to a specific material, while the columns represent different sliding temperatures).
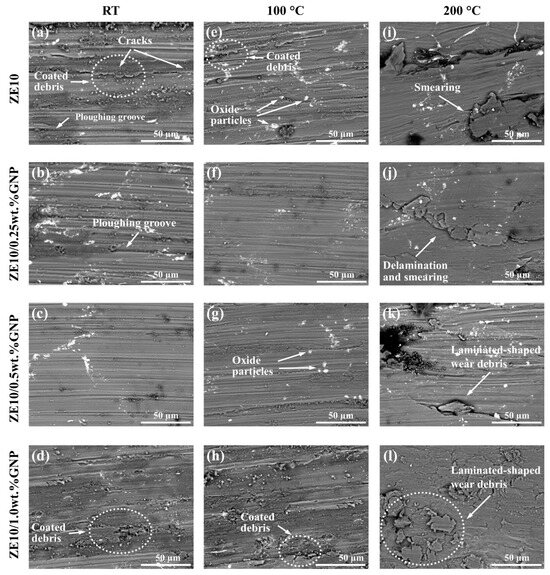
Figure 13.
SEM worn surface images of the reference alloy and ZE10 matrix composites at various GNP contents and indicated test temperatures (in this representation, each row corresponds to a specific material, while the columns represent different sliding temperatures): (a) ZE10, RT, (b) ZE10/0.25 wt% GNP, RT, (c) ZE10/0.5 wt% GNP, RT, (d) ZE10/1.0 wt% GNP, RT, (e) ZE10, 100 °C, (f) ZE10/0.25 wt% GNP, 100 °C, (g) ZE10/0.5 wt% GNP, 100 °C, (h) ZE10/1.0 wt% GNP, 100 °C, (i) ZE10, 200 °C, (j) ZE10/0.25 wt% GNP, 200 °C, (k) ZE10/0.5 wt% GNP, 200 °C, (l) ZE10/1.0 wt% GNP, 200 °C.
Figure 12 shows the representative 3D profilometer images of all samples presented for each wear test temperature. As can be seen, while the ZE10/1.0 wt.%GNP samples showed the minimum wear scar depth at RT, the ZE10/0.25 wt.%GNP sample possessed the narrowest wear scar at 100 °C, which is consistent with the wear loss results. It can be noticed that the profilometer images of samples worn at 200 °C have non-uniform wear scars with intermittent hollow zones. This non-steady wear is possibly due to the samples undergoing substantial softening at elevated temperatures [58], resulting in the low-strength alloy and composites not being able to support the oxide layers against the hard abrasive ball during sliding.
Figure 13 displays the SEM images of the worn surfaces of unreinforced and GNP-reinforced Mg alloy discs at all test temperatures. The plastic deformation and scratch marks on all worn surfaces, which suggest the abrasive wear mechanism, were found to be parallel to the sliding direction. The worn surfaces of both the reference alloy and nanocomposites against the counterpart balls reveal long trenches and micro-plowing grooves, indicating two-body and three-body abrasion wear [59,60]. Nevertheless, the worn surfaces of the nanocomposites containing 0.25 and 0.5 wt.% GNPs, as depicted in Figure 13b,c, exhibit smoother surfaces with reduced wear debris compared to both the reference alloy and the composite with 1.0 wt.% GNPs at RT. This observation remains consistent at 100 °C, as shown in Figure 13e–h. Such a phenomenon can be attributed to the hindrance of subsurface crack propagation, facilitated by the relatively homogeneous dispersion of lower GNP contents and their lubricating effect. However, with the increase in temperature, especially at 200 °C, the worn surface demonstrates less expanse and severity of plow marks, but several patches of material delaminating (transfer) the surface could be seen.
Nearly all surfaces showed oxide-rich particles (e.g., Figure 13e,g). At low temperatures, the Mg-rich oxide layers formed on the discs are likely to be broken (fatigue) into particles during sliding, and such hard oxidized particles with potential inclusions may act as abradants between the discs and balls, inhibiting their direct contact for three-body abrasion [61]. Alternatively, at high temperatures, hard oxide particles can be embedded into the discs or accumulated on the wear scars, forming a hard mechanically mixed layer with the help of mechanical action provided by moving bodies and protecting the underlying composite surface [62,63]. This may explain the decreased wear rate with increasing temperature with respect to the oxidation rate (increase in temperature).
As illustrated in Figure 13a for the reference alloy worn at RT, the surface and subsurface cracks could accumulate and lead to flaked or laminated wear debris, known as delamination. Such delamination patches may imply that the adhesive wear mechanism came into play [64]. It is known that adhesive wear is most likely to occur in the case of metal–metal contact, especially at elevated temperatures (can be also caused by frictional heating in RT sliding) [65]. It is possible that at elevated temperatures, the accompanying adhesive wear led to material/debris transfer on the surface of the composite which then underwent compression during successive sliding passes. This partially compressed debris (hard oxide) may have contributed to the tribolayer and hence protected the mating surface from contacting and reducing wear. On the other hand, GNP layers (in tribolayer) acted as a lubricant and led to the lowering of shear stress, hence reducing friction. Altogether, it is believed the hard compressed oxide and GNPs in the tribolayer led to a decrease in wear and friction, respectively.
The adhesive wear mechanism was confirmed by the EDX analysis of a steel ball as shown in Figure 14 after the wear testing of ZE10/0.25 wt.%GNP composite disc at 100 °C. The relatively high level of Mg in the analysis implies a high degree of material transfer, and hence adhesion wear, as does the Fe content observed in the EDX analysis of Image (a) for a worn disc in Figure 11. The material transfer is believed to prohibit real contact surface mating and thus offer protection to the underlying contact surface.
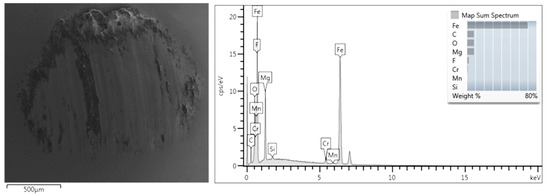
Figure 14.
EDX analysis of the worn surface of the counterpart ball against ZE10/0.25 wt.%GNP nanocomposite disc at 100 °C test temperature.
Like the observations in the 3D wear scar images in Figure 12, the disc surfaces worn at 200 °C appeared to be relatively rough with significant laminated-shaped wear debris compared to those at RT and 100 °C (Figure 13i–l). It can be suggested that the considerable softening of matrix alloy at 200 °C led to the peeling off (delamination) of the material from the disc surfaces in the form of layered sheets by promoting the expansion of subsurface microcracks [66]. Further, the peeling wear could have been followed by material smearing, as the exfoliated pieces of material are likely to be compacted on the surface of discs during successive sliding passes. Along with the significant oxidation at 200 °C (Figure 11), such compressed debris resulted in the formation of a tribolayer and in turn protected the surface from further wear, which can explain the relatively low volume loss of the samples at elevated temperatures (Figure 10). Therefore, smearing is the dominant wear mechanism at 200 °C.
4. Conclusions
Unreinforced ZE10 alloy and ZE10 matrix nanocomposites reinforced with 0.25, 0.5, and 1.0 wt.% GNP contents were fabricated by ultrasound-assisted stir casting. The effects of GNP contents on the microstructural, mechanical, and wear properties, both at RT and elevated temperatures (100 and 200 °C), were studied. The major conclusions can be listed as follows:
- The microstructural analysis showed that the incorporation of GNPs into ZE10 Mg alloy results in grain coarsening, higher porosity rate, and clustering tendency for increasing GNP contents.
- The addition of GNPs enhanced the hardness of the reference alloy at RT and 100 °C, but had less impact at 200 °C. The average yield strength of the ZE10/0.25 wt.%GNP composite slightly rose, while those of nanocomposites with 0.5 and 1.0 wt.% GNPs decreased due to higher porosity and reinforcement clustering. Additionally, the UTS and ductility of the nanocomposites consistently decreased with higher GNP content.
- The inclusion of GNPs resulted in a considerable reduction in the CoF in ZE10 Mg alloy at all test temperatures, attributed to the solid lubricating influence of GNPs. As the test temperature increased, both the reference alloy and nanocomposites exhibited a gradual decrease in wear rate. The nanocomposites showed an improved wear rate in comparison to the reference alloy at all test temperatures.
- At RT and 100 °C, adhesion and abrasion were the primary wear mechanisms. However, at 200 °C, the predominant wear modes shifted to delamination and smearing, coupled with cyclic material transfer and tribolayer compaction phenomena (protective).
- The ZE10/0.25 wt.%GNP nanocomposite can be suggested to be a promising material providing a favorable blend of mechanical properties and effective resistance to wear at both room and elevated temperatures. This is attributed to the relatively effective distribution of GNPs and the low rate of porosity.
Author Contributions
Conceptualization, S.K. and H.D.; methodology, S.K., M.A and H.D.; software, S.K.; validation, S.K., R.K. and M.A.; formal analysis, S.Y.; investigation, S.K. and S.Y.; resources, S.K., M.A. and H.D.; data curation, S.Y.; writing—original draft preparation, S.K.; writing—review and editing, S.K., R.K., M.A. and H.D.; visualization, S.K., R.K. and M.A.; supervision, S.K., M.A. and H.D.; project administration, S.K., M.A. and H.D.; funding acquisition, S.K., M.A. and H.D. All authors have read and agreed to the published version of the manuscript.
Funding
The German Academic Exchange Service (DAAD) is thanked for providing a scholarship to Sinan Kandemir during his stay at Helmholtz-Zentrum Hereon (HZH), formerly known as Helmholtz-Zentrum Geesthacht, for casting the samples. The EU Erasmus+ student exchange program is also acknowledged for providing Sibel Yöyler the opportunity to perform wear-related experiments at Tallinn University of Technology. Also, this work was partially supported by the Estonian Research Council grant PRG643 and M-ERA.Net project “DuplexCer”.
Data Availability Statement
Data will be made available upon request from the corresponding author.
Conflicts of Interest
The authors declare no conflict of interest.
References
- Zhang, W.; Xu, J. Advanced lightweight materials for automobiles: A review. Mater. Des. 2022, 221, 110994. [Google Scholar] [CrossRef]
- Kulekci, M.K. Magnesium and its alloys applications in automotive industry. Int. J. Adv. Manuf. Technol. 2008, 39, 851–865. [Google Scholar] [CrossRef]
- Holmbeg, K.; Erdemir, A. The impact of tribology on energy use and CO2 emission globally and in combustion engine and electric cars. Tribol. Int. 2019, 135, 389–396. [Google Scholar] [CrossRef]
- Pollock, T.M. Weight loss with magnesium alloys. Science 2010, 328, 986–987. [Google Scholar] [CrossRef] [PubMed]
- Chen, L.Y.; Xu, J.Q.; Choi, H.; Pozuelo, M.; Ma, X.; Bhowmick, S.; Yang, J.M.; Mathaudhu, S.; Li, X.C. Processing and properties of magnesium containing a dense uniform dispersion of nanoparticles. Nature 2015, 528, 539–543. [Google Scholar] [CrossRef] [PubMed]
- Qin, J.; Shi, X.; Li, H.; Zhao, R.; Li, G.; Zhang, S.; Ding, L.; Cui, X.; Zhao, Y.; Zhang, R. Performance and failure process of green recycling solutions for preparing high degradation resistance coating on biomedical magnesium alloys. Green Chem. 2022, 24, 8113–8130. [Google Scholar] [CrossRef]
- Chen, S.S.; Song, P.D.; Yin, J.; Qi, K.; Li, H.D.; Hou, L.; Li, W.H. Enhancement of Plasticity and Biocorrosion Resistance in a Plasma Electrolytic Oxidation-Treated Mg-Based Amorphous Alloy Composite. J. Mater. Eng. Perform. 2023, 32, 2298–2306. [Google Scholar] [CrossRef]
- Hakamada, M.; Furuta, T.; Chino, Y.; Chen, Y.; Kusuda, H.; Mabuchi, M. Life cycle inventory study on magnesium alloy substitution in vehicles. Energy 2007, 32, 1352–1360. [Google Scholar] [CrossRef]
- Tan, J.; Ramakrishna, S. Applications of magnesium and its alloys: A review. Appl. Sci. 2021, 11, 6861. [Google Scholar] [CrossRef]
- Kumar, P.; Skotnicova, K.; Mallick, A.; Gupta, M.; Cegan, T.; Jurica, J. Mechanical characterization of graphene nanoplatelets-reinforced Mg-3Sn alloy synthesized by powder metallurgy. Metals 2021, 11, 62. [Google Scholar] [CrossRef]
- Regev, M.; Rosen, A.; Bamberger, M. Qualitative model for creep of AZ91D magnesium alloy. Metall. Mater. Trans. A 2001, 32, 1335–1345. [Google Scholar] [CrossRef]
- Sklenička, V.; Kuchařová, K.; Svoboda, M.; Saxl, I. Creep fracture processes in magnesium metal matrix composites. In Proceedings of the 12th International Conference on Fracture, Ottawa, ON, Canada, 12–17 July 2009. [Google Scholar] [CrossRef]
- Luo, A.A. Recent magnesium alloy development for elevated temperature applications. Int. Mater. Rev. 2004, 49, 13–30. [Google Scholar] [CrossRef]
- Pekguleryuz, M.; Celikin, M. Creep resistance in magnesium alloys. Int. Mater. Rev. 2010, 55, 197–217. [Google Scholar] [CrossRef]
- Powell, B.R.; Rezhets, V.; Balogh, M.P.; Waldo, R.A. Microstructure and creep behavior in AE42 magnesium die-casting alloy. JOM 2002, 54, 34–38. [Google Scholar] [CrossRef]
- Rashad, M.; Pan, F.S.; Guo, W.; Lin, H.; Asif, M.; Irfan, M. Effect of alumina and silicon carbide hybrid reinforcements on tensile, compressive and microhardness behavior of Mg–3Al–1Zn alloy. Mater. Charact. 2015, 106, 382–389. [Google Scholar] [CrossRef]
- Matin, A.; Saniee, F.F.; Abedi, H.R. Microstructure and mechanical properties of Mg/SiC and AZ80/SiC nano-composites fabricated through stir casting method. Mater. Sci. Eng. A 2015, 625, 81–88. [Google Scholar] [CrossRef]
- Khandelwal, A.; Mani, K.; Srivastava, N.; Gupta, R.; Chaudhari, G.P. Mechanical behavior of AZ31/Al2O3 magnesium alloy nanocomposites prepared using ultrasound assisted stir casting. Compos. B Eng. 2017, 123, 64–73. [Google Scholar] [CrossRef]
- Yoo, S.J.; Han, S.H.; Kim, W.J. Magnesium matrix composites fabricated by using accumulative roll bonding of magnesium sheets coated with carbon-nanotube-containing aluminum powders. Scr. Mater. 2012, 67, 129–132. [Google Scholar] [CrossRef]
- Yuan, Q.; Zhou, G.; Liao, L.; Liu, Y.; Luo, L. Interfacial structure in AZ91 alloy composites reinforced by graphene nanosheets. Carbon 2018, 127, 177–186. [Google Scholar] [CrossRef]
- Chen, L.Y.; Konishi, H.; Fehrenbacher, A.; Ma, C.; Xu, J.Q.; Choi, H.; Xu, H.F.; Pfefferkorna, F.E.; Li, X.C. Novel nanoprocessing route for bulk graphene nanoplatelets reinforced metal matrix nanocomposites. Scr. Mater. 2012, 67, 29–32. [Google Scholar] [CrossRef]
- Rashad, M.; Pan, F.S.; Tang, A.T.; Lu, Y.; Asif, M.; Hussain, S.; She, J.; Gou, J.; Mao, J.J. Effect of graphene nanoplatelets (GNPs) addition on strength and ductility of magnesium–titanium alloys. J. Magnes. Alloys 2013, 1, 242–248. [Google Scholar] [CrossRef]
- Rashad, M.; Pan, F.; Tang, A.; Asif, M.; She, J.; Gou, J.; Mao, J.; Hu, H. Development of magnesium-graphene nanoplatelets composite. J. Compos. Mater. 2014, 49, 285–293. [Google Scholar] [CrossRef]
- Meng, L.; Hu, X.; Wang, X.; Zhang, C.; Shi, H.; Xiang, Y.; Liu, N.; Wu, K. Graphene nanoplatelets reinforced Mg matrix composite with enhanced mechanical properties by structure construction. Mater. Sci. Eng. A 2018, 733, 414–418. [Google Scholar] [CrossRef]
- Sun, X.; Li, C.; Dai, X.; Zhao, L.; Li, B.; Wang, H.; Liang, C.; Li, H.; Fan, J. Microstructures and properties of graphene-nanoplatelet-reinforced magnesium-matrix composites fabricated by an in situ reaction process. J. Alloys Compd. 2020, 835, 155125. [Google Scholar] [CrossRef]
- Berman, D.; Erdemir, A.; Sumant, A.V. Graphene: A new emerging lubricant. Mater. Today 2014, 17, 31–42. [Google Scholar] [CrossRef]
- Turan, M.E.; Sun, Y.; Akgül, Y.; Turen, Y.; Ahlatci, H. The effect of GNPs on wear and corrosion behaviors of pure magnesium. J. Alloys Compd. 2017, 724, 14–23. [Google Scholar] [CrossRef]
- Wu, L.; Wu, R.; Hou, L.; Zhang, J.; Zhang, M. Microstructure, mechanical properties and wear performance of AZ31 matrix composites reinforced by graphene nanoplatelets(GNPs). J. Alloys Compd. 2018, 750, 530–536. [Google Scholar] [CrossRef]
- Arab, M.; Marashi, S.P.H. Effect of graphene nanoplatelets (GNPs) content on improvement of mechanical and tribological properties of AZ31 Mg matrix nanocomposite. Tribol. Int. 2019, 132, 1–10. [Google Scholar] [CrossRef]
- Kumar, R.; Hussainova, I.; Rahmani, R.; Antonov, M. Solid lubrication at high-temperatures—A review. Materials 2022, 15, 1695. [Google Scholar] [CrossRef]
- Xiang, S.L.; Gupta, M.; Wang, X.J.; Wang, L.D.; Wu, K.; Hu, X.S. Enhanced overall strength and ductility of magnesium matrix composites by low content of graphene nanoplatelets. Compos. Part A 2017, 100, 183–193. [Google Scholar] [CrossRef]
- Xiang, S.; Wang, X.; Gupta, M.; Wu, K.; Hu, X.; Zheng, M. Graphene nanoplatelets induced heterogeneous bimodal structural magnesium matrix composites with enhanced mechanical properties. Sci. Rep. 2016, 6, 38824. [Google Scholar] [CrossRef]
- Wang, P.; Shen, J.; Chen, T.; Li, Q.; Yue, X.; Wang, L. Fabrication of graphene nanoplatelets reinforced Mg matrix composites via powder thixoforging. J. Magnes. Alloys 2022, 10, 3113–3132. [Google Scholar] [CrossRef]
- Martin, S.; Kandemir, S.; Antonov, M. Investigation of the high temperature dry sliding wear behavior of graphene nanoplatelets reinforced aluminum matrix composites. J. Compos. Mater. 2021, 55, 1769–1782. [Google Scholar] [CrossRef]
- Dieringa, H. Properties of magnesium alloys reinforced with nanoparticles and carbon nanotubes: A review. J. Mater. Sci. 2011, 46, 289–306. [Google Scholar] [CrossRef]
- Song, J.F.; Dieringa, H.; Huang, Y.D.; Gan, W.M.; Kainer, K.U.; Hort, N. Mechanical properties and microstructures of nano SiC reinforced ZE10 composites prepared with ultrasonic vibration. Adv. Mater. Res. 2014, 1019, 169–176. [Google Scholar] [CrossRef]
- St John, D.H.; Qian, M.; Easton, M.A.; Cao, P.; Hildebrand, Z. Grain refinement of magnesium alloys. Metall. Mater. Trans. A 2005, 36, 1669–1679. [Google Scholar] [CrossRef]
- Friedrich, H.E.; Mordike, B.L. Magnesium Technology; Springer: Berlin/Heidelberg, Germany, 2006. [Google Scholar]
- Kim, Y.; Lee, J.; Yeom, M.S.; Shin, J.W.; Kim, H.; Cui, Y.; Kysar, J.W.; Hone, J.; Jung, Y.; Jeon, S.; et al. Strengthening effect of single-atomic-layer graphene in metal–graphene nanolayered composites. Nat. Commun. 2013, 4, 2114. [Google Scholar] [CrossRef]
- Wan, Y.J.; Zeng, Y.; Dou, Y.C.; Hu, D.C.; Qian, X.Y.; Zeng, Q.; Sun, K.X.; Quan, G.F. Improved mechanical properties and strengthening mechanism with the altered precipitate orientation in magnesium alloys. J. Magnes. Alloys 2022, 10, 1256–1267. [Google Scholar] [CrossRef]
- Rashad, M.; Pan, F.; Tang, A.; Asif, M.; Hussain, S.; Gou, J.; Mao, J. Improved strength and ductility of magnesium with addition of aluminum and graphene nanoplatelets (Al + GNPs) using semi powder metallurgy method. Chemistry 2015, 23, 243–250. [Google Scholar] [CrossRef]
- Berman, D.; Erdemir, A.; Sumant, A.V. Few layer graphene to reduce wear and friction on sliding steel surfaces. Carbon 2013, 54, 454–459. [Google Scholar] [CrossRef]
- Xu, Z.; Shi, X.; Zhai, W.; Yao, J.; Song, S.; Zhang, Q. Preparation and tribological properties of TiAl matrix composites reinforced by multilayer graphene. Carbon 2014, 67, 168–177. [Google Scholar] [CrossRef]
- Hidalgo-Manrique, P.; Lei, X.; Xu, R.; Zhou, M.; Kinloch, I.A.; Young, R.J. Copper/graphene composites: A review. J. Mater. Sci. 2019, 54, 12236–12289. [Google Scholar] [CrossRef]
- Stott, F.H. High-temperature sliding wear of metals. Tribol. Int. 2002, 35, 489–495. [Google Scholar] [CrossRef]
- Li, J.; Zhang, X.; Geng, L. Effect of heat treatment on interfacial bonding and strengthening efficiency of graphene in GNP/Al composites. Compos. Part A Appl. Sci. Manuf. 2019, 121, 487–498. [Google Scholar] [CrossRef]
- Blau, P.J. On the nature of running-in. Tribol. Int. 2005, 38, 1007–1012. [Google Scholar] [CrossRef]
- Kumar, R.; Antonov, M.; Varga, M.; Hussainova, I.; Ripoll, M.R. Synergistic effect of Ag and MoS2 on high-temperature tribology of self-lubricating NiCrBSi composite coatings by laser metal deposition. Wear 2023, 532–533, 205114. [Google Scholar] [CrossRef]
- Zhang, C.; Nieto, A.; Agarwal, A. Ultrathin graphene tribofilm formation during wear of Al2O3–graphene composites. Nanomater. Energy 2016, 5, 1–9. [Google Scholar] [CrossRef]
- Zafari, A.; Ghasemi, H.M.; Mahmudi, R. Tribological behavior of AZ91D magnesium alloy at elevated temperatures. Wear 2012, 292–293, 33–40. [Google Scholar] [CrossRef]
- Zafari, A.; Ghasemi, H.M.; Mahmudi, R. An investigation on the tribological behavior of AZ91 and AZ91 + 3 wt% RE magnesium alloys at elevated temperatures. Mater. Des. 2014, 54, 544–552. [Google Scholar] [CrossRef]
- Mengis, L.; Grimme, C.; Galetz, M.C. High-temperature sliding wear behaviour of an intermetallic γ-based TiAl alloy. Wear 2019, 426–427, 341–347. [Google Scholar] [CrossRef]
- Xu, Z.; Zhang, Q.; Jing, P.; Zhai, W. High-temperature tribological performance of TiAl matrix composites reinforced by multilayer graphene. Tribol. Lett. 2015, 58, 3. [Google Scholar] [CrossRef]
- Chih, A.; Ansón-Casaos, A.; Puértolas, J.A. Frictional and mechanical behaviour of graphene/UHMWPE composite coatings. Tribol. Int. 2017, 116, 295–302. [Google Scholar] [CrossRef]
- Wang, S.Q.; Yang, Z.R.; Zhao, Y.T.; Wei, M.X. Sliding wear characteristics of AZ91D alloy at ambient temperatures of 25–200 °C. Tribol. Lett. 2010, 38, 39–45. [Google Scholar] [CrossRef]
- Erdemir, A. A crystal-chemical approach to lubrication by solid oxides. Tribol. Lett. 2000, 8, 97–102. [Google Scholar] [CrossRef]
- Chen, H.; Filleter, T. Effect of structure on the tribology of ultrathin graphene and graphene oxide films. Nanotechnology 2015, 26, 135702. [Google Scholar] [CrossRef] [PubMed]
- Wang, Y.; Wu, C.; Zhang, L.; Qu, P.; Li, S.; Jiang, Z. Thermal oxidation and its effect on the wear of Mg alloy AZ31B. Wear 2021, 476, 203673. [Google Scholar] [CrossRef]
- Varga, M. High temperature abrasive wear of metallic materials. Wear 2017, 376–377, 443–451. [Google Scholar] [CrossRef]
- Abdollahzadeh, A.; Bagheri, B.; Abbasi, M.; Sharifi, F.; Moghaddam, A.O. Mechanical, wear and corrosion behaviors of AZ91/SiC composite layer fabricated by friction stir vibration processing. Surf. Topogr. Metrol. Prop. 2021, 9, 035038. [Google Scholar] [CrossRef]
- Jiang, J.; Stott, F.H.; Stack, M.M. A generic model for dry sliding wear of metals at elevated temperatures. Wear 2004, 256, 973–985. [Google Scholar] [CrossRef]
- Pauschitz, A.; Roy, M.; Franek, F. Mechanisms of sliding wear of metals and alloys at elevated temperatures. Tribol. Int. 2008, 41, 584–602. [Google Scholar] [CrossRef]
- Li, X.Y.; Tandon, K.N. Microstructural characterization of mechanically mixed layer and wear debris in sliding wear of an Al alloy and an Al based composite. Wear 2000, 245, 148–161. [Google Scholar] [CrossRef]
- Suh, N.P. The delamination theory of wear. Wear 1973, 25, 111–124. [Google Scholar] [CrossRef]
- Kumar, R.; Torres, H.; Aydinyan, S.; Antonov, M.; Varga, M.; Ripoll, M.R.; Hussainova, I. Microstructure and high temperature tribological behaviour of self-lubricating Ti-TiBx composite doped with NiBi. Surf. Coat. Technol. 2022, 447, 128827. [Google Scholar] [CrossRef]
- Tang, F.; Pan, X.; Deng, Y.; Zhou, Z.; Zeng, G.; Xiao, S. Effect of rotational speed on tribological properties of carbon fiber-reinforced Al-Si alloy matrix composites. Lubricants 2023, 11, 142. [Google Scholar] [CrossRef]
Disclaimer/Publisher’s Note: The statements, opinions and data contained in all publications are solely those of the individual author(s) and contributor(s) and not of MDPI and/or the editor(s). MDPI and/or the editor(s) disclaim responsibility for any injury to people or property resulting from any ideas, methods, instructions or products referred to in the content. |
© 2024 by the authors. Licensee MDPI, Basel, Switzerland. This article is an open access article distributed under the terms and conditions of the Creative Commons Attribution (CC BY) license (https://creativecommons.org/licenses/by/4.0/).