Article

Response Modeling and Optimization of Process Parameters in Turning Medium Carbon Steel Under Minimum Quantity Lubrication (MQL) with Vegetable Oil and Oil Blends

Department of Industrial and Production Engineering, Bangladesh University of Engineering and Technology, Dhaka 1000, Bangladesh
*
Author to whom correspondence should be addressed.
Lubricants 2024, 12(12), 444; https://doi.org/10.3390/lubricants12120444
Submission received: 2 November 2024 / Revised: 1 December 2024 / Accepted: 4 December 2024 / Published: 12 December 2024
(This article belongs to the Special Issue Recent Advances in Green Lubricants)

Abstract

Machining is an important aspect of manufacturing. The application of cutting fluid in the field of engineering manufacturing has a history of hundreds of years, and it plays a vital role in the processing efficiency and surface quality of parts. The use of vegetable oil in machining operations is receiving attention currently for sustainable alternatives to mineral-based cutting oil. If the vegetable oil is applied through the minimum quantity lubrication (MQL) technique, it becomes more cost effective, eco-friendly, and sustainable. This study aims to investigate the effects (cutting force and temperature) of coconut oil, a coconut–rice bran oil blend, and a coconut–olive oil blend, and compare them with VG 68 oil using MQL. A magnetic stirrer was employed for mixing oils (coconut–rice bran oil and coconut–olive oil), performed at 40 °C and 250 rpm. The response parameter values were evaluated at different combinations of speed (78, 113.5, and 149 mm/min), feed (0.1, 0.13, and 0.16 mm/rev), and depth of cut (0.5, 0.75, and 0.1 mm). The design of the experiment (DOE) was created using the value of input parameters using response surface methodology (RSM). Percentage (%) reduction was calculated to compare the reduction in cutting force and temperature by using coconut oil, a coconut–rice bran oil blend, and a coconut–olive oil blend concerning mineral oil. Empirical models were developed for cutting force and temperature by RSM for the four cutting environments. The ANOVA result shows that the model performed satisfactorily for both temperature and force analysis. RSM-based optimization was carried out and the optimal solution was found at the cutting speed of 80.15 m/min, feed rate of 0.10 mm/min, and 0.5 mm depth of cut for the coconut–olive oil blend. Also, the model performed better in the reduction in force than temperature.

1. Introduction

Manufacturing companies have been striving to become more sustainable through green manufacturing for the past three decades, but there have been several obstacles in the way of reaching this goal [1]. Industries involved in manufacturing are important stakeholders because of the substantial impacts they have on the environment. The majority of these businesses understand the importance of environmental protection and are actively working to address these issues. The future of environmentally friendly production is one in which all negative effects are eliminated [2]. Therefore, environmental features must be guaranteed by manufacturing sectors without disrupting the economic or social components of the business [3], making green manufacturing practices an essential part of sustainable manufacturing.
A vital part of manufacturing is machining. It involves several procedures that involve the surface modification and material removal of a workpiece following the use of various techniques [4,5]. Almost all of the energy produced while cutting metal is converted into heat [6]. Figure 1 depicts the distribution of heat during an orthogonal cutting operation in the workpiece, cutting tool, and chip. The primary cutting areas, where most of the energy is converted to heat, the secondary deformation area at the tool–chip interface, where additional heat is produced by rubbing or shearing, and the strained flanks, which are caused by rubbing between the tool and the finished surfaces, are the three sources of heat that are produced at the cutting point [6]. Thermal cracking, which is caused by expansion and cracking brought on by extremely high temperatures, is another cause of cutting tool failure [7]. Additionally, the heat generated during metal cutting causes tool wear, which may hamper product quality and process productivity [8,9]. High temperatures experienced during and after machining eventually result in surface damage from oxidation, burns, and quick corrosion at the cutting area, which causes the workpiece’s dimensional deviation [10]. To minimize the above-mentioned problems, machining may require expensive high-heat and wear-resistant tools and sturdy machine tools that can withstand the machining process. Moreover, it is limited to low-strength material cutting with restrained productivity [11].
The use of cutting fluid helps overcome these obstacles. It can be used for a variety of purposes. It can lubricate the chip–tool and work–tool interfaces by their ball bearing and rolling effect, cool the workpiece and cutting zone, sweep out the metal chips, and last but not least, protect the machined surface from corrosion [13,14]. There are two main types of cutting fluids. Figure 2 shows the classification of different types of cutting fluids.
The conventional flood cooling technique involves directing a cooling jet toward the cutting area, which is most suited for operations that generate a high cutting temperature or sparks, such as turning, drilling, and grinding, because the cooling jet quickly reduces temperature and spark generation [16]. However, this technique is not economical and eco-friendly. To overcome its drawbacks, researchers are encouraged to invent innovative, low-cost, efficient, and sustainable cooling strategies shown in Figure 3. Among the most used techniques are vegetable oil-based coolant application [17,18], cryogenic cooling with LN2 or CO2 [19], MQL with different oil/water [20], and their hybrid applications like cryogenic–MQL, MQL with vegetable oil, etc. Based on sustainability indicators and machinability efficiency, cryogenic approach secures the highest ranking, then MQL [21].
Roughly 85% of the machining fluids used globally are mineral oil-based cutting fluids [22]. However, they have bad effects on human health and significant and pervasive occupational dangers that get airborne and form aerosols during machining [23]. Considering human health and environmental consciousness, modern machining has started to follow sustainable alternatives. Eco-friendly and biodegradable vegetable oils used as cutting fluids is the most sustainable solution. They are recommended over petroleum-based metalworking cutting fluids for performance, cost, health, safety, and the environment [24]. Most vegetable oils come from plant seeds. These oils come from sustainable sources such as coconut, sunflower, soybean, rapeseed, olive, palm, and others [25]. Figure 4 shows how vegetable oils biodegrade faster than mineral oils. It shows vegetable oils’ competitiveness. Studies demonstrate that vegetable oils can deteriorate 70–100% of their weight [26].
Thus, the use of vegetable oils as metal cutting fluids (MCFs) enables the performance of green machining [27]. Above and beyond, vegetable oil has a triglyceride structure, which makes it suitable for using as a desirable lubricant. Due to long fatty acid chains, high strength lubricant film is created, which has the ability to adhere to the metal surface. Ultimately, it works better compared with mineral oil for friction and wear reduction during machining. Vegetable oil is also used to provide a more stable and high viscosity index even at higher temperatures, making it the best alternative to mineral oil [28,29]. Xavior and Adithan [30] compared vegetable oil with mineral oil in the turning of AISI 304 austenitic stainless steel. Surface roughness and tool wear were reduced when vegetable oil was used during machining.
There are various methods for improving vegetable oil properties. One of the simplest approaches for improving vegetable oil properties is to blend or combine vegetable oils with diverse qualities [31]. Due to the intrinsic variances in the fatty acids present in oils, they have varied physical and chemical properties. Pure vegetable oil, when used without any modifications, can have poor physical, chemical, and nutritional qualities, as well as oxidative stability.
Figure 4. Vegetable oils and mineral oils comparison in terms of biodegradability. (Reproduced from [32] with copyright permission from the publisher. License number: 5899341052809).
Lubricants 12 00444 g004
Cryogenic cooling is an environmentally friendly and extremely effective method for machining [33]. This technique entails directing a liquid cryogen stream directly onto the cutting interfaces, resulting in enhanced machining performance. The environmental friendliness of cryogenic cooling is notable, as it leaves no hazardous residue and does not require costly disposal systems. Thus, it is a viable alternative to conventional cooling strategies [34] because it satisfies numerous requirements for sustainable machining. In a comparative investigation conducted by Karkade and Patil [35], compressed CO2 gas cooling was found to improve surface integrity during machining, despite possibly resulting in increased cutting forces due to work-hardening effects. However, the use of cryogenic refrigeration does have some restrictions. High equipment costs and the expense of procuring liquid nitrogen (LN2) or liquid CO2 pose financial challenges [36]. In addition, these cryogens cannot be reused, unlike conventional cutting fluids. Extremely low temperatures in cryogenic environments can cause work hardening, resulting in increased cutting forces and diminished dimensional accuracy [37].
The other effective, sustainable, eco-friendly, and easy-to-handle coolant application technique is MQL, which injects a small quantity of lubricant or cooling fluid into the cutting zone in two ways: either drop by drop or in aerosol form at a very high velocity (100 m/s) [37,38,39]. The most common approach uses MQL in aerosol form, which improves cooling by increasing fluid surface area and the heat transfer coefficient due to high fluid velocity and aerosol evaporation. The MQL technique has some promising outcomes as well as offers economic savings, environmental conservation, and human safety due to its low coolant usage and disposal savings [40,41]. Sharma et al. [42] studied MQL technology, which generates surfaces superior to dry machining and similar to MCFs. Dhar et al. [43] found that MQL turning improved tool wear and surface roughness over typical MCFs. Tasdelen et al. [44] observed that MQL reduced tool wear and shorter chip length than MCFs in precipitation-hardened steel drilling. Silva et al. [45] found that MQL outperformed MCFs in grinding by monitoring surface integrity and wheel wear. MQL is also more energy-efficient and environmentally friendly than dry and flood machining [46].
The MQL method can be more environmentally friendly and efficient by hybridizing with various techniques. MQL with cryogenic cooling can perform better [47]. However, this method can be expensive to set up and maintain. The MQL method can be more environment-friendly and hazard-free if mineral oil is replaced with distilled water, oil-in-water emulsion, and vegetable oil. Vegetable oil is the most favorable alternative compared with others because of its high viscosity [48]. The MQL technique with coconut oil cutting fluid machining conditions reduced tool wear, friction coefficient, chip morphology, and workpiece surface quality, according to Vardhaman et al. [49]. Khan and Dhar [50] investigated the effect of vegetable oil-based MQL cutting that affected tool wear, cutting zone temperature, surface quality, and dimensional deviation when turning AISI 1060 steel with uncoated carbide inserts. MQL cutting reduced tool wear, surface roughness, and dimensional error. Khan et al. [51] turned AISI 9310 alloy steel with vegetable oil-based MQL. The authors reported that the cutting area’s temperature was reduced significantly. If vegetable oil blends are used by MQL instead of pure vegetable oil, then the performance increases further. As stated by Susmitha et al. [52], blends of two vegetable oils in 1:1 proportions perform better compared with a single vegetable oil and commercial mineral oil during the drilling operation of mild steel under MQL. Nanoparticles can be mixed with vegetable oil to improve its performance, and recently, huge research has been conducted in this area [53,54].
The ultimate sustainability for any manufacturing process can be achieved by investigating the effect of different variables on machining responses and careful selection of each variable involved. Numerous research regarding the effect analysis and selection of optimum machining parameters was carried out previously. Currently, it is a vast area of manufacturing research. Improved product quality, lower production costs, and sustainable machining operations are a consequence of an optimized process [55]. Cutting speed, feed rate, and depth of cut are key process parameters for turning operations; yet, cooling conditions play a critical role in increasing process performance. Selection of suitable parameters can be achieved considering a single response or multiple responses, but simultaneously considering multiple important responses according to their importance is an increasing requirement for obtaining an optimized manufacturing process. There are various process responses by which the process performance can measured. Sristi et al. [56] optimized the cooling environment, cutting speed, and feed rate considering multiple responses such as temperature, force, roughness and chip reduction coefficient by using the MCDM method. Zaman and Dhar [57] selected optimum MQL parameters like nozzle diameter, nozzle angle, air pressure, and oil flow rate considering minimization of temperature, force, and surface roughness. Muthuram and Christo [58] optimized turning parameters for minimizing roughness and maximizing material removal rate.
Different prediction models are typically used as inputs for the optimization of process parameters in metal-cutting processes. Response surface methodology (RSM) is a statistical regression technique widely used to formulate prediction models. Response surface methodology (RSM) was utilized by Suresh and Basavarajappa [59] to investigate the impact of various cutting parameters on the hard turning of AISI H13 steel using a PVD-coated TiCN ceramic tool. Models for tool wear and surface roughness were created. When turning Ti-6Al-4V alloy, Mia et al. [60] employed RSM and ANN to forecast the surface roughness and cutting force. The force required to hard turn AISI 52,100 steel (60 HRC) with a CBN tool was also predicted using RSM [61]. The ideal cutting conditions were determined by Zahia et al. [62] using RSM to reduce cutting force and surface roughness. They examined AISI 4140 alloy steel that had been machined with a ceramic insert. Zaman and Dhar [63] used a composite desirability approach to find optimum process parameters considering multiple criteria. MQL application parameters were also optimized by the RSM method [57]. Various artificial intelligence-based methods, such as ANN-GA [58] and PSO-ANN [64] hybrid algorithms can also be utilized for optimization.
From the literature review, it can be concluded that lubrication is necessary for efficient and accurate machining performance. MQL is one of the promising cooling and lubrication techniques though its performance is lower than cryogenic cooling. However, there are numerous ways of improving the performance and sustainability of MQL. Selection of optimum process and MQL parameters can be a useful technique to achieve better machining performance. High-performance fluids such as vegetable oil blends and nanofluids can also be used to improve the performance of MQL. However, nanofluid preparation and maintenance is very critical. Blending vegetable oils is an easy and cost-effective method. Nevertheless, MQL machining with different vegetable oil blends is very rare in the recent literature. As per authors’ knowledge, there is no literature where a coconut oil + rice bran oil blend and coconut oil + olive oil blend were used as MQL fluids in turning/machining operations. This can be a vast scope to address in search of green and cost-effective lubrication for sustainable machining.
In this present work, different coconut oil-based blends were prepared and their applications using MQL in turning medium carbon steel were experimentally investigated compared to pure coconut oil and mineral oil in terms of cutting temperature and cutting force. Experimentation was conducted via the Box–Behnken design of experiment using RSM. Predictive models for both of the responses were formulated by utilizing MINITAB 17. Finally, the optimum value of process parameters was identified by using an RSM-based composite desirability method considering the minimum cutting temperature and minimum cutting force simultaneously. The final result has been verified by experimentation.

2. Materials and Methods

2.1. Workpiece and Cutting Tool Material

A medium carbon steel round bar with a length of 400 mm and diameter of 71 mm was used as the work material. The hardness of this material was 102–105 HRB. Medium carbon steel portrays a good balance of tensile strength, ductility, and malleability. It has high flexibility and elasticity despite its fragility and brittleness. It is a highly machinable and weldable material for many applications. Medium carbon steels are used for making shafts, axles, gears, crankshafts, couplings, railway wheels, and different equipment related to building structures and forgings, etc.
Commercially available uncoated tungsten carbide inserts (ISO designation SNMG 120408, WIDIA, Bangalore, India) with hardness 74.2 RC were used in the machining. They can be used in turning for a variety of applications. Tungsten carbide is a hard and rigid material with high impact resistance, strength, and compressive strength. It is also resistant to deformation, deflection, heat, and oxidation. The uncoated carbide insert was mounted in a PSBNR 2525 M12 tool holder (Sandvik, Maharashtra, India), which provided the required working tool geometry of −6°, −6°, 6°, 6°, 15°, 75°, and 0.8 mm.

2.2. Machine Tool and Experimental Conditions

The experimentation was conducted by turning medium carbon steel with an uncoated carbide insert in a manual lathe machine (KL-3280C/2000, Sunlike Machine and Tool Corp., Huizhou, China) under MQL conditions. The cutting speed, feed rate, and depth of cut for turning medium carbon steel by uncoated carbide insert were set based on the literature and availability in the machine. In the literature, similar differences in cutting parameters have been observed [59,65]. The experimental conditions of this work have been presented in Table 1.
With the four input variables, a full factorial design of the experiment was created and experimentation was conducted according to it. For each experimental run, multiple responses such as cutting temperature and main cutting force values were collected. For each experimental run, three readings were taken and the average values were taken as final reading. A photographic view of the experimental setup is presented in Figure 5.

2.3. MQL Setup and Oil Preparation

As defined before, turning experimentation was performed under MQL conditions. It is an easy-to-use, economical, eco-friendly, and effective alternative to conventional cooling, also called near-dry machining [66] or micro-lubrication [67]. The primary components of the MQL delivery system include a compressor, fluid chamber, mixing chamber, and micro nozzle. In the appropriate location, a pressure regulator and flow meter were used to regulate pressure and flow rate, respectively. The compressor provided compressed air and could generate a maximum pressure of 25 bars. Oil was poured into the mixing chamber. A portion of the compressed air traveled directly to the mixing chamber, while the remainder flowed to the fluid chamber to force the fluid out of the container and into the mixing chamber. The fluid chamber’s capacity was 1 L. It was connected to the compressor by a flexible pipe through the inlet port to maintain a constant pressure within the chamber. During machining, it was necessary to maintain a constant passage of cutting fluid into the mixing chamber via a flow control valve over an extended period. The volume of the fluid chamber was maintained at one liter because it could continue for five hours at a rate of 200 mL/h. For all four environments, the MQL technique was used. The MQL nozzle was kept at approximately 35 mm distance from the tool–workpiece interface on an inclination angle of 40°~45° with horizontal surface. A similar nozzle distance and similar inclination angle was observed in the literature [65,68]. Figure 6 shows the MQL setup for this work.

2.4. Preparation of Cutting Oil Blends

Four types of cutting fluids were used in MQL. Among them, two were coconut oil-based blends that were prepared (Figure 7). The performance of these oil blends was compared with pure coconut oil and mineral oil. For both oil blends, a magnetic stirrer machine was used for blending. For the first blends, 500 mL each of coconut oil and rice bran oil were mixed at a 1:1 ratio. The oils were blended for 30 min at a constant 250 rpm at a temperature of about 40 °C to prepare 1000 mL of blended oil [22]. For the second blend, olive oil was used instead of rice bran oil. Table 2 shows the oil blending proportions.

2.5. Measurement of Responses

Two response parameters, cutting temperature (T) and cutting force (Fc), were taken into consideration and quantified as the machining performance. The temperature of cutting was measured using a tool–work thermocouple technique, in which the tool and work material function as two dissimilar metals of the thermocouple. Cold junction was created by connecting the cold part of the tool with the cold part of the workpiece, and the thermocouple circuit was completed. Here, a Cu wire and Cu rod were used for the connection. During machining, high heat was generated in the chip–tool interface, which acted as the hot junction of the thermocouple. Voltage was generated in the thermocouple. This voltage has a relationship with the hot junction temperature if the cold junction temperature is fixed. As stated by [61], a digital multimeter (Rish multi 15S, Rishabh Instruments limited, Nashik, India) was used in between the Cu wire to record the voltage generated during machining. The workpiece and the tool were mandatorily isolated from the four-jaw self-centered chuck and tool post, respectively, due to accurate functioning of the thermocouple. In the first place, leather and in the second place, a mica sheet, were used as insulation. By this method, the average cutting temperature over the entire contact area could be measured reliably for a wide range of temperatures. For a particular experimental run, the most stable cutting temperature reading was taken from 15 mm of turning operation. The thermocouple for the tool–work is depicted schematically in Figure 8.
The calibration for this tool–work pair was carried out to convert voltage (mV) to hot junction temperature (°C). For calibration, artificial hot and cold junctions were created with the help of a chip from the workpiece and a rod of tool material. A digital multimeter (Rish multi 15S, Rishabh Instruments limited, Nashik, India) was also connected to record generated reading, and a digital thermometer (Eurotherm, Watlow, Worthing, UK) was placed near (as much as possible) the hot junction. Then, the hot junction was heated artificially and the simultaneous readings of the multimeter and thermometer were recorded and plotted in a graph, shown in Figure 9.
From the scatter graph, a regression relation was formulated. In this case, an almost linear relationship between the voltage and temperature with a 99.98% coefficient of determination was found. The regression equation stated in Equation (1) was used to determine the chip–tool interface temperature.
T e m p e r a t u r e = 37.8 + 57.45   V o l t a g e   ( m V )
The amount of cutting force generated during machining has a significant impact on the tool’s life and wear. The principal cutting force (Fc) during hard turning at different V-f-d combinations under MQL was measured using a dynamometer (Kistler, Winterthur, Switzerland). The dynamometer was placed under the tool post and connected with a PC through a data acquisition system. During machining, several values of cutting force were stored in the PC. The average value of these values was considered as the cutting temperature value for a specific condition. The setup for force measurement is shown below in Figure 10.

2.6. RSM-Based Approach for Process Optimization

RSM is a methodical approach that is used to establish a link between the independent and dependent variables. This method can be used for experimental design, evaluation of the effects of process parameters on process output responses, identification of significant parameters and interactions contributing to the response being measured, establishment of a correlation between the significant parameters and the responses, and identification of the optimal process parameter settings intended for superior process performance within the limits chosen for the experimental design [70]. Systematic data are created and summarized for analysis by a carefully planned experimental design in the first step of RSM. Experimental design can produce the most necessary knowledge with the least amount of experimentation. RSM has the advantage of saving time and money by minimizing the number of experimental runs [71]. The second-order polynomial model required for optimization can be designed by using Box–Behnken designs (BBDs) and central composite designs (CCDs) [72]. Due to its economic character, BBD is increasingly used in actual industrial research [73].
Based on regression analysis, the mathematical model used in RSM is typically a first- or second-order polynomial model. Though the true reaction surface is curved enough to allow for variable interactions, a second-order model is likely needed. The model that was built using the above method is called a quadratic model and is shown by Equation (2) [53]. This model has linear terms, terms that are quadratic, and terms that combine.
Y = b 0 + i = 1 k b i x i + i = 1 k b i i x i i 2 + i < j j = 2 k b i i x i x j + ε
Here, b 0 is the constant term; b i is the coefficient of linear terms;  b i i represents the coefficient of the quadratic term; b i j is the coefficient of cross-product terms; and X i are the quality variables, which in this case are V, f, and d.
The analysis of variance (ANOVA) was carried out in Minitab 17 software. The full quadratic term was used for developing the regression equation and ANOVA table. Following the method of the reduced model, backward elimination was performed with a 95% confidence level (α = 0.05). Percent contribution (Pi) of the model and model terms on different output responses can also be determined from ANOVA based on Adj SS (adjusted sum of squares) values using Equation (3) [74]:
P i = S S i S S i × 100 %
where SS = sum of squares and i = model terms.
The normality and randomness of the residual values of the formulated empirical models can be studied using residual plots [75]. Normal probability plots and a histogram of residual frequencies against residuals are plotted to verify the normality of residual values. Residual versus fitted values and residual versus observed order plots are plotted to verify the randomness of the residual values.
Model verification using experimental data is required before using these models for optimization of the process parameters [76]. A validity test of a model needs to be conducted by using additional experimental data that were not used during model formulation. Any created model is considered to be valid if it can predict response data with a reasonable error. The prediction accuracy of the model can be calculated by different error measures. Among them, mean absolute percentage of error (MAPE) is an effective, simple, and widely used method for model validation [77]. MAPE is the average of the absolute percentage error. The lower the value of the MAPE of a model confirms better performance. MAPE for the models was computed by utilizing Equation (4) [78].
M A P E = 1 n t = 0 n A c t u a l t P r e d i c t e d t A c t u a l t × 100
Response optimization is a process of finding the optimal values of input parameters that lead to the desired or optimal values of response variables in a given system or process. The objective is to identify the combination of input settings that maximizes or minimizes the response variable(s) based on specific goals or criteria. Models developed to predict the responses can be utilized for finding the optimum process parameters. Optimization in manufacturing is very important to achieve improved productivity, reduced production cost, and hazard-free operation as a byproduct. The optimization process can be based on multiple responses or single responses. Using the response optimizer in MINITAB is very easy and this method takes very little time. This technique uses the desirability functions approach. Every response has been translated by an individual DF into a unitless desirability value (d) that varies over the range 0 ≤ d ≤ 1.

3. Results and Discussions

3.1. Design of Experiment (DOE) and Data Collection

RSM was used for the design of the experiment. In this experiment, there were four input parameters, among which three were numerical, such as cutting speed, feed rate, and depth of cut, and other was categorical, such as cooling environment. Table 3 shows process input parameters with their levels. By defining the levels selected for process analysis, the Box–Behnken design (BBD) was created using MINITAB 17 software. For ‘quadratic’ mathematical model formulation, BBD is considered an efficient experimental design compared to full factorial design. It can provide maximum information from minimum experimentation as well as handle continuous and categorical factors [73]. Table 4 shows the design of the experiment created, with process responses (outputs). For each of the experimental runs, three readings were taken and their average values were considered as the response values (T and Fc) for any respective experimental run.

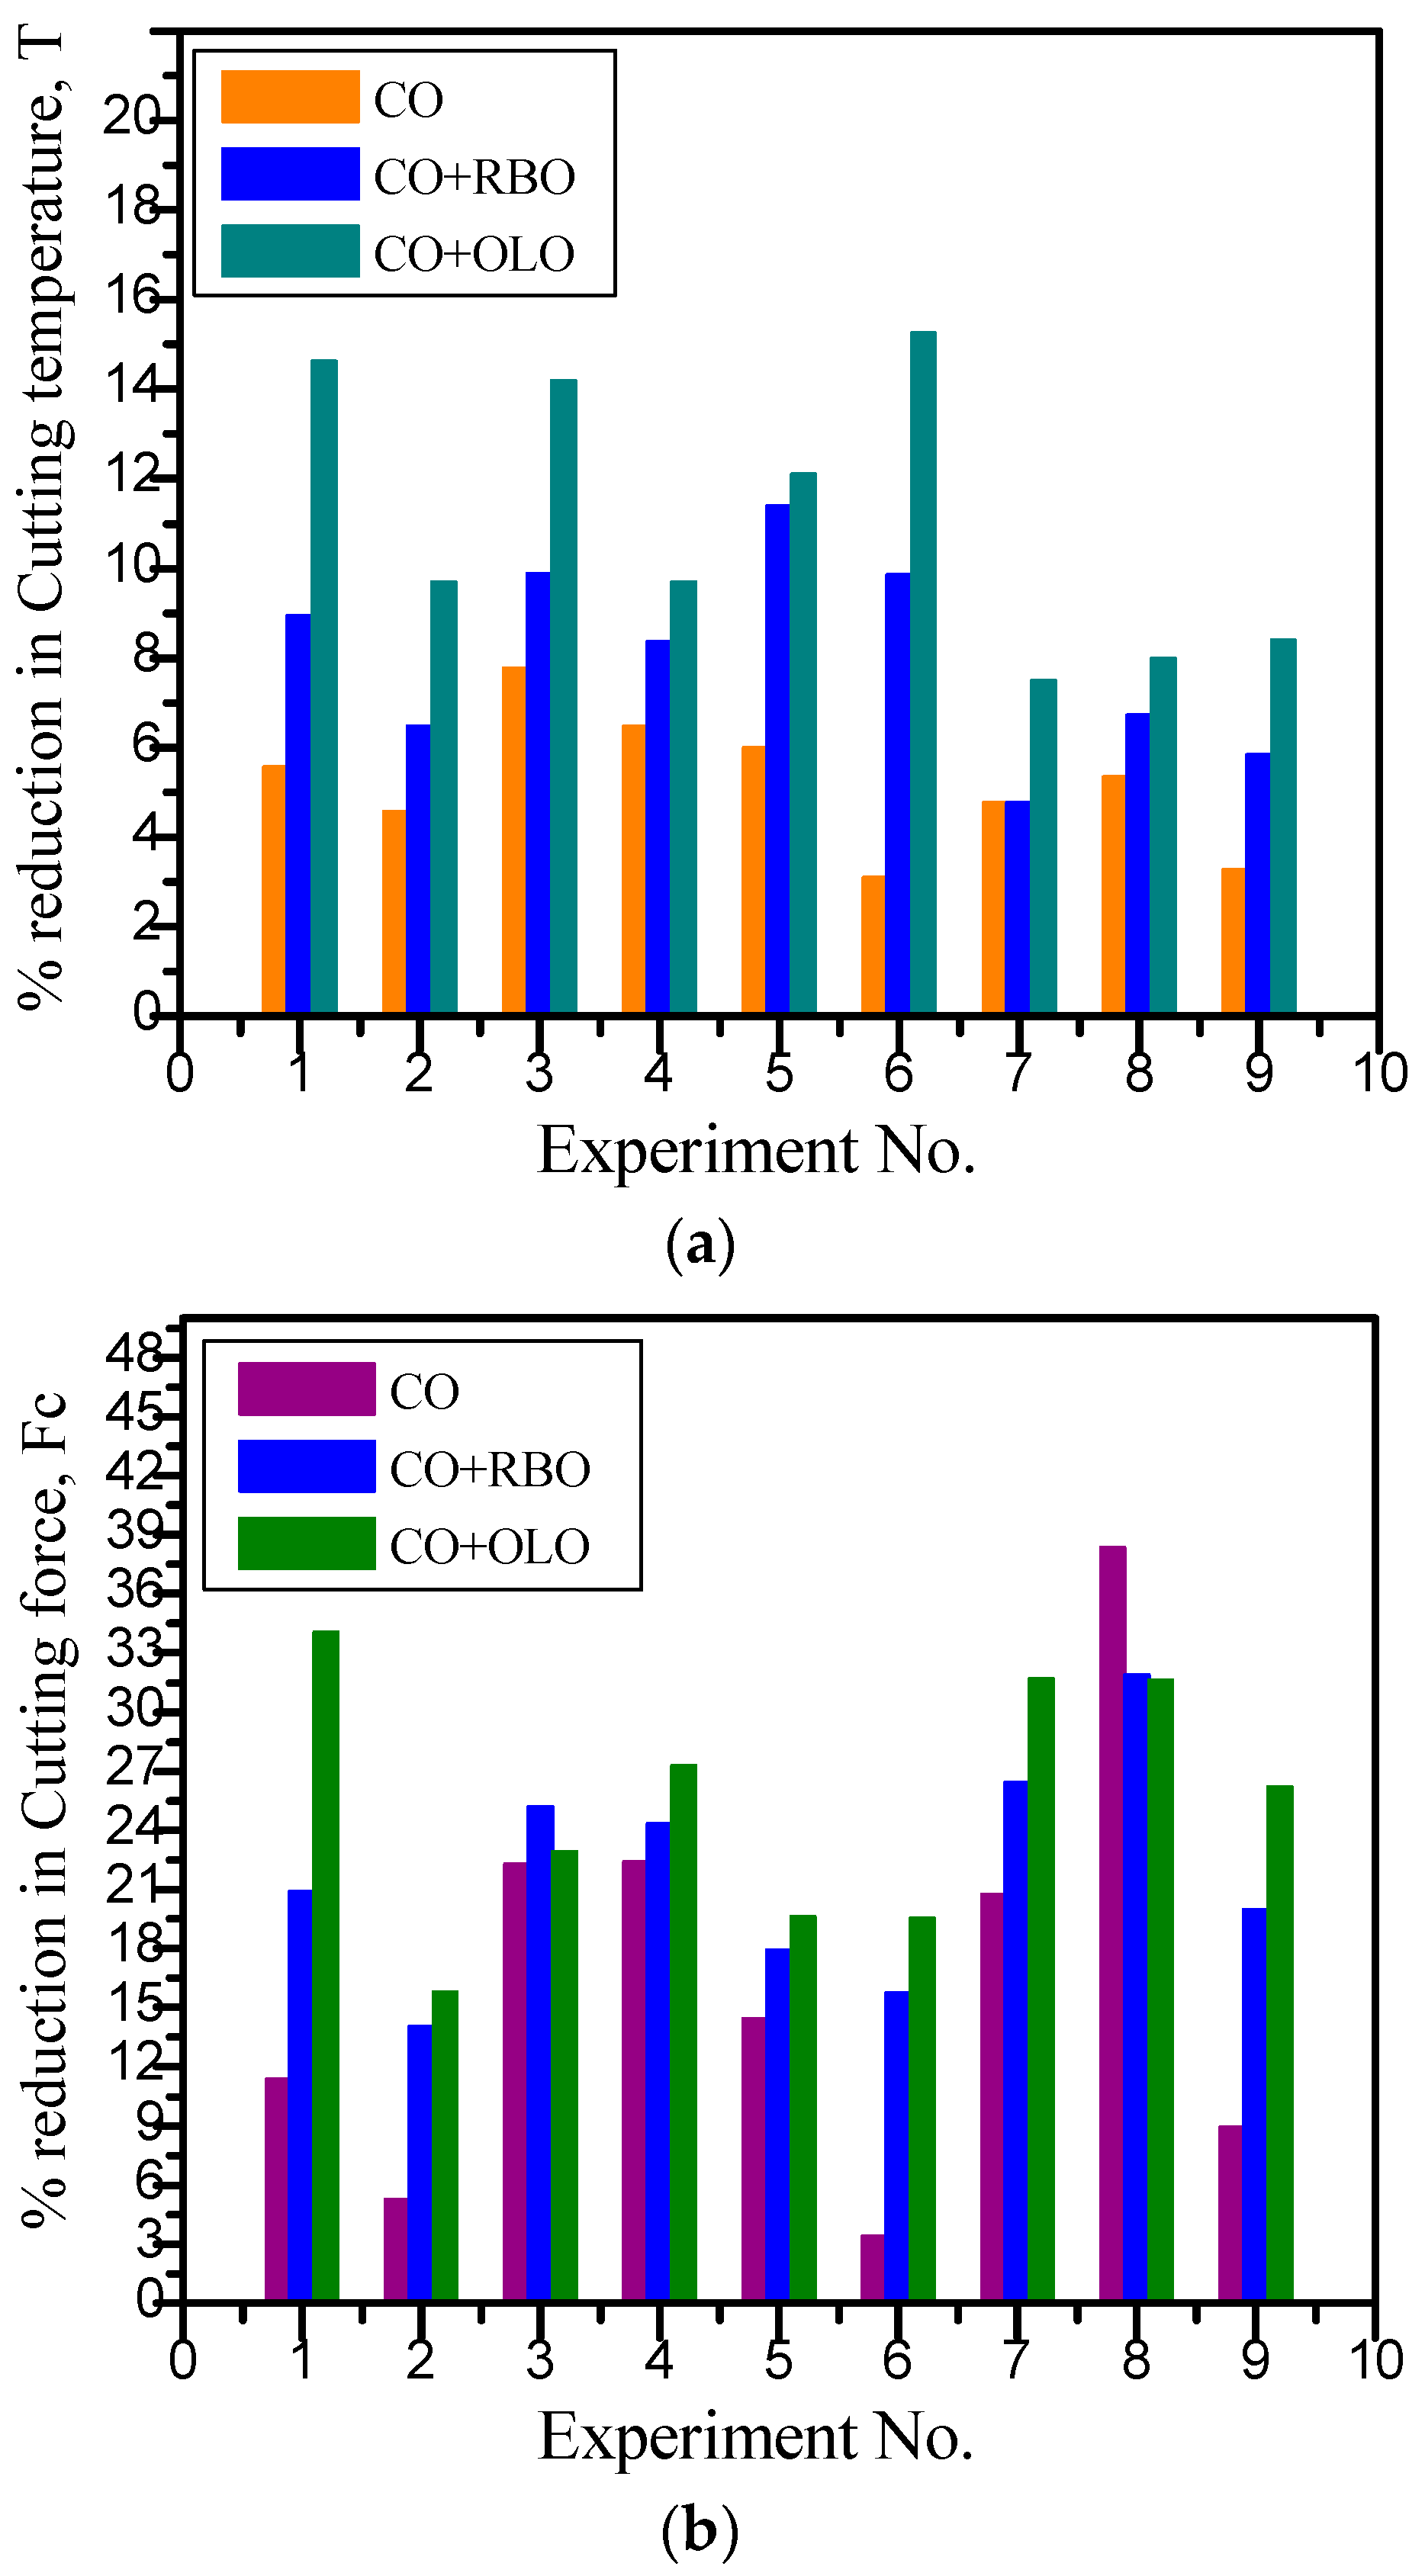
3.2. Effect of Vegetable-Based Oil Compared to Mineral Oil

Utilizing selective data from Table 4, the effects of MQL with coconut oil, the coconut–rice bran oil blend, and the coconut–olive oil blend were compared with mineral oil. Table 5 exhibited the percentage reduction in temperature and force for each vegetable-based oil compared to mineral oil.
Figure 11 reveals that for all of the vegetable cutting oils (coconut oil, coconut–rice bran oil blend, and coconut–olive oil blend), the percentage reduction in force and temperature is always positive. That means all the vegetable oils performed better than the mineral oil. This is because of the better lubrication and viscosity of vegetable oil due to its long fatty acid compared with mineral oil. A similar result is available in the literature [30]. Among three vegetable oils, the coconut–olive oil blend resulted in the greatest force and temperature reduction, followed by the coconut–rice bran oil blend and pure coconut. The lubrication properties of olive oil were better than rice bran oil. So, the oil blend with olive oil worked better. Lubrication properties were improved when more than one oil were blended together. From the literature [22,60], a similar finding was observed.

3.3. Response Surface Modeling (RSM)

RSM-based predictive models for cutting temperature and cutting force have been formulated based on the experimental data presented in Table 4 by employing the commercial statistical software package MINITAB 17. The analysis of variance (ANOVA) table was used to evaluate the effects of various variables on the dependent variable (cutting force and temperature). The sequential sum of squares, F-value, and p-value were all included in the ANOVA table along with the percentage contribution of each factor. The p-value indicated a factor’s importance at a 95% level of confidence. The p values above 0.05 (p value > 0.05) showed that the interaction terms in this model were not significant. Therefore, only significant terms (p value < 0.05) were considered for the model using backward elimination. The relevance of a factor increases with the F-value. For the RSM cutting force and cutting temperature models, the cutting speed, feed rate, and depth of cut were all statistically significant because the p-values were less than 0.05. Determined coefficients can also be used to provide insights into model significance. The correlation between experimental data and anticipated responses was quantitatively assessed by the determination coefficient ( R 2 ). The reduced quadratic models for cutting temperature after applying backward elimination for four different environments are shown in Equations (5)–(8).
T ( M i n e r a l   o i l ) = 867.1 + 1.2069   V     3287   f + 62.50   d + 14,330   f f
T ( C o c o n u t   o i l ) = 818.7 + 1.2069   V     3287   f + 62.50   d + 14,330   f f
T ( C o c o n u t + R i c e b r a n   o i l ) = 791.8 + 1.2069   V     3287   f + 62.50   d + 14,330   f f
T ( C o c o n u t + O l i v e   o i l ) = 771.9 + 1.2069   V     3287   f + 62.50   d + 14,330   f f
The analysis of variance for temperature, carried out to investigate the influence of the factors, is shown in Table 6. The table analysis revealed the F value and the p value. The p-value for the model was <0.5, which indicates that the model was significant with a 95% confidence level, which is supported by the previous literature [53]. In addition, the model summary generated by ANOVA revealed a high value of the determination coefficient ( R 2 = 93.96 % ) , indicating that the proposed model explained 93.96 %   of the total variations in the results. Consequently, the model could not account for 6.04 % of the variations. In addition, a high value of the adjusted determination coefficient ( a d j u s t e d   R 2 = 93.15 % ) indicated that the polynomial model was highly acceptable and could be used to predict the responses.
Adjusted R2 (93.15%) and predicted R2 (91.89%) values are very close to each other, which means that the model was adequate to predict the temperature. The cutting temperature predicted by this model was accurately within the range of the process parameters used. This result fully complied with the previous results [57].
The quadratic model for cutting force was formulated by using RSM. The expressions of cutting force for four different environments are shown in Equations (9)–(12).
F c   ( M i n e r a l   o i l ) = 420.8 6.47   V + 1602   f 47 d + 0.02748   V V + 242   d d
F c   ( C o c o n u t   o i l ) = 371.1 6.47   V + 1602   f 47 d + 0.02748   V V + 242   d d
F c   ( C o c o n u t + R i c e   b r a n   o i l ) = 349.9 6.47   V + 1602   f 47   d + 0.02748   V V + 242   d d
F c   ( C o c o n u t + O l i v e   o i l ) = 327.1 6.47   V + 1602   f 47 d + 0.02748   V V + 242   d d
The analysis of variance for the cutting force carried out to investigate the influence of the factors in the cutting force is shown in Table 7. From the table, the F value and the p value are revealed. The p-value for the model was <0.5, which indicates that the model was significant with a 95% confidence level, which is supported by the previous literature [53]. The model summary generated by ANOVA revealed a high value of the determination coefficient ( R 2 = 92.11 % ), indicating that the proposed model explained 92.11 % of the total variations in the results. Consequently, the model could not account for 7.89 % of the variations. In addition, a high value of the adjusted determination coefficient ( a d j u s t e d   R 2 = 90.88 % ) indicated that the polynomial model was adequately fitted to the experimental data.
There were very little differences between the adjusted R2 (90.88%) and predicted R2 (90.88%) values, which confirms the adequacy of the model. Within the range of process parameters used, this model can predict the cutting force accurately. The result is highly aligned with the previous literature [57].
The normal probability plot of the residuals, residual versus fit, residual histogram, and residual versus order for the response surface methodology is depicted in Figure 12. The normality plot demonstrates that the majority of points lie relatively near to the straight line, indicating that errors are normally and independently distributed. The normality assumptions for this curve are considered valid. A distinct random plot of residuals over fitted values is commendable. Admittedly, there is no indication of an increasing/decreasing pattern that would disprove the constant variance assumption. The histogram of residuals displays a normal distribution curve. The residual plot over observation order demonstrates that the values are random, with abrupt ups and downs. This demonstrates that the residuals are uncorrelated. The model’s performance was considered satisfactory based on the residual plots for both temperature and force.
For the validity testing of the regression models, nine sets of experimental data were utilized, which have been presented in Table 8.
In Figure 13, the experimental values of cutting temperature and force are compared with the predicted values calculated by using the regression models. The predicted values of the responses appear to be very close to the experimental values. The absolute percent error (APE) for cutting temperature under the test conditions was calculated as 2.24~7.41%, whereas for cutting force, the values of APE were 2.16~6.71%. The mean absolute percent error (MAPE) values for the temperature and force were calculated as 4.5% and 5.32%, respectively. This result indicated a good agreement with the previous literature [79]. According to Pant and Chatterjee [80], the regression models were highly accurate in predicting the responses as the MAPE values were less than 10%.

3.4. Optimum Process Parameters Selection by Response Optimizer

RSM was used for the optimization of the cutting force and temperature. The control factors were also established to a setting corresponding to the minimum cutting temperature and force. Then, using desirability analysis, multi-response optimization was carried out. The responses were optimized by using the composite desirability function of response surface methodology. In this study, the weight for each response was set equal to 1. Different weights for the responses can be applied as per requirement. Figure 14 shows that the optimization of the temperature and cutting force, a simultaneous minimization problem of both functions, divulged the 96.04% (D = 0.9604) composite desirability at a cutting speed of 80.15 m/min, feed rate of 0.10 mm/min, and 0.5 mm depth of cut. Also, the coconut–olive oil blend was found to be an optimum cutting environment. In this way, the minimum attainable cutting force and temperature were found at 182.166 N and 714.457 °C, respectively. A composite desirability value of 96.04% indicated that the optimum process parameter settings achieved satisfactory results for all the responses. A similar result has been found in the literature [52]. Also, the individual desirability of cutting force (99.65%) was much greater than that of temperature (92.558%). So, it can be said that the optimum settings are more effective for minimizing force than minimizing temperature. This statement will be validated further from the validity test in the following section. Individual desirability values were achieved with same weight for both of the responses. For any case, if minimizing temperature is more important, then more weight should be assigned for the temperature. Similar research has been found in the literature [81]. Table 9 shows the final optimum results.
After obtaining the optimum parameter settings, a validity test was conducted by comparing initial settings with optimal settings of the parameters. The cutting temperature and cutting force values were hugely reduced for the optimum parameter settings predicted by RSM (Table 10). This validity test ensured the suitability of the application of RSM in various machining processes.
From the above table (Table 10), it can be observed that the cutting temperature and force improved in the optimal parameter settings compared with the initial parameter settings. Moreover, it has also been proved that these optimum settings were more effective in reducing the force (42%) compared with temperature (15.7%), which had a high correlation with the individual desirability values of the responses (Force-0.99 and T-0.92). Similar research is available in the literature [72,82].

4. Conclusions

From the literature, it was found that vegetable oil can be efficiently used as MQL cutting fluid in machining. Vegetable oil is nonhazardous, biodegradable, and beneficial to the environment. In the present research work, turning experimentation of medium carbon steel under vegetable oil- and mineral oil-based MQL has been conducted. The RSM module of MINITAB 17 were used to formulate predictive models of cutting temperature and cutting force. Afterward, desirability based parametric optimization was conducted to find the optimum process parameter settings considering multiple responses, such as minimizing cutting temperature and minimizing cutting force. The following observations were made as a result of this study:
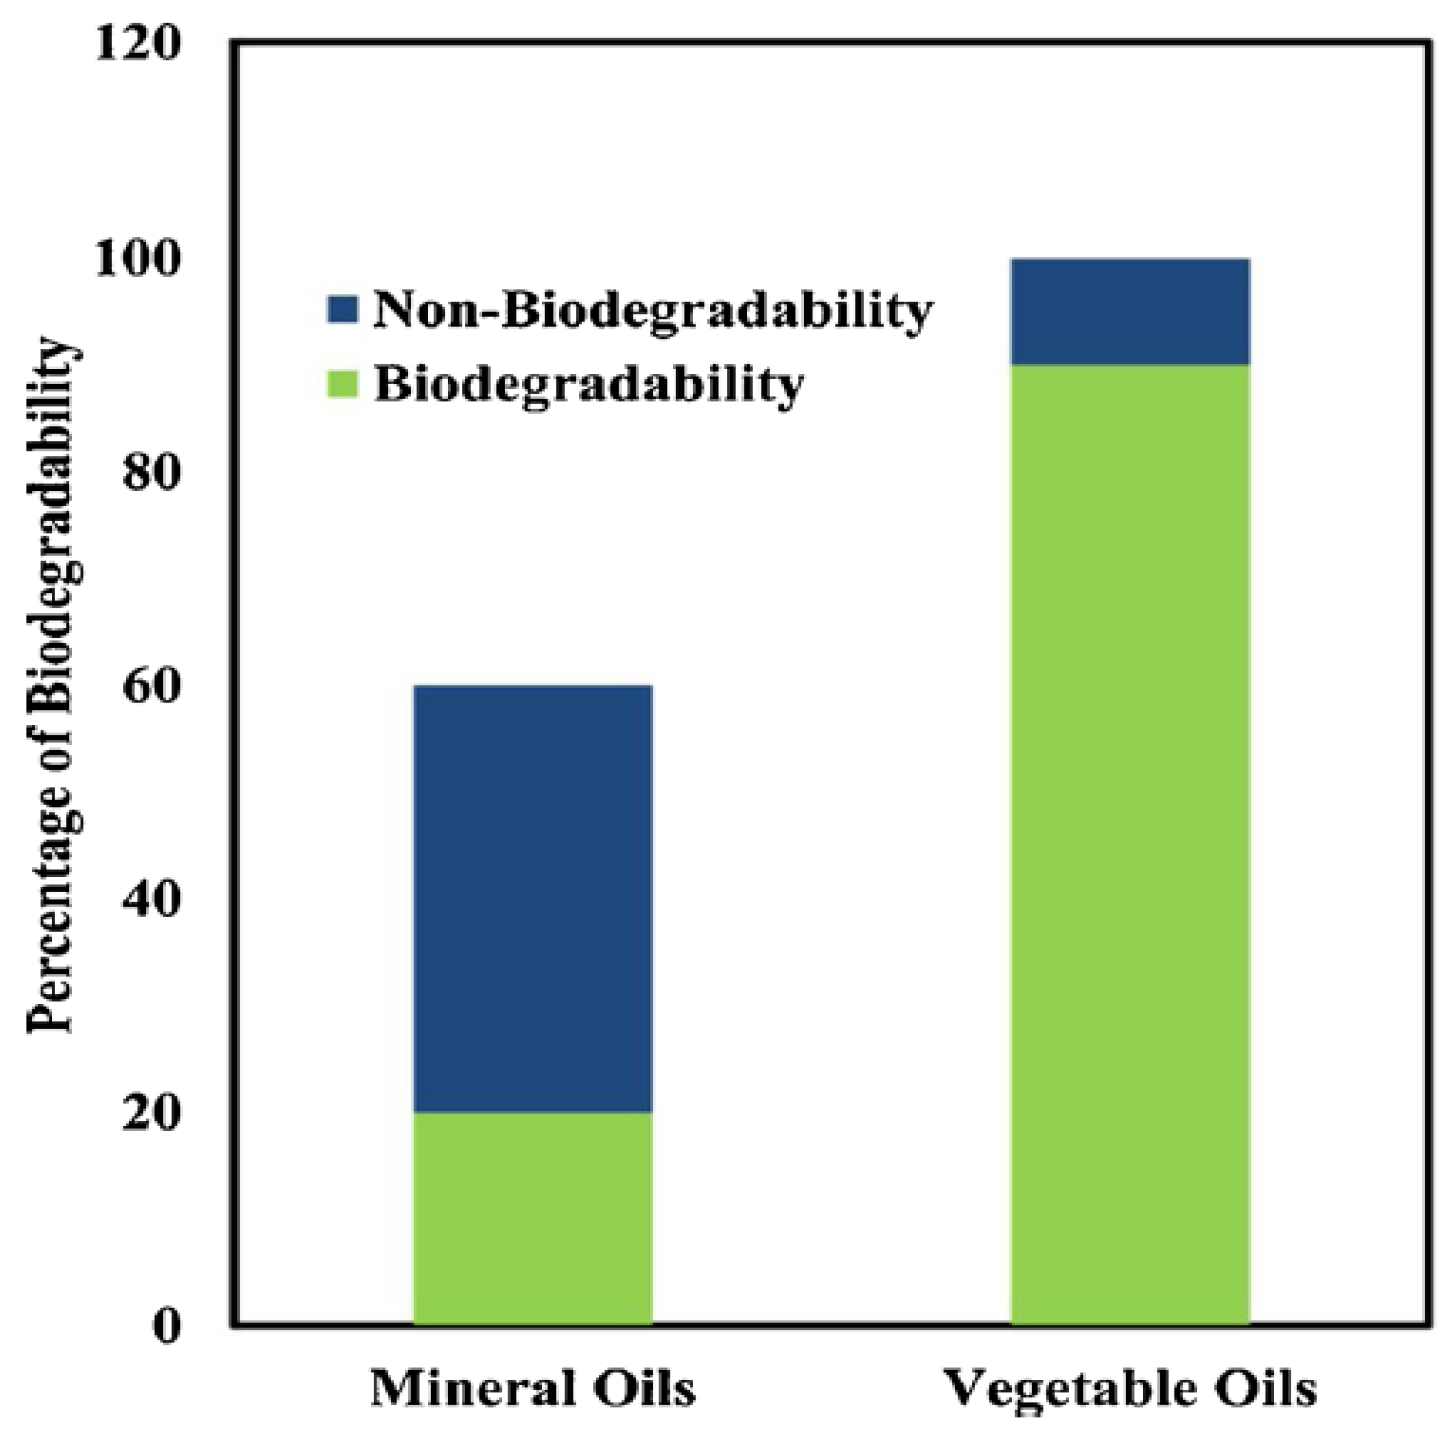
  • Performance of three vegetable oil-based cutting fluids were compared with mineral oil under MQL conditions. Due to the long fatty acid structure and higher viscosity index of vegetable oils, they performed better compared with mineral oils concerning cutting temperature and cutting force.
  • Among the three oils, both oil blends performed better than pure coconut oil because, blending can improve the properties of oil as cutting fluids. In addition, between the two oil blends, the coconut + olive oil blend outperformed the other blend (coconut + rice bran oil).
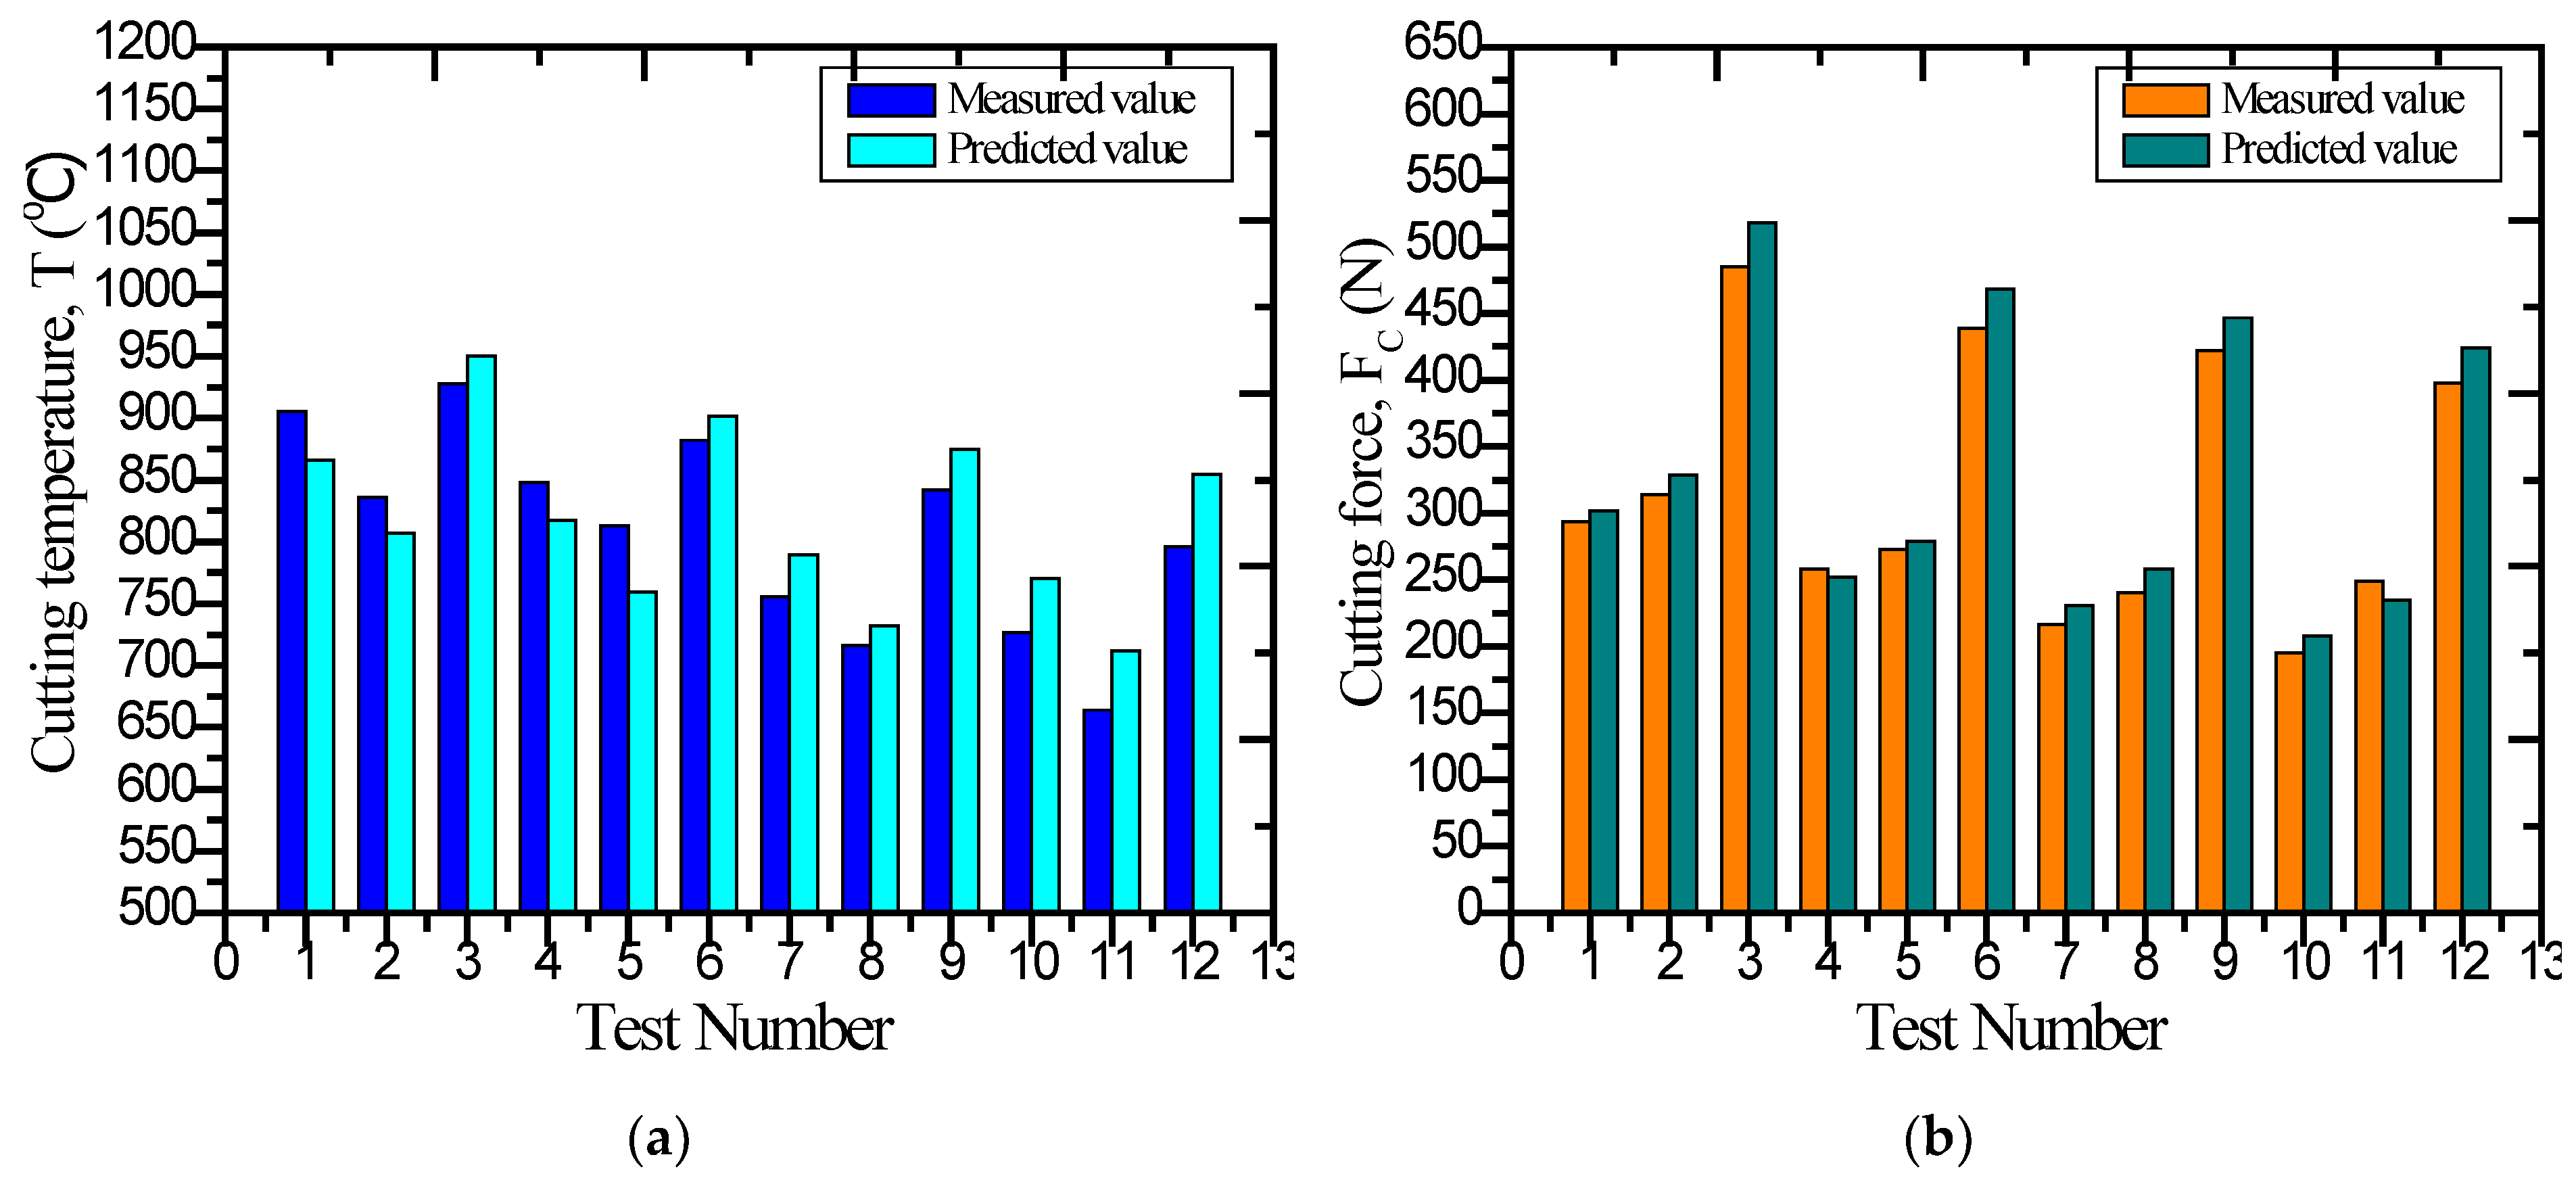
  • Based on the experimental data, predictive models for cutting temperature and cutting force were developed. Both of the models preserved over 92% accuracy (R2 value). This accuracy value indicated that the regression models explained more than 92% of the variability in the response data.
  • For both of the models, very little differences between the adjusted R2 and predicted R2 values confirmed the adequacy of the model. These models can accurately predict the responses within the range of process parameters used in the experimentation.
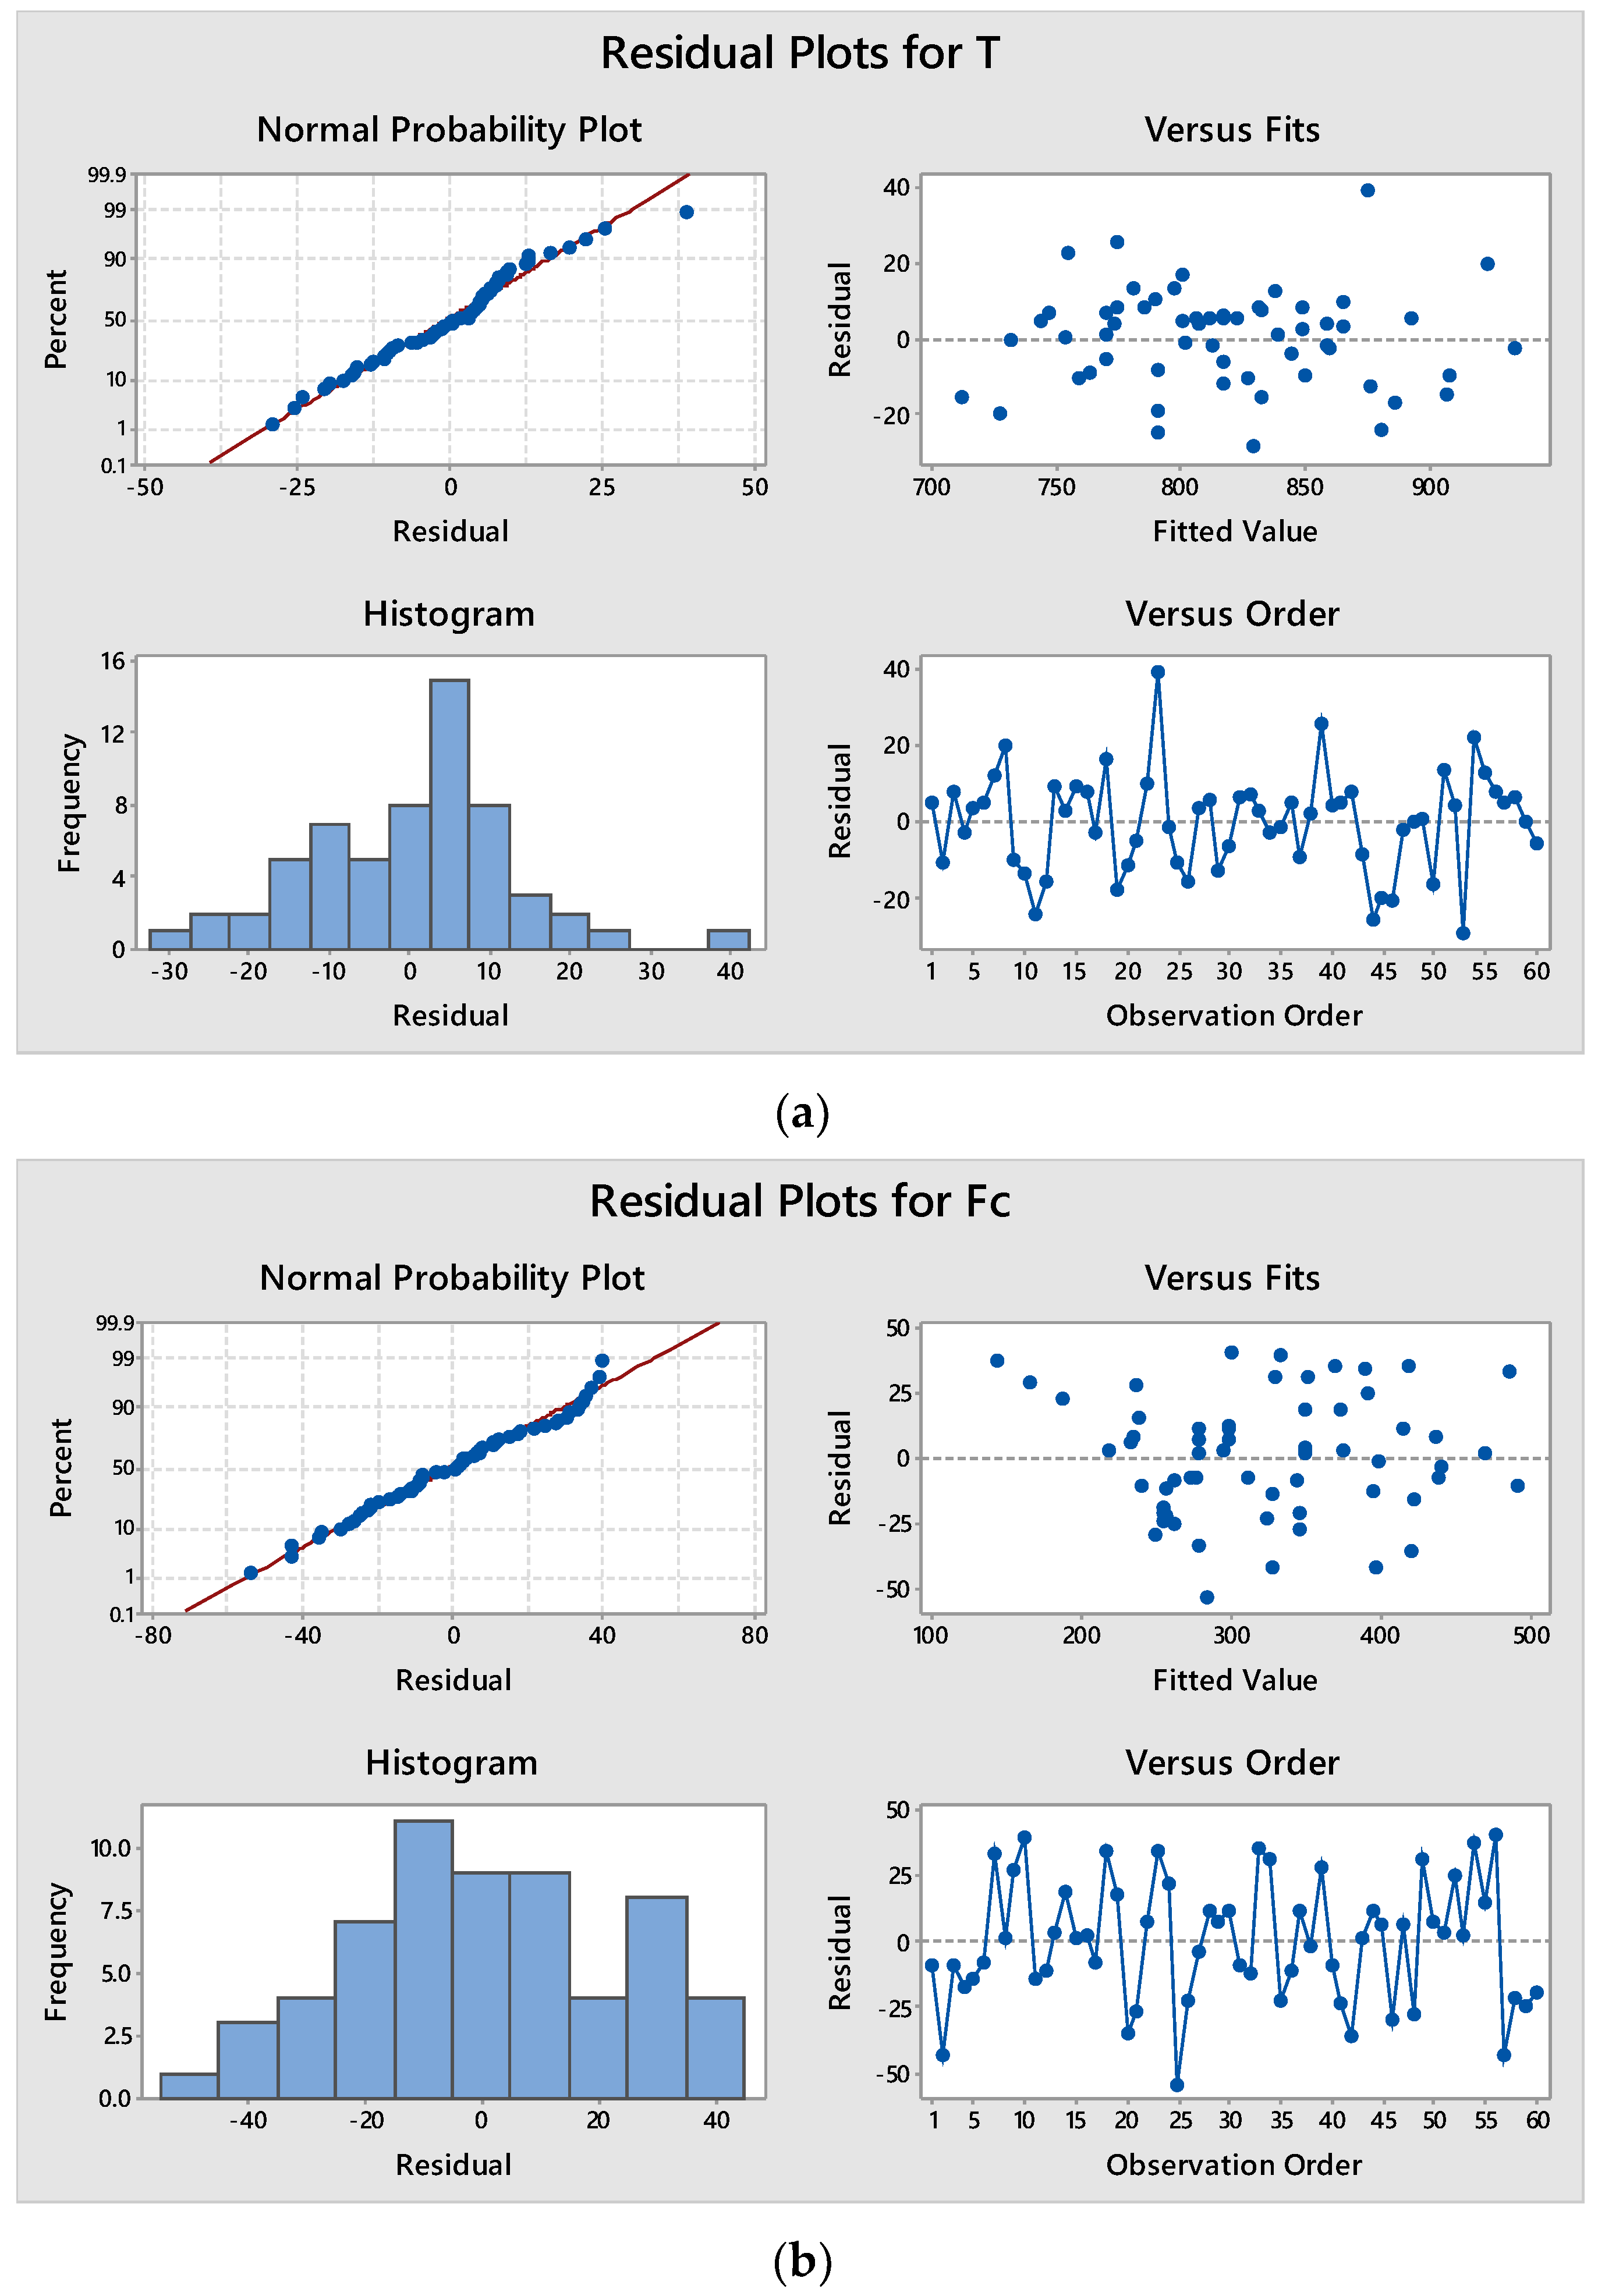
  • By using residual plots, the normality and randomness of the residuals for both regression models were also well established. Additionally, the residuals also showed constant variance and were correlated to each other. These confirmed the reliability of the regression models and data.
  • The regression models were verified with new observation data where the MAPE values were less than 10% for both responses.
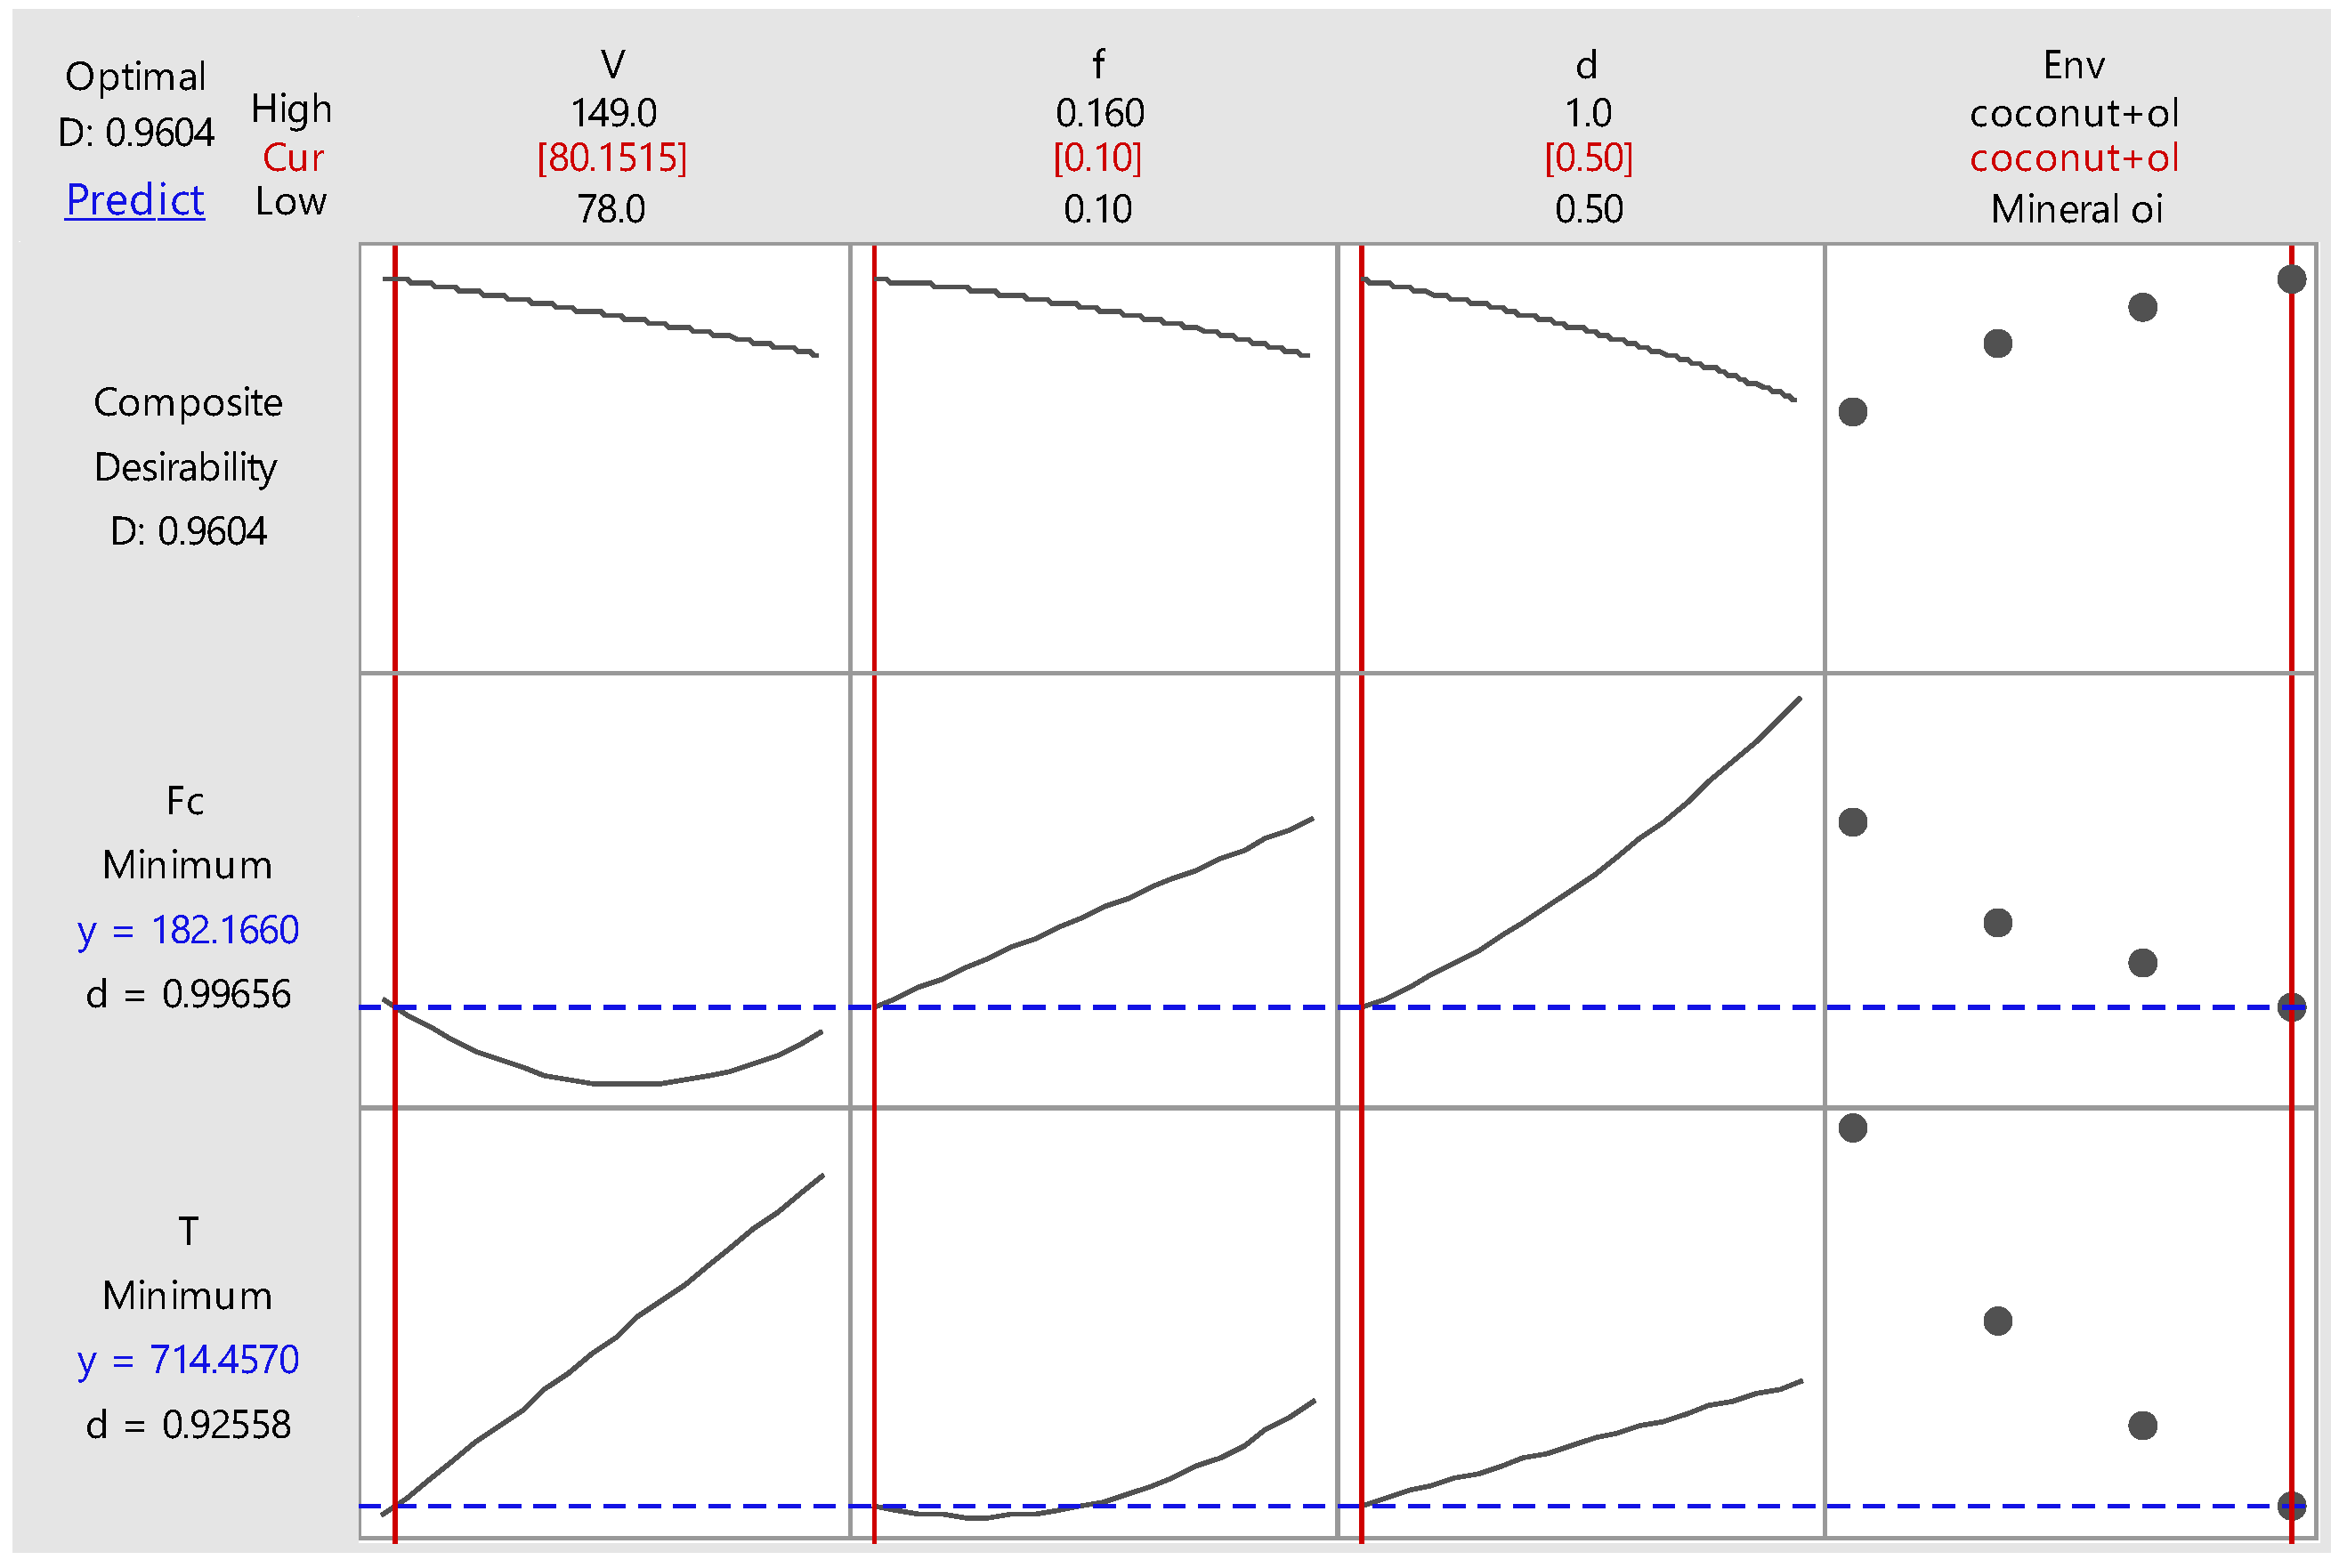
  • By using a composite desirability-based response optimizer, input parameters for this experiment were optimized for minimum cutting temperature and force simultaneously. Optimum process parameters were found as cutting speed at 80.15 m/min, feed rate at 0.1 mm/rev, and depth of cut at 0.5 mm under the coconut + olive oil blend-based MQL. A high composite desirability value (0.96) of the optimum process parameter settings indicated that this could achieve satisfactory results for all the responses.
  • The optimum result was validated and found reasonable improvement of the responses in these settings compared with the initial settings. This optimal setting was proved to be more effective for minimizing the cutting force compared with the cutting temperature. This result was aligned with the individual desirability values of the responses (Force-0.99 and T-0.92).

5. Future Recommendations

Future research could explore how MQL can be applied to other manufacturing processes, as well as the development of new lubricants specifically tailored for MQL conditions.
  • Different vegetable oils can be studied for new blending. Also, the mixing ratio can be varied in further investigation to reveal the effect.
  • Due to limited resources, this work only addresses two response parameters (temperature and force), but additional response parameters, such as tool wear, surface roughness, material removal rate (MRR), etc., can be experimentally analyzed.
  • The addition of nanoparticles in vegetable oil blends can be considered for advanced analysis.

Author Contributions

Conceptualization, P.B.Z.; methodology, I.D. and P.B.Z.; software, I.D.; validation, P.B.Z.; formal analysis, I.D. and P.B.Z.; investigation, I.D. and P.B.Z.; resources, I.D. and P.B.Z.; data curation, I.D.; writing—original draft preparation, I.D. and P.B.Z.; writing—review and editing, P.B.Z.; visualization, I.D.; supervision, P.B.Z.; project administration, P.B.Z.; funding acquisition, I.D. and P.B.Z. All authors have read and agreed to the published version of the manuscript.

Funding

This work was partially funded by the basic research fund by Bangladesh University of Engineering and Technology, Bangladesh (Grant No.: R-60-/Ref-5727, dated 28 January 2023).

Data Availability Statement

All the data mentioned in this paper.

Acknowledgments

The authors are grateful to the Department of Industrial and Production Engineering, Bangladesh University of Engineering and Technology, Bangladesh, for providing the laboratory facility to carry out the research work.

Conflicts of Interest

The authors declare no conflicts of interest. The funders had no role in the design of the study; in the collection, analyses, or interpretation of data; in the writing of the manuscript; or in the decision to publish the results.

References

  1. Bhatt, Y.; Ghuman, K.; Dhir, A. Sustainable manufacturing. Bibliometrics and content analysis. J. Clean. Prod. 2020, 260, 120988. [Google Scholar] [CrossRef]
  2. Huang, A.; Badurdeen, F. Sustainable Manufacturing Performance Evaluation: Integrating Product and Process Metrics for Systems Level Assessment. Procedia Manuf. 2017, 8, 563–570. [Google Scholar] [CrossRef]
  3. Malek, J.; Desai, T.N. A systematic literature review to map literature focus of sustainable manufacturing. J. Clean. Prod. 2020, 256, 120345. [Google Scholar] [CrossRef]
  4. Singh, G.; Singh, S.; Singh, M.; Kumar, A. Experimental investigations of vegetable & mineral oil performance during machining of EN-31 steel with minimum quantity lubrication. Int. J. Res. Eng. Technol. 2013, 2, 1030–1037. [Google Scholar] [CrossRef]
  5. Girsang, I.P.; Dhupia, J.S. Machine Tools for Machining. In Handbook of Manufacturing Engineering and Technology; Springer: London, UK, 2014; pp. 1–48. [Google Scholar]
  6. Jaspers, S.P.F.C.; Dautzenberg, J.H. Material behaviour in metal cutting: Strains, strain rates and temperatures in chip formation. J. Mater. Process Technol. 2002, 121, 123–135. [Google Scholar] [CrossRef]
  7. Li, A.; Zhao, J.; Luo, H.; Pei, Z.; Wang, Z. Progressive tool failure in high-speed dry milling of Ti-6Al-4V alloy with coated carbide tools. Int. J. Adv. Manuf. Technol. 2012, 58, 465–478. [Google Scholar] [CrossRef]
  8. Ranjan Das, S.; Panda, A.; Dhupal, D. Hard turning of AISI 4340 steel using coated carbide insert: Surface roughness, tool wear, chip morphology and cost estimation. Mater. Today Proc. 2018, 5, 6560–6569. [Google Scholar] [CrossRef]
  9. Revuru, R.S.; Zhang, J.Z.; Posinasetti, N.R.; Kidd, T. Optimization of titanium alloys turning operation in varied cutting fluid conditions with multiple machining performance characteristics. Int. J. Adv. Manuf. Technol. 2018, 95, 1451–1463. [Google Scholar] [CrossRef]
  10. Vipindas, K.; Mathew, J. Wear behavior of TiAlN coated WC tool during micro end milling of Ti-6Al-4V and analysis of surface roughness. Wear 2019, 424–425, 165–182. [Google Scholar] [CrossRef]
  11. Goindi, G.S.; Sarkar, P. Dry machining: A step towards sustainable machining—Challenges and future directions. J. Clean. Prod. 2017, 165, 1557–1571. [Google Scholar] [CrossRef]
  12. Sultana, N.; Dhar, N.R. A critical review on the progress of MQL in machining hardened steels. Adv. Mater. Process. Technol. 2022, 8, 3834–3858. [Google Scholar] [CrossRef]
  13. Lee, C.M.; Choi, Y.H.; Ha, J.H.; Woo, W.S. Eco-friendly technology for recycling of cutting fluids and metal chips: A review. Int. J. Precis. Eng. Manuf. Green Technol. 2017, 4, 457–468. [Google Scholar] [CrossRef]
  14. Yang, M.; Li, C.; Zhang, Y.; Jia, D.; Li, R.; Hou, Y.; Cao, H.; Wang, J. Predictive model for minimum chip thickness and size effect in single diamond grain grinding of zirconia ceramics under different lubricating conditions. Ceram. Int. 2019, 45, 14908–14920. [Google Scholar] [CrossRef]
  15. Tang, L.; Zhang, Y.; Li, C.; Zhou, Z.; Nie, X.; Chen, Y.; Cao, H.; Liu, B.; Zhang, N.; Said, Z.; et al. Biological Stability of Water-Based Cutting Fluids: Progress and Application. Chin. J. Mech. Eng. En. Ed. 2022, 35, 3. [Google Scholar] [CrossRef]
  16. Anton, S.; Andreas, S.; Friedrich, B. Heat dissipation in turning operations by means of internal cooling. Procedia Eng. 2015, 100, 1116–1123. [Google Scholar] [CrossRef]
  17. Kuram, E.; Ozcelik, B.; Demirbas, E. Environmentally Friendly Machining: Vegetable Based Cutting Fluids. In Green Manufacturing Processes and Systems; Springer: Berlin/Heidelberg, Germany, 2013; pp. 23–47. [Google Scholar]
  18. Heisel, U.; Lutz, D.; Wassmer, S. The minimum quantity lubricant technique and its application in cutting process. Mach. Met. Mag. 1998, 386, 22–38. [Google Scholar]
  19. Dhar, N.R.; Paul, S.; Chattopadhyay, A.B. Role of cryogenic cooling on cutting temperature turning steel. J. Manuf. Sci. Eng. Trans. ASME 2002, 124, 146–154. [Google Scholar] [CrossRef]
  20. Salur, E.; Kuntoğlu, M.; Aslan, A.; Pimenov, D.Y. The Effects of MQL and Dry Environments on Tool Wear, Cutting Temperature, and Power Consumption during End Milling of AISI 1040 Steel. Metals 2021, 11, 1674. [Google Scholar] [CrossRef]
  21. Hegab, H.; Kishawy, H.A.; Darras, B. Sustainable cooling and lubrication strategies in machining processes: A comparative study. Procedia Manuf. 2019, 33, 786–793. [Google Scholar] [CrossRef]
  22. Kazeem, R.A.; Fadare, D.A.; Ikumapayi, O.M.; Adediran, A.A.; Aliyu, S.J.; Akinlabi, S.A.; Jen, T.C.; Akinlabi, E.T. Advances in the Application of Vegetable-Oil-Based Cutting Fluids to Sustainable Machining Operations—A Review. Lubricants 2022, 10, 69. [Google Scholar] [CrossRef]
  23. Greaves, I.A.; Eisen, E.A.; Smith, T.J.; Pothier, L.J.; Kriebel, D.; Woskie, S.R.; Kennedy, S.M.; Shalat, S.; Monson, R.R. Respiratory health of automobile workers exposed to metal-working fluid aerosols: Respiratory symptoms. Am. J. Ind. Med. 1997, 32, 450–459. [Google Scholar] [CrossRef]
  24. Krahenbuhl, B.U. Vegetable oil-based coolants improve cutting performance. J. Cut. Fluids 2002, 68, 34–35. [Google Scholar]
  25. Sancho-Madriz, M.F. Encyclopedia of Food Sciences and Nutrition; Elsevier: Amsterdam, The Netherlands, 2003; ISBN 9780122270550. [Google Scholar]
  26. Singh, A.K.; Gupta, A.K. Metal working fluids from vegetable fluids. J. Synth. Lubr. 2006, 123, 167–176. [Google Scholar] [CrossRef]
  27. Debnath, S.; Reddy, M.M.; Yi, Q.S. Environmental friendly cutting fluids and cooling techniques in machining: A review. J. Clean. Prod. 2014, 83, 33–47. [Google Scholar] [CrossRef]
  28. Fox, N.J.; Stachowiak, G.W. Vegetable oil-based lubricants—A review of oxidation. Tribol. Int. 2017, 40, 1035–1046. [Google Scholar] [CrossRef]
  29. Mahadi, M.A.; Choudhury, I.A.; Azuddin, M.; Yusoff, N.; Yazid, A.A.; Norhafizan, A. Vegetable Oil-Based Lubrication in Machining: Issues and Challenges. In IOP Conference Series: Materials Science and Engineering; Institute of Physics Publishing: Bristol, UK, 2019; Volume 530. [Google Scholar] [CrossRef]
  30. Xavior, M.A.; Adithan, M. Determining the influence of cutting fluids on tool wear and surface roughness during turning of AISI 304 austenitic stainless steel. J. Mater. Process. Technol. 2009, 209, 900–909. [Google Scholar] [CrossRef]
  31. Hashempour-Baltork, F.; Torbati, M.; Azadmard-Damirchi, S.; Savage, G.P. Vegetable oil blending: A review of physicochemical, nutritional and health effects. Trends Food Sci. Technol. 2016, 57, 52–58. [Google Scholar] [CrossRef]
  32. Sankaranarayanan, R.; Rajesh, J.H.N.; Senthil Kumar, J.; Krolczyk, G.M. A comprehensive review on research developments of vegetable-oil based cutting fluids for sustainable machining challenges. J. Manuf. Process. 2021, 67, 286–313. [Google Scholar] [CrossRef]
  33. Khanna, N.; Agrawal, C.; Gupta, M.K.; Song, Q. Tool wear and hole quality evaluation in cryogenic Drilling of Inconel 718 superalloy. Tribol. Int. 2020, 143, 106084. [Google Scholar] [CrossRef]
  34. Sun, S.; Brandt, M.; Palanisamy, S.; Dargusch, M.S. Effect of cryogenic compressed air on the evolution of cutting force and tool wear during machining of Ti-6Al-4V alloy. J. Mater. Process. Technol. 2015, 221, 243–254. [Google Scholar] [CrossRef]
  35. Karkade, H.B.; Patil, N.G. Comparative investigations into high speed machining of A-B titanium alloy (Ti-6al-4v) under dry and compressed Co2 gas cooling environment. AIP Conf. Proc. 2018, 2018, 020009. [Google Scholar] [CrossRef]
  36. Mia, M.; Gupta, M.K.; Lozano, J.A.; Carou, D.; Pimenov, D.Y.; Królczyk, G.; Khan, A.M.; Dhar, N.R. Multi-objective optimization and life cycle assessment of eco-friendly cryogenic N2 assisted turning of Ti-6Al-4V. J. Clean. Prod. 2019, 210, 121–133. [Google Scholar] [CrossRef]
  37. Revuru, R.S.; Posinasetti, N.R.; Vsn, V.R.; Amrita, M. Application of cutting fluids in machining of titanium alloys—A review. Int. J. Adv. Manuf. Technol. 2017, 91, 2477–2498. [Google Scholar] [CrossRef]
  38. Liew, P.J.; Shaaroni, A.; Sidik, N.A.C.; Yan, J. An overview of current status of cutting fluids and cooling techniques of turning hard steel. Int. J. Heat Mass Transf. 2017, 114, 380–394. [Google Scholar] [CrossRef]
  39. Krolczyk, G.M.; Maruda, R.W.; Krolczyk, J.B.; Wojciechowski, S.; Mia, M.; Nieslony, P.; Budzik, G. Ecological trends in machining as a key factor in sustainable production—A review. J. Clean. Prod. 2019, 218, 601–615. [Google Scholar] [CrossRef]
  40. Elmunafi, M.H.S.; Kurniawan, D.; Noordin, M.Y. Use of Castor Oil as Cutting Fluid in Machining of Hardened Stainless Steel with Minimum Quantity of Lubricant. Procedia CIRP 2015, 26, 408–411. [Google Scholar] [CrossRef]
  41. Anuja Beatrice, B.; Kirubakaran, E.; Ranjit Jeba Thangaiah, P.; Leo Dev Wins, K. Surface roughness prediction using artificial neural network in hard turning of AISI H13 steel with minimal cutting fluid application. Procedia Eng. 2014, 97, 205–211. [Google Scholar] [CrossRef]
  42. Sharma, A.K.; Tiwari, A.K.; Dixit, A.R. Effects of Minimum Quantity Lubrication (MQL) in machining processes using conventional and nanofluid based cutting fluids: A comprehensive review. J. Clean. Prod. 2016, 127, 1–18. [Google Scholar] [CrossRef]
  43. Dhar, N.R.; Kamruzzaman, M.; Ahmed, M. Effect of minimum quantity lubrication (MQL) on tool wear and surface roughness in turning AISI-4340 steel. J. Mater. Process. Technol. 2006, 172, 299–304. [Google Scholar] [CrossRef]
  44. Tasdelen, B.; Wikblom, T.; Ekered, S. Studies on minimum quantity lubrication (MQL) and air cooling at drilling. J. Mater. Process. Technol. 2008, 200, 339–346. [Google Scholar] [CrossRef]
  45. Silva, L.R.; Corrêa, E.C.S.; Brandão, J.R.; de Ávila, R.F. Environmentally friendly manufacturing: Behavior analysis of minimum quantity of lubricant-MQL in grinding process. J. Clean. Prod. 2020, 256, 103287. [Google Scholar] [CrossRef]
  46. Mulyadi, I.H.; Balogun, V.A.; Mativenga, P.T. Environmental performance evaluation of different cutting environments when milling H13 tool steel. J. Clean. Prod. 2015, 108, 110–120. [Google Scholar] [CrossRef]
  47. Iruj, M.; Yaqoob, S.; Ghani, J.A.; Jaber, H.; Saibani, N.; Alkhedher, M. State-of-the-art hybrid lubrication (Cryo-MQL) supply systems, performance evaluation, and optimization studies in various machining processes. Results Eng. 2024, 22, 102090. [Google Scholar] [CrossRef]
  48. Tuan, N.M.; Duc, T.M.; Long, T.T.; Hoang, V.L.; Ngoc, T.B. Investigation of Machining Performance of MQL and MQCL Hard Turning Using Nano Cutting Fluids. Fluids 2022, 7, 143. [Google Scholar] [CrossRef]
  49. Ajay Vardhaman, B.S.; Amarnath, M.; Jhodkar, D.; Ramkumar, J.; Chelladurai, H.; Roy, M.K. Influence of coconut oil on tribological behavior of carbide cutting tool insert during turning operation. J. Braz. Soc. Mech. Sci. Eng. 2018, 40, 450. [Google Scholar] [CrossRef]
  50. Khan, M.M.A.; Dhar, N.R. Performance evaluation of minimum quantity lubrication by vegetable oil in terms of cutting force, cutting zone temperature, tool wear, job dimension and surface finish in turning AISI-1060 steel. J. Zhejiang Univ. Sci. 2006, 7, 1790–1799. [Google Scholar] [CrossRef]
  51. Khan, M.M.A.; Mithu, M.A.H.; Dhar, N.R. Effects of minimum quantity lubrication on turning AISI 9310 alloy steel using vegetable oil-based cutting fluid. J. Mater. Process. Technol. 2009, 209, 5573–5583. [Google Scholar] [CrossRef]
  52. Susmitha, M.; Sharan, P.; Jyothi, P.N. Influence of non-edible vegetable based oil as cutting fluid on chip, surface roughness and cutting force during drilling operation of Mild Steel. In IOP Conference Series: Materials Science and Engineering; Institute of Physics Publishing: Bristol, UK, 2016; Volume 149. [Google Scholar]
  53. Zaman, P.B.; Tusar, M.I.H.; Dhar, N.R. Selection of appropriate process inputs for turning Ti-6Al-4V alloy under hybrid Al2O3-MWCNT nano-fluid based MQL. Adv. Mater. Process. Technol. 2022, 8, 380–400. [Google Scholar] [CrossRef]
  54. Panda, D.; Kumari, K.; Dalai, N. Performance of Minimum Quantity Lubrication (MQL) and its effect on Dry Machining with the addition of Nano-particle with the biodegradable base fluids: A review. Mater. Today Proc. 2022, 56, 1298–1301. [Google Scholar] [CrossRef]
  55. Xiong, Y.; Wu, J.; Deng, C.; Wang, Y. Machining process parameters optimization for heavy-duty CNC machine tools in sustainable manufacturing. Int. J. Adv. Manuf. Technol. 2016, 87, 1237–1246. [Google Scholar] [CrossRef]
  56. Sristi, N.A.; Zaman, P.B.; Dhar, N.R. Multi-response optimization of hard turning parameters: A comparison between different hybrid Taguchi-based MCDM methods. Int. J. Interact. Des. Manuf. 2022, 16, 1779–1795. [Google Scholar] [CrossRef]
  57. Zaman, P.B.; Dhar, N.R. Multi-objective Optimization of Double-Jet MQL System Parameters Meant for Enhancing the Turning Performance of Ti–6Al–4V Alloy. Arab. J. Sci. Eng. 2020, 45, 9505–9526. [Google Scholar] [CrossRef]
  58. Muthuram, N.; Frank, F.C. Optimization of machining parameters using artificial Intelligence techniques. Mater. Today Proc. 2021, 46, 8097–8102. [Google Scholar] [CrossRef]
  59. Suresh, R.; Basavarajappa, S. Effect of Process Parameters on Tool Wear and Surface Roughness during Turning of Hardened Steel with Coated Ceramic Tool. Procedia Mater. Sci. 2014, 5, 1450–1459. [Google Scholar] [CrossRef]
  60. Mia, M.; Khan, M.A.; Dhar, N.R. Study of surface roughness and cutting forces using ANN, RSM, and ANOVA in turning of Ti-6Al-4V under cryogenic jets applied at flank and rake faces of coated WC tool. Int. J. Adv. Manuf. Technol. 2017, 93, 975–991. [Google Scholar] [CrossRef]
  61. Bartarya, G.; Choudhury, S.K. Effect of cutting parameters on cutting force and surface roughness during finish hard turning aisi52100 grade steel. Procedia CIRP 2012, 1, 651–656. [Google Scholar] [CrossRef]
  62. Zahia, H.; Athmane, Y.M.; Lakhdar, B.; Tarek, M. On the application of response surface methodology for predicting and optimizing surface roughness and cutting forces in hard turning by PVD coated insert. Int. J. Ind. Eng. Comput. 2015, 6, 267–284. [Google Scholar] [CrossRef]
  63. Zaman, P.; Dhar, N. Multi-criteria Process Optimization for better machinability in Turning Medium Carbon Steel using Composite Desirability Approach. Int. J. Manuf. Res. 2021, 16, 280–308. [Google Scholar] [CrossRef]
  64. Bousnina, K.; Hamza, A.; Ben Yahia, N. A combination of PSO-ANN hybrid algorithm and genetic algorithm to optimize technological parameters during milling 2017A alloy. J. Ind. Prod. Eng. 2023, 40, 554–571. [Google Scholar] [CrossRef]
  65. Javid, H.; Jahanzaib, M.; Jawad, M.; Ali, M.A.; Farooq, M.U.; Pruncu, C.I.; Hussain, S. Parametric analysis of turning HSLA steel under minimum quantity lubrication (MQL) and nanofluids-based minimum quantity lubrication (NF-MQL): A concept of one-step sustainable machining. Int. J. Adv. Manuf. Technol. 2021, 117, 1915–1934. [Google Scholar] [CrossRef]
  66. Amini, M.; Djazayery, A.; Majdzadeh, R.; Taghdisi, M.H.; Jazayeri, S. Effect of school-based interventions to control childhood obesity: A review of reviews. Int. J. Prev. Med. 2015, 6, 68. [Google Scholar] [CrossRef] [PubMed]
  67. Dureja, J.S.; Singh, R.; Singh, T.; Singh, P.; Dogra, M.; Bhatti, M.S. Performance evaluation of coated carbide tool in machining of stainless steel (AISI 202) under minimum quantity lubrication (MQL). Int. J. Precis. Eng. Manuf. Green Technol. 2015, 2, 123–129. [Google Scholar] [CrossRef]
  68. Amiril, S.A.S.; Rahim, E.A.; Hishamudin, A.Z. Effect of nozzle distance and cutting parameters on MQL machining of AISI 1045. J. Phys. Conf. Ser. 2019, 1150, 012045. [Google Scholar] [CrossRef]
  69. Zaman, P.B.; Dhar, N.R. Design and evaluation of an embedded double jet nozzle for MQL delivery intending machinability improvement in turning operation. J. Manuf. Process. 2019, 44, 179–196. [Google Scholar] [CrossRef]
  70. Goethals, P.L.; Cho, B.R. Experimental analysis of estimator functions in response surface designs. In IIE Annual Conference Proceedings; Institute of Industrial Engineers: Norcross, GA, USA, 2010. [Google Scholar]
  71. Boyaci, I.H. A new approach for determination of enzyme kinetic constants using response surface methodology. Biochem. Eng. J. 2005, 25, 55–62. [Google Scholar] [CrossRef]
  72. Manohar, T.S.M.; Joseph, J. Application of Box Behnken design to optimize the parameters for turning Inconel 718 using coated carbide tools. Int. J. Sci. Eng. Res. 2013, 4, 620–642. [Google Scholar]
  73. Beg, S.; Akhter, S. Box–Behnken Designs and Their Applications in Pharmaceutical Product Development. In Design of Experiments for Pharmaceutical Product Development Volume I: Basics and Fundamental Principles; Springer: Singapore, 2021; Volume 1, pp. 77–85. [Google Scholar]
  74. Singh, J.; Gill, S.S.; Dogra, M.; Singh, R. A review on cutting fluids used in machining processes. Eng. Res. Express 2021, 3, 012002. [Google Scholar] [CrossRef]
  75. Majumder, H.; Paul, T.R.; Dey, V.; Dutta, P.; Saha, A. Use of PCA-grey analysis and RSM to model cutting time and surface finish of Inconel 800 during wire electro discharge cutting. Meas. J. Int. Meas. Confed. 2017, 107, 19–30. [Google Scholar] [CrossRef]
  76. Koç, B.; Kaymak-Ertekin, F. Response Surface Methodology and Food Processing Applications. Gida 2010, 35, 63–70. [Google Scholar]
  77. de Myttenaere, A.; Golden, B.; Le Grand, B.; Rossi, F. Mean Absolute Percentage Error for regression models. Neurocomputing 2016, 192, 38–48. [Google Scholar] [CrossRef]
  78. Zaman, P.B. Experimental and Numerical Investigations of Minimum Quantity Lubrication with Hybrid Nano-Fluid on Machinability of Titanium Alloy. Ph.D. Thesis, Bangladesh University of Engineering and Technology, Dhaka, Bangladesh, 2021. [Google Scholar]
  79. Xiao, M.; Shen, X.; Ma, Y.; Yang, F.; Gao, N.; Wei, W.; Wu, D. Prediction of Surface Roughness and Optimization of Cutting Parameters of Stainless Steel Turning Based on RSM. Math. Probl. Eng. 2018, 2018, 9051084. [Google Scholar] [CrossRef]
  80. Pant, P.; Chatterjee, D. Prediction of clad characteristics using ANN and combined PSO-ANN algorithms in laser metal deposition process. Surf. Interfaces 2020, 21, 100699. [Google Scholar] [CrossRef]
  81. Jumare, A.I.; Abou-El-Hossein, K.; Abdulkadir, L.N.; Liman, M.M. Predictive modeling and multiobjective optimization of diamond turning process of single-crystal silicon using RSM and desirability function approach. Int. J. Adv. Manuf. Technol. 2019, 103, 4205–4220. [Google Scholar] [CrossRef]
  82. Adalarasan, R.; Santhanakumar, M. Response surface methodology and desirability analysis for optimizingμwedmparameters for Al6351/20%Al2O3 composite. Int. J. ChemTech Res. 2015, 7, 2625–2631. [Google Scholar]
Figure 1. Heat generation during turning operation. (Reproduced from [12] with copyright permission from the publisher. License number: 5900791037015).
Lubricants 12 00444 g001
Figure 2. Types of cutting fluids. (Reproduced from [15]; permission not required).
Lubricants 12 00444 g002
Figure 3. Alternative cooling methods.
Lubricants 12 00444 g003
Figure 5. Photographic view of the experimental setup.
Lubricants 12 00444 g005
Figure 6. Minimum quantity lubrication (MQL) setup.
Lubricants 12 00444 g006
Figure 7. Mixing of oils. (a) Coconut + rice bran oil; (b) coconut + olive oil.
Lubricants 12 00444 g007
Figure 8. Schematic diagram of the tool–work thermocouple. (Reproduced from [69] with copyright permission from the publisher [69]. License number: 5900441171721).
Lubricants 12 00444 g008
Figure 9. Tool–work thermocouple calibration curve.
Lubricants 12 00444 g009
Figure 10. Dynamometer setup for force measurement.
Lubricants 12 00444 g010
Figure 11. Percentage reduction in (a) temperature and (b) cutting force.
Lubricants 12 00444 g011
Figure 12. Residual plots for (a) cutting temperature and (b) cutting force.
Lubricants 12 00444 g012
Figure 13. Comparison of experimental and predicted responses. (a) Cutting temperature and (b) cutting force.
Lubricants 12 00444 g013
Figure 14. Response optimization graph.
Lubricants 12 00444 g014
Table 1. Experimental conditions.
Machine Tool: Lathe Machine (KL-3280C/2000), spindle power 7.5 KW
Work Material: Medium Carbon Steel
Tool Material: Uncoated Tungsten Carbide
Cooling Condition: MQL
MQL Supply Parameters:
 Air Pressure: 23 bar
 Oil Pressure: 25 bar
 Oil Quantity: 150 mL/h
 Nozzle Diameter: 1 mm
MQL Coolants:
i. Mineral Oil (VG 68 Cutting Fluid)
ii. Coconut Oil
iii. Coconut + Rice Bran Oil
iv. Coconut + Olive Oil
Process Parameters:
 Cutting Speed (V): 78, 113.5, 149 m/min
 Feed Rate (f): 0.1, 0.13, 0.16 mm/rev
 Depth of Cut (d): 0.5, 0.75, 1 mm
Table 2. Oil proportions of the formulated vegetable oil blends.
Oil SampleVegetable OilOil QuantityBlend Ratio
Oil blend 1Coconut oil500 mL1:1
Rice bran oil500 mL
Oil blend 2Coconut oil500 mL1:1
Olive oil500 mL
Table 3. Process parameters with their levels.
Sl. NoVariableSymbolsUnitLower LevelUpper Level
1Cutting SpeedVm/min78149
2Feed Ratefmm/rev0.100.16
3Depth of Cutdmm0.51
4Cooling EnvironmentCECategoricalMOCOCO + RBOCO + OLO
N.B. MO—mineral oil; CO—coconut oil; RBO—rice bran oil; OLO—olive oil.
Table 4. DOE and experimental data.
Exp No.V (m/min)f (mm/rev)d (mm)CETFc
1780.10.75MO828335
21490.10.75MO898285
3780.160.75MO857432
41490.160.75MO932407
5780.130.5MO811314
61490.130.5MO898304
7780.131MO851520
81490.131MO944471
9113.50.10.5MO840265
10113.50.160.5MO863373
11113.50.11MO857382
12113.50.161MO892481
13113.50.130.75MO875353
14113.50.130.75MO869368
15113.50.130.75MO875351
16780.10.75CO782297
171490.10.75CO857270
18780.160.75CO817425
191490.160.75CO869392
20780.130.5CO748244
211490.130.5CO840236
22780.131CO800445
231490.131CO915455
24113.50.10.5CO800210
25113.50.160.5CO817230
26113.50.11CO817324
27113.50.161CO863438
28113.50.130.75CO823312
29113.50.130.75CO805307
30113.50.130.75CO811311
31780.10.75CO + RBO754265
321490.10.75CO + RBO840245
33780.160.75CO + RBO777405
341490.160.75CO + RBO857384
35780.130.5CO + RBO731235
361490.130.5CO + RBO823230
37780.131CO + RBO754427
381490.131CO + RBO851397
39113.50.10.5CO + RBO800195
40113.50.160.5CO + RBO805254
41113.50.11CO + RBO811301
42113.50.161CO + RBO840385
43113.50.130.75CO + RBO782280
44113.50.130.75CO + RBO765290
45113.50.130.75CO + RBO771285
46780.10.75CO + OLO707221
471490.10.75CO + OLO811240
48780.160.75CO + OLO754319
491490.160.75CO + OLO840361
50780.130.5CO + OLO696242
511490.130.5CO + OLO811221
52780.131CO + OLO748418
531490.131CO + OLO800379
54113.50.10.5CO + OLO777181
55113.50.160.5CO + OLO794255
56113.50.11CO + OLO794342
57113.50.161CO + OLO817355
58113.50.130.75CO + OLO777234
59113.50.130.75CO + OLO771231
60113.50.130.75CO + OLO765236
Table 5. Percentage (%) reduction for temperature and cutting force.
Sl. No.V
m/min
F
mm/rev
D
mm
CO
% Reduction
CO + RBO
% Reduction
CO + OLO
% Reduction
TFcTFcTFc
1780.10.755.5611.358.9420.914.6234.03
21490.10.754.575.276.4614.049.6915.79
3780.130.57.7722.309.8725.1614.1922.93
41490.130.56.4622.378.3624.359.6927.31
5780.1316.0014.4311.417.8912.1119.62
61490.1313.083.409.8615.7215.2619.54
7113.50.10.54.7720.764.7726.427.5031.70
8113.50.160.55.3438.346.7331.918.0031.64
9113.50.1613.268.945.8319.968.4126.20
AVG5.2016.358.0221.8211.0525.42
Table 6. ANOVA table for temperature.
SourceDFAdj SSAdj MSF-Valuep-Value
Model7150,99921,571.3115.550.000
Linear6148,51524,752.6132.590.000
V158,73958,738.8314.640.063
f155395538.829.670.000
d178137812.541.850.000
Env376,42525,475.1136.460.000
Square124842484.013.310.001
V*V124842484.013.310.001
Error529709186.7
Lack-of-Fit449295211.24.100.020
Pure Error841351.6
Total59160,707
Model Summary
SR-sqR-sq (adj)R-sq (pred)
13.663293.96%93.15%91.89%
Table 7. ANOVA table for cutting force.
SourceDFAdj SSAdj MSF-Valuep-Value
Model8368,50246,06374.450.000
Linear6348,29358,04993.830.000
V1222822283.600.063
f173,92073,920119.480.000
d1200,186200,186323.570.000
Env371,95923,98638.770.000
Square220,20910,10516.330.000
V*V117,81717,81728.800.000
d*d1340134015.500.023
Error5131,553619
Lack-of-Fit4331,30472823.360.000
Pure Error824931
Total59400,055
Model Summary
SR-sqR-sq (adj)R-sq (pred)
24.873492.11%90.88%88.90%
Table 8. Experimental and predicted responses for a new set of experimental runs.
RunInput
Parameters
Experimental OutputPredicted OutputAPE
V
(m/min)
f
(mm/rev)
D
(mm)
CET
(°C)
Fc
(N)
T
(°C)
Fc
(N)
T
(%)
Fc
(%)
1113.50.10.75MO9052948663024.362.56
2780.130.58363148073293.434.65
31490.1619284859505182.416.84
4113.50.10.75CO8482588172523.642.39
5780.130.58132737592796.652.16
61490.1618824399024682.266.71
7113.50.10.75CO + RBO7562177902314.536.28
8780.130.57162407322582.247.37
91490.1618424228754473.935.99
10113.50.10.75CO + OLO7271957702085.936.58
11780.130.56642497122357.255.67
121490.1617963988554247.416.65
Table 9. Optimum parameter selection.
Optimum Parameters
Cutting Speed80.15 m/min
Feed Rate0.10 mm/min
Depth of Cut0.50 mm
Cutting EnvironmentCoconut + Olive Oil Blend
Table 10. Validity test results.
ResponsesInitial SettingsRSM SettingsImprovement in Responses
Predicted ValueExperimental ValuePredicted ValueExperimental Value
Parameter settings
(V, f, d, Env)
78, 0.1, 0.75, MO80.15, 0.1, 0.5, CO + OLO-
Cutting temperature82382871469815.7%
Cutting force34433518219442%
Disclaimer/Publisher’s Note: The statements, opinions and data contained in all publications are solely those of the individual author(s) and contributor(s) and not of MDPI and/or the editor(s). MDPI and/or the editor(s) disclaim responsibility for any injury to people or property resulting from any ideas, methods, instructions or products referred to in the content.

