Article

Influence and Optimization of Nozzle Position on Lubricant Distribution in an Angular Contact Ball Bearing Cavity

by
Baogang Wen
1,
Yuanyuan Li
1,
Yemin Li
1,
Meiling Wang
2,* and
Jingyu Zhai
3,4
1
School of Mechanical Engineering and Automation, Dalian Polytechnic University, Dalian 116034, China
2
Zhan Tianyou Honors College, Dalian Jiaotong University, Dalian 116028, China
3
School of Mechanical Engineering, Dalian University of Technology, Dalian 116024, China
4
Ningbo Institute of Dalian University of Technology, Ningbo 315032, China
*
Author to whom correspondence should be addressed.
Lubricants 2024, 12(12), 419; https://doi.org/10.3390/lubricants12120419
Submission received: 14 October 2024 / Revised: 24 November 2024 / Accepted: 26 November 2024 / Published: 28 November 2024
(This article belongs to the Special Issue Tribological Characteristics of Bearing System, 2nd Edition)

Abstract

:
In this paper, the lubrication flow field model for an angular contact ball bearing considering the characteristics of the nozzle position was constructed with CFD methods, and the simulation results were compared and validated with the test results. The research was carried out on the lubricant distribution characteristics in the bearing cavity under different nozzle angles and heights, and the nozzle position was optimized with the response surface methodology. The results show that the lubrication distribution characteristics in the bearing cavity are closely related to the nozzle angle and height. The weighted average of the oil phase volume fraction on the cage guiding surface decreases first and then increases with the increase of the nozzle height and decreases with the increase of the nozzle angle on the ball surface. The optimal nozzle position was determined by finding the maximum value of the regression function in the specified area.

1. Introduction

The lubrication characteristics of angular contact ball bearings, which are crucial support components in aeroengines and machine tools, are directly related to their life and reliability. These characteristics are influenced by the lubrication performance [1]. The position of the oil jet nozzle used for lubrication is vital for ensuring proper distribution of lubricant within the bearing cavity.
About modeling of lubrication flow field in bearings: Yan [2] established a highly precise numerical model with different nozzle distributions and tracked the oil-air interface using the VOF method. Bei Yan [3] used a coupling of the Level Set function and VOF method to track the oil-air interface and obtain the migration and diffusion process of oil droplets in the bearing cavity. Bao [4] used the Coupled Level Set Volume of Fluid (CLSVOF) method to track the oil-air two-phase flow inside the ball bearing with under-race lubrication. Ge [5] studied the flow behavior of oil on the bearing inner ring surface by adding groove structures to the non-contact area of the bearing inner ring surface. Chen [6] established a transient air–oil two-phase flow model in a ball bearing based on computational fluid dynamics (CFD) to investigate the behaviors of oil transfer and air–oil flow under different capillary conditions with speed, surface tension, and viscosity and found that the oil distribution and air–oil flow behaviors in a ball bearing are strongly related to the speed and the ratio of oil viscosity. Shan [7] established the lubrication analysis model of ball bearing, and the evolution of hydrodynamic behavior, including the oil-air distribution, temperature, and flow characteristics during different lubrication states, is displayed. Oh [8] used flow field simulation techniques of computational fluid dynamics to analyze the three-dimensional airflow behavior in a ball bearing. Liu [9] used a fluid–structure coupled simulation model based on the CFD method of air–oil two-phase flow (AOTPF) in the bearing to discuss the lubricating characteristics of an oil jet-lubricated ball bearing in the gearbox. Peterson [10] used ANSYS FLUENT computational fluid dynamics (CFD) software to develop a full-scale model of a single-phase oil flow in a deep groove ball bearing (DGBB) and measure the frictional torque of oil-lubricated rolling element bearings and compare fluid drag losses with CFD simulations. Aidarinis [11] experimentally studied the flow field inside the bearing external chamber using a laser Doppler anemometry system and carried out at real operating conditions, both for the airflow and for the lubricant oil flow and for a range of shaft rotating speeds, then computed by fluid dynamics (CFD) modeling.
About testing on lubrication flow field inside bearings: Maccioni [12,13] designed a dedicated test rig to perform Particle Image Velocimetry (PIV) measurements on the lubricant inside a tapered roller bearing using a sapphire outer ring. He [14] directly observed the distribution of the lubricant film in a custom-made model-bearing rig, with an outer ring replaced by a glass ring to allow full optical access. Arya [15] studied the oil flow inside an angular contact ball bearing using Bubble Image Velocimetry (BIV). The oil flow inside the cage and bearing was analyzed using a high-speed camera, and the observed oil flow streamlines demonstrated the influence of operating conditions and cage designs on fluid flow. Wen [16] built one measurement system for lubricant distribution that obtained grayscale images to characterize the lubricant distribution, and then the image pixels were evaluated for the characterization of lubricant volume. Chen [17] proposed a novel experimental method that combines synchronized dual-camera imaging with laser-induced fluorescence (LIF) using extra illumination to observe the oil flow in a ball bearing and then observed the distribution of the lubricant film with an outer ring replaced by a glass ring. Takashi Node [18] used X-ray computed tomography (CT), which is one of the non-destructive inspection techniques to visualize remarkable details of grease distribution in a resin ball bearing. Sakai [19] used a neutron imaging technology to perform non-destructive visualization of the grease fluidity and migration inside a ball bearing. Franken [20] applied fluorescence spectroscopy technology to identify oil migration in the bearing. Nitric oxide laser-induced fluorescence imaging methods [21] and PIV (Micro Particle Image Velocimetry) [22,23] to measure the grease velocity vector field.
About optimizing the bearing nozzle: Hu [24] proposed a new nozzle structure, and the three-dimensional simulation model of the internal moving components of the bearing considering the movement of the lubricant at the nozzle outlet was established. The two conventional nozzle structures and the new nozzle structure were compared and analyzed by numerical simulation for the oil-air two-phase flow distribution law under different working conditions. The fluid flow characteristics in the bearing cavity and contact area and its key structural parameters were investigated and improved by Yan [25]. Li [26] studied the influence of different structural parameters on the force of the valve core and obtained the optimal structural parameters under given operating conditions by using computational fluid dynamics (CFD) and the orthogonal design method. Wu [27,28] investigated the air-oil two-phase flow inside an oil jet-lubricated ball bearing through numerical simulations and corresponding tests and obtained the influence of jet velocity and oil flow rate on the average oil volume fraction inside the bearing cavity and then determined the number of nozzles.
The lubrication flow field in bearings has been extensively studied. However, there is a lack of quantitative verification and limited focus on the flow characteristics of rolling elements. As a result, the lubricant distribution rule of the bearing cavity remains undisclosed.
A lubrication flow field model of an angular contact ball bearing was constructed in this paper and validated by experiments. The study investigated the lubricant distribution of the bearing cavity under different nozzle angles and heights, using observation surfaces on both the ball surface and cage guiding surface. Subsequently, the optimal nozzle position under given operating conditions was determined. These findings can provide valuable insights for lubrication flow field analyses and a method for optimizing nozzle position under multiparameter coupling.

2. Modeling and Verification for Lubrication Flow Field

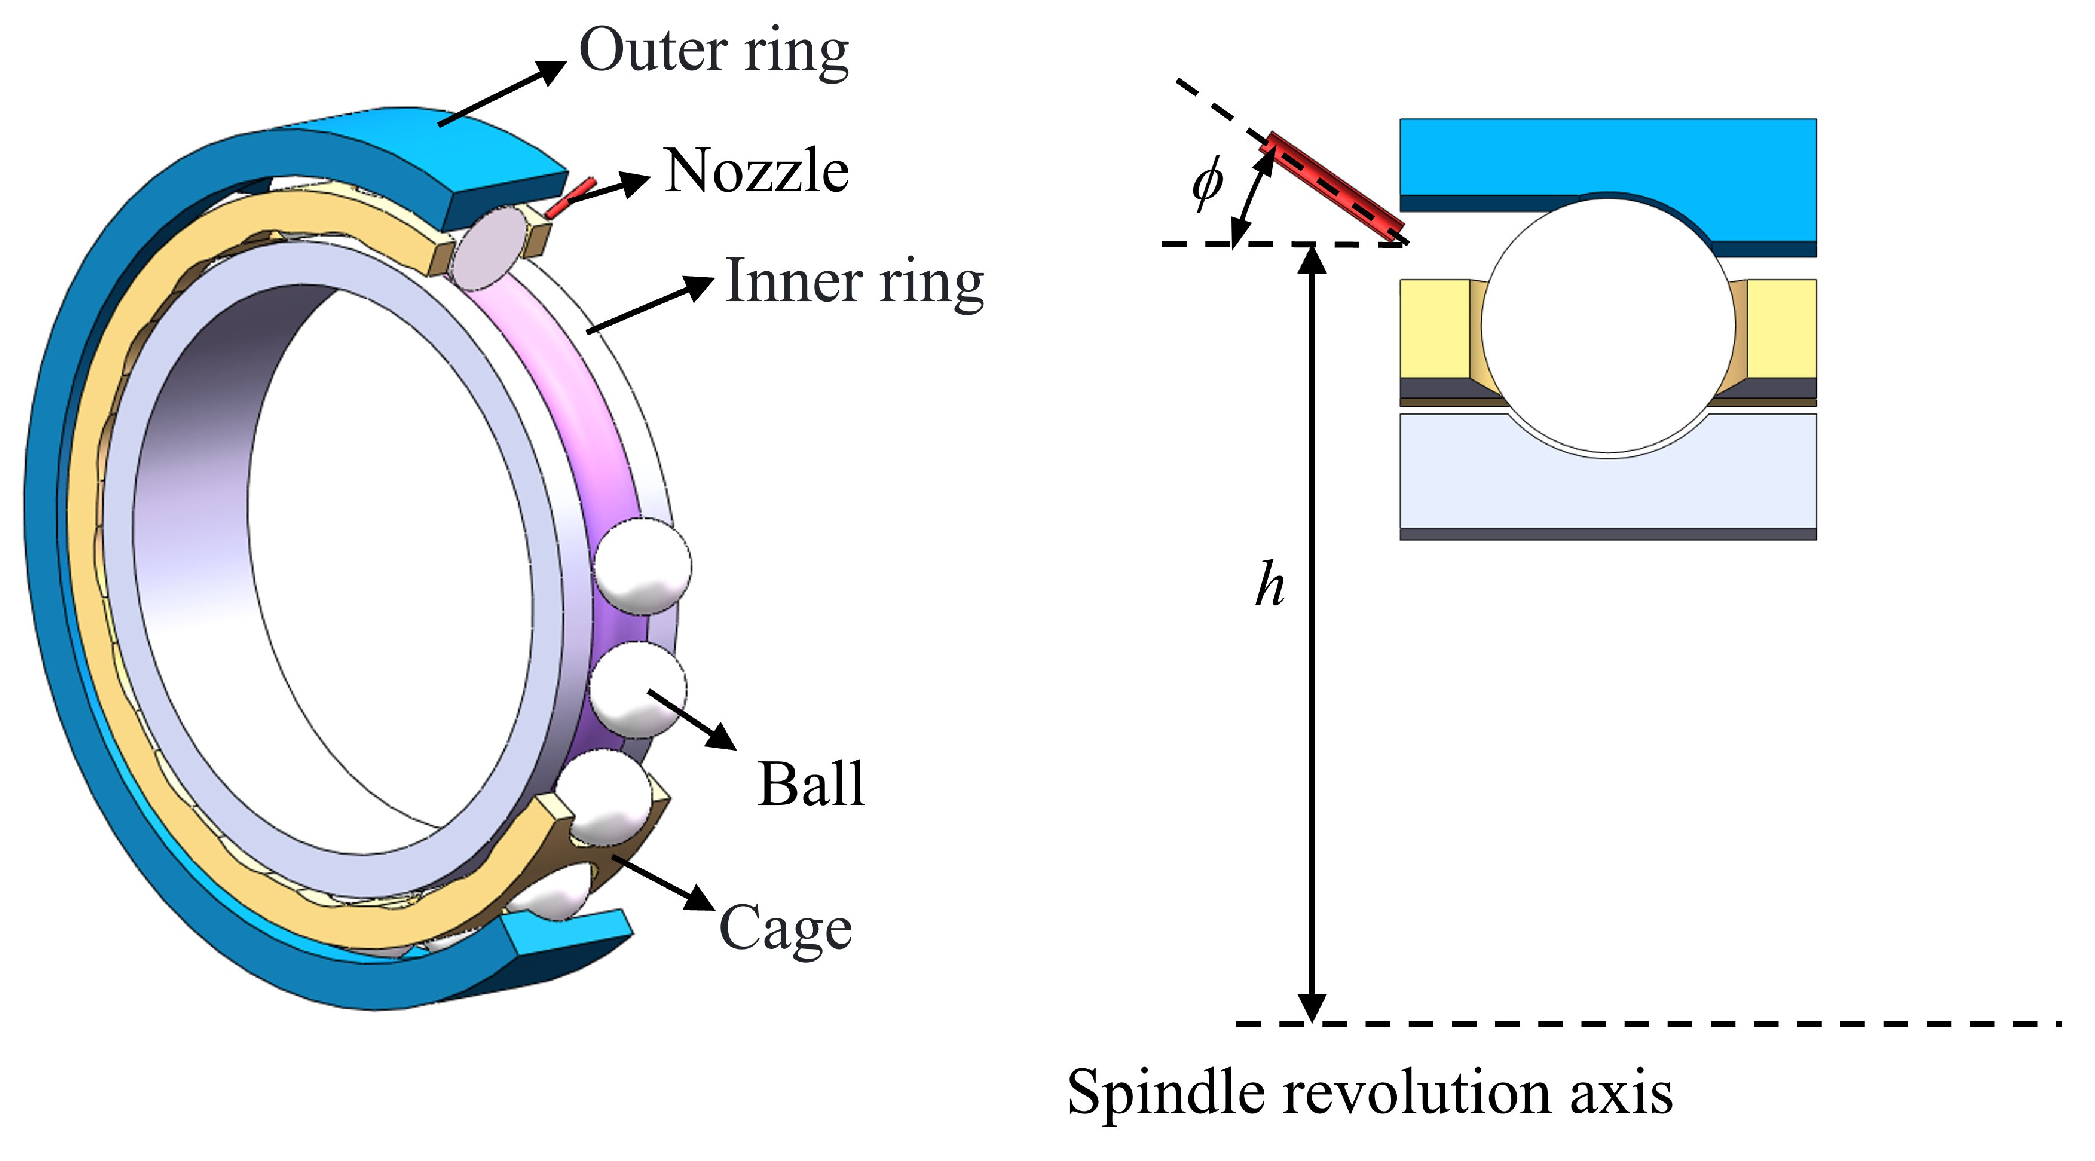
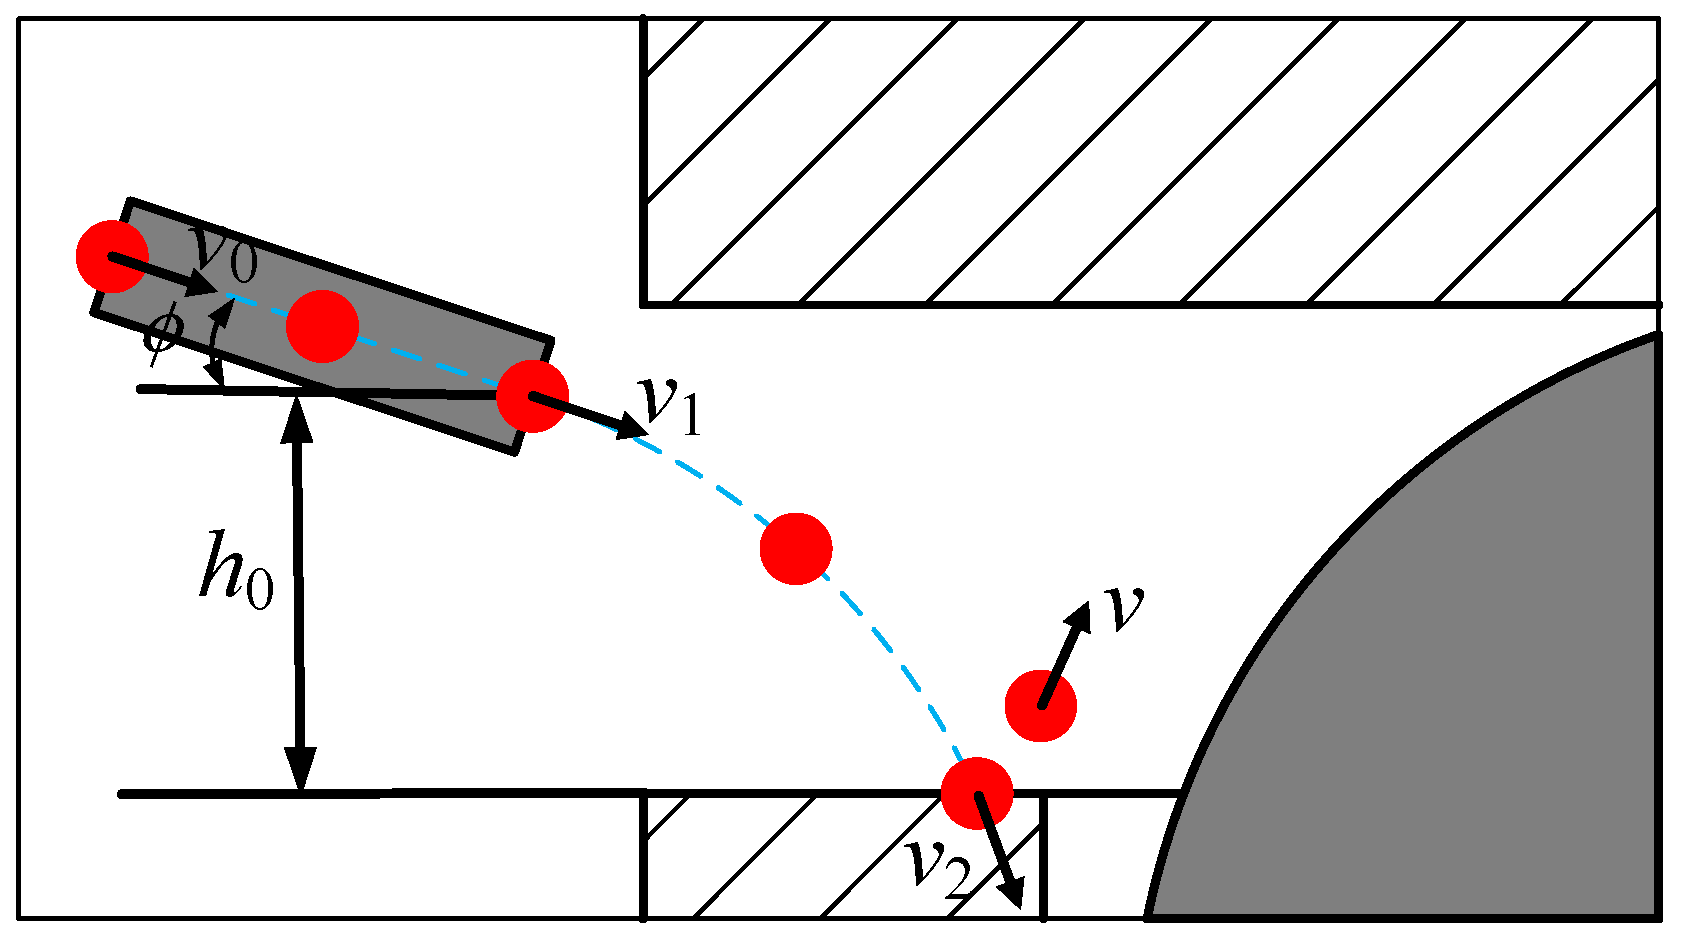
2.1. Oil-Jet Lubricated Ball Bearing and Its Motion Relationship

The orientation of the nozzle plays a crucial role in lubrication design as it facilitates the injection of lubricating oil into the bearing, as illustrated in Figure 1. The oil injection lubrication area is the gap between the cage and the outer ring of the bearing. Specifically, the nozzle angle ϕ refers to the horizontal angle, while the nozzle height h represents the vertical distance from the center of the nozzle to that of the bearing. When the bearing rotates, the outer ring remains stationary while the inner ring rotates in conjunction with the cage propelled by the balls.

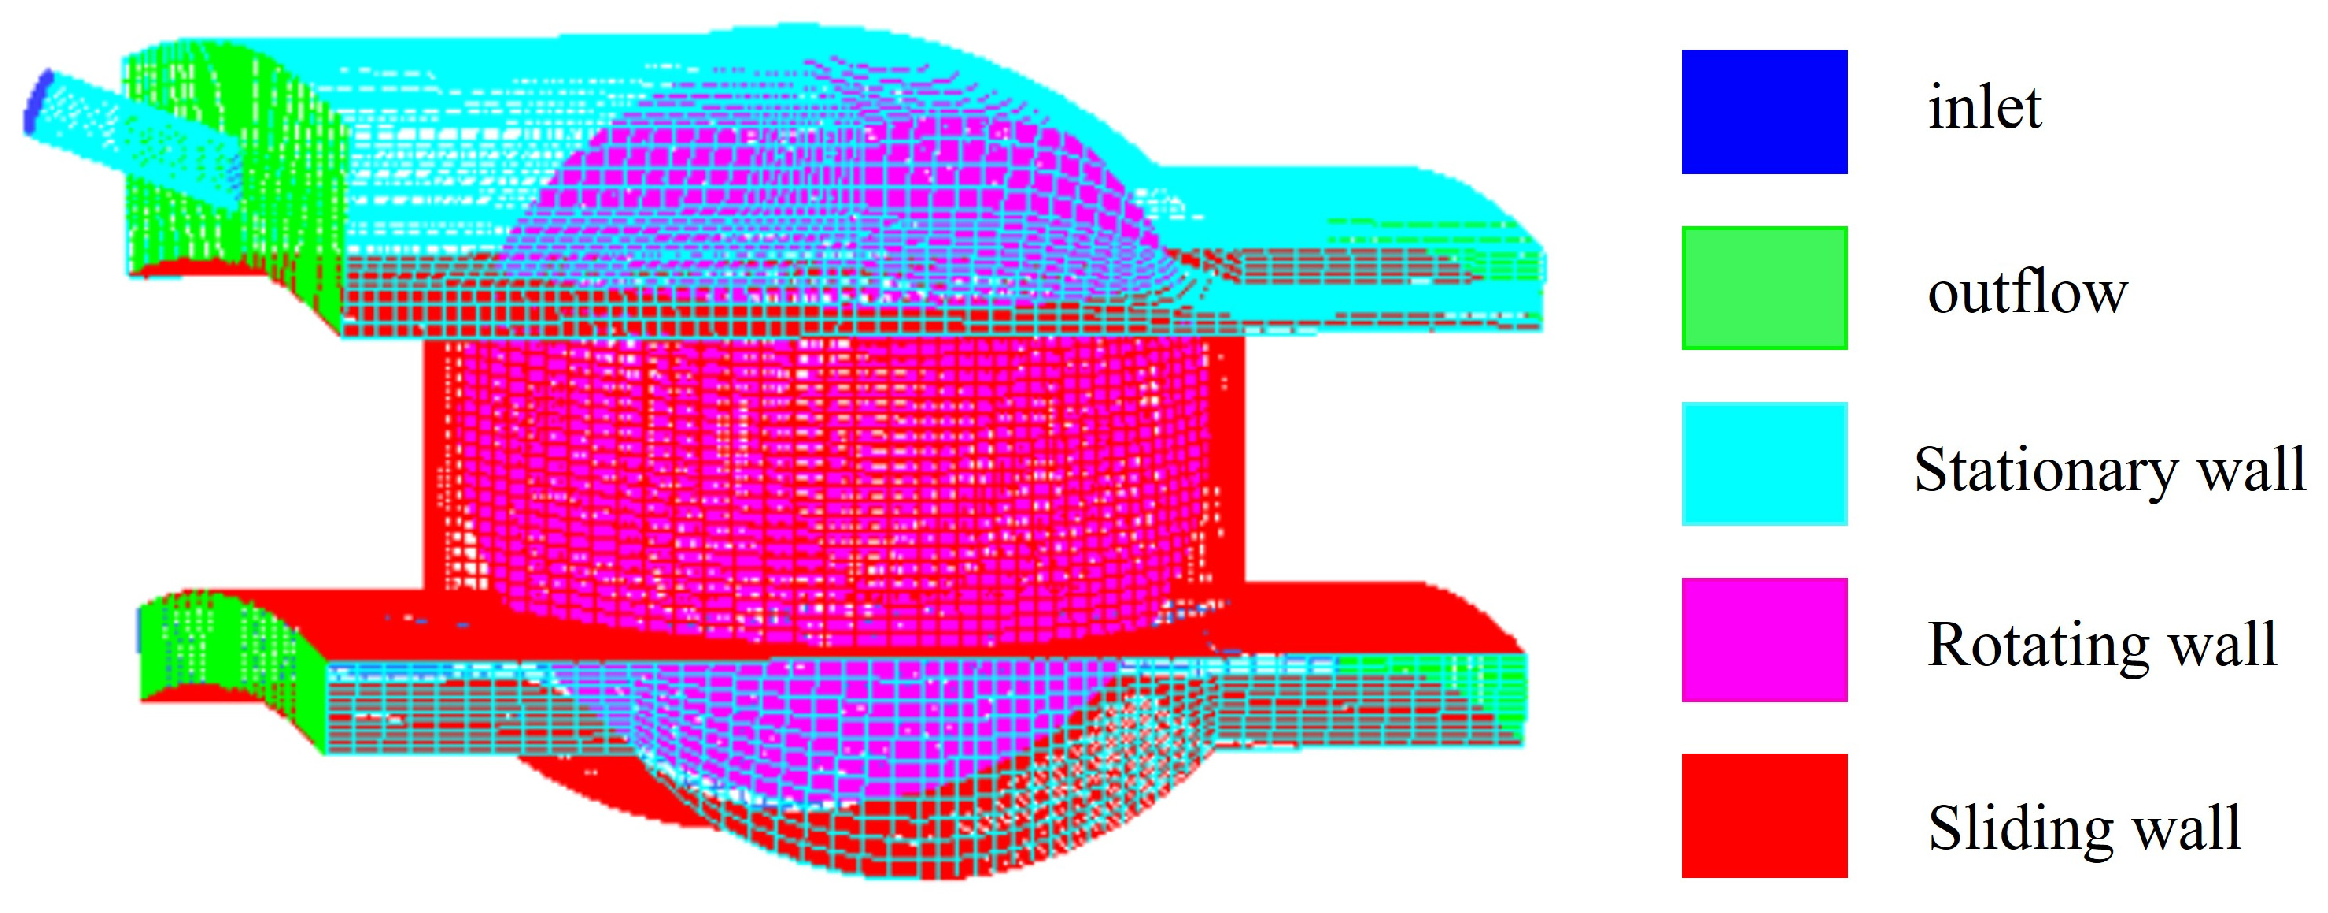
2.2. CFD Model of the Bearing Cavity Considering the Characteristics of Nozzle Position

A two-phase flow model of the bearing cavity with a nozzle is proposed based on the principles of mass conservation and momentum conservation, incorporating a turbulent model to depict the flow field as depicted in Figure 2.
The fluid field within the cavity, along with the nozzle, was discretized into a finite number of non-overlapping units. The differential functions were reformulated as linear expressions comprising of the node values of each variable or its derivatives and the chosen interpolation functions, which were then solved using the weighted residual method. The flow chart depicting the research process is illustrated in Figure 3.

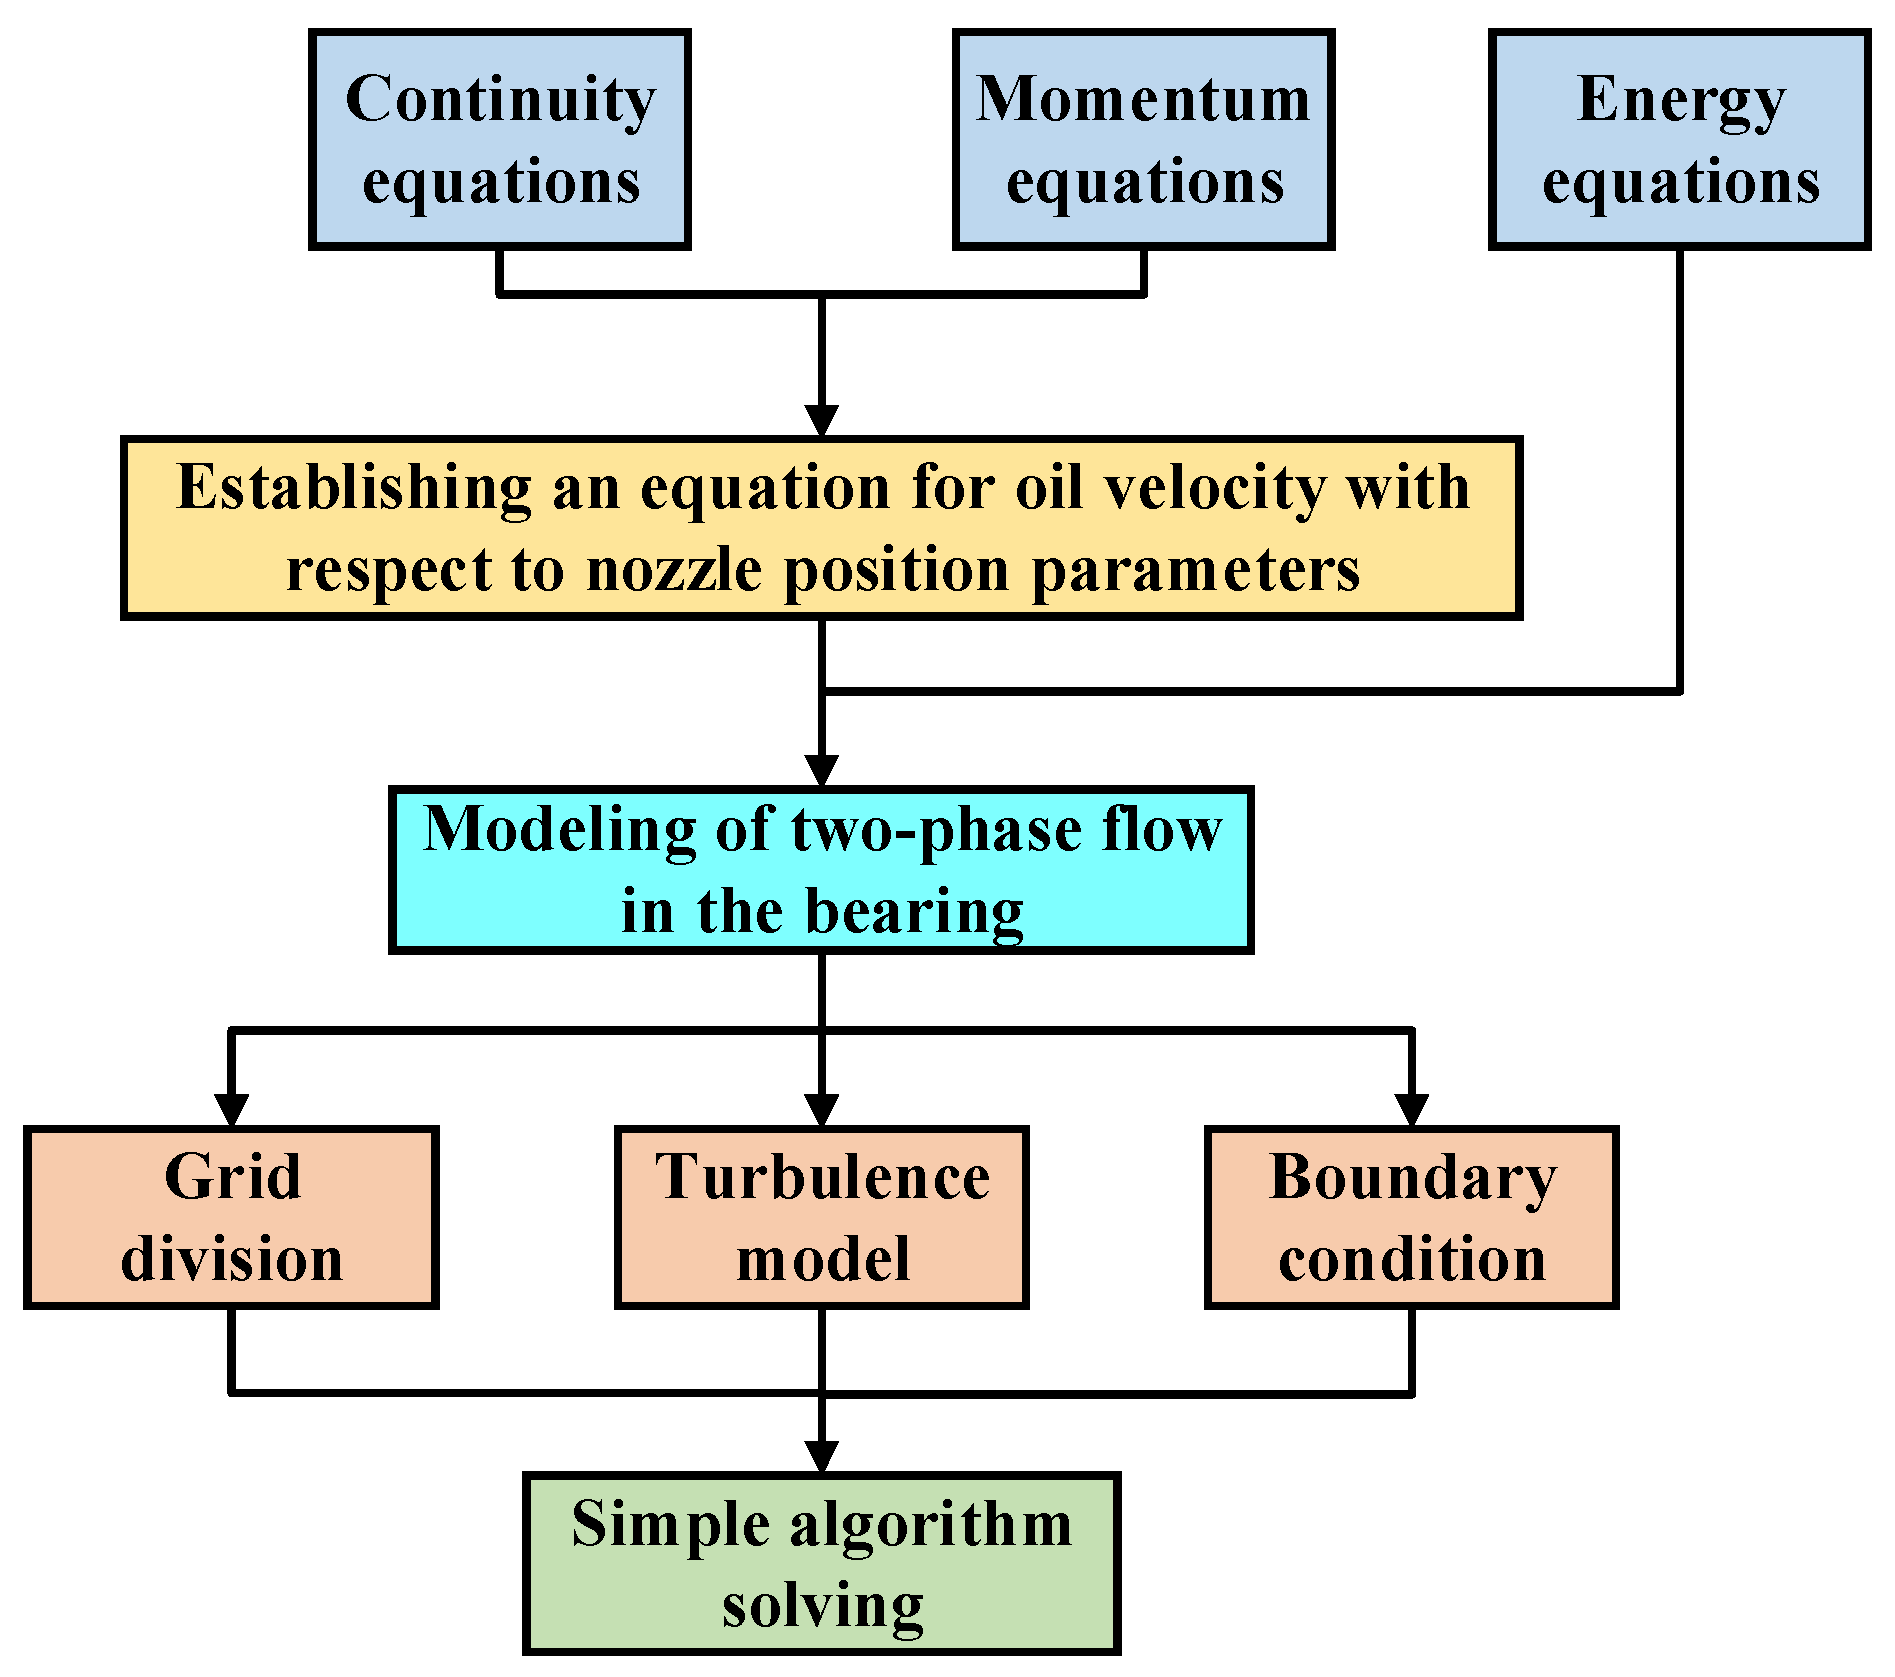
2.2.1. The Two-Phase Flow Model

The lubrication flow field model for an angular contact ball bearing considering the characteristics of the nozzle position was constructed with the CFD ideal fluid model, which refers to the completely incompressible, non-viscous fluid with no sliding at the interface. The VOF-implicit model in the multi-phase flow model was employed to track the oil-air interface in the bearing cavity with a nozzle [29]. In this context, a cell without oil is denoted as φ o i l = 0 , while a cell filled with oil is represented by φ o i l = 1 . If 0 < φ o i l < 1 , is present, it signifies the interface between the oil phase and air phase.
The continuity function for the oil phase volume fraction is given by:
t φ oil ρ oil + · φ oil ρ oil v = S α oil
where v is the velocity vector and S α oil is the mass source term.
The determination of oil droplet motion as they enter the bearing cavity through the nozzle is essential. Figure 4 illustrates the trajectory of oil droplet motion.
While oil droplets spray through the nozzle, Bernoulli’s function for two interfaces can be obtained as follows:
p 1 ρ 1 + v 0 2 2 = p 2 ρ 2 + v 1 2 2
where p 1 is the static pressure inside the nozzle, p 2 is the static pressure outside the nozzle, v 1 is the average velocity of the fluid inside the nozzle, v 2 is the average velocity of the fluid outside the nozzle, ρ 1 is the fluid density inside the nozzle, and ρ 2 is the fluid density outside the nozzle.
Assuming oil jet continuity, the continuity function at the interface of the nozzle can be expressed by
ρ 1 v 0 A 1 = ρ 2 v 1 A 2
where A 1 is the cross-sectional area of the nozzle inlet and A 2 is the cross-sectional area of the nozzle outlet.
The nozzle angle is ϕ , and its cross-section are circular; meanwhile, the fluid density ρ = ρ 1 = ρ 2 , p 1 > > p 2 , the incident velocity can be obtained using the following:
v 1 = 2 p ρ 1 1 cos ϕ 4
If the height of oil droplets entering the bearing cavity is h 0 and the velocity is v 2 , the energy conservation function can be given by:
1 2 m v 1 2 + m g h 0 = 1 2 m v 2 2
The velocity relates to the nozzle angle, and nozzle height can be expressed by:
v 2 = 2 p ρ 1 1 cos ϕ 4 + 2 g h 0
The motion of oil droplets after impacting the bearing inner wall must comply with the momentum conservation function as follows:
ρ u t + u u x + v u y + w u z = ρ F x + p x x x + p x y y + p x z z ρ v t + u v x + v v y + w v z = ρ F y + p y x x + p y y y + p y z z ρ w t + u w x + v w y + w w z = ρ F z + p z x x + p z y y + p z z z
The continuity function is given by:
v i ρ t + v i div ρ v = v i ρ t + div ρ v = 0
so it can be obtained using the following:
ρ v i t + div ρ v i v = ρ v i t + v · grad v i
In the selection of turbulence models, the RNG k ε model, which is particularly suitable for the VOF, can better capture the variations in different turbulence scales and more accurately predict various turbulence characteristics compared to the standard k ε model. The turbulent energy transport Equation (10) and the energy dissipation transport Equation (11) of the RNG k ε model are as follows:
( ρ k ) t + x j ρ u j k x j μ + μ t σ k k x j = τ t i j S i j ρ ε + ϕ k
( ρ ε ) t + x j ρ u j ε μ + μ t σ ε ε x j = c ε 1 ε k τ t i j S i j c ε 2 f 2 ρ ε 2 k + ϕ ε
where the terms on the right side represent the generation term, dissipation term, and wall term, respectively.
The wall function is used to express the wall term, which is a semi-empirical formula to connect the viscous-affected region between the wall and the fully turbulent region. Among that, the standard wall function uses a dimensionless velocity U * and a dimensionless distance y * to describe the law within the boundary layer as follows:
U * = 1 k ln E y *
among the following equations:
U * U p C μ 1 / 4 k p 1 / 2 τ w / ρ
y * ρ C μ 1 / 4 k p 1 / 2 μ
where k = 0.4187 is the Karman constant, E = 9.793 is the empirical constant, and U p is the velocity at the center of the grid adjacent to the wall, k p is the turbulent kinetic energy at the center of the grid adjacent to the wall, μ is dynamic viscosity [30].

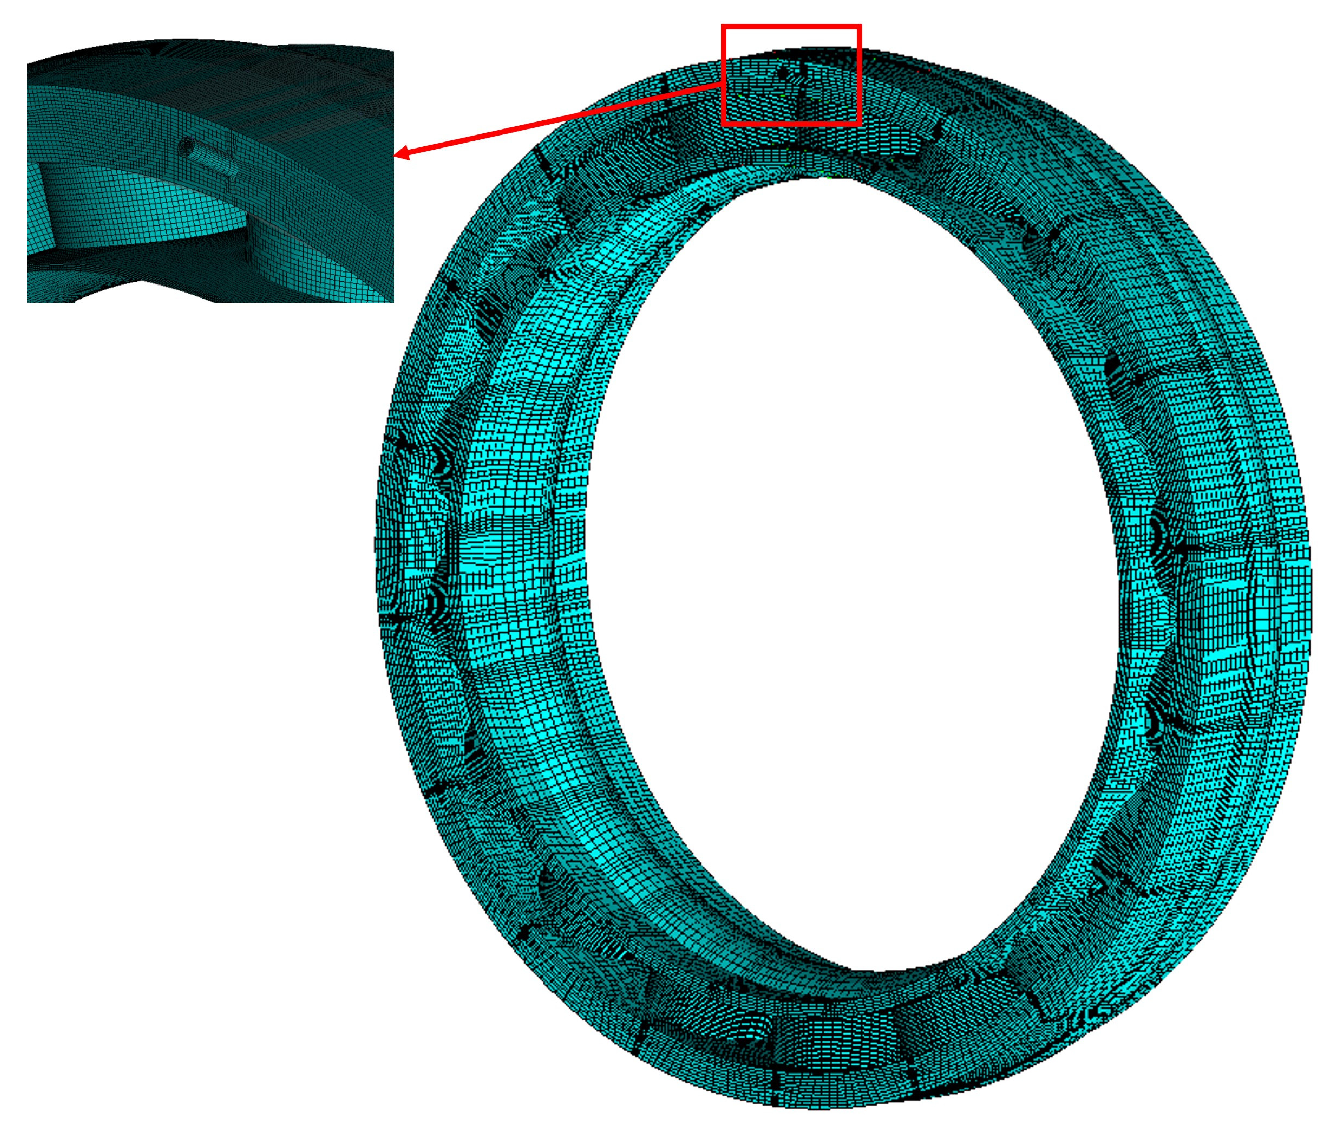
2.2.2. Solution Method

The finite volume method was employed to discretely solve the governing equations in this study. The central difference scheme was utilized for the diffusion and pressure terms of the momentum equations, while the convection term was treated using a second-order upwind difference scheme [31]. Additionally, a semi-implicit (SIMPLEC) approach was adopted for the velocity-pressure coupling solver, and a convergence criterion of 10−4 was set for the residuals of each velocity component and VOF functions.

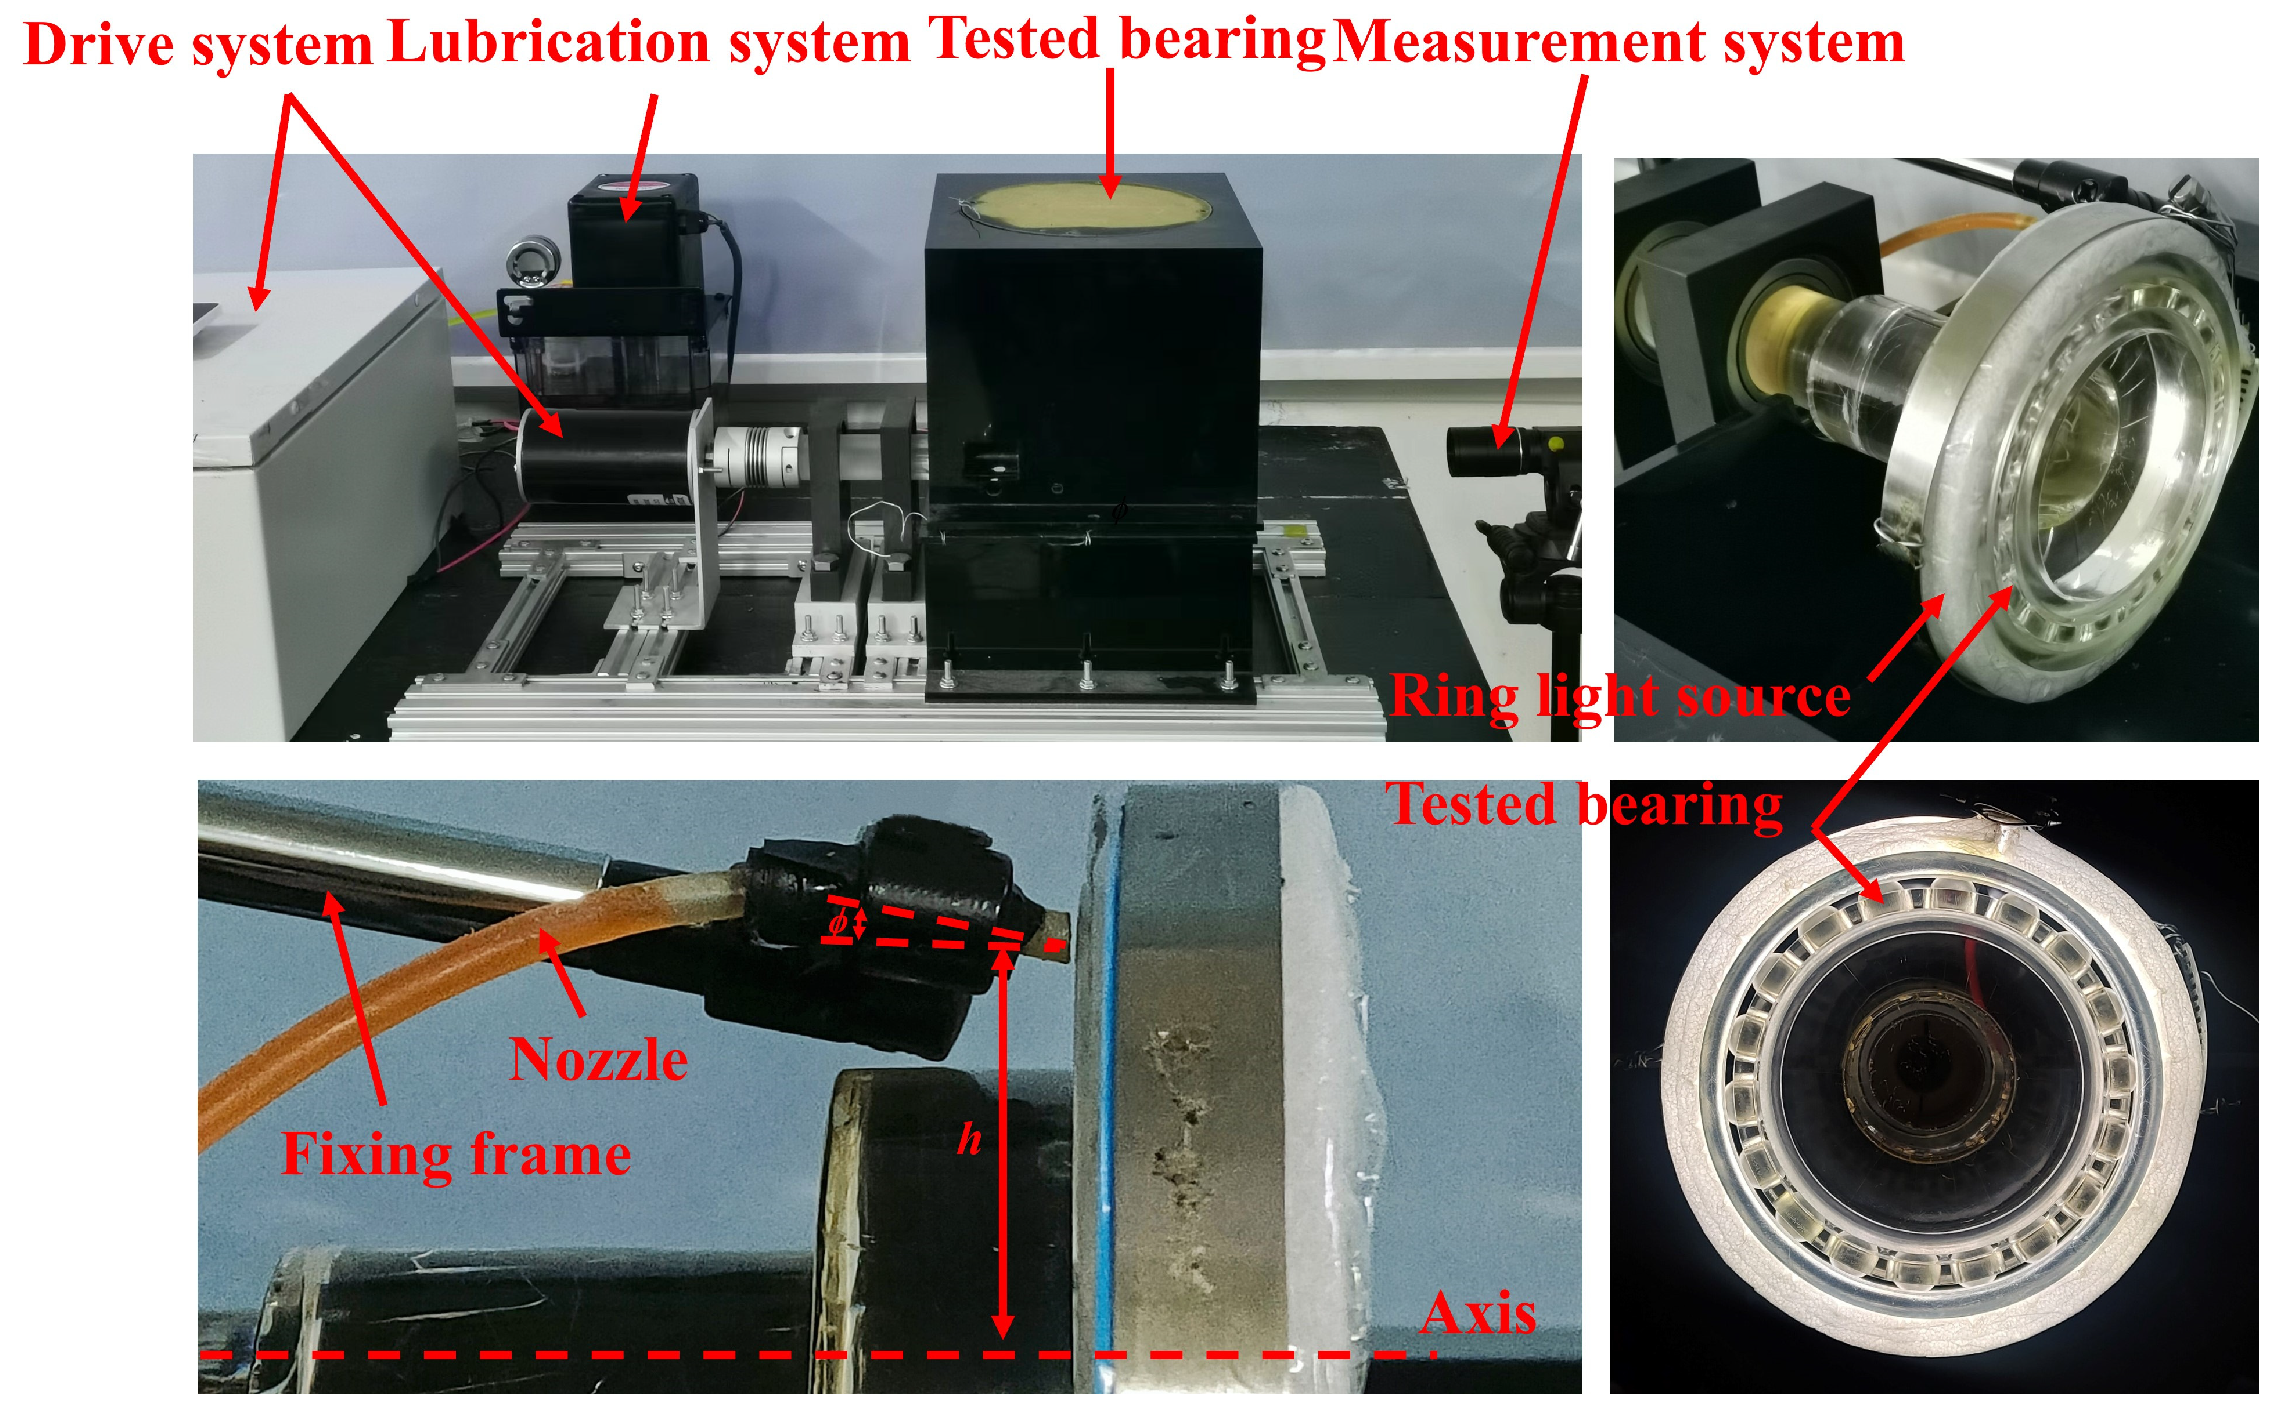
2.3. Test Rig for Investigating the Lubricant Distribution in the Angular Contact Ball Bearing Cavity

The test rig was constructed to investigate the lubricant distribution characteristics within the cavity of an angular contact ball bearing, as depicted in Figure 5. This setup comprises a drive system, an oil lubrication system, a horizontal two-support rotor system, a tested bearing, and a designated measurement system for assessing lubricant distribution. In addition, the measurement system consists of a high-speed camera, a circular light source, and a shading box. An adjustable nozzle capable of modifying its spatial position by altering both height and angle was adopted in the oil lubrication system. The inner ring and the outer ring were fabricated from a highly transparent resin material, while the balls were made of transparent acrylic, as depicted in Figure 5. The specific structural parameters of the bearing are presented in Table 1.
4010 aviation lubricating oil was used, and its physical parameters are shown in Table 2.
The tracer material for lubrication was selected as ink. So the shaded part denotes lubricant and clearly represents its distribution in the tested bearing. At a rotational speed of 120 rad/s for the inner ring, a high-speed camera with a resolution of 640 × 370, a frame rate of 1000, and an exposure time of 0.5 ms captured an amplified image of shadows on the ball surface by adjusting the focal length, as depicted in Figure 6a. Subsequently, by adjusting the brightness contrast curve in Photoshop (PS), a clearer image of the lubricant was obtained, as shown in Figure 6b. Finally, pixels were extracted from the grayscale image displayed in Figure 6c using the OTSU method, as shown in red box in Figure 6c.

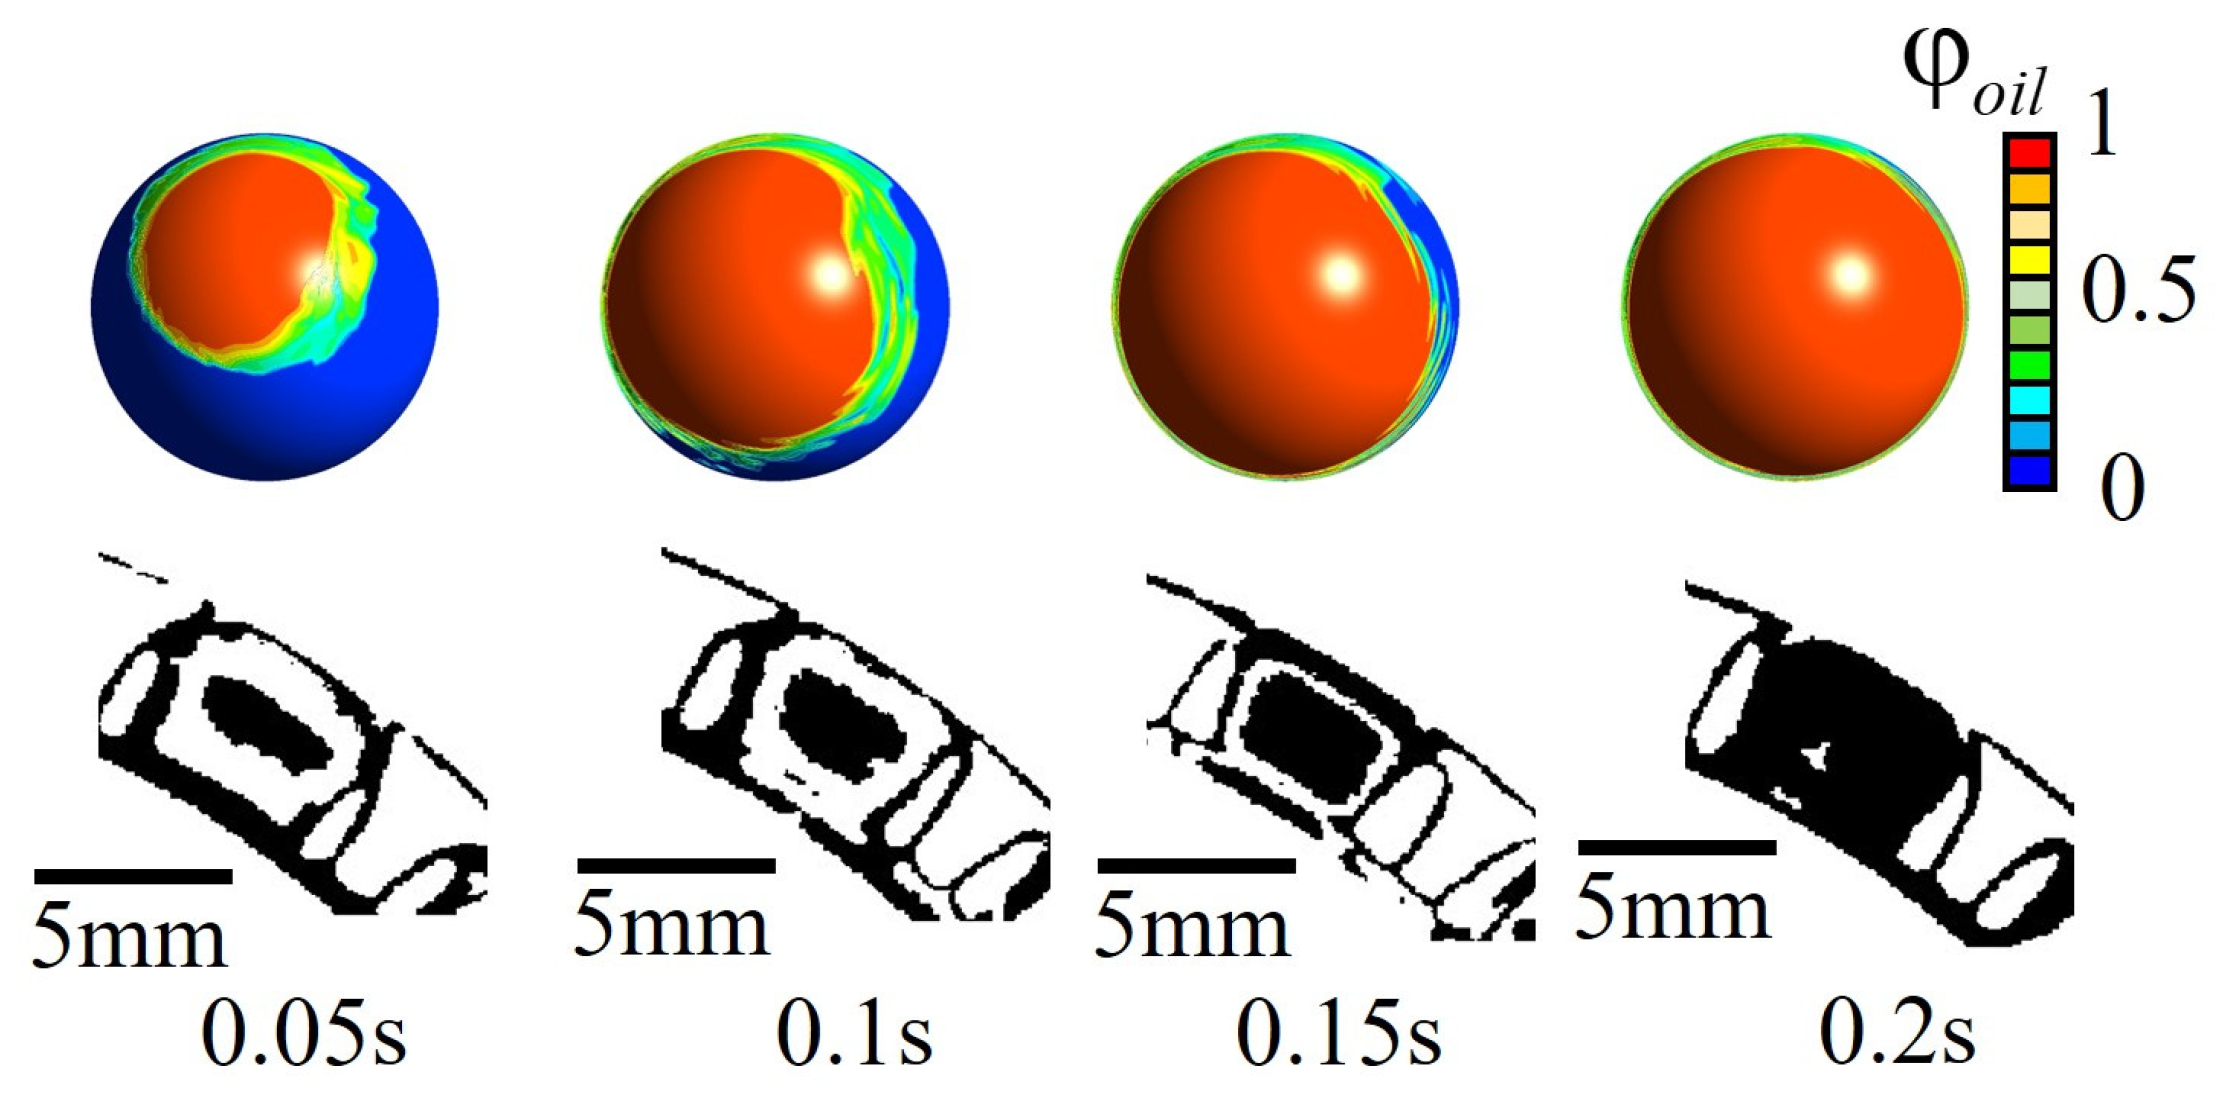
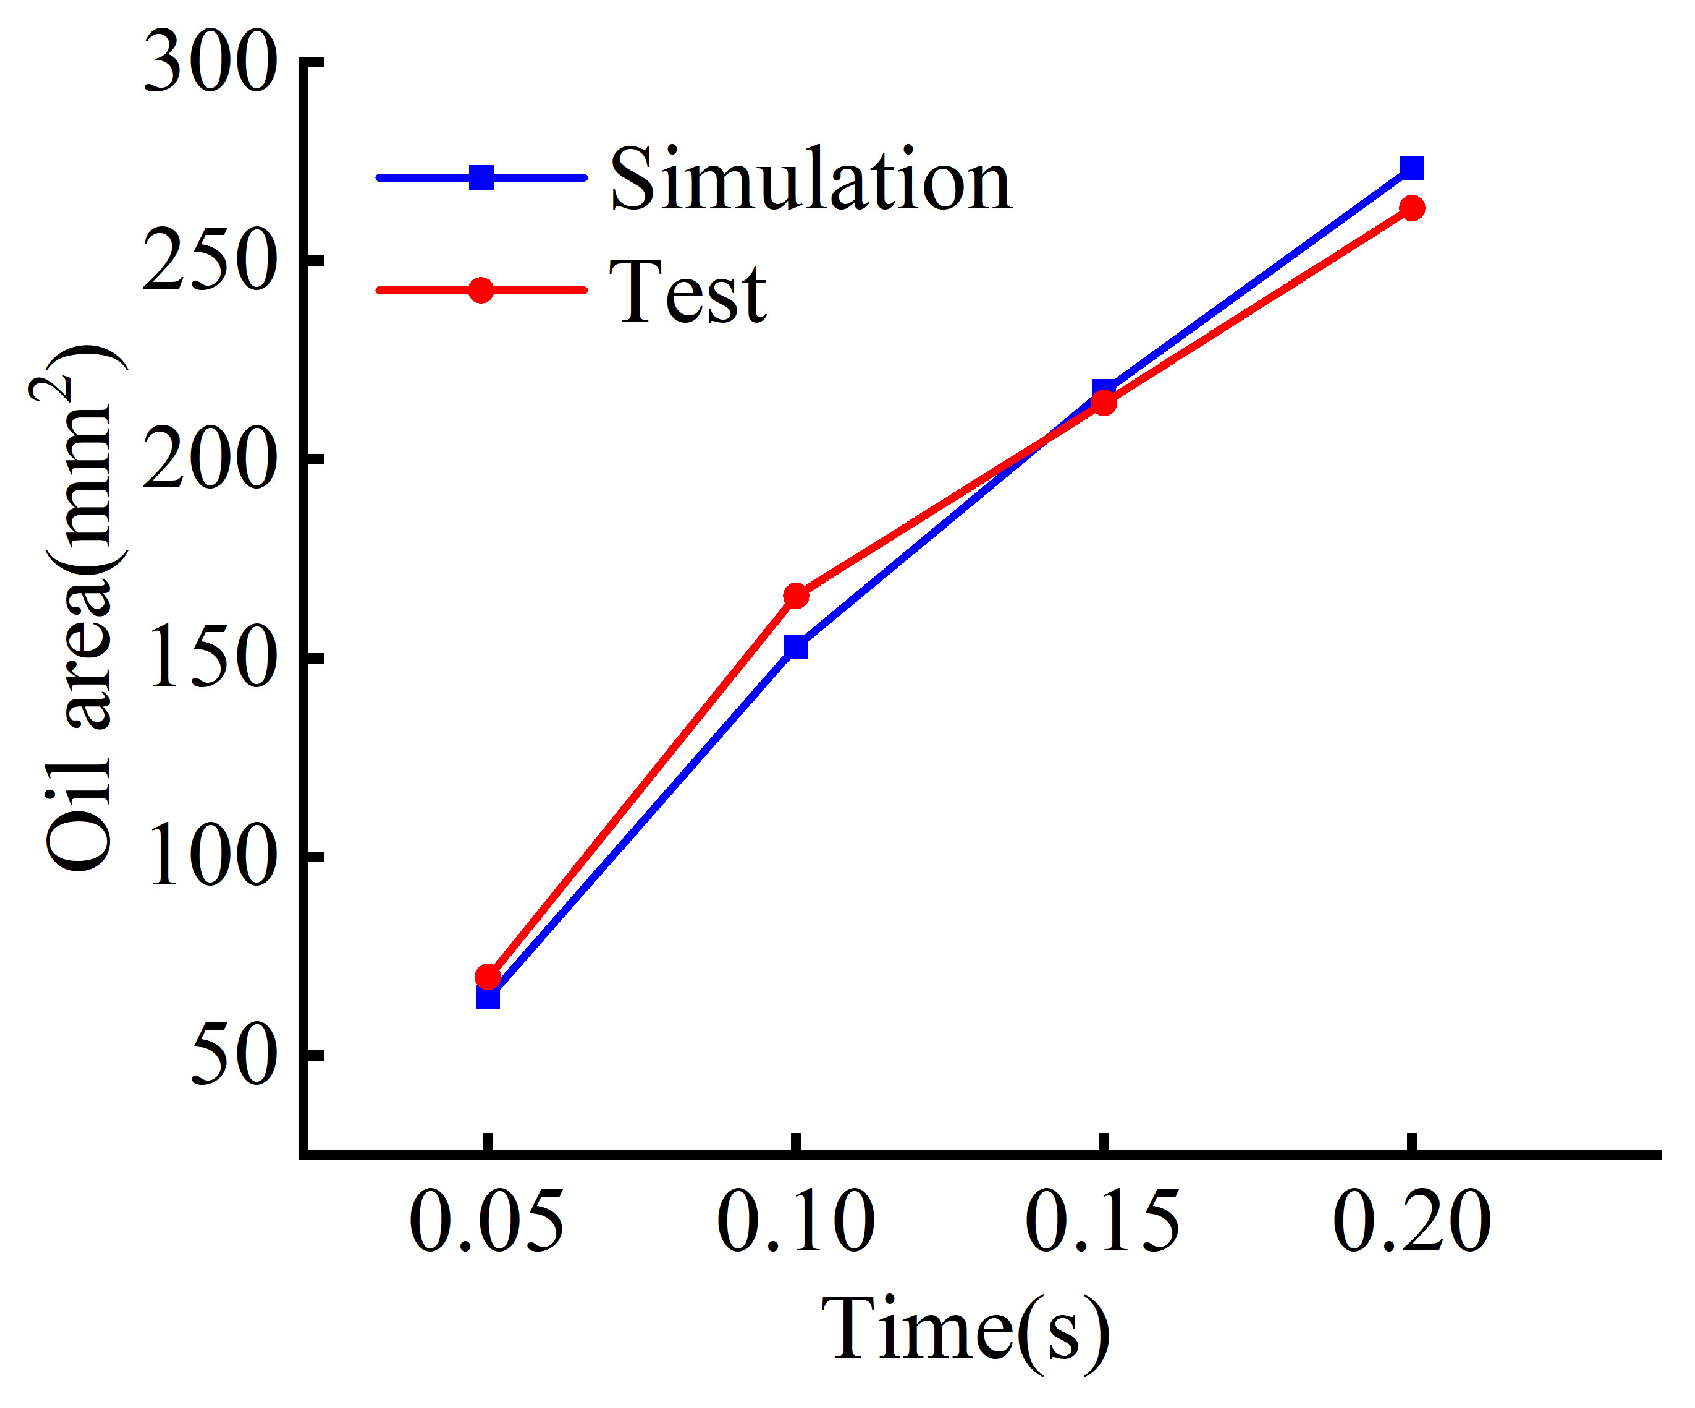
2.4. Comparative Verification

Based on the computational fluid dynamics method, a 1/18 two-phase flow model with a nozzle replacing the overall model was established on ANSYS FLUENT in Section 2.2, taking into account the periodic symmetry of the bearing structure as illustrated in Figure 7.
The fluid domain was discretized using a structured mesh, resulting in 158,989 elements and 171,612 nodes. The outer ring of the bearing was designated as a stationary wall, while the front and rear walls were set as pressure outlets. The nozzle served as the velocity inlet with a flow rate of 1 m/s. With an inner ring rotational speed of 120 rad/s, the ball and cage exhibited a revolution speed of 50 rad/s, whereas the ball itself rotated at a speed of 400 rad/s based on previously derived formulas.
The nozzle angle of 20° and the nozzle height of 45 mm, which are consistent with the test conditions, were selected in this section to analyze the internal flow field of the bearing fluid domain. The simulated and experimental images on the ball surface corresponding to four time points at 0.05 s, 0.1 s, 0.15 s, and 0.2 s are depicted in Figure 8.
The oil distribution on the ball surface, obtained from simulation and experiment, was converted into the oil spreading area using CFD-post of Fluent and image recognition algorithms, respectively. The comparison between simulation and experimental results over time revealed the temporal evolution of the oil spreading area on the surface of the ball, as depicted in Figure 9.
The oil spreading area on the ball surface demonstrates a consistent trend between simulation and experimental results, indicating the applicability of the proposed model for the lubrication flow field with a nozzle in this study.

3. Influence of Nozzle Positions on Lubricant Distribution and Its Optimization

The ball surface and the cage guiding surface are selected as observation surfaces to comprehensively analyze the lubricant distribution characteristics in the bearing cavity, as shown in Figure 10.
The surface weighted average value is calculated by summing up the values of each region on the surface, multiplied by their corresponding weights, and divided by the total weight. If there are n regions on a surface with oil phase volume fractions, respectively denoted as φ 1 , φ 2 ,……, φ n , and their weights are w1, w2,……, wn, then the formula is
x ¯ = φ 1 w 1 + φ 2 w 2 + + φ n w n w 1 + w 2 + + w n
The value is referred to as the weighted average of the oil phase volume fraction, which provides a more precise depiction of the overall distribution of oil on the surface and then is used to characterize the state of oil distribution.

3.1. Influence of Nozzle Positions on Lubricant Distribution

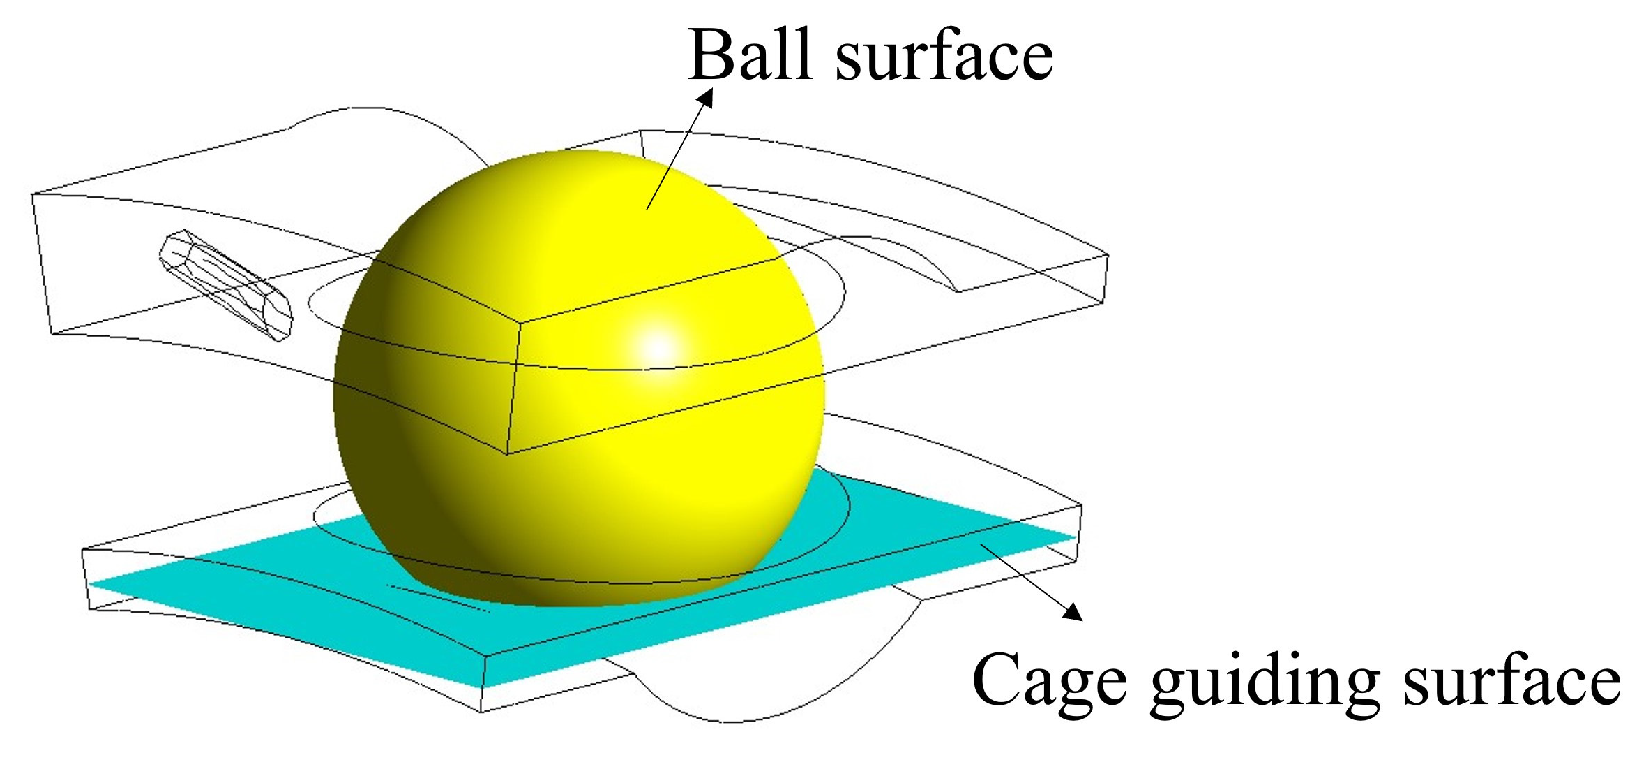
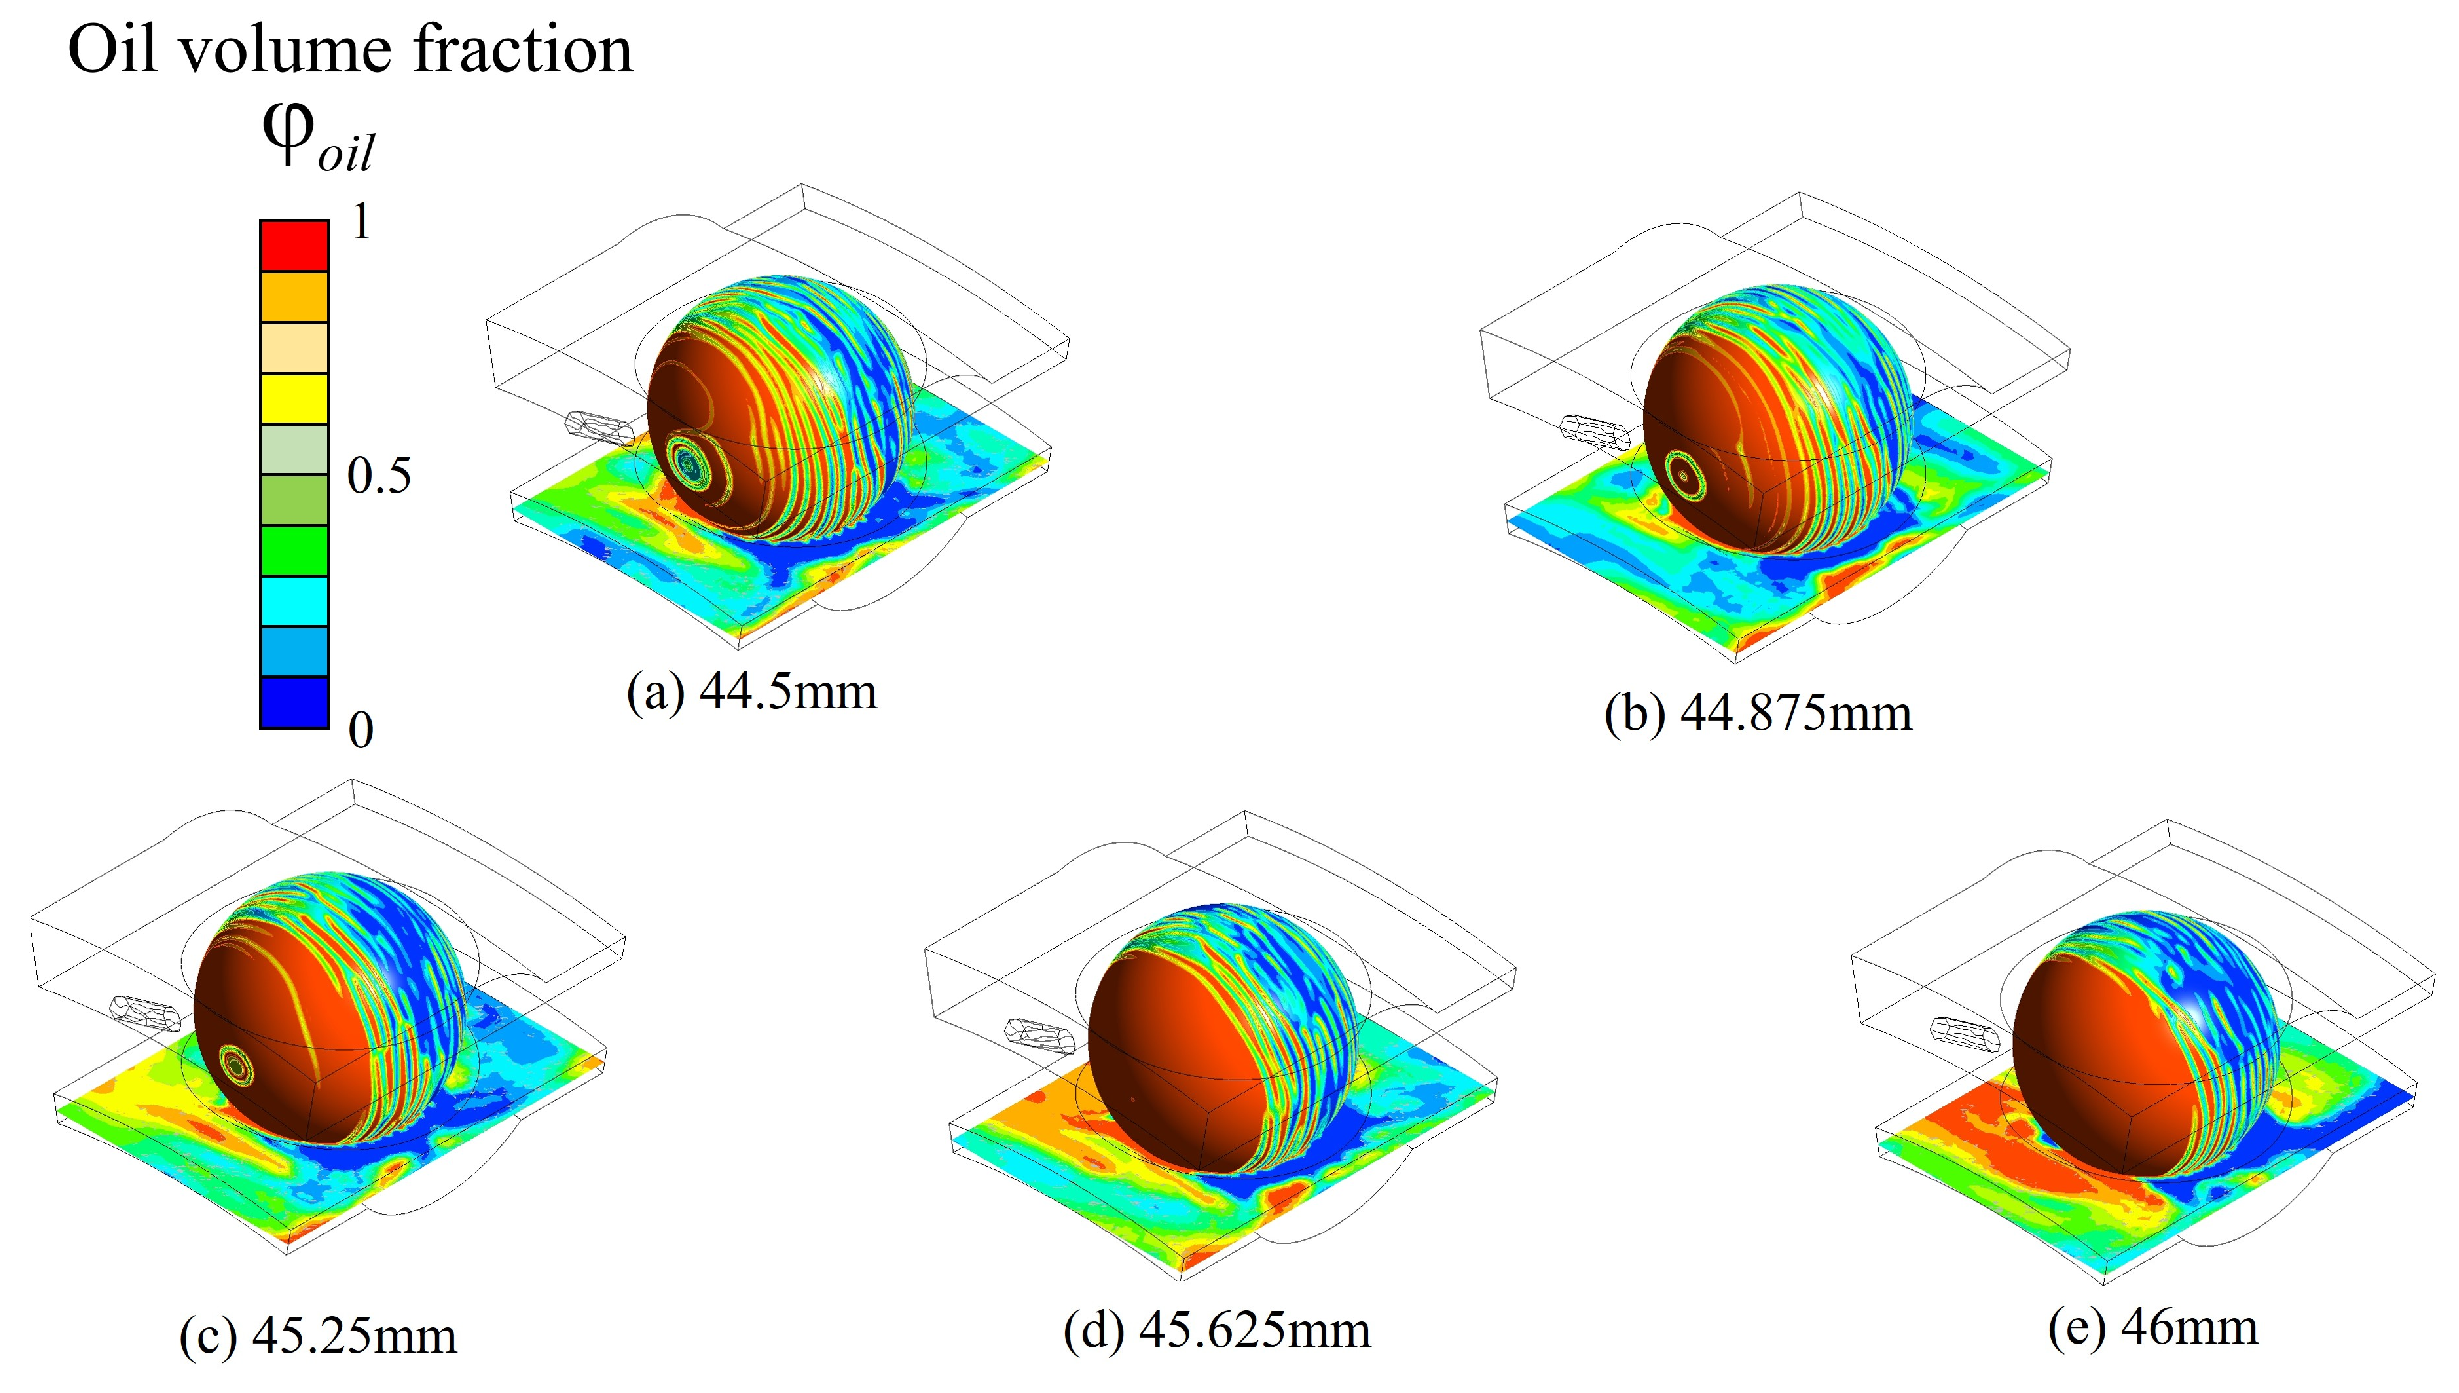
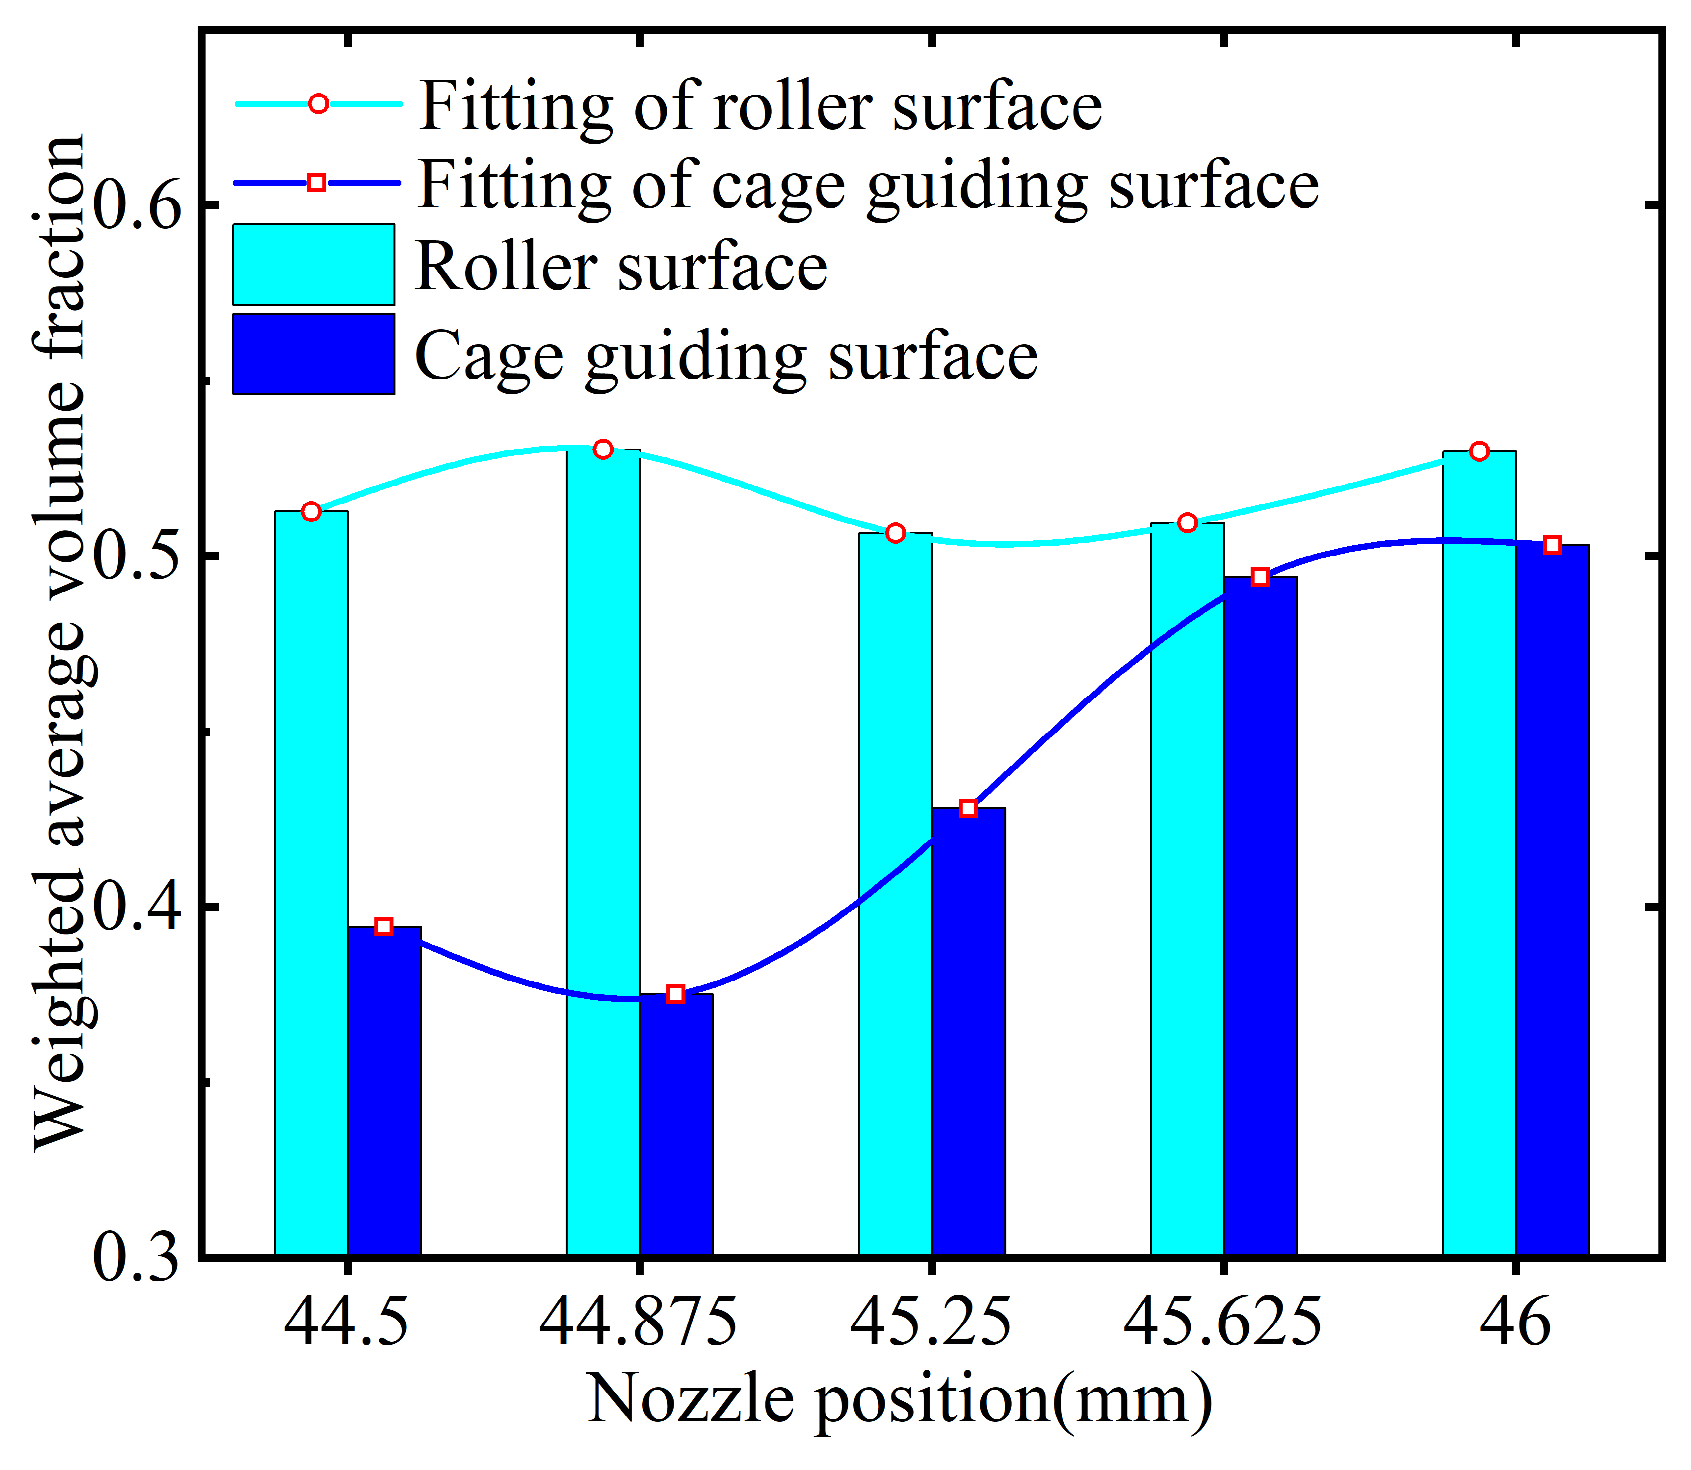
3.1.1. Influence of Nozzle Height on Lubricant Distribution

The nozzle angle ϕ was set at 35° constantly, and the five oil injection heights were equidistantly set from 44.5 mm to 46 mm. The contours of oil distribution about two observation surfaces after stabilization are shown in Figure 11.
The variation trend of the weighted average of the oil phase volume fraction on a ball surface and a cage guiding surface along with the nozzle heights are shown in Figure 12.
The variation trend of the weighted average of the oil phase volume fraction on the ball surface is not statistically significant, as depicted in Figure 12. However, on the cage guiding surface, this trend increases with an increase in nozzle height. As the nozzle height increases, the elevation of oil impacting the ball also rises, resulting in an increased angle at which the oil collides with the ball. Consequently, there is an expansion in the surface area covered by oil on the ball. Simultaneously, as the nozzle height increases, the region where oil impacts transitions from intersecting horizontally with both the ball and cage to a higher position on the ball. This facilitates easier entry of oil into the gap between the ball and cage, ultimately leading to centrifugal force propelling it onto the cage guiding surface.

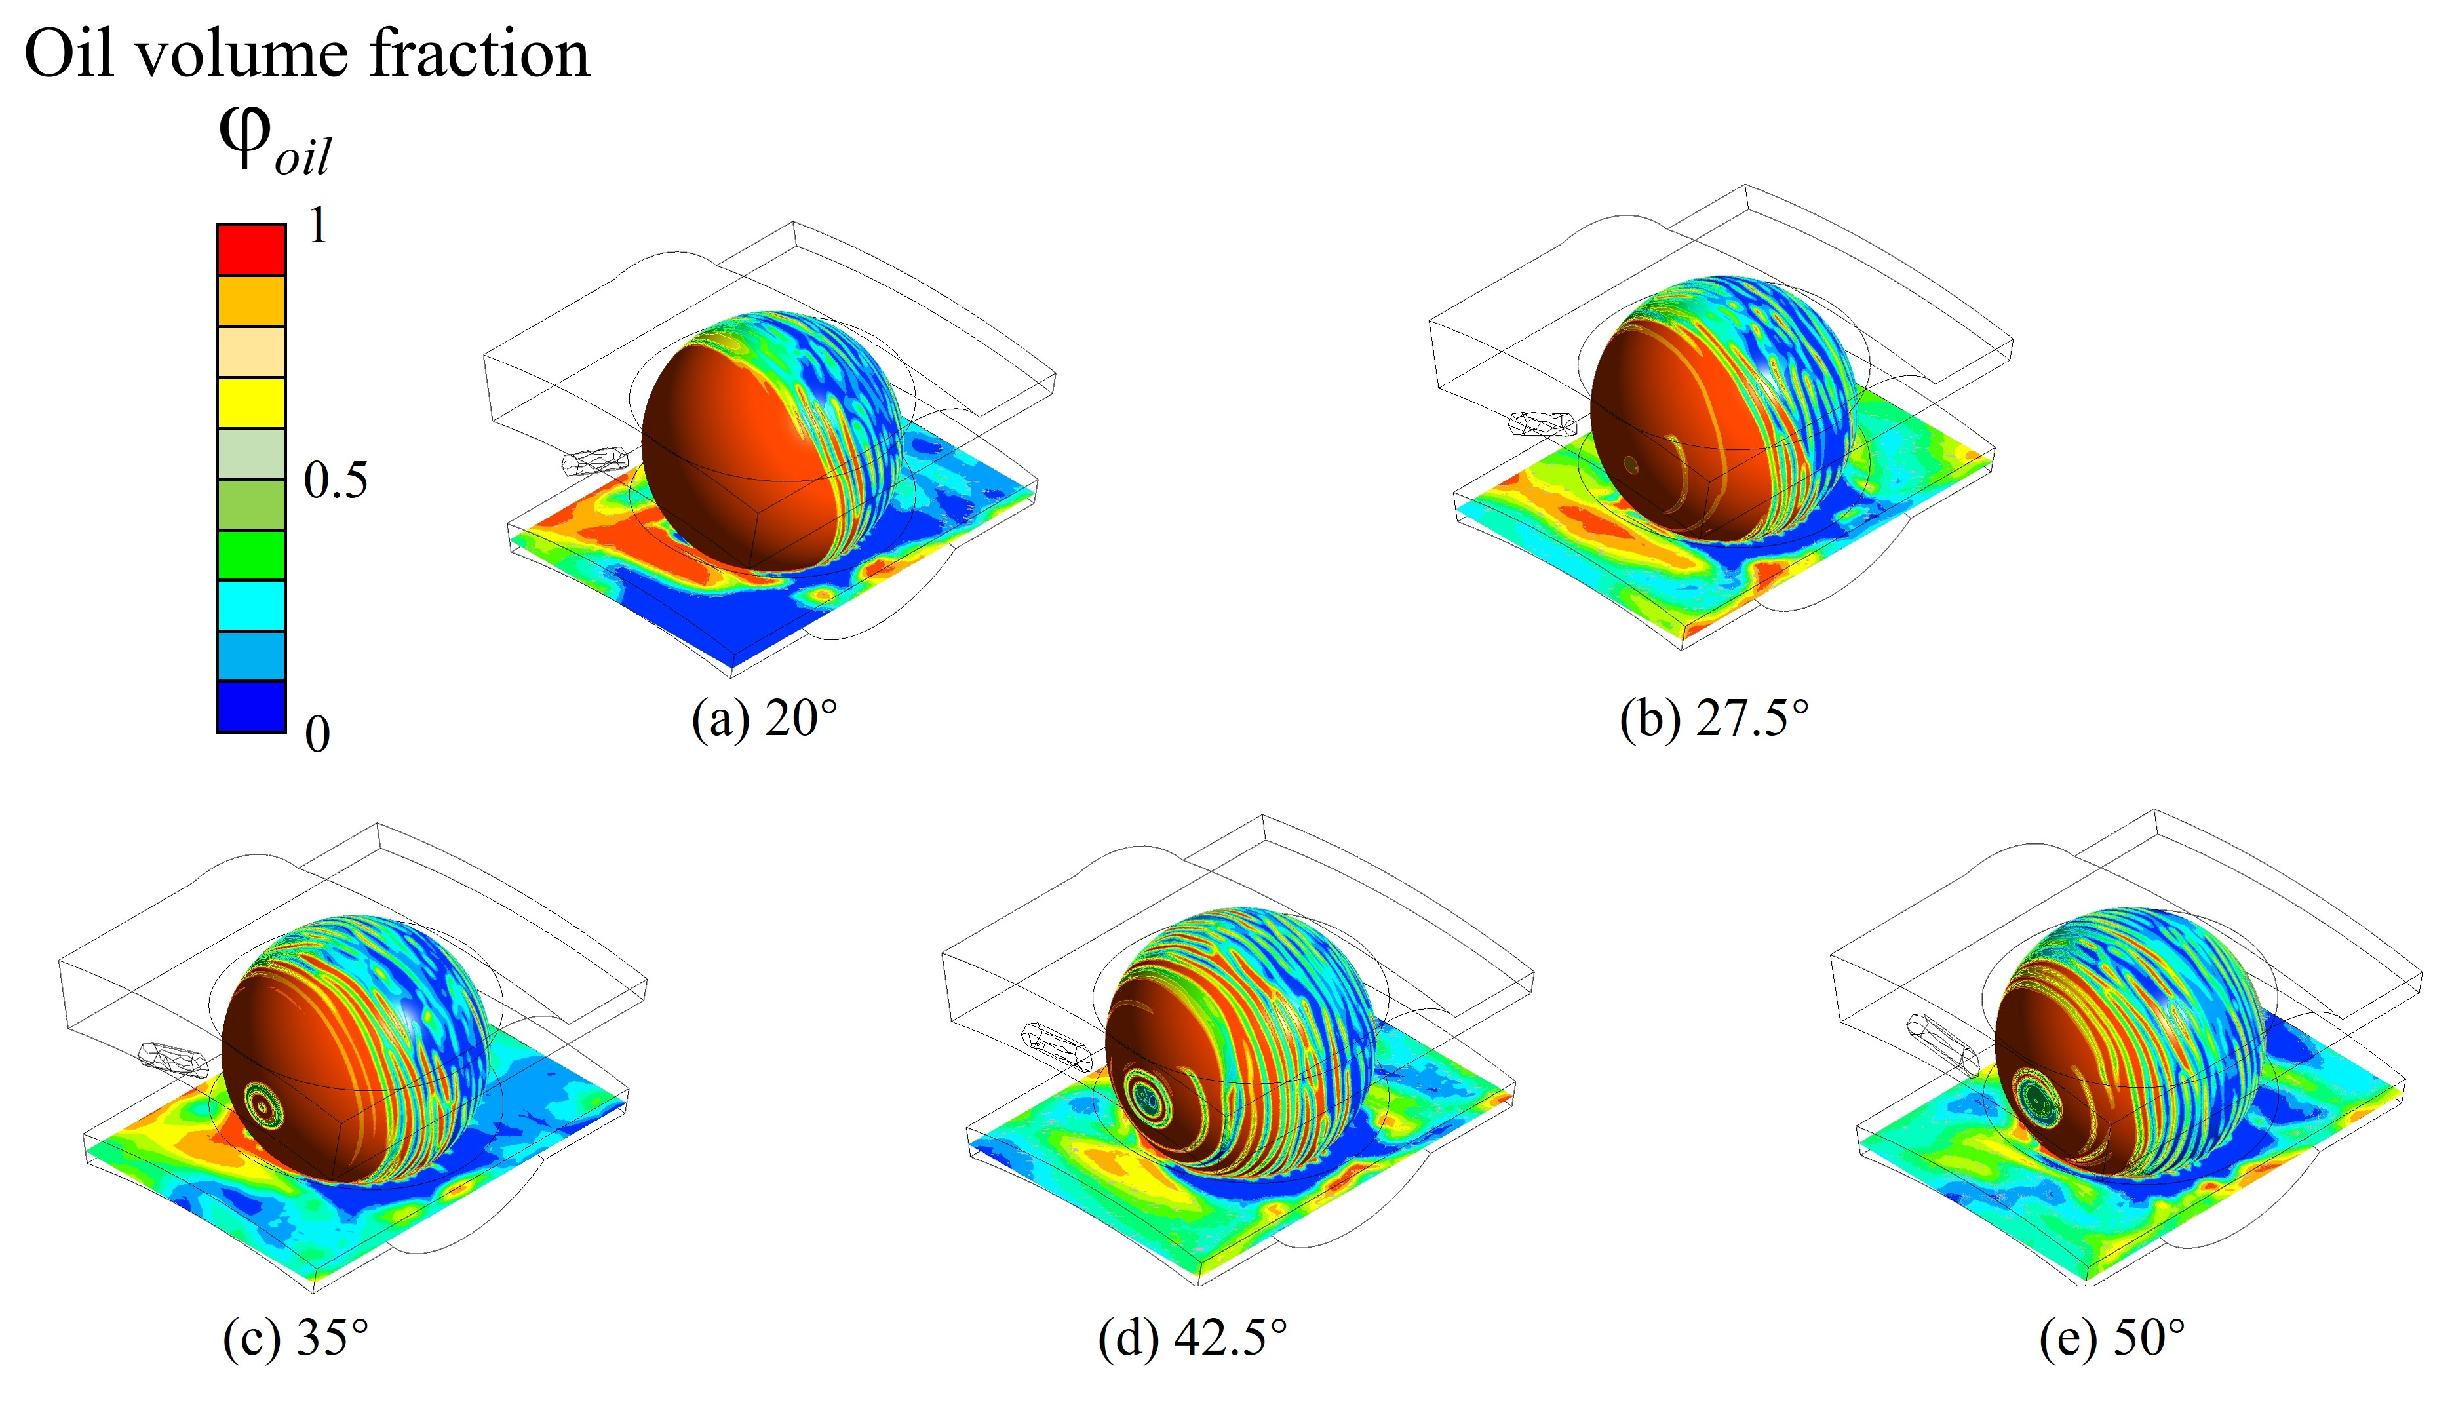
3.1.2. Influence of Nozzle Angle on Lubricant Distribution

The nozzle height h was set at 35° constantly, and the five oil injection angles were equidistantly set from 20° to 50°. The contours of oil distribution about two observation surfaces after stabilization are shown in Figure 13.
The variation trend of the weighted average of the oil phase volume fraction on a ball surface and a cage guiding surface along with the nozzle heights are shown in Figure 14.
The variation trend of the weighted average, in relation to the nozzle heights, is illustrated in Figure 14. The progressive increase in nozzle angle leads to a narrower region between the cage and the ball, resulting in an increased tangential velocity of oil along the ball surface. Furthermore, due to the rotational motion of the ball, oil is expelled along both surfaces—namely, the ball surface and cage guiding surface—leading to a reduction in flow rate on these surfaces. So, both the weighted average of the oil phase volume fraction on the ball surface and the cage guiding surface decrease as the nozzle angle increases.

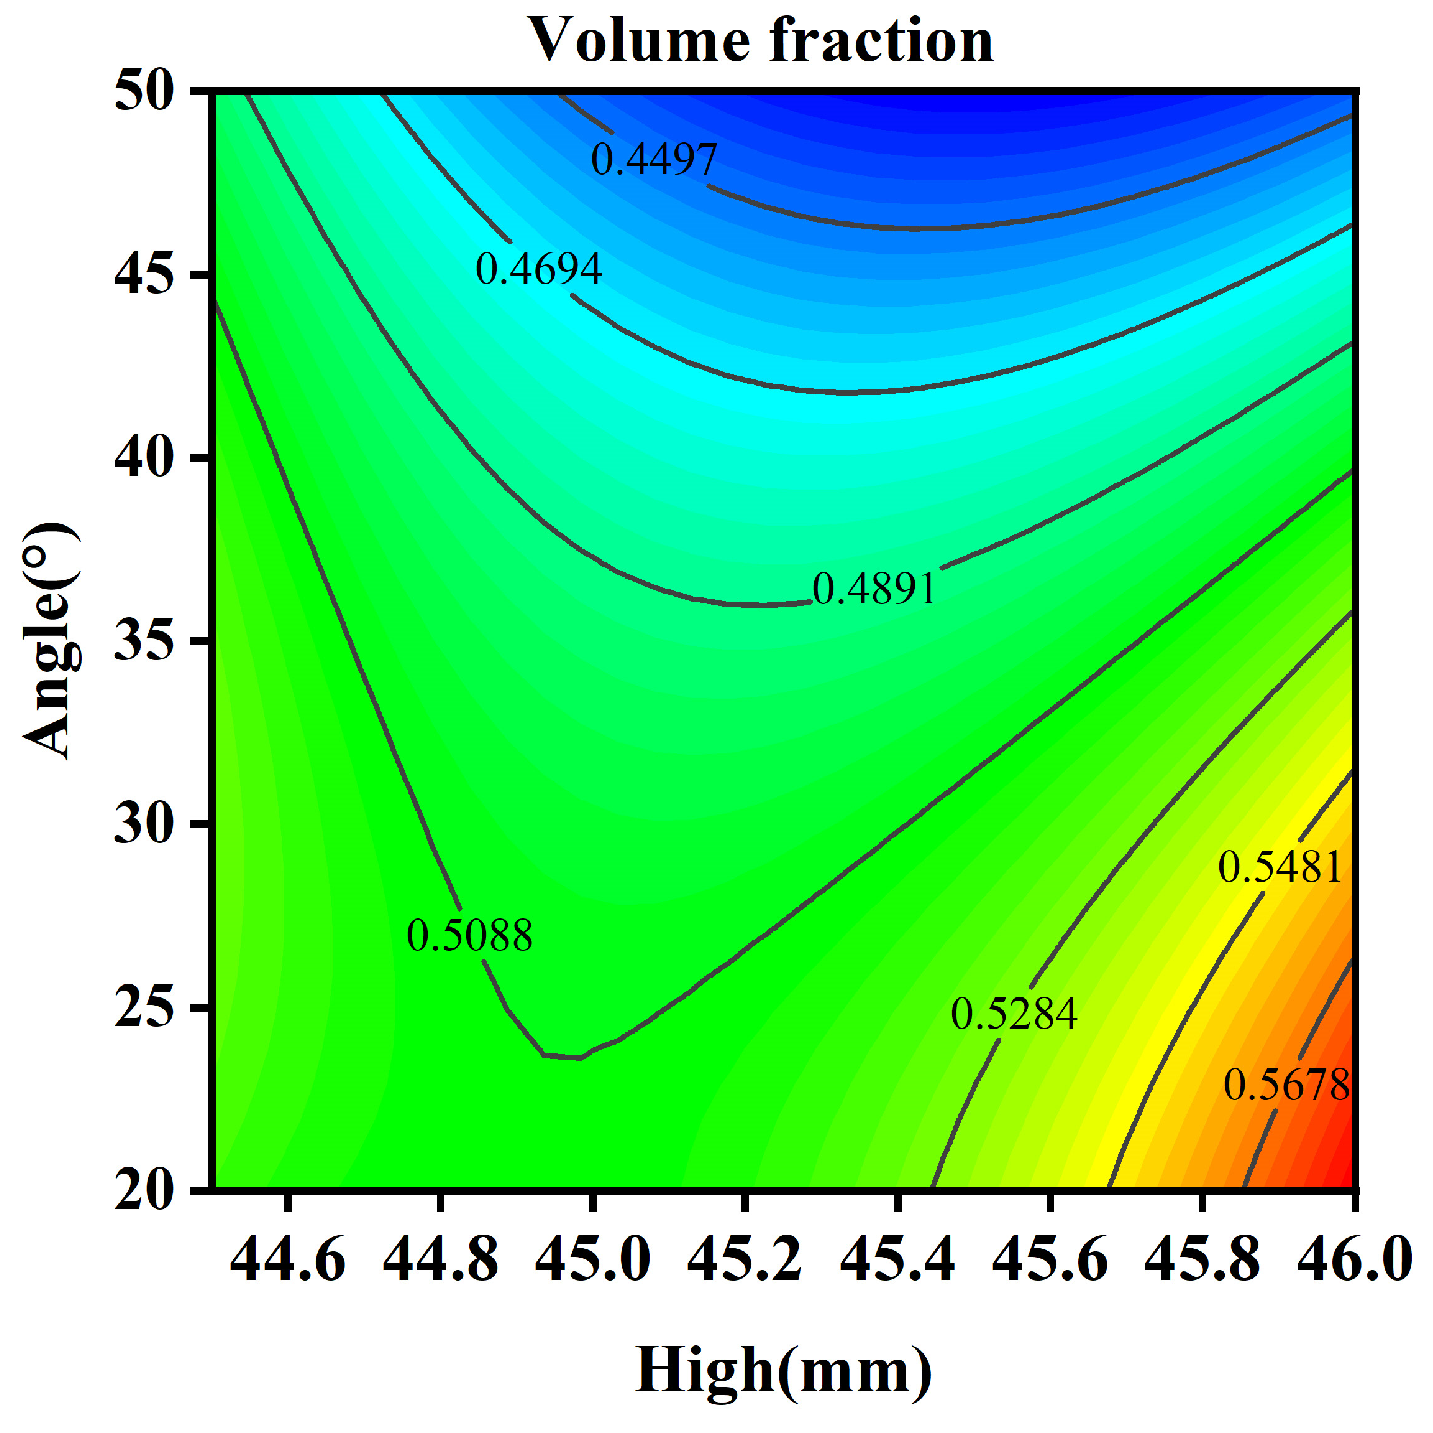
3.2. Optimization of the Nozzle Position with the Response Surface Methodology

The response surface methodology is a statistical technique that establishes a regression-fitted expression by mathematically fitting limited experimental data using a multivariate quadratic regression function [32]. The equation for the standard quadratic polynomial response surface function [33] is as follows:
y = m 0 + i = 1 n m i x i + i = 1 n j = 1 n m i j x i x j + i = 1 n m i i x i 2
where xi represents the design variable, n is the number of design variables, and m0, mi, mii, and mij are the coefficients of the quadratic polynomial regression function.
The optimization design indicators include the nozzle angle, nozzle height, and the weighted average of the oil phase volume fraction on the ball surface and the cage guiding surface [34]. A central composite design was established with a 2-factor 3-level table as presented in Table 3.
Nine simulations need to be conducted, and the results are shown in Table 4.
The dates in Table 5 were analyzed by Design-Expert, and then the regression equations for the weighted average of the oil phase volume fraction on the ball surface and cage guiding surface were obtained.
y 1 = 0.48 0.041 × ϕ 0.03 × h × ϕ + 0.036 × h 2
y 2 = 0.43 + 5.033 E 003 × ϕ 0.055 × h + 0.035 × ϕ × h + 0.025 × ϕ 2 0.073 × h 2
The results of the variance analysis for Formulas (17) and (18) are shown in Table 5 and Table 6, respectively.
The results in Table 5 indicate that the p-value of the model is 0.0023 ≤ 0.05, suggesting a statistically significant regression relationship between the weighted average of the oil phase volume fraction on the ball surface and the factors considered. Therefore, it can be concluded that Formula (17) is applicable.
The results in Table 6 indicate that the p-value of the model is 0.2073, which is greater than the significance level of 0.05. This suggests a lack of significant regression relationship between the weighted average of the oil phase volume fraction on the cage guiding surface and the factors under consideration. Therefore, it can be concluded that Formula (18) is not applicable.
The two-dimensional influence diagram of the nozzle angle and height on the weighted average of the oil phase volume fraction on the ball surface is obtained from Formula (17), as depicted in Figure 15, and as the color becomes darker, the value increases.
Unfortunately, the peak value of the function is not within this lubrication area and cannot be used. The maximum weighted average of the oil phase volume fraction on the ball surface is observed when the nozzle height is 46 mm and the nozzle angle is 20, as depicted in Figure 15.
In practical applications, this universal method can also be used to obtain the optimal position for oil-jet lubrication.

4. Conclusions

A two-phase flow model of the angular contact ball bearing was established, taking into account the nozzle, and subsequently validated through experimental results. The lubricant distribution laws of an angular contact ball bearing cavity with a nozzle were analyzed in this paper, followed by the optimization of the nozzle position. The main methods and conclusions can be summarized as follows:
The results indicate that the impact of nozzle height on the ball surface is negligible, whereas it is significant on the cage guiding surface. Additionally, both the ball surface and cage guiding surface are significantly affected by nozzle angle. Regression functions were established using response surface methodology to determine the weighted average of oil phase volume fraction on both surfaces. It was determined that under operating conditions where inner ring speed is 1000 r/min and oil jet velocity is 1 m/s, the optimal nozzle height is 46 mm and the nozzle angle is 20°.

Author Contributions

Investigation, B.W.; Experiment and simulation, Y.L. (Yuanyuan Li), Y.L. (Yemin Li).; Resources, J.Z.; Writing—review & editing, M.W. All authors have read and agreed to the published version of the manuscript.

Funding

This work was financially supported by the Natural Science Foundation of Liaoning Province (2023-MS-280), the Scientific Research Project of Education Department of Liaoning Province (LJKMZ20220864), and the Key Research and Development Program of Ningbo (2022Z050).

Data Availability Statement

The original contributions presented in the study are included in the article, further inquiries can be directed to the corresponding author.

Conflicts of Interest

The authors declare no conflict of interest.

References

  1. Gao, W.; Nelias, D.; Li, K.; Liu, Z.; Lyu, Y. A multiphase computational study of oil distribution inside roller bearings with under-race lubrication. Tribol. Int. 2019, 140, 105862. [Google Scholar] [CrossRef]
  2. Yan, K.; Wang, Y.; Zhu, Y.; Hong, J.; Zhai, Q. Investigation on heat dissipation characteristic of ball bearing cage and inside cavity at ultra high rotation speed. Tribol. Int. 2016, 93, 470–481. [Google Scholar] [CrossRef]
  3. Yan, B.; Dong, L.; Yan, K.; Chen, F.; Zhu, Y.; Wang, D. Effects of oil-air lubrication methods on the internal fluid flow and heat dissipation of high-speed ball bearings. Mech. Syst. Signal Process. 2021, 151, 107409. [Google Scholar] [CrossRef]
  4. Bao, H.; Hou, X.; Lu, F. Analysis of Oil-Air Two-Phase Flow Characteristics inside a Ball Bearing with Under-Race Lubrication. Processes 2020, 8, 1223. [Google Scholar] [CrossRef]
  5. Ge, L.; Yan, K.; Wang, C.; Zhu, Y.; Hong, J. A novel method for bearing lubrication enhancement via the inner ring groove structure. J. Phys. Conf. Ser. 2021, 1820, 012092. [Google Scholar] [CrossRef]
  6. Chen, H.; Liang, H.; Wang, W.; Zhang, S. Investigation on the oil transfer behaviors and the air-oil interfacial flow patterns in a ball bearing under different capillary conditions. Friction 2022, 11, 228–245. [Google Scholar] [CrossRef]
  7. Shan, W.; Chen, Y.; Huang, J.; Wang, X.; Han, Z.; Wu, K. A multiphase flow study for lubrication characteristics on the internal flow pattern of ball bearing. Results Eng. 2023, 20, 101429. [Google Scholar] [CrossRef]
  8. Oh, I.-S.; Kim, D.; Hong, S.-W.; Kim, K. Three-dimensional air flow patterns within a rotating ball bearing. Adv. Sci. Lett. 2013, 19, 2180–2183. [Google Scholar] [CrossRef]
  9. Liu, J.; Ni, H.; Xu, Z.; Pan, G. A simulation analysis for lubricating characteristics of an oil-jet lubricated ball bearing. Simul. Model. Pract. Theory 2021, 113, 102371. [Google Scholar] [CrossRef]
  10. Peterson, W.; Russell, T.; Sadeghi, F.; Berhan, M.T. Experimental and analytical investigation of fluid drag losses in rolling element bearings. Tribol. Int. 2021, 161, 107106. [Google Scholar] [CrossRef]
  11. Aidarinis, J.; Missirlis, D.; Yakinthos, K.; Goulas, A. CFD modeling and LDA measurements for the air-flow in an aero engine front bearing chamber. J. Eng. Gas Turbines Power 2011, 133, 082504. [Google Scholar] [CrossRef]
  12. Maccioni, L.; Chernoray, V.G.; Mastrone, M.N.; Bohnert, C.; Concli, F. Study of the impact of aeration on the lubricant behavior in a tapered roller bearing: Innovative numerical modelling and validation via particle image velocimetry. Tribol. Int. 2022, 165, 107301. [Google Scholar] [CrossRef]
  13. Maccioni, L.; Chernoray, V.G.; Bohnert, C.; Concli, F. Particle Image Velocimetry measurements inside a tapered roller bearing with an outer ring made of sapphire: Design and operation of an innovative test rig. Tribol. Int. 2022, 165, 107313. [Google Scholar] [CrossRef]
  14. Liang, H.; Zhang, Y.; Wang, W. Influence of the cage on the migration and distribution of lubricating oil inside a ball bearing. Friction 2021, 10, 1035–1045. [Google Scholar] [CrossRef]
  15. Arya, U.; Peterson, W.; Sadeghi, F.; Meinel, A.; Grillenberger, H. Investigation of oil flow in a ball bearing using Bubble Image Velocimetry and CFD modeling. Tribol. Int. 2023, 177, 107968. [Google Scholar] [CrossRef]
  16. Wen, B.; Li, Y.; Wang, M.; Yang, Y. Measurement for Lubricant Distribution in an Angular Contact Ball Bearing and Its Influence Investigation. Lubricants 2023, 11, 63. [Google Scholar] [CrossRef]
  17. Chen, H.; Wang, W.; Liang, H.; Ge, X. Observation of the oil flow in a ball bearing with a novel experiment method and simulation. Tribol. Int. 2022, 174, 107731. [Google Scholar] [CrossRef]
  18. Noda, T.; Shibasaki, K.; Miyata, S.; Taniguchi, M. X-Ray CT Imaging of Grease Behavior in Ball Bearing and Numerical Validation of Multi-Phase Flows Simulation. Tribol. Online 2020, 15, 36–44. [Google Scholar] [CrossRef]
  19. Kazumi, S.; Yusuke, A.; Yoshimu, I.; Nobuharu, K.; Yoshihiro, M. Observation of Grease Fluidity in a Ball Bearing Using Neutron Imaging Technology. Tribol. Online 2021, 16, 146–150. [Google Scholar]
  20. Franken, M.J.Z.; Chennaoui, M.; Wang, J. Mapping of Grease Migration in High-Speed Bearings Using a Technique Based on Fluorescence Spectroscopy. Tribol. Trans. 2017, 60, 789–793. [Google Scholar] [CrossRef]
  21. Sánchez-González, R.; North, S.W. Nitric oxide laser-induced fluorescence imaging methods and their application to study high-speed flows. In Frontiers and Advances in Molecular Spectroscopy; Elsevier: Amsterdam, The Netherlands, 2018; pp. 599–630. [Google Scholar]
  22. Meinhart, C.D.; Wereley, S.T.; Santiago, J.G. PIV measurements of a microchannel flow. Exp. Fluids 1999, 27, 414–419. [Google Scholar] [CrossRef]
  23. Mastrone, M.N.; Hartono, E.A.; Chernoray, V.; Concli, F. Oil distribution and churning losses of gearboxes: Experimental and numerical analysis. Tribol. Int. 2020, 151, 106496. [Google Scholar] [CrossRef]
  24. Hu, J.; Xun, B.; Zhang, X.-M.; Zhang, Q.-Y.; Li, G.-W. Design and research of new-type nozzle structure based on oil–air lubrication. Meccanica 2023, 59, 1–18. [Google Scholar] [CrossRef]
  25. Yan, K.; Zhang, J.; Hong, J.; Wang, Y.; Zhu, Y. Structural optimization of lubrication device for high speed angular contact ball bearing based on internal fluid flow analysis. Int. J. Heat Mass Transf. 2016, 95, 540–550. [Google Scholar] [CrossRef]
  26. Li, S.; Deng, G.; Hu, Y.; Yu, M.; Ma, T. Optimization of structural parameters of pilot-operated control valve based on CFD and orthogonal method. Results Eng. 2024, 21, 101914. [Google Scholar] [CrossRef]
  27. Wu, W.; Hu, C.; Hu, J.; Yuan, S. Jet cooling for rolling bearings: Flow visualization and temperature distribution. Appl. Therm. Eng. 2016, 105, 217–224. [Google Scholar] [CrossRef]
  28. Wu, W.; Hu, J.; Yuan, S.; Hu, C. Numerical and experimental investigation of the stratified air-oil flow inside ball bearings. Int. J. Heat Mass Transf. 2016, 103, 619–626. [Google Scholar] [CrossRef]
  29. Zeng, Q.; Zhang, J.; Hong, J.; Liu, C. A comparative study on simulation and experiment of oil-air lubrication unit for high speed bearing. Ind. Lubr. Tribol. 2016, 68, 325–335. [Google Scholar] [CrossRef]
  30. Samokhinv, N. Mathematical Models in Boundary Layer Theory; CRC Press: Boca Raton, FL, USA, 2018. [Google Scholar]
  31. Liu, J.; Ni, H.; Zhou, R.; Li, X.; Xing, Q.; Pan, G. A Simulation Analysis of Ball Bearing Lubrication Characteristics Considering the Cage Clearance. J. Tribol. 2023, 145, 044301. [Google Scholar] [CrossRef]
  32. Hu, J.; Wu, W.; Wu, M.; Yuan, S. Numerical investigation of the air–oil two-phase flow inside an oil-jet lubricated ball bearing. Int. J. Heat Mass Transf. 2014, 68, 85–93. [Google Scholar] [CrossRef]
  33. Kaur, H.; Rahi, D.K. Response surface methodology-based optimisation of chitin production and its antioxidant activity from Aspergillus niger. Heliyon 2024, 10, e25646. [Google Scholar] [CrossRef] [PubMed]
  34. Rao, B.R.; Tiwari, R.J. Optimum design of rolling element bearings using genetic algorithms. Mech. Mach. Theory 2007, 42, 233–250. [Google Scholar]
Figure 1. The bearing structure and the spatial orientation of its nozzle.
Lubricants 12 00419 g001
Figure 2. The fluid field of the bearing cavity with the nozzle.
Lubricants 12 00419 g002
Figure 3. The flowchart of the research.
Lubricants 12 00419 g003
Figure 4. Schematic diagram of an oil droplet motion trajectory.
Lubricants 12 00419 g004
Figure 5. Test rig and tested bearing.
Lubricants 12 00419 g005
Figure 6. The process of photographing the oil jet lubricated. (a) Original images. (b) PS images. (c) Grayscale images.
Lubricants 12 00419 g006
Figure 7. CFD mesh and boundary conditions.
Lubricants 12 00419 g007
Figure 8. Photographing results of oil distribution on the ball surface.
Lubricants 12 00419 g008
Figure 9. Comparison between simulation and test results.
Lubricants 12 00419 g009
Figure 10. Schematic diagram of observation surfaces in the bearing fluid domain.
Lubricants 12 00419 g010
Figure 11. Oil phase distribution maps with different nozzle heights.
Lubricants 12 00419 g011
Figure 12. Line graph of the weighted average of the oil phase volume fraction on the ball and the cage guiding surface with different nozzle heights.
Lubricants 12 00419 g012
Figure 13. Oil phase distribution maps with different nozzle angles.
Lubricants 12 00419 g013
Figure 14. Line graph of the weighted average of the oil phase volume fraction on the ball and the cage guiding surface with different nozzle angles.
Lubricants 12 00419 g014
Figure 15. Two-dimensional graph for the weighted average of the oil phase volume fraction on the ball surface.
Lubricants 12 00419 g015
Table 1. Structural dimensions of angular contact ball bearing.
ItemSymbolUnitValue
Diameter of inner ringdmm65
Diameter of outer ringDmm100
Diameter of ball D w mm11
Number of ballsZNo.18
Contact angle α °15
Width of ringBmm18
Table 2. Oil material parameters.
ParameterSymbolUnitValue
temperaturetK313.15
density ρ kg/m3876
Kinematic viscosity ν 10 6   m 2 / s 30
Specific heatc W / m 2 · K 1.96
Table 3. Factor level table.
FactorsLevel
−101
Nozzle height h/mm44.545.2546
Nozzle angle ϕ 203550
Table 4. Simulation results.
NumberFactorsThe Weighted Average of the Oil Phase Volume Fraction on the Ball SurfaceThe Weighted Average of the Oil Phase Volume Fraction on the Cage Guiding Surface
h ϕ
144.5200.525660.48531
244.5350.512690.39439
344.5500.49910.30932
445.25200.507940.41052
545.25350.506560.42806
645.25500.430670.29146
746200.591070.37645
846350.529870.50311
946500.446490.33966
Table 5. Variance analysis table of the regression function for the ball surface.
SourceSum of SquaresdfMean SquareFp-Value
Model0.01635.441 × 10−323.050.0023
ϕ 0.01010.01043.570.0012
h × ϕ 3.482 × 10−313.482 × 10−314.750.0121
h22.557 × 10−312.557 × 10−310.830.0217
Residual1.180 × 10−352.360 × 10⁻⁴
Cor Total0.0188
Table 6. Variance analysis table of the regression function for the cage guiding surface.
SourceSum of SquaresdfMean SquareFp-Value
Model0.03557.049 × 10−32.870.2073
h1.520 × 10−411.520 × 10−40.0620.8196
ϕ 0.01810.0187.470.0717
h ϕ 4.844 × 10−314.844 × 10−31.970.2548
h21.220 × 10−311.220 × 10−30.50.5318
ϕ 2 0.01110.0114.350.1284
Residual7.369 × 10−332.456 × 10⁻³
Cor Total0.0438
Disclaimer/Publisher’s Note: The statements, opinions and data contained in all publications are solely those of the individual author(s) and contributor(s) and not of MDPI and/or the editor(s). MDPI and/or the editor(s) disclaim responsibility for any injury to people or property resulting from any ideas, methods, instructions or products referred to in the content.

