Article

On the Nucleation Rate of Confinement-Induced Liquidlike-to-Solidlike Phase Transitions

1
Department of Mechanical and Aerospace Engineering, The George Washington University, Washington, DC 20052, USA
2
Department of Chemistry and Chemical Biology, Rensselaer Polytechnic Institute, Troy, NY 12180, USA
*
Authors to whom correspondence should be addressed.
Current address: Division of Thoracic Surgery, Brigham and Women’s Hospital and Harvard Medical School, Boston, MA 02115, USA.
Lubricants 2024, 12(12), 420; https://doi.org/10.3390/lubricants12120420
Submission received: 30 September 2024 / Revised: 24 November 2024 / Accepted: 26 November 2024 / Published: 28 November 2024

Abstract

:
The confinement-induced liquidlike-to-solidlike phase transition is a well-documented phenomenon observed in both experimental and computational settings. In order to better understand the kinetics and thermodynamics of this process, this study uses molecular dynamics (MD) simulations employing four different methods to examine the nucleation rate of crystalline argon from a confined liquidlike state between two solid walls. The results demonstrate that all four methods produce the same nucleation rate within a factor of two. By analyzing the mean first-passage time (MFPT) and steady-state probability distribution of the largest cluster, the free energy barrier of nucleation is also extracted, which is in the same order of magnitude as k B T . These findings quantitatively explain why confinement-induced solidification is observed in direct brutal-force MD simulations and can occur simultaneously as the confinement approaches a critical thickness. This study also provides insight into the nature of heterogeneous nucleation in nanoconfinement.

1. Introduction

Fundamentally, the mechanical properties of nanometer confined liquid films under normal compression and shearing between two solid surfaces play a central role in friction and lubrication. The subject is broadly connected to surface and interfacial science, as the intermolecular and surfaces forces that act on molecularly thin lubricant films and the confining surfaces are of utmost importance. In particular, confinement-induced liquidlike-to-solidlike phase transitions in simple liquids are widely observed in surface force apparatus (SFA) experiments [1,2,3,4] and computational simulations [5,6,7,8].
In our previous molecular dynamics (MD) simulations on the force oscillation mechanism of a simple Lennard-Jones (LJ) fluid confined between two solid surfaces [9], we discovered that the confinement-induced layering transition represents an abrupt liquidlike-to-solidlike phase change. For a larger contact area, our most recent publication [10] showed that the solidified film could be generated in a polycrystalline form following this phase transition. For a more complex and realistic film of cyclohexane, our study [11] also demonstrates that the cyclohexane lubricant film confined between two mica surfaces undergoes a sudden phase transition from a liquidlike to a solidlike state at a thickness of less than six monolayers. To model the mica–cyclohexane system, more complicated many-body potentials and long-range electrostatic interactions are included.
As the mechanical behavior of confined liquid films, subjected to external loading such as compression and shear, has been one of the main focuses in the past, very few investigations have addressed the nature of the confinement-induced liquidlike-to-solidlike solidification from the perspective of heterogeneous nucleation process. An essential question to consider in this regard is the kinetics of the confinement-induced nucleation process. We contend that answering this fundamental question would significantly broaden our comprehension of this subject.
In a previous study, Chkonia et al. compared four different methods by studying the homogeneous nucleation of liquid argon from a gas state [12]. They found that the nucleation rate obtained through all four techniques agreed well, showing discrepancies not larger than a factor of two. However, confinement-induced liquidlike-to-solidlike phase transitions, a form of heterogeneous nucleation, usually proceeds much faster than homogeneous nucleation. In this work, we aim to take the initial step by applying the four methods to investigate the nature of such a confinement-induced phase transition. Once the mean first-passage time (MFPT) and steady-state probability distribution are derived from MD simulations, the free energy barrier of nucleation can be further extracted via a recently proposed method [13,14]. In the following discussion in this paper, Section 2 will describe the detailed simulation model and methods. In Section 3, four different methods will be employed to examine the nucleation rate of crystalline argon from a confined liquidlike state. The estimation of the free energy profile of solidification will be obtained in Section 4. We conclude our MD simulation studies in Section 5.

2. Simulation Details

In this study, we utilize the simplest model system, the Lennard-Jones argon system. It is worth noting that many foundational studies have employed this straightforward system as a proof of concept. The molecular models used here are also consistent with those from our previous work [10,15,16]. As illustrated in Figure 1, an argon film, as a nonpolar model lubricant, is confined between two rigid face-centered cubic (FCC) solid walls. Interactions between argon molecules are modeled using a simple Lennard-Jones (LJ) pair potential, with σ = 0.3405 nm and ε = 0.2381 kcal/mol, consistent with the literature [17]. The two FCC crystal walls have the z-direction along the [111] direction, while the x- and y-directions are along the [ 1 1 ¯ 0 ] and [ 11 2 ¯ ] directions, respectively. The wall–fluid interaction between argon and solid wall is identical to the argon–argon interaction (i.e., εwf = εff = ε, where w and f stand for “wall” and “fluid”, respectively). Periodic boundary conditions (PBCs) are applied along the x- and y-directions to represent the infinite extent of lateral surfaces. A standard cutoff distance of 8.5 Å (approximately 2.5 σ) is used for the LJ interactions, and the time step is 1.0 fs in MD simulations. All simulations are conducted using the Nosé–Hoover thermostat [18,19] at a temperature of 85 K, which corresponds to the liquid state of argon and falls between its melting point (83.8 K) and boiling point (87.3 K).
The MD simulation is summarized in three steps. First, a squeeze-out simulation of the lubricant film is performed through a liquid–vapor molecular dynamics (LVMD) simulation [9,10,11] by gradually pushing the upper confining wall downward using a compression speed of v = 0.05 m/s and a driving spring with kz = 150 N/m. Second, after reaching a gap distance of D = 2.345 nm, a 5 million-timestep (5 ns) equilibrium run is performed with the spring being held. During this equilibration, the confined argon molecules remain in a liquid state and the gap distance fluctuates around D = 2.345 nm, which is slightly larger than the n = 7 monolayer thickness (D ≈ 2.242 nm). The final configuration is shown in Figure 1a. Third, in order for spontaneous nucleation to happen, we intentionally removed the spring to avoid any constraint on the nanoconfined system, followed by carrying out multiple independent 10 ns LVMD simulation runs. Upon nucleation occurring, it was found that solidification is initiated in the central region, starting with the formation of a crystal bridge (Figure 1b), followed by an outward growth towards the confined boundary. At the end of the simulation, the confined film is transformed into a crystalline structure with n = 7 monolayers, showing alternating FCC and HCP structures (Figure 1c).
Since nucleation is a stochastic process, it is important to obtain statistically meaningful results by studying a large number of repetitions. In this study, we performed a total of 150 MD simulations with the same initial configuration (see Figure 1a), but with different initial velocity distributions. By observing the nucleation and growth processes, we find that each final solidified structure is nucleated from only one crystal bridge that exceeds a critical size number n*. The size of the largest nucleated cluster is determined by counting the total number of atoms in the solidified phase, identified as those in FCC, HCP, or BCC structures in the confined region. The OVITO open visualization tool [20] is used to characterize the local structural environment of atoms via the common neighbor analysis (CNA) [21]. The CNA method can identify local crystalline structures of simple condensed phases such as FCC, HCP, BCC, and other simple cubic (SC) and icosahedral (ICO) structures. In our analysis, we excluded atoms in the two-contact layers to avoid the effect of templating induced by the confining walls, which even in the liquid state can result in atoms adopting a certain solidlike structure.

3. Nucleation Rate Calculations

In line with the previous work by Chkonia et al. [12], we apply four different methods to calculate the nucleation rate of the nanoconfined system. These methods are as follows: (1) the mean first-passage time (MFPT) method [22], (2) the direct observation method (DOM) [23], (3) the Yasuoka–Matsumoto (YM) method [24,25], and (4) the survival probability (SP)-based method. The basic principle of each method and calculation results are discussed below.

3.1. Mean First-Passage Time (MFPT) Method

The MFPT is defined as the average time τ ( n ) it takes for a nucleating cluster to reach a specific size n for the first time. For instance, we record the first time a nucleating cluster reaches a size of n = 400 for each MD simulation as illustrated in Figure 2a. Since nucleation is a stochastic process, nucleation time has a wide distribution. The MFPT τ ( n = 400 ) for a specific size n = 400 can be obtained by averaging over all 150 simulations in this work. The obtained MFPT (as shown in Figure 2b), which has a characteristic sigmoidal shape, can be described by the following expression [22]:
τ n = τ J 2 1 + erf b n n * ,
where erf x = 2 π 0 x e t 2 d t is the error function and b is related to the Zeldovich factor Z = b π . This method is very powerful in that a simple fitting process without any free parameter to the MFPT can offer all the relevant information on the key parameters of nucleation kinetics, such as the critical cluster size n * , the nucleation time τ J , and the constant b. Nucleation rate can be obtained in terms of the nucleation time τ J with the following equation [22]:
J = 1 V τ J
where V is the volume of the confined region. The MFPT and its fitting curve are shown in Figure 2b and the relevant parameters are shown in Table 1. The inflection point of the MFPT curve approximately corresponds to the location of the critical size of nucleating cluster, which is about 30. This result is consistent with the fitting result as shown in the figure. Surprisingly, the obtained MFPT curve does not show any plateau, indicating a low free energy barrier for the solidification of this nanoconfined system. This observation suggests that the nucleation and growth processes occur on similar timescales. Our direct observation of nucleation and growth processes through brute-force MD simulations without any advanced sampling techniques confirmed these findings.

3.2. Direct Observation Method (DOM)

As the name indicates, DOM is a straightforward approach that directly observes the onset of nucleation events. The nucleation rate obtained from this method depends on the average onset time τ d o m at which the system produces the first nucleus with its size larger than a predefined threshold size n t [12,23,26]. According to the classical nucleation theory (CNT), any nucleated cluster reaching a critical size still has a 50% chance to nucleate or decay again. Therefore, the predefined threshold size must be sufficiently larger than the critical value. Since n * = 30 is determined from the MFPT method, the n t values varying from 30 to 90 are chosen in this study. The obtained τ d o m and nucleation rates are summarized in Table 2.

3.3. Yasuoka–Matsumoto (YM) Method

The nucleation rate obtained using the Yasuoka–Matsumoto method [24,25] is based on the following expression:
J n t , t = 1 V N ( n t , t ) t .
where V is the volume of the confined region. This method requires the time evolution of the total number of clusters with size larger than a predetermined threshold number n t to be recorded. Theoretically, the nucleation rate in the steady state calculated using this method should not depend on the value of n t , as long as it is sufficiently larger than the critical size of nucleus n * . Four different thresholds n t = 15, 30, 60, and 120 are used in this study. The nucleation rate was then determined by fitting a straight line to the N–t curve for the early stages of nucleation. As can be seen in Figure 3 and Table 3, the slopes and thus the nucleation rates are found to be nearly identical for different threshold values. In other words, the N–t curve for larger n t is nearly a parallel shift for smaller n t , which indicates that essentially the same nucleus with different sizes is recorded in the nucleation and growth process.

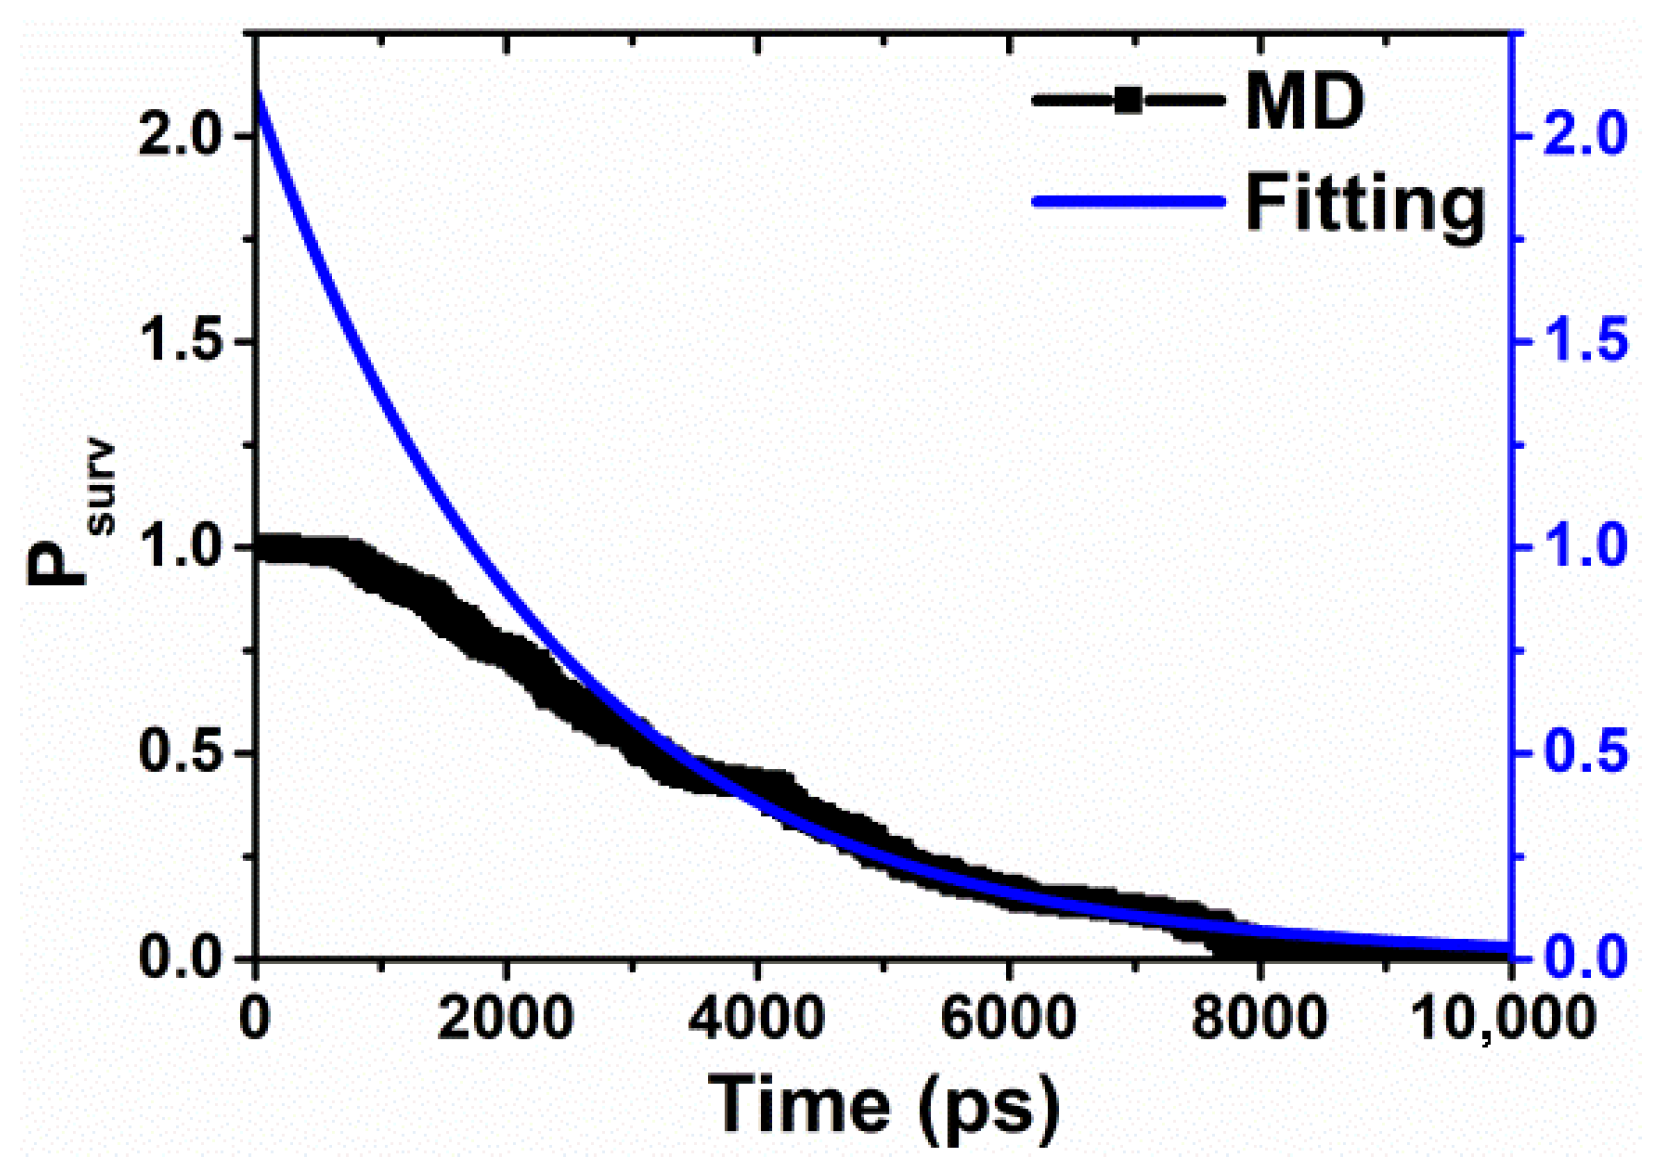
4. Survival Probability (SP) Method

This method is based on the concept of survival probability of the random nucleation events, which is defined as the probability that the confined liquid film has not nucleated any cluster of size n after a time t [12].
S n t = P 0 t = e t / τ n
In the case of relatively small nucleation barrier, the SP deviates from a purely exponential decay as in Equation (4) due to its cluster-size dependence. However, the tail of the SP can still be fitted approximately using the following exponential expression:
P s u r v t = 1 P n u c t = e t t 0 τ J
where P n u c t is the ratio of the number of nucleated systems to the number of simulation runs and t 0 is the shortest time the system produces a nucleated cluster among 150 independent MD runs. The nucleation time τ J can be obtained by fitting the measured SP distribution to Equation (5).
Figure 4 shows the corresponding SP curve and the fitted exponential expression. To summarize, in Table 4 we present the nucleation rates calculated using four different methods at the critical size of n* = 30 and n t = 60. The results show good agreement within a factor of 2, which is a relatively small error in the study of the nucleation process.
We point out that the nucleation rate obtained in this study is in the same order of magnitude as that of the condensation of LJ argon from vapor phase, facilitated by a high supersaturation, in which the absence of a clear plateau in MFPT was also observed [12].
The early publication by Chkonia et al. [12] provided a comparative analysis about the advantages and disadvantages of the four techniques. They pointed out that both the MFPT and YM methods appear to be the more favorable options. The SP method serves as a supplementary means to verify nucleation rates. The DOM does not offer any distinct advantages over the MFPT method but forfeits valuable additional information that is readily available when using the MFPT method. Here, based on our studies utilizing the four methods for the nanoconfined system, we summarize the characteristics of the four methods in Table 5.

5. Estimation of the Free Energy Profile of Solidification

To determine the effective free energy profile and barrier, we employ the kinetic reconstruction method developed by Wedekind and Reguera [13,14]. This approach requires two key components: the MFPT τ ( n ) and the steady-state probability distribution P s t ( n ) . It is important to highlight that the original derivation of this approach is grounded in the general out-of-equilibrium kinetics of activated systems, rather than being specific to the classical nucleation theory. Nevertheless, as a proof of concept, it was first applied to the classical nucleation theory and molecular dynamics simulations of the homogeneous nucleation of Lennard-Jones argon vapor, demonstrating its robustness and effectiveness. This method has been employed to study water and ice nucleation [27,28], the crystallization in deeply supercooled liquid silicon [29], the nucleation of the FCC phase in the pure Ni and the B2 phases in the Ni50Al50 and Cu50Zr50 alloys [30], and the nucleation barriers in tetrahedral liquids encompassing both glassy and crystallization phases [31].
In this study, the steady-state probability P s t ( n ) is obtained from a histogram of the different values of the size of the largest cluster accumulated in all simulation runs, in which the initial 2000 timesteps (2 ps) are discarded to avoid initial transient state in this study. To obtain the steady-state probability distribution P s t ( n ) , we generated a histogram of the different values of the size of the largest cluster accumulated in all simulation runs. Once τ ( n ) and P s t ( n ) are obtained, we can calculate the distribution using the following formula:
B n = 1 P s t ( n ) n b P s t ( n ) d n τ b τ ( n ) τ b
where b is the so-called adsorbing boundary condition, i.e., MD sampling would stop once the largest cluster has grown to size b. In this work, we chose n = 80. Then, the free energy profile G n can be reconstructed using the following expression:
G n = G n 1 + 1 β ln B n B n 1 n 1 n d n B ( n )
where β = 1 / k B T . We use n 1 = 1 as the reference point and G n = 1 = 1 β ln P s t ( n = 1 ) . The MFPT τ ( n ) , the steady-state probability distribution P s t ( n ) , and the free energy G n are shown in Figure 5. Both MFPT τ(n) and its fitting to Equation (1) are used in our analysis. It is worth noting that the initial values of MFPT may not be entirely accurate since we use the total number of solid atoms in the confined region to approximate the number of atoms in the largest nucleated cluster. Nonetheless, our analysis revealed that the critical size is n * ≈ 34 and free energy barrier is G n * ≈ 5.3 k B T . Overall, the kinetic reconstruction method allows us to obtain a detailed understanding of the nucleation process in confined argon film and provides valuable insights into the thermodynamics of this system.

6. Summary and Further Discussion

In this study, we conduct MD simulations and use four different methods to determine the nucleation rate of the solidification of a liquidlike argon film confined between two solid walls. We find that all four methods provided similar nucleation rates within a factor of two. By using the mean first-passage time (MFPT) and the steady-state probability distribution of the largest cluster, we extracted the free energy barrier of nucleation, which was found to be a few k B T . This result helps to explain why confinement-induced solidification can be observed in direct brute-force MD simulations, which occurs simultaneously when the confinement approaches a critical layer thickness. We believe that the extracted free energy barrier can serve as an upper limit for the nucleation barrier. During the squeeze-out process, where the top confining wall is compressed continuously, the ease of nucleation is facilitated.
We note that in this work, we approximated the number of atoms in the largest nucleated cluster by using the total number of atoms in the solidified phase in the confined region. While this method accurately describes the post-nucleation process, it is less rigorous before the critical nucleus is formed. Nevertheless, this work demonstrates that this is a pretty good approximation to evaluate the nucleation rate. We suggest that more accurate yet complicated methods, such as clustering algorithms, should be developed in future work to quantify the largest nucleated cluster. The approach used in this work can be directly extended to more complex systems, such as multi-component Lennard-Jones fluids and realistic model lubricants like OMCTS and cyclohexane, provided the liquidlike-to-solidlike phase transition is observable. Modeling these systems may require incorporating many-body potentials and accounting for long-range electrostatic interactions to accurately capture their behavior. Furthermore, while this study only focused on the nucleation rate and free energy barrier when the gap distance approached the critical thickness nc = 7, a comprehensive investigation of a few monolayers, thickness-dependent nucleation rates, and their corresponding free energy barriers should be explored in the near future.
This study is entirely simulation-based. Exploring ways to relate our simulation findings to experimental measurements would be an intriguing future direction. One interesting avenue to investigate is the potential relationship between the solvation force curve or loading rate (measurable and controllable via SFA and AFM) and the nucleation rate (accessible through MD simulations).
Our previous work demonstrates that the critical layer number, nc, necessary for the liquid-to-solid phase transition varies depending on the nature of the contact: the transition occurs at nc = 7 for commensurate contact, and at nc = 5 for incommensurate contact [9,10], consistent with observations in other study [32]. Based on these findings, we hypothesize that nucleation rates are contact-dependent, with higher rates and lower free energy barriers occurring in commensurate contacts compared to incommensurate ones. This implies that incommensurate confining surfaces may be more effective in enhancing lubrication performance—a hypothesis that we plan to validate in future studies. Additionally, if we consider the effects of surface chemistry, it could significantly alter the nucleation behavior by introducing new interactions at the interface, thereby influencing the phase transition. This opens intriguing possibilities for future exploration.
Molecular dynamics simulations are inherently limited by constraints in both length and time scales, which hinders direct comparison with experimental data. To overcome this limitation, computational modeling at the continuum level offers a viable alternative, allowing for more direct alignment with experimental results. Significant progress has been made in recent years in advancing continuum-level modeling of phase transitions. For instance, J. Lutsko integrated classical density functional theory with stochastic process theory and rare event techniques to develop a comprehensive theoretical framework for nucleation processes [33,34]. Similarly, Hu et al. introduced a direct van der Waals simulation (DVS) approach to investigate liquid–vapor phase transformations on the centimeter scale and at Reynolds numbers on the order of O(105). This method relies solely on van der Waals thermodynamics and the fundamental principles of continuum mechanics, without requiring additional modeling assumptions [35]. Interestingly, Gallo et al. introduced a novel dynamical theory of boiling that leverages fluctuating hydrodynamics in combination with the diffuse interface method. This mesoscale approach effectively bridges the gap between traditional macroscopic models and detailed molecular dynamics simulations, offering a more comprehensive framework to capture the complexities of phase transition phenomena [36]. Wu et al. introduced benchmark problems for nucleation using a phase field model, encompassing the following: (1) homogeneous nucleation with both single seeds under varying initial conditions and multiple seeds, (2) athermal heterogeneous nucleation, as well as (3) nucleation behavior near the free growth limit under different undercooling driving forces [37]. A compelling future direction would be to explore whether the phase field method and other methods listed above can be effectively utilized to model confinement-induced liquidlike-to-solidlike phase transitions.

Author Contributions

Conceptualization, R.-G.X.; Methodology, R.-G.X. and Y.L.; Software, R.-G.X., G.Z., T.L. and Y.X.; Validation, R.-G.X., G.Z. and Y.X.; Formal analysis, R.-G.X., G.Z., T.L., Y.X. and Y.L.; Investigation, R.-G.X. and G.Z.; Resources, R.-G.X., Y.X. and Y.L.; Data curation, R.-G.X., G.Z., T.L. and Y.X.; Writing—original draft, R.-G.X.; Writing—review and editing, R.-G.X., G.Z. and Y.L.; Visualization, R.-G.X., G.Z. and T.L.; Supervision, R.-G.X. and Y.L.; Project administration, R.-G.X. and Y.L.; Funding acquisition, Y.L. All authors have read and agreed to the published version of the manuscript.

Funding

This work is supported by the National Science Foundation (NSF 1149704 and 1953171) and the resources of the National Energy Research Scientific Computing Center (NERSC). A DOE Office of Science User Facility supported this project via the Office of Science of the U.S. Department of Energy under Contract no. DE-AC02-05CH11231.

Data Availability Statement

The original contributions presented in the study are included in the article, further inquiries can be directed to the corresponding author.

Conflicts of Interest

The authors declare no conflict of interest.

References

  1. Israelachvili, J.N.; McGuiggan, P.M.; Homola, A.M. Dynamic properties of molecularly thin liquid films. Science 1988, 240, 189–191. [Google Scholar] [CrossRef] [PubMed]
  2. Van Alsten, J.; Granick, S. Molecular tribometry of ultrathin liquid films. Phys. Rev. Lett. 1988, 61, 2570. [Google Scholar] [CrossRef] [PubMed]
  3. Klein, J.; Kumacheva, E. Confinement-induced phase transitions in simple liquids. Science 1995, 269, 816–819. [Google Scholar] [CrossRef] [PubMed]
  4. Klein, J.; Kumacheva, E. Simple liquids confined to molecularly thin layers. I. Confinement-induced liquid-to-solid phase transitions. J. Chem. Phys. 1998, 108, 6996–7009. [Google Scholar] [CrossRef]
  5. Schoen, M.; Diestler, D.; Cushman, J. Fluids in micropores. I. Structure of a simple classical fluid in a slit-pore. J. Chem. Phys. 1987, 87, 5464–5476. [Google Scholar] [CrossRef]
  6. Thompson, P.A.; Robbins, M.O. Origin of stick-slip motion in boundary lubrication. Science 1990, 250, 792–794. [Google Scholar] [CrossRef] [PubMed]
  7. Gao, J.; Luedtke, W.; Landman, U. Layering transitions and dynamics of confined liquid films. Phys. Rev. Lett. 1997, 79, 705. [Google Scholar] [CrossRef]
  8. Cui, S.; Cummings, P.; Cochran, H. Molecular simulation of the transition from liquidlike to solidlike behavior in complex fluids confined to nanoscale gaps. J. Chem. Phys. 2001, 114, 7189–7195. [Google Scholar] [CrossRef]
  9. Lei, Y.; Leng, Y. Force oscillation and phase transition of simple fluids under confinement. Phys. Rev. E 2010, 82, 040501. [Google Scholar] [CrossRef]
  10. Xu, R.-G.; Xiang, Y.; Papanikolaou, S.; Leng, Y. On the shear dilation of polycrystalline lubricant films in boundary lubricated contacts. J. Chem. Phys. 2020, 152, 104708. [Google Scholar] [CrossRef]
  11. Xu, R.-G.; Leng, Y. Squeezing and stick–slip friction behaviors of lubricants in boundary lubrication. Proc. Natl. Acad. Sci. USA 2018, 115, 6560–6565. [Google Scholar] [CrossRef] [PubMed]
  12. Chkonia, G.; Wölk, J.; Strey, R.; Wedekind, J.; Reguera, D. Evaluating nucleation rates in direct simulations. J. Chem. Phys. 2009, 130, 064505. [Google Scholar] [CrossRef] [PubMed]
  13. Wedekind, J.; Reguera, D. Kinetic reconstruction of the free-energy landscape. J. Phys. Chem. B 2008, 112, 11060–11063. [Google Scholar] [CrossRef] [PubMed]
  14. Wedekind, J.; Chkonia, G.; Wölk, J.; Strey, R.; Reguera, D. Crossover from nucleation to spinodal decomposition in a condensing vapor. J. Chem. Phys. 2009, 131, 114506. [Google Scholar] [CrossRef] [PubMed]
  15. Xu, R.-G.; Rao, Q.; Xiang, Y.; Bian, M.; Leng, Y. Computational Simulations of Nanoconfined Argon Film through Adsorption–Desorption in a Uniform Slit Pore. Coatings 2021, 11, 177. [Google Scholar] [CrossRef]
  16. Xu, R.-G.; Xiang, Y.; Zhang, G.; Rao, Q.; Leng, Y. Nucleation of Frank Dislocation during the Squeeze-Out Process in Boundary Lubrication: A Molecular Dynamics Study. Materials 2022, 15, 997. [Google Scholar] [CrossRef] [PubMed]
  17. Allen, M.P.; Tildesley, D.J. Computer Simulation of Liquids; Oxford University Press: Oxford, UK, 2017. [Google Scholar]
  18. Nosé, S. A unified formulation of the constant temperature molecular dynamics methods. J. Chem. Phys. 1984, 81, 511–519. [Google Scholar] [CrossRef]
  19. Hoover, W.G. Canonical dynamics: Equilibrium phase-space distributions. Phys. Rev. A 1985, 31, 1695. [Google Scholar] [CrossRef]
  20. Stukowski, A. Visualization and analysis of atomistic simulation data with OVITO–the Open Visualization Tool. Model. Simul. Mater. Sci. Eng. 2009, 18, 015012. [Google Scholar] [CrossRef]
  21. Faken, D.; Jónsson, H. Systematic analysis of local atomic structure combined with 3D computer graphics. Comput. Mater. Sci. 1994, 2, 279–286. [Google Scholar] [CrossRef]
  22. Wedekind, J.; Strey, R.; Reguera, D. New method to analyze simulations of activated processes. J. Chem. Phys. 2007, 126, 134103. [Google Scholar] [CrossRef] [PubMed]
  23. Julin, J.; Napari, I.; Vehkamäki, H. Comparative study on methodology in molecular dynamics simulation of nucleation. J. Chem. Phys. 2007, 126, 224517. [Google Scholar] [CrossRef] [PubMed]
  24. Yasuoka, K.; Matsumoto, M. Molecular dynamics of homogeneous nucleation in the vapor phase. I. Lennard-Jones fluid. J. Chem. Phys. 1998, 109, 8451–8462. [Google Scholar] [CrossRef]
  25. Yasuoka, K.; Matsumoto, M. Molecular dynamics of homogeneous nucleation in the vapor phase. II. Water. J. Chem. Phys. 1998, 109, 8463–8470. [Google Scholar] [CrossRef]
  26. Zhou, X.; Liu, S.; Wang, L.; Li, Y.; Wu, W.; Duan, Y.; Li, H. Heterogeneous nucleation of Al melt in symmetrical or asymmetrical confined nanoslits. Nanoscale 2016, 8, 12339–12346. [Google Scholar] [CrossRef] [PubMed]
  27. Pérez, A.; Rubio, A. A molecular dynamics study of water nucleation using the TIP4P/2005 model. J. Chem. Phys. 2011, 135, 244505. [Google Scholar] [CrossRef]
  28. Leoni, F.; Shi, R.; Tanaka, H.; Russo, J. Crystalline clusters in mW water: Stability, growth, and grain boundaries. J. Chem. Phys. 2019, 151, 044505. [Google Scholar] [CrossRef]
  29. Goswami, Y.; Vasisht, V.V.; Frenkel, D.; Debenedetti, P.G.; Sastry, S. Thermodynamics and kinetics of crystallization in deeply supercooled Stillinger–Weber silicon. J. Chem. Phys. 2021, 155, 194502. [Google Scholar] [CrossRef]
  30. Song, H.; Sun, Y.; Zhang, F.; Wang, C.-Z.; Ho, K.-M.; Mendelev, M. Nucleation of stoichiometric compounds from liquid: Role of the kinetic factor. Phys. Rev. Mater. 2018, 2, 023401. [Google Scholar] [CrossRef]
  31. Saika-Voivod, I.; Romano, F.; Sciortino, F. Nucleation barriers in tetrahedral liquids spanning glassy and crystallizing regimes. J. Chem. Phys. 2011, 135, 124506. [Google Scholar] [CrossRef]
  32. Braun, O.; Manini, N. Dependence of boundary lubrication on the misfit angle between the sliding surfaces. Phys. Rev. E. 2011, 83, 021601. [Google Scholar] [CrossRef]
  33. Lutsko, J.F. Recent developments in classical density functional theory. Adv. Chem. Phys. 2010, 144, 1. [Google Scholar]
  34. Lutsko, J.F. How crystals form: A theory of nucleation pathways. Sci. Adv. 2019, 5, eaav7399. [Google Scholar] [CrossRef]
  35. Hu, T.; Wang, H.; Gomez, H. Direct van der Waals simulation (DVS) of phase-transforming fluids. Sci. Adv. 2023, 9, eadg3007. [Google Scholar] [CrossRef]
  36. Gallo, M.; Magaletti, F.; Georgoulas, A.; Marengo, M.; De Coninck, J.; Casciola, C.M. A nanoscale view of the origin of boiling and its dynamics. Nat. Commun. 2023, 14, 6428. [Google Scholar] [CrossRef]
  37. Wu, W.; Montiel, D.; Guyer, J.E.; Voorhees, P.W.; Warren, J.A.; Wheeler, D.; Gránásy, L.; Pusztai, T.; Heinonen, O.G. Phase field benchmark problems for nucleation. Comput. Mater. Sci. 2021, 193, 110371. [Google Scholar] [CrossRef]
Figure 1. (a) Configuration of the liquid film after 5 ns equilibrium run with the spring being held; (b) solidification begins with the nucleation of a crystal bridge in the central region; and (c) the final configuration of the solidified liquid film. Atoms in FCC, HCP, and other amorphous structures are in blue, red, and cyan, respectively. The color scheme is consistent throughout this work.
Lubricants 12 00420 g001
Figure 2. (a) Four typical examples of growth curve of the largest clusters. The first time at which a nucleating cluster reaches the size n = 400 (first-passage time) for each MD realization is also shown. (b) The resulting mean first-passage time (MFPT) based on n = 150 MD simulations and its corresponding fit using Equation (1).
Lubricants 12 00420 g002
Figure 3. Time development of the total number N of clusters larger than threshold size n t = 15, 30, 60, and 120. Solid lines are straight line fits to obtain the nucleation rate via Equation (3). The data were accumulated from 150 independent simulations.
Lubricants 12 00420 g003
Figure 4. Survival probability (SP) P(t) and the corresponding fit to Equation (5) when n t = 60.
Lubricants 12 00420 g004
Figure 5. (a) Steady-state probability distribution P s t ( n ) of cluster sizes n. (b) MFPT τ(n) as a function of the cluster size n and its fitting. (c) Kinetic reconstruction of the free energy of cluster formation obtained from the MD simulations using Equations (6) and (7).
Lubricants 12 00420 g005
Table 1. The relevant parameters of nucleation kinetics obtained by fitting MFPT to Equation (2).
τ J   ( p s ) Z n * J   ( 10 27 c m 3 s 1 )
3763.10.02576302.87
Table 2. The average onset time τ d o m and nucleation rate for different predefined threshold size n t .
n t 3045607590
τ d o m 2246 ± 1133040 ± 1483540 ± 1713638 ± 1723661 ± 172
J   ( 10 27 c m 3 s 1 ) 5.954.403.773.683.65
Table 3. The nucleation rate calculated via the YM method for various threshold sizes.
n t 153060120
J   ( 10 27 c m 3 s 1 ) 4.044.044.074.08
Table 4. Nucleation rates J obtained via four different methods at n *   = 30 and n t   = 60.
MFPTDOMYMSP
J   ( 10 27   c m 3 s 1 ) 2.873.774.075.71
Table 5. Evaluation of the strengths and weaknesses of the four distinct methods.
MFPTDOMYMSP
Need a predefined threshold size NYYY
Provide a complete set of information of nucleationYNNN
Reconstruct the free energy landscapeYNNN
Large system with low free energy barrier High cost Best
System with a very low free energy barrier NNNN
Disclaimer/Publisher’s Note: The statements, opinions and data contained in all publications are solely those of the individual author(s) and contributor(s) and not of MDPI and/or the editor(s). MDPI and/or the editor(s) disclaim responsibility for any injury to people or property resulting from any ideas, methods, instructions or products referred to in the content.

