Article

In Situ Observation of Hyaluronan Molecular Weight Effectiveness within Articular Cartilage Lubrication

1
Faculty of Mechanical Engineering, Brno University of Technology, Technická 2896/2, 616 69 Brno, Czech Republic
2
Footwear Research Centre, University Institute, Tomas Bata University in Zlin, Nad Ovčírnou IV 3685, 760 01 Zlín, Czech Republic
3
Contipro a.s., Dolní Dobrouč 401, 561 02 Dolní Dobrouč, Czech Republic
4
Biocev, First Faculty of Medicine, Charles University, Průmyslová 595, 252 50 Vestec, Czech Republic
*
Authors to whom correspondence should be addressed.
Lubricants 2023, 11(1), 12; https://doi.org/10.3390/lubricants11010012
Submission received: 11 November 2022 / Revised: 14 December 2022 / Accepted: 24 December 2022 / Published: 30 December 2022
(This article belongs to the Special Issue Synovial Lubricated Joints—Devices and Mechanical Behavior)

Abstract

:
Degradation of the articular cartilage (AC) structure due to osteoarthritis significantly influences its friction and lubrication mechanisms. Injection with exogenous hyaluronic acid (HA) is one of the ways to slow down the progress of these changes. The present paper aims to determine the effect of HA on the friction and lubrication processes of the synovial joint model. The main emphasis is placed on the effect of HA molecular weight (MW) on the coefficient of friction (COF) and the interactions between HA and other constituents of synovial fluid (SF). Frictional measurements between the AC surface and the glass were performed with simultaneous in situ observation of the contact zone by fluorescence microscopy. Using this methodology, a decrease in AC COF with an increase in the fluorescence intensity emitted from contact with HA was observed, while the phenomenon was found to be MW-dependent. These findings demonstrate that high-MW HA is more effective within a resumption of healthy AC lubrication due to a better adhesion to the AC surface.

Graphical Abstract

1. Introduction

Healthy articular cartilage (AC) is a self-lubricating system which plays an important role in the life-time longevity of synovial joints. Under physiological conditions, surprisingly low values of the coefficient of friction (COF), as low as 10−3, at relatively high pressures were reported [1,2]. These excellent tribological properties are commonly attributed to adaptive multimode lubrication [3]. Due to this complex lubrication regime, AC superior lubricity is controlled by interstitial fluid pressurization [1,4] and by a boundary lubricating layer on the AC surface [5]. These boundary lubricating layers are mainly composed of a combination of hyaluronic acid (HA) [6,7], lubricin (PRG4) [8,9], phospholipids [10,11] and proteins [12].
Osteoarthritis (OA) is one of the most rapidly rising diseases among elderly people in developed countries. Lancet’s research [13] revealed that more than 303 million people in the world were diagnosed with osteoarthritis between 1990 and 2017. The OA joint exhibits a worn AC surface and, as a consequence, increased friction due to the breakdown in lubrication mechanism [14]. The composition of synovial fluid (SF) is changing [15], plus SF is diluted by an inflammatory effusion. Due to this, the production of HA by synoviocytes is reduced [16]. On the other hand, HA degradation is promoted by hyaluronidases [17] and reactive oxygen species [18]. Consequently, the concentration and molecular weight (MW) of HA in OA SF are significantly lower [19]. Since HA is the main constituent of SF that affects its rheological properties, the viscosity and viscoelastic properties of SF are aggravated [20].
To improve the rheological properties of the OA SF and restore lubrication mechanisms within OA AC fibrous structure, SF can be doped with endogenous HA. Despite the wide application of this treatment method, also known as viscosupplementation, its positive effects compared to the placebo are still the subject of debate [21,22,23]. The shear rate in the human joint can vary between 0.01 s−1 and 105 s−1 [24]. Therefore, a significant increase in SF viscosity by endogenous HA at such high shear rates, due to its shear-thinning behavior, does not seem to be the true mechanism of action. Because of that, the clarification of the HA role during the formation of a supramolecular boundary layer on the AC surface seems substantial for redeeming hydration lubrication within OA AC.
HA, due to molecular entanglement or due to the hydrophobic/hydrophilic nature of the molecules, tends to bind to PRG4 on the AC surface [9,25] to form a highly viscous layer. However, it seems as though the HA itself does not support the extremely low friction of AC [26]. The formation of a HA layer seems to be a basis for an interaction with phospholipids to form a complex structure [27,28] that exposes highly hydrated phosphocholine head groups [29]. During the mutual movement of AC surfaces, hydrophilic headgroups of phospholipids exchange water molecules by diffusion. Due to this lubrication mechanism, the COF within the AC ranges in the thousands. The performance of HA within AC friction is MW-dependent. Kwiecinski et al. [30] reported an approximately linear dependence between HA MW and COF for simple HA solutions. Surprisingly, this effect was not observed for HA+PRG4 solutions. Liu et al. [26] reported a lower COF and a more stable lubricating film for high-MW HA than for low-MW HA. Shorter chains are weakly attached to the AC surface emulating layer. As a consequence, HA with the lubricating phospholipid layer is more easily removed by shear during sliding.
Hydration lubrication seems to be essential for AC homeostasis. Despite AC degradation due osteoarthritis, residuals of hydration lubrication were observed also for phospholipids extracted from OA SF [31]. However, higher friction was reported as a result of a hemifusion of exposed phospholipid bilayers under physiological contact pressures. Slip plane shift from hydrophobic-tails/hydrophobic-tails to hydrophobic-tails/AC surfaces is connected with a higher dissipation energy caused by a braking of van de Waals bonds between molecules. Therefore, the prevention of hemifusion and the consequent shift of the slip plane could be beneficial for AC lubrication [32]. HA should enable the formation of phospholipid multilayers on the AC surface [33] and inhibit their degradation [34].
In this study, our objective was to investigate the effect of admixed HA on the COF in the cartilage-on-glass contact lubricated by artificial OA SF. To determine the mutual interactions between the SF constituents and directly observe their role within the formation of the AC boundary lubricating layer, fluorescence microscopy was utilized for the in situ observation of contact during the measurements. The main emphasis was placed on the role of HA MW. Therefore, three viscosupplement-simulating HA solutions with different MW were individually mixed with OA SF. Based on the literature, we know that interaction between HA and phospholipids plays an important role within AC lubrication. Apart from that, the interaction between HA and other SF may also play an important role within redeeming AC lubrication. According to Murakami et al. [35] or Yarimitsu et al. [36], positively charged molecules of protein γ-globulin may interact with negatively charged molecules of HA to create complex structures which contribute to AC friction. Therefore, we also focused on the effect of HA MW on the formation of a protein boundary layer on the AC surface.

2. Materials and Methods

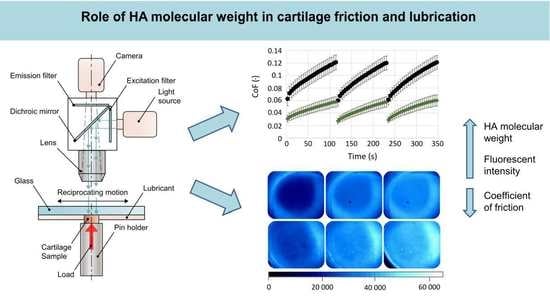
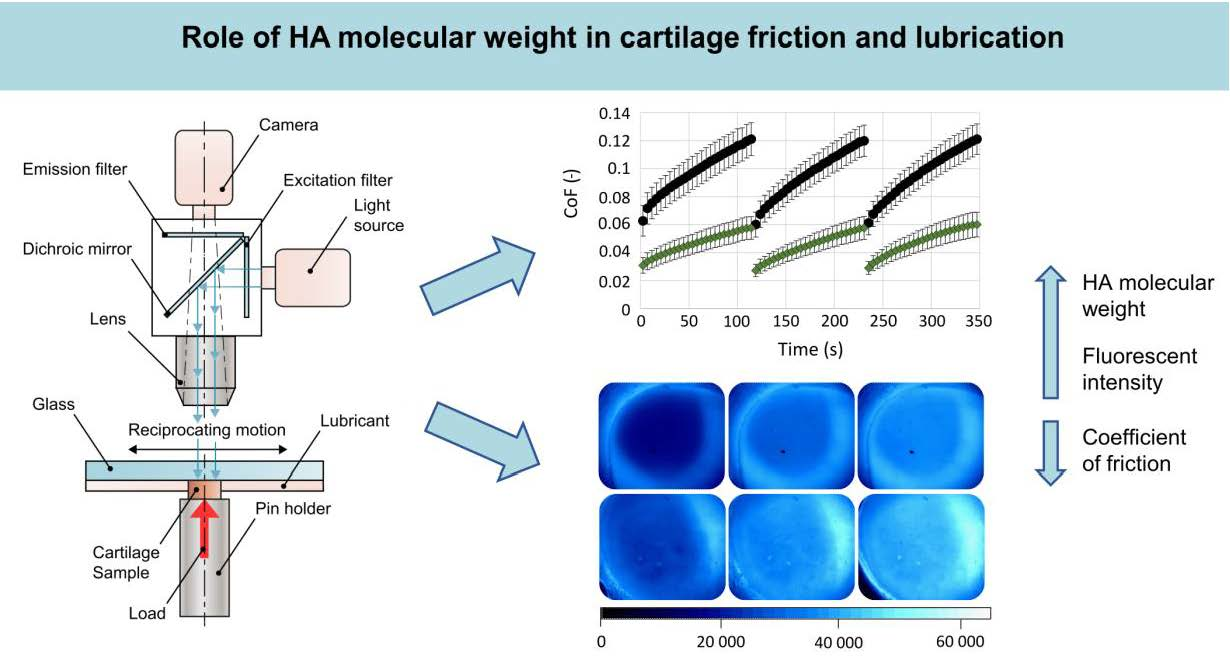
2.1. Friction Apparature

Measurements were performed using a custom-built reciprocating simulator, which was described in detail in a study by Čípek et al. [37]. The main benefit of this device is the simultaneous measurement of friction forces within the contact and in situ observation of the contact by fluorescence microscopy. Sliding tests were conducted in a pin-on-plate configuration, while COF and an intensity of the light emitted from the contact as a function of the time were investigated. The contact pair consisted of a movable glass plate and a stationary AC specimen which was mounted in a loading mechanism of the tribometer under the glass plate. The scheme of the whole friction apparatus and fluorescence microscope is shown in Figure 1. The AC sample was loaded with a constant load of 10 N against the glass plate, while the glass plate was undergoing a reciprocating sliding motion with a constant sliding speed of 10 mm/s and the stroke length was set to 20 mm. The contact pair was fully flooded with SF or a mixture of SF and HA, while the contact was heated to 37 °C via heating cartridges mounted in a steel chamber with test fluid. The loading and frictional forces were monitored by two single-point load cells which were mounted on the loading mechanism of the tribometer.
Each experiment, i.e., the measurement with one AC sample and one type of lubricant, consisted of three loaded phases which were separated by two unloaded phases (Figure 1). During the loaded phases, which lasted 120 s, the AC was loaded against the glass plate and the glass plate was performing a reciprocating sliding motion. Therefore, the traveled sliding distance during one loaded phase is approximately 1100 mm. To investigate the effect of AC rehydration on friction and lubrication, AC samples were unloaded but immersed in the tested lubricant for approximately 300 s in between loaded phases. In addition to rehydration, this relatively long time was also necessary to download the data from the camera which recorded the course of the measurement. To ensure the relevance of the results, each experiment (3 loaded phases) with one type of lubricant was repeated 5 times with a fresh AC sample and fresh lubricant.
The optical method based on the principle of fluorescence microscopy was utilized for in situ observation of the contact area. For this purpose, an optical module with a fluorescence microscope was situated above the contact. The principle of fluorescence phenomena consists of three stages. Firstly, photons excited by the light source are absorbed by the fluorescent dye contained in the tested lubricant. Consequently, partial energy dissipation occurs to increase the fluorescence emission. Due to this energy dissipation, emitted photons exhibit a lower energy and the emitted radiation has a wavelength longer than excited radiation. Due to this shift, excitation and emission can be separated and the fluorescence yield can be determined.
In our case, contact was observed using a light-emitting diode. A fluorescein isothiocyanate (FITC) or tetramethyl rhodamine (TRITC) filter was placed behind the light-emitting diode to achieve the required wavelength of emitted and excited light. The excitation wavelengths are 490 nm for the FITC filter and 557 nm for the TRITC filter. Emission wavelengths are 525 nm and 576 nm, respectively. Data of the in situ observation were recorded with a high-speed complementary metal-oxide semiconductor (CMOS) camera Andor Neo 5.5 (Andor, Belfast, UK).

2.2. Lubricants and Samples

The contact was lubricated with a model SF which was mixed, during the later stages of the measurements, in a 1:1 ratio with different MW HA solutions. The exact composition of the model SF was based on the extensive analysis of SFs obtained from various groups of orthopedic patients by Galandáková et al. [15]. On the basis of these findings, a model SF whose composition should correspond to the SF of patients with osteoarthritis was designed. The exact composition was as follows: albumin = 24.9 mg/mL, γ-globulin = 6.1 mg/mL, HA = 1.49 mg/mL, phospholipids = 0.34 mg/mL. Phosphate-buffered saline (PBS) was used as a basic solution in which the individual components were dissolved. The following products were used for the preparation: bovine serum albumin (powder, ≥96%; A2153, Sigma-Aldrich, St. Louis, MO, USA), γ-globulin from bovine blood (powder, ≥99%; G5009, Sigma-Aldrich, St. Louis, MO, USA), sodium hyaluronate HySilk (powder, quality class—cosmetic; molecular weight = 820–1020 kDa, Contipro, Dolní Dobrouč, Czech Republic) and L-α-phosphatidylcholine (powder, Type XVI-E, lyophilized powder; ≥99%; vesicles form; P3556, Sigma-Aldrich, St-Louis, MO, USA).
The main focus of this study was the role of the MW of HA which is added to the OA synovial joint during viscosupplementation. Therefore, OA SF was mixed with three different HA solutions which contained HA with a MW of 500 kDa (HA500), 1000 kDa (HA1000) or 1600 kDa (HA1600). In all three cases, the concentration of the HA solution was the same: 20 mg/mL. The concentration and MW of HA was based on commercial viscosupplements which were analyzed in our previous study [38]. Solutions were prepared from HA powder (Contipro, Dolní Dobrouč, Czech Republic) by the dissolution of a required amount of powder in PBS.
When using fluorescence microscopy, it is possible to focus on the role of the individual SF constituent. To do so, the selected component (albumin, γ-globulin, HA) had to be labeled with a fluorescent dye. Albumin was doped with rhodamine-B-isothiocyanate (283,924, Sigma-Aldrich, St. Louis, MO, USA) and γ-globulin or HA was doped with fluorescein-isothiocyanate (F7250, Sigma-Aldrich, St. Louis, MO, USA). In our case, the fluorescence microscope is able to observe only one specific constituent during measurement. Therefore, experiments with the same lubricant were repeated multiple times, while one of the previously mentioned components was observed. In the case of clear SF, only albumin and γ-globulin were analyzed. For mixtures of SF and HA solutions, both proteins and admixed HA were labeled and analyzed. For better illustration, the overview of tested lubricants and marked components is specified in detail in Table 1.
Intact AC specimens with underlying subchondral bone were removed from the bovine femur, tibia or patella. Whole bovine stifle joints with surrounding tissues were received from a local slaughterhouse on the day of slaughter. Cylindrical samples with an inner diameter of 9.7 mm were extracted by a custom-made ejector. The extracted samples were visually inspected to exclude the samples with damaged AC tissue or frayed edges, whereas these circumstances could potentially influence the results of the measurements. The extracted samples were deeply frozen at −20 °C in PBS to slow down the degradation of the tissue. Prior to the measurements, frozen AC samples were removed from the freezer and thawed naturally at laboratory temperature. As a counter face to the bovine AC, optically smooth glass B270 was selected.

2.3. Data Processing and Statistical Analysis

During measurements, the AC pin was mounted in a pin holder which was connected to two single-point load cells. Based on the vales of loading and friction forces recorded by these load cells, the COF as a function of time was analyzed. All frictional measurements (one type of lubricant) were conducted five times with fresh AC sample. Moreover, we assumed that fluorescent dyes do not affect the COF values. Therefore, average values and standard errors of means (SEM) from ten or fifteen measurements were calculated and will be presented further.
From the CMOS camera data, the average fluorescence intensity emitted from contact was analyzed. Fluorescence intensity can be considered as a dimensionless film thickness since a direct relationship between fluorescence intensity and film thickness measurement for SF lubricated contact was already published by Nečas et al. [39]. However, due to an AC porous structure which is connected with lubricant penetration into deeper layers of the structure [40,41], a calibration curve cannot be obtained. Following this inconvenience, results can be analyzed only in a qualitative manner, i.e., by analyzing the trends of film thickness development and influence of SF composition. In addition to fluorescence intensity, the images recorded with the CMOS camera were processed by custom designed software, which was described in detail in a study by Čípek et al. [42]. This software, based on the principle of image segmentation, calculates the particle count and the average size of particles in the contact area. Based on these values, percentage coverage of the contact area by adsorbed proteins was analyzed. Adsorbed particles of HA were not detected. Therefore, these data are not presented. Due to repeated measurements, the data will also be presented as mean ± SEM.
A one-way analysis of variance (ANOVA) and Tukey’s post hoc test was used to compare the COF, the fluorescence intensity or the percentage cover of the contact area for various tested lubricants. In all ANOVA analyses, α was set to 0.05 and results with p < 0.05 were deemed as statistically significant. All ANOVA analyses were performed using TIBCO Statistica® 13.5.0 (TIBCO Software Inc., Palo Alto, CA, USA).

3. Results

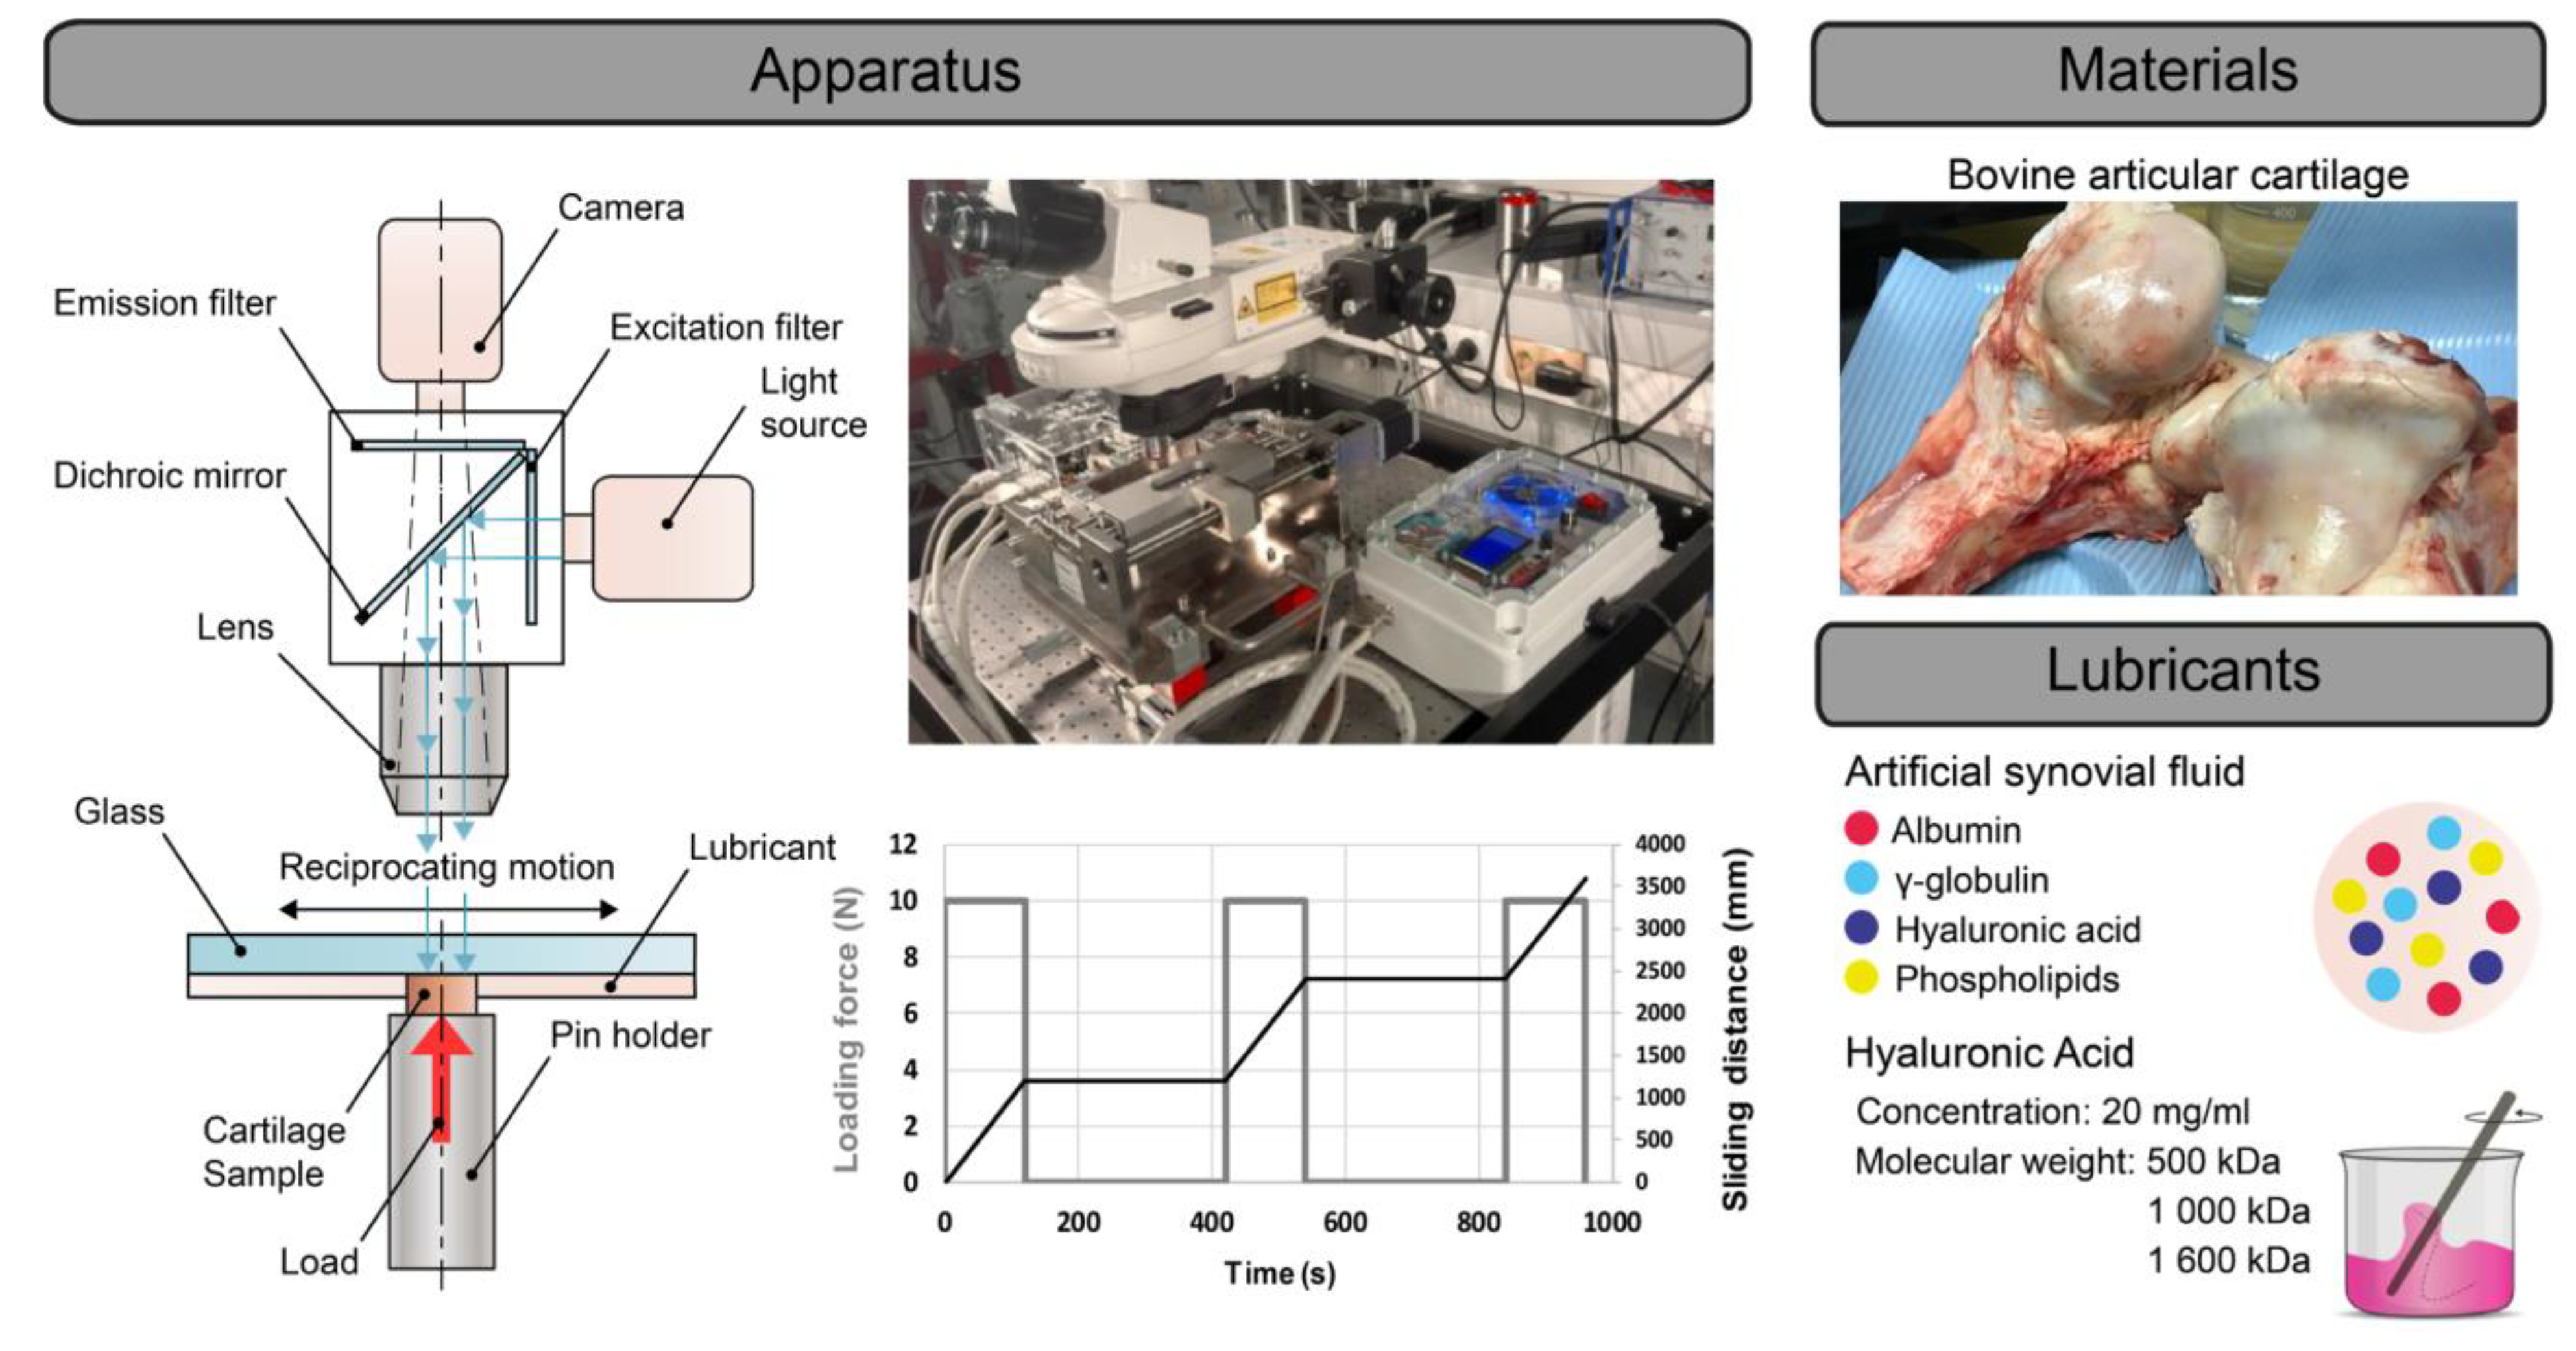
3.1. Frictional Measurements

The results of COF as a function of time for all tested lubricants are shown in Figure 2. As can be seen, independently of the tested lubricant, the COF continuously increases during all measurement sub-steps, which is mainly attributed to the biphasic structure of the AC. After 120 and 240 s, a rapid decrease in COF can be observed for all tested lubricants. This is attributed to the rehydration of the AC structure by the unloading phases mentioned above, which separated every two measurement sub-steps. The highest COF was measured for pure SF. For this lubricant, the most significant increase in COF was also observed during measurements. In the case of the last measurement sub-step, a gradual increase in COF from 0.061 ± 0.0086 (mean ± SEM) to 0.121 ± 0.0109 was observed. The COF of pure SF was reduced by adding HA in a MW-dependent manner throughout the tested range, i.e., 500–1600 kDa, and the absolute increase in COF during measurements was declining. For the case of HA500, the COF increased from 0.036 ± 0.0095 to 0.074 ± 0.0151 during the last measurement. HA1000 exhibited slightly lower COF values. During the same measurement sub-step, COF increased from 0.029 ± 0.0045 to 0.058 ± 0.0088. Compared to HA500, HA1600 exhibited half the COF values. An increase from 0.019 ± 0.0035 to 0.039 ± 0.0057 was observed during the last measurement sub-step.
For the end value of COF, ANOVA and Tukey’s post hoc test reported a statistically significant difference between the lubricants tested (p < 0.0001). The addition of all three HA samples caused a significant decrease in COF compared to pure SF (p = 0.009, p = 0.0003 and p = 0.0002). The COF values for HA500 were also significantly higher compared to HA1600 (p = 0.009). However, the differences between HA500 and HA1000 or HA1000 and HA1600 were not statistically significant (p = 0.46 and p = 0.27).

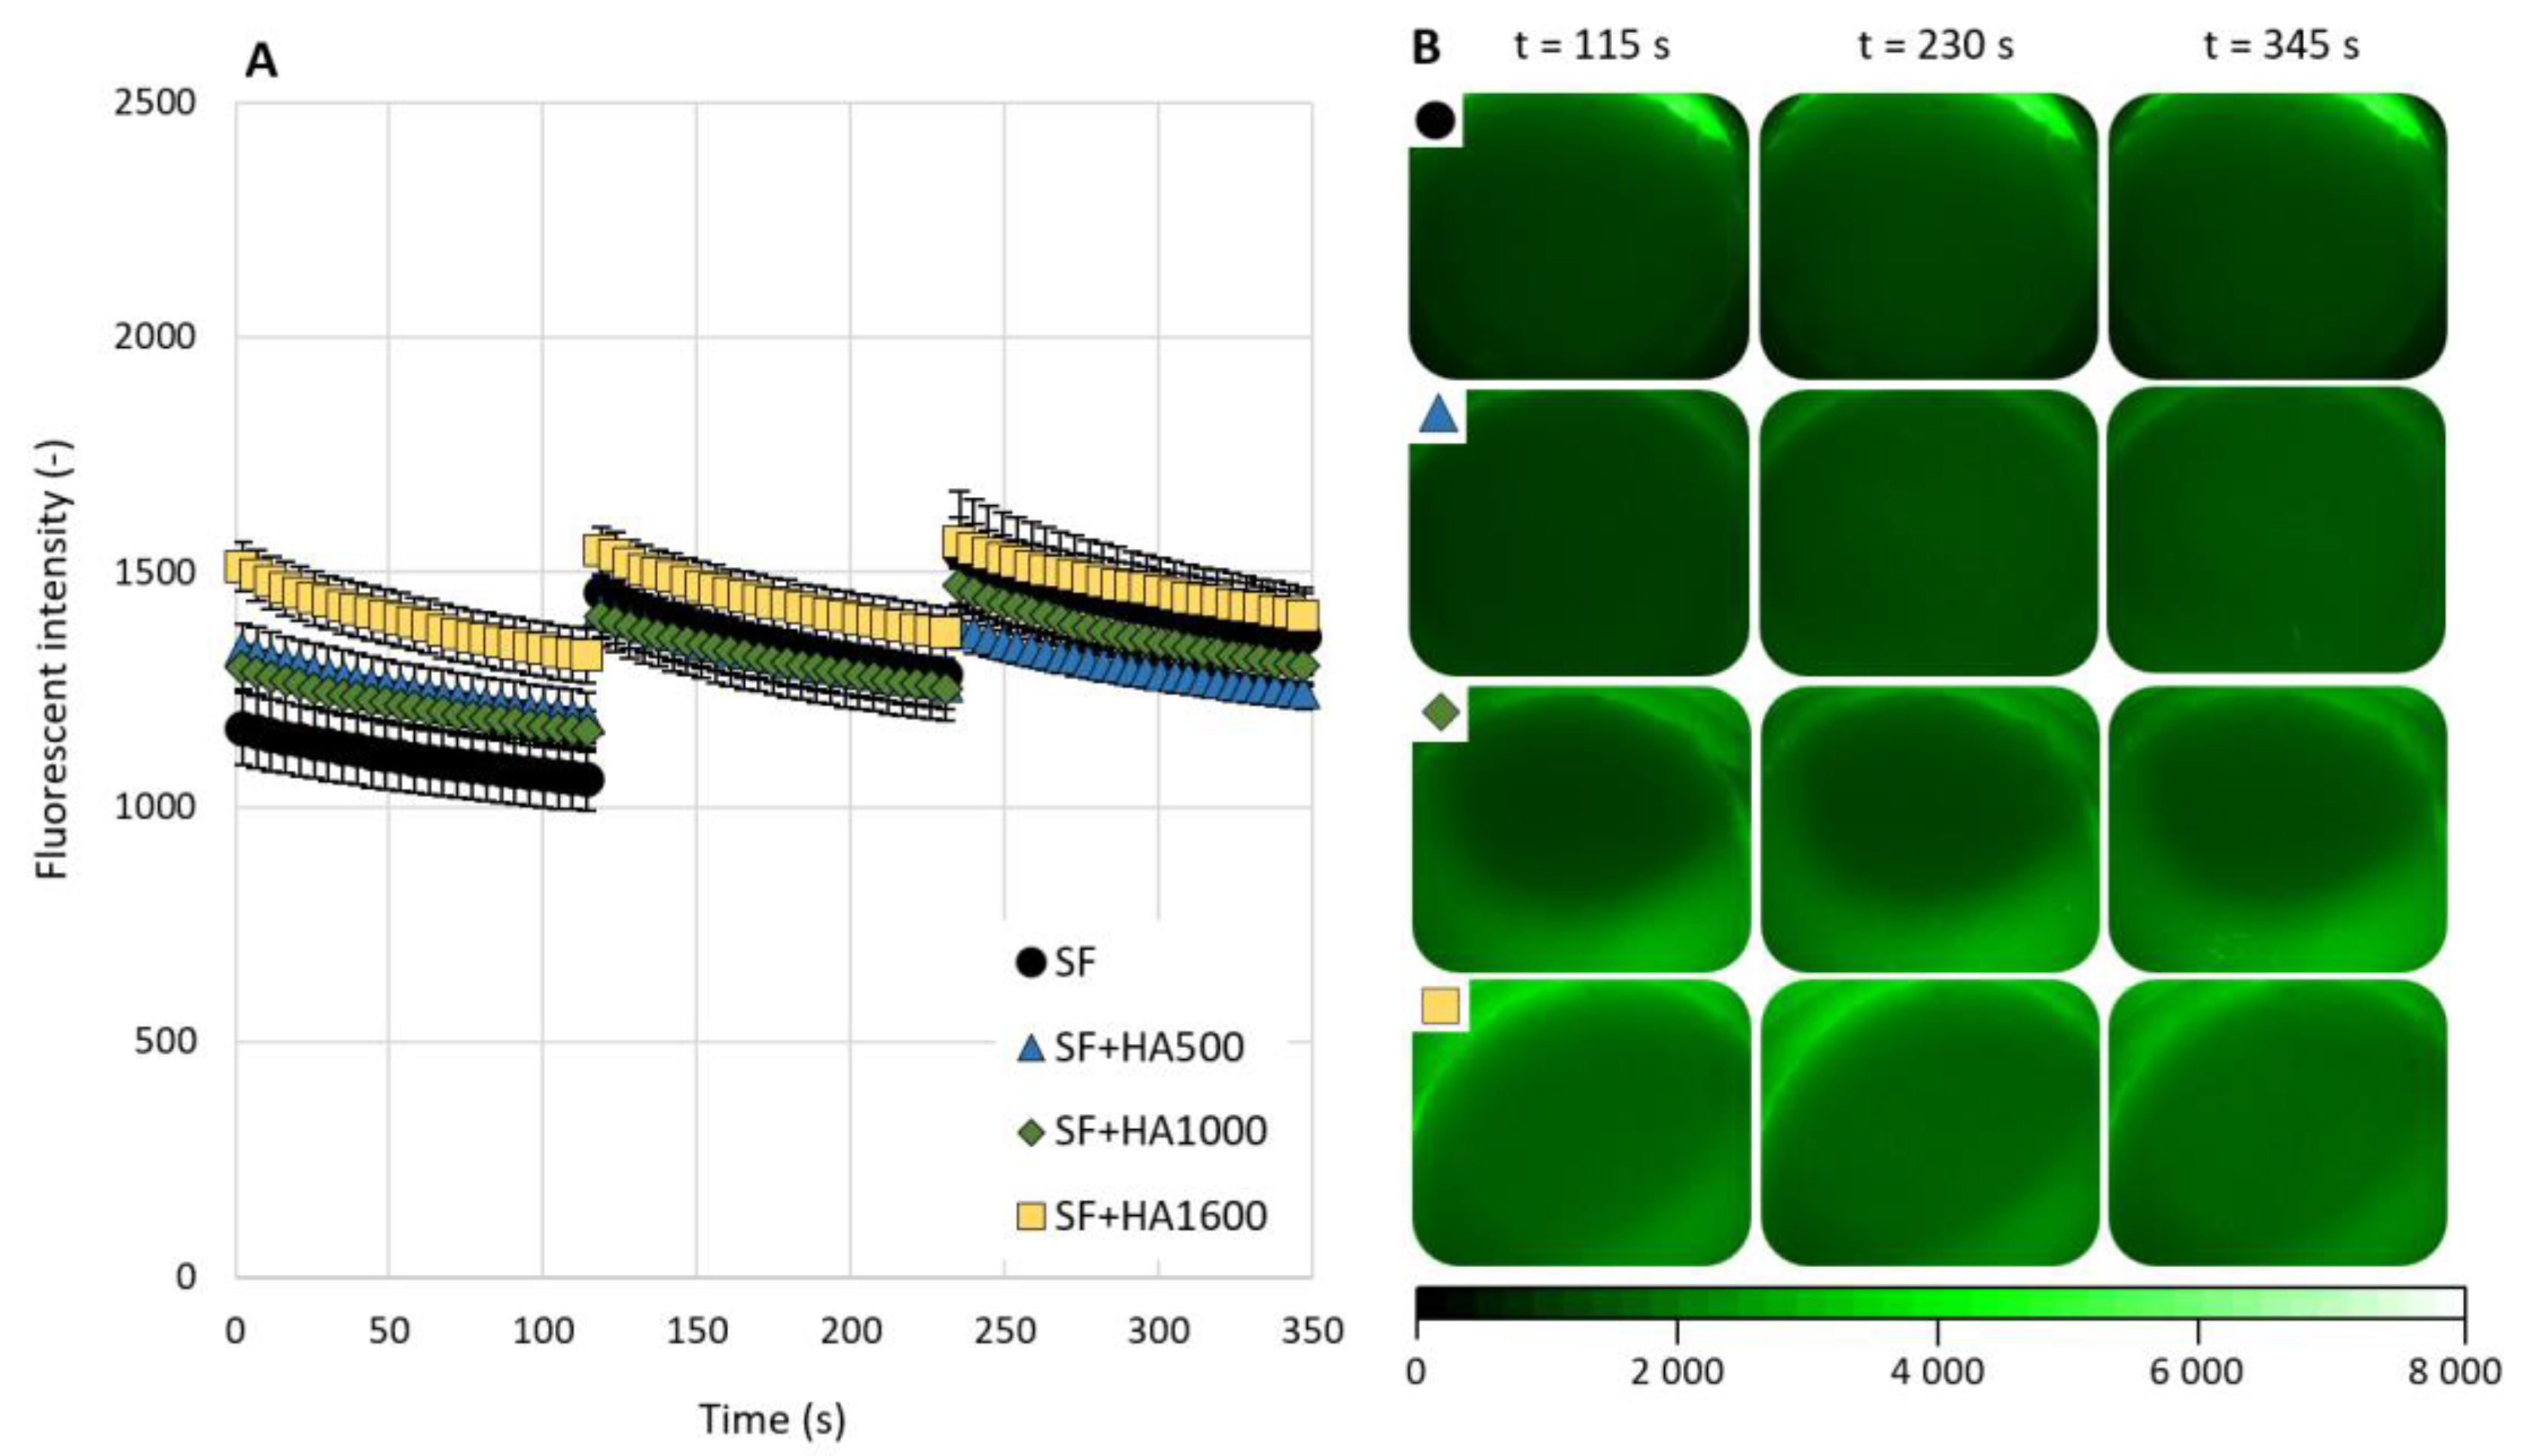
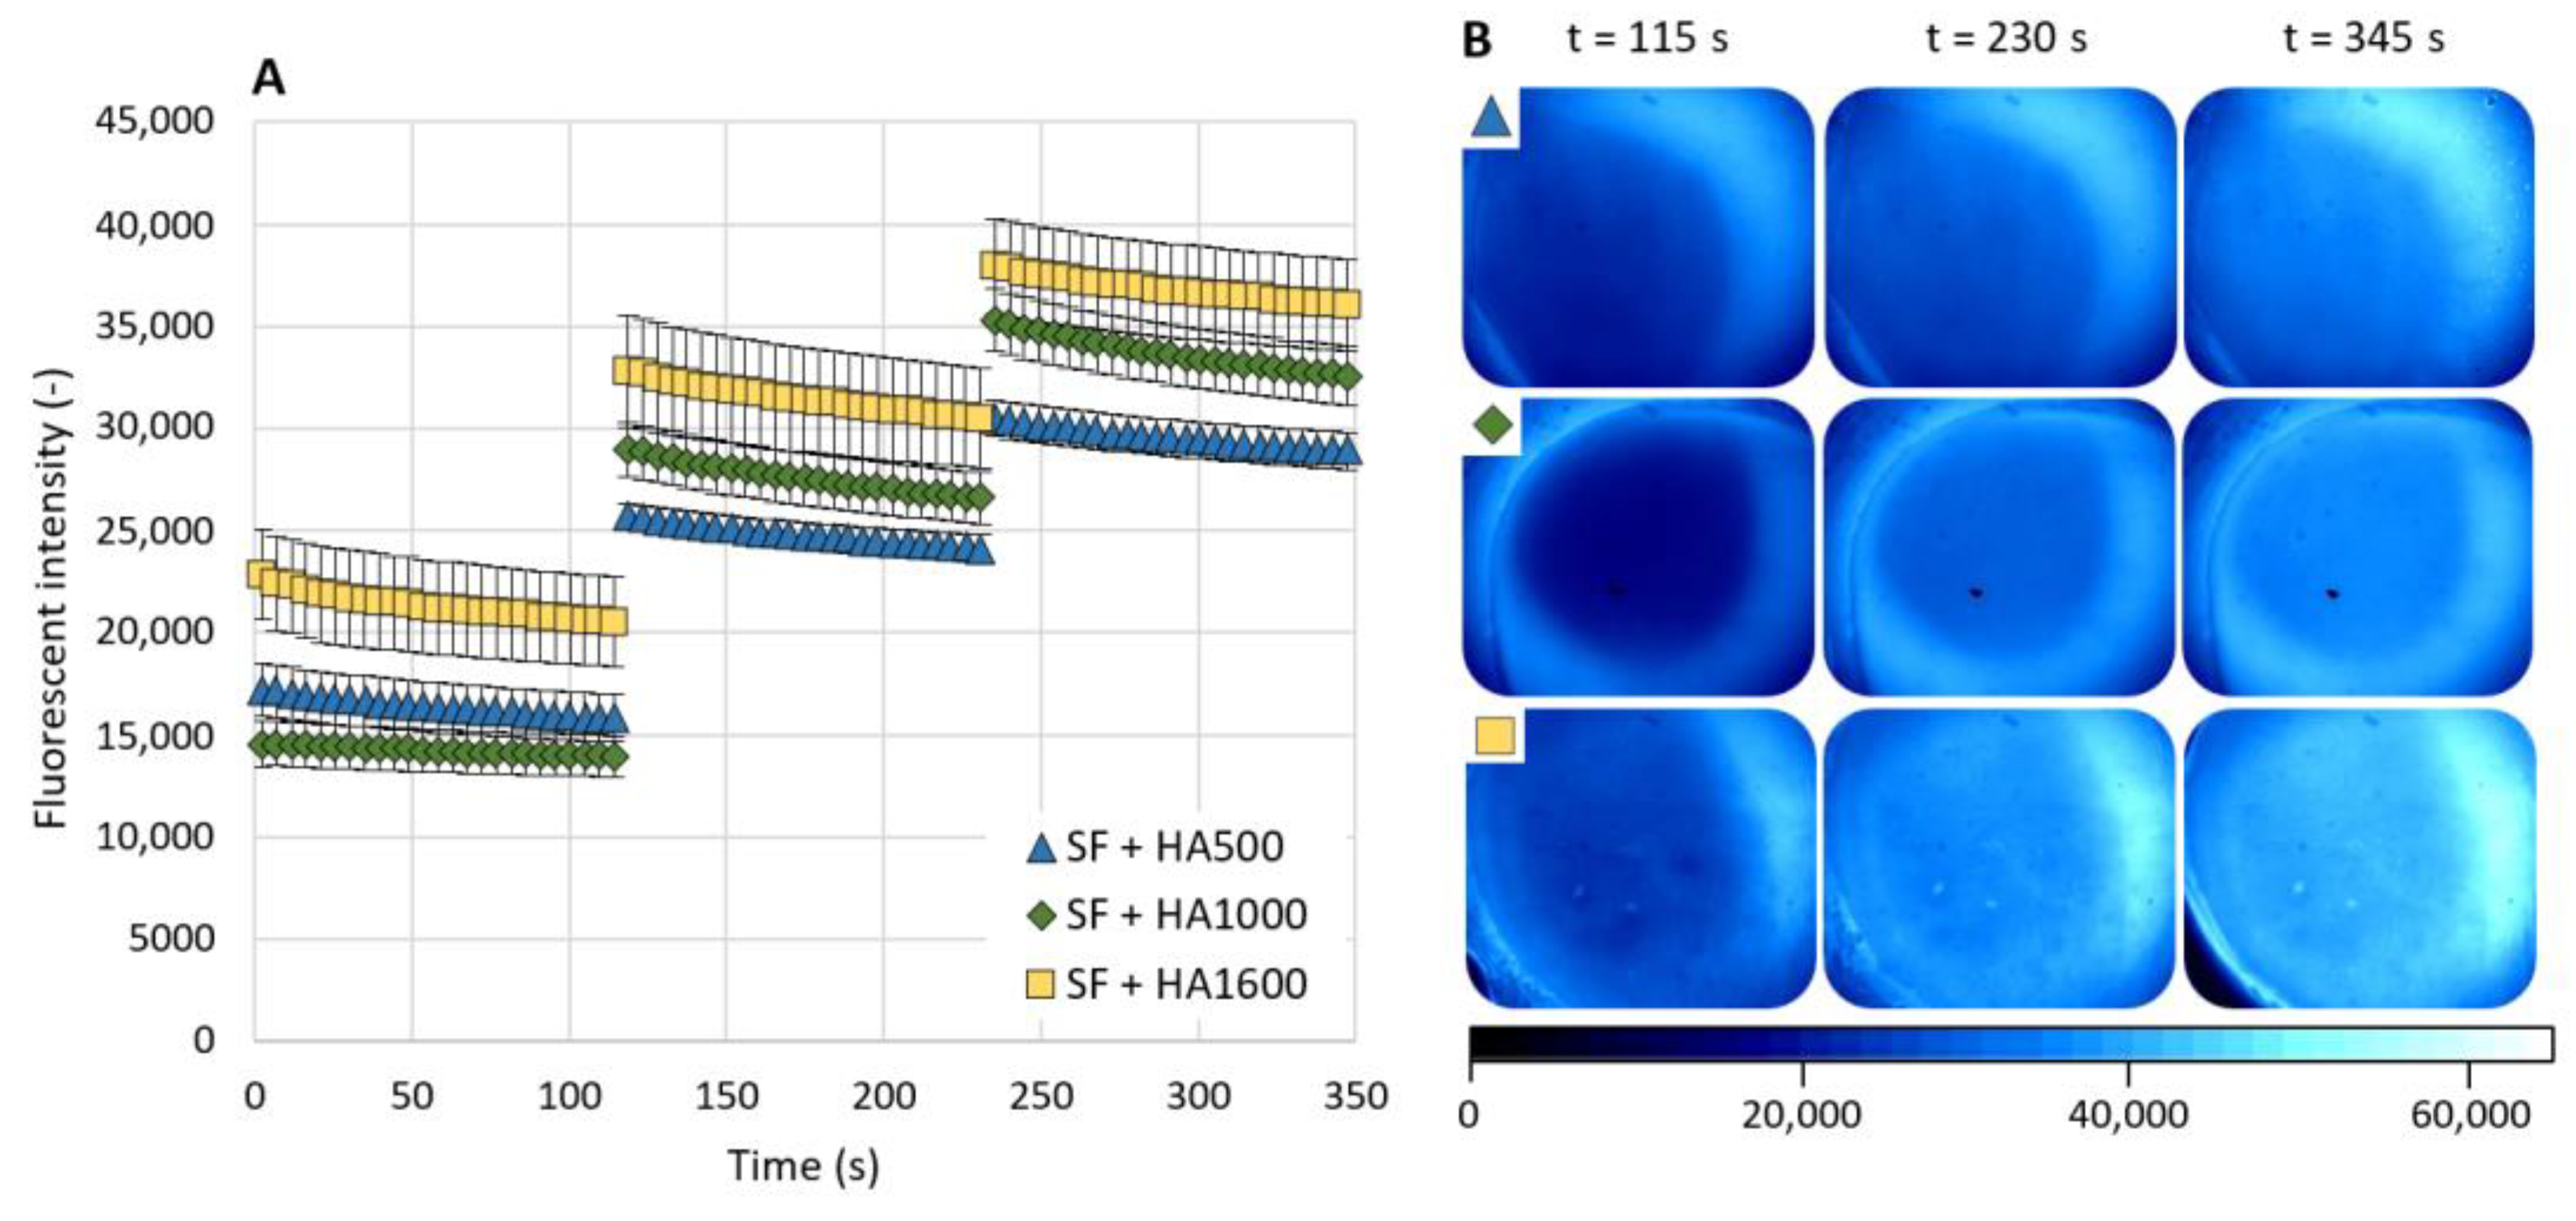
3.2. In Situ Observation of the Contact Area

Together with frictional measurements, in situ observation of the contact area by fluorescence microscopy was performed. Figure 3A summarizes the data for all four lubricants for the case when the protein albumin was fluorescently labeled. The fluorescence intensity of the emitted light as a function of a time is presented. Figure 3B shows typical images of the contact area throughout the experiments for all four lubricants. For all tested lubricants, an increase in the fluorescence intensity after rehydration can be observed, while the values of the fluorescence intensity during the measurement sub-steps are nearly constant. As in the case of frictional measurements, the highest values of fluorescence intensity were measured for clear SF. Throughout the experiment, the fluorescence intensity increased from (mean ± SEM) 10,812 ± 1134 to 20,673 ± 774. Unlike friction measurements, fluorescence intensity was not decreased by the addition of HA in a MW-dependent manner. Of the three mixtures, the highest fluorescence intensity values were obtained for a SF+HA1000 lubricant. For the remaining two lubricants, lower fluorescence intensity values were measured for the mixture of SF and HA1600. However, it should be mentioned that the fluorescence intensity of the lubricant SF+HA1000 and SF+HA1600 were quite similar during the first measurement sub-step. The fluorescence intensity values at the end of the measurement were 12,683 ± 331 (SF+HA500), 14,736 ± 666 (SF+HA1000), and 10,631 ± 1289 (SF+HA1600).
For the end value of fluorescence intensity, ANOVA reported a statistically significant difference between the lubricants tested (p < 0.0001). Tukey’s post hoc test revealed a significant decrease in fluorescence intensity after the addition of HA to the SF for all HA samples tested: p = 0.0003 for SF+HA500, p = 0.002 for SF+HA1000, and p = 0.0002 for SF+HA1600. Significant differences were also observed between SF+HA1000 and SF+HA1600 (p = 0.032). Other differences, i.e., between SF+HA500 and SF+HA1000 (p = 0.43) or between SF+HA500 and SF+HA1600 (p = 0.44), were not statistically significant.
The results of the fluorescence intensity measurements for the case of fluorescently labeled γ-globulin are shown in Figure 4A and typical images of the contact zone are shown in Figure 4B. As can be seen from the measurement results, a slight decrease in fluorescence intensity was measured during the measurement sub-steps for all the tested lubricants. For three of the four tested lubricants, an increase in fluorescence intensity was observed between the measurement sub-steps. Only for the SF+HA1600 mixture are the results of all three measurement sub-steps quite similar. In the beginning of measurements, the fluorescence intensity varies between 1510 and 1560. At the end of the measurements, the fluorescence intensity gradually decreases to a value between 1320 and 1410. This time, the highest values of fluorescence intensity were not measured for clear SF. During the first measurement sub-step, clear SF even reported the lowest fluorescence intensity values of all samples tested. The addition of HA1600 to SF resulted in an increase in fluorescence intensity. This mixture reported the highest fluorescence intensity values for all lubricants tested with labeled γ-globulin. The addition of HA500 and HA1600 to SF led to an increase in fluorescence intensity during the first measurement sub-step. However, during the second and the third measurement sub-steps, the fluorescence intensity was higher compared to the pure SF. For this set of experiments, the results of the HA mixtures were MW-dependent just for the third measurement sub-step.
In general, the results of all the tested lubricants were quite similar. ANOVA did not reveal significant differences between lubricants (p = 0.39). The result of Tukey’s post hoc test also did not reveal statistically significant differences between any two lubricants. p values ranged between 0.66 and 0.96.
The last set of measurements was conducted for a mixture of pure SF and HA solutions with various MWs while the HA was labeled with a fluorescent dye. The results of fluorescence intensity are shown in Figure 5A and representative images of the contact area are shown in Figure 5B. Since we focused on the role of admixed HA, data for pure SF are missing in this set of results. For all three tested solutions, the fluorescence intensity decreased during the measurement sub-steps and increased in between them. The results of the individual mixture clearly depended on the MW of admixed HA. The highest values of fluorescence intensity were measured for the SF+HA1600 mixture, while the lowest values of fluorescence intensity, apart from the running-in phase during the first sub-step, were measured for the SF+HA500 mixture. At the end of the measurement, the fluorescence intensity values were as follows (mean ± SEM): 28 297 ± 910 (SF+HA500), 32 564 ± 1442 (SF+HA1000) and 36 031 ± 2231 (SF+HA1600).
Although a fairly clear trend was observed in the increase in fluorescence intensity with increasing HA MW, ANOVA did not evaluate the differences between them as statistically significant (p = 0.168). Subsequently, Tukey’s post hoc also reported no statistically significant differences between SF+HA500 and SF+HA1000 (p = 0.19), SF+HA500 and SF+HA1600 (p = 0.264) or between SF+HA1000 and SF+HA1600 (p = 0.97).

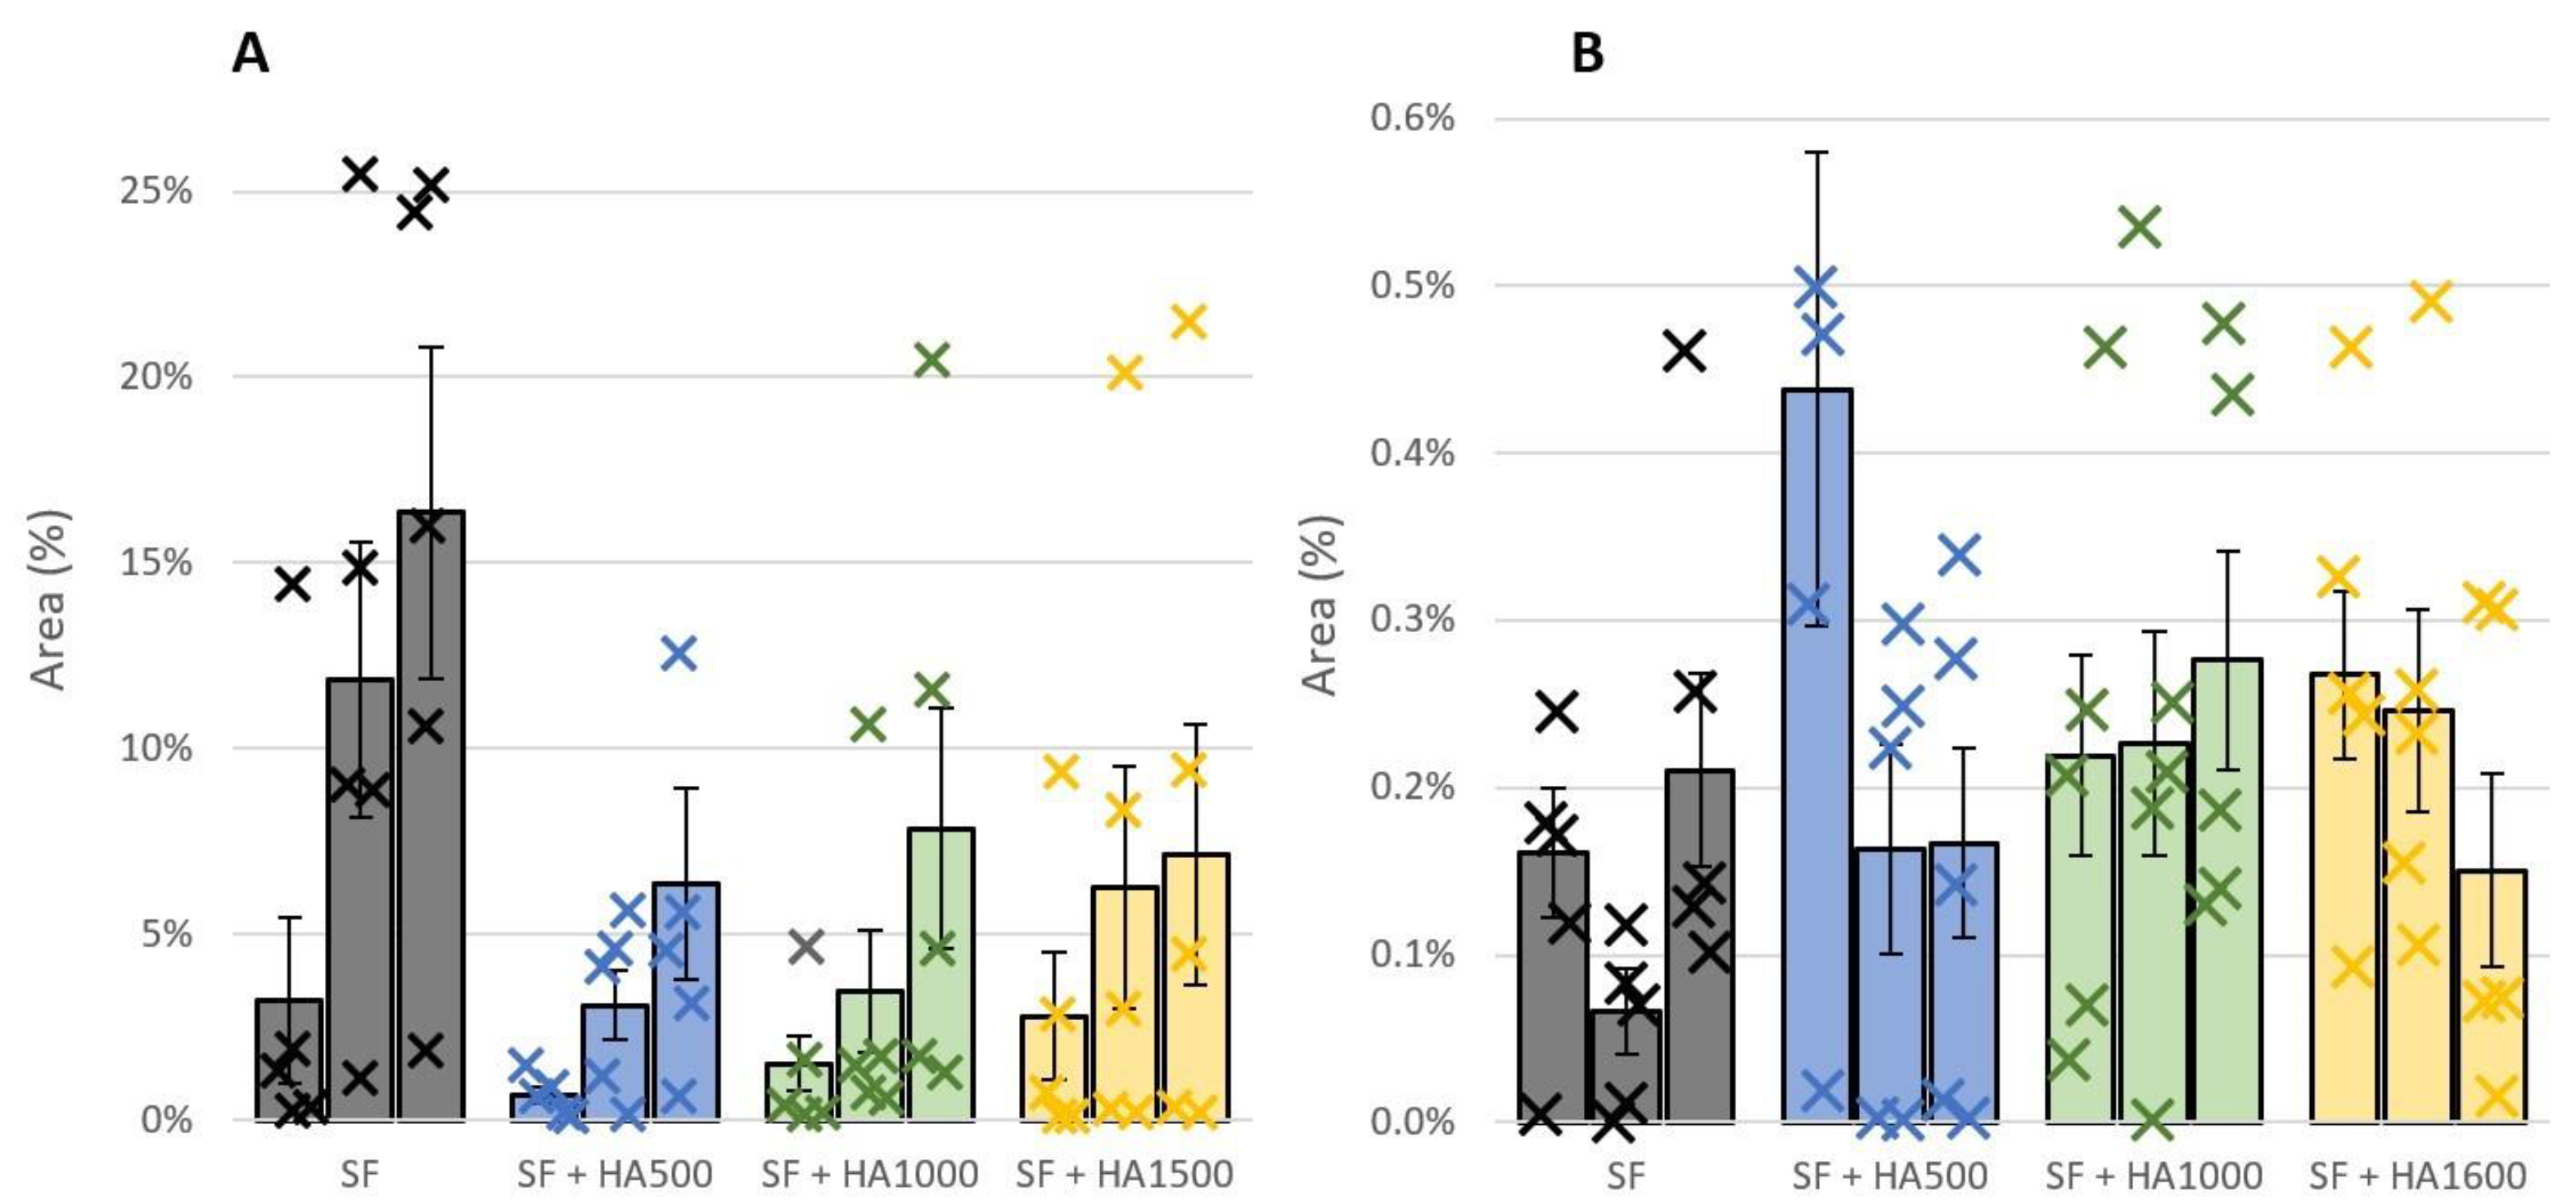
3.3. Coverage of Contact Area by Protein Clusters

Apart from the average fluorescence intensity emitted from the contact area, the percentage cover of contact area by the protein-adsorbed clusters was evaluated from camera snaps as well. To do so, previously mentioned software based on image segmentation was utilized. The percentage of contact coverage by protein albumin is shown in Figure 6A and for γ-globulin in Figure 6B. For albumin, the results of the measurements with all the tested lubricants exhibited an increasing trend during the measurements. This clearly refers to the formation of a boundary lubricating layer on the AC surface while albumin is one of its components. For clear SF, albumin covered nearly 16% of the contact area at the end of the measurements. The addition of HA to SF partially inhibited the formation of albumin clusters. For all HA solutions, the percentage coverage of the contact area was lower compared to the pure SF. In addition, the results of all three HA solutions were quite similar.
The percentage cover of contact area by albumin decreases to a value between 6.3 and 7.9%. Tukey’s post hoc test did not reveal statistical differences for end measurement values between any two HA mixtures. The p values ranged from 0.95 to 0.99. The decrease in percentage cover by HA addition for all three HA solutions was also considered statistically insignificant.
In the case of γ-globulin, overall mean values of contact area coverage are considerably lower. End values of percentage cover just between 0.15 and 0.28% were reported. This indicates a considerably lower contribution of γ-globulin to the formation of a boundary lubricating layer on the AC surface. Furthermore, no significant differences were observed between the individual lubricants (p = 0.56). Therefore, HA and HA MW do not influence the formation of γ-globulin clusters within the AC-glass contact. Only a slight increase in percentage coverage during measurement was reported for the SF+HA1000 mixture and a slight decrease for SF+HA1600.

4. Discussion

4.1. General Discussion

The present study introduces the frictional behavior and provides insight into AC lubrication by a fluorescence microscopy apparatus. The main emphasis was placed on the role of HA MW with which SF is doped during the viscosupplementation of the OA synovial joint. The results were confronted with pure OA SF, while some significant effects on AC friction and lubrication were observed.
Statistical analysis revealed a significant decrease in COF after the addition of all HA solutions to pure OA SF, as well as significant differences in the results between HA500 and HA1600. Furthermore, a simple regression analysis on the end values of the COF measurements (Figure 7A) quite clearly revealed a linear dependency between the COF and the MW of admixed HA. In all three cases, the coefficient of determination varied between 92.1 and 93.8%. A strong dependence between COF and HA MW was also reported by Kwiecinski et al. [30]; however, a linear dependency between COF and log HA MW was reported. This difference is trends may be caused by the tested lubricants. In their case, simple HA solutions of HA mixed with PRG4 were tested. However, for the HA+PRG4 mixtures, the results were not MW-dependent.
The decrease in COF by high-MW HA may be caused by two different phenomena. First, HA MW is strongly connected with the viscosity of the solution [43] and, consequently, with the viscosity of SF. One would expect that higher viscosity caused by the addition of high-MW HA into SF should lead to a more/less pronounced decrease in COF compared to low-MW HA. However, no direct dependence between HA viscosity or viscoelastic properties and COF within AC contact was reported in our previous study [43], as well as in a study by Bonnevie et al. [44]. Secondly, Liu et al. [26] reported stronger adhesion forces between the high-MW HA and the AC surface emulating layer. In the case of AC, PRG4, which is a part of the AC surface and the superficial zone [25,45], should attach HA to the AC surface [46]. Longer linear molecules of high-MW HA may make multiple contacts with PRG4 molecules. Despite the weak interactions between these two molecules, such as van der Waals forces or charge–charge interaction, the overall attachment of high-MW HA molecules to the AC surface may be relatively strong [26]. Therefore, a higher coverage of the contact and a more stable lubricating film may be formed on the AC surface by high-MW HA.
In addition to the linear dependence between COF and HA MW, a simple regression analysis also revealed an approximately linear dependence between the fluorescence intensity of light emitted from contact by labeled HA molecules and HA MW (Figure 7B). For the data before the second rehydration and at the end of the friction measurement, the coefficient of variation was 99.4 and 99.5%, respectively. In general, high-MW HA reported lower values of COF and a higher intensity of emitted light. On the basis of these results, a combination of biphasic and boundary lubrication regimes occurred in contact during the measurements. Biphasic lubrication is characterized by a gradual increase in COF during measurement sub-steps, as well as a rapid decrease in COF after rehydration caused by a saturation of the AC structure by a mixture of SF and HA [4,47]. Gradual saturation of the AC by the tested lubricant is also seen by an increase in the fluorescence intensity between the measurement sub-steps. A decrease in fluorescence intensity during the measurement sub-steps is caused by a squeeze of SF from the AC extracellular matrix under load. However, the importance of HA during the formation of the boundary lubrication layer should not be forgotten. Some results pointed out on the formation of an adsorbed boundary lubricating layer on the AC surface. The increase in HA fluorescence intensity between measurement sub-steps may also be caused by the formation of the HA gel-like layer on the AC surface. The higher intensity of high-MW HA is due to the higher adhesion forces to PRG4, while the decrease in fluorescence intensity during measurement may be caused by degradation of the boundary layer under shear load.
Results of measurements with fluorescently labeled albumin solutions revealed that the intensity of fluorescent light within contact (Figure 3) is connected with the formation of a boundary adsorbed protein layer on the AC surface (Figure 7A). Albumin tends to adsorb on hydrophilic surfaces [48] while the AC porous structure, whose polarity attracts and absorbs water solutions [49], is a suitable candidate for protein adsorption. HA, due to strong hydrophilicity, is expected to improve the albumin adsorption. However, our results showed a significant decrease in fluorescence intensity emitted by albumin, as well as a decrease in contact area coverage by this protein. The decrease in albumin adsorption may be caused by a lower total amount of proteins in the mixed solutions. Our previous results showed that a lower concentration of albumin in complex model SF leads to a lower value of COF [50], which is in coincidence with results presented in this study. Due to a much higher HA concentration in mixed solution, HA–albumin interactions may also occur in the surrounding bulk solution, preventing them to interact with HA molecules adhered to the AC surface. An adverse effect on AC friction by a reaction between HA and albumin was also reported by Murakami et al. [35]. The authors attributed this phenomenon to repulsive forces between negatively charged HA and albumin molecules.
The albumin–HA bonding mechanism is connected with the presence of locally positively charged sites and the consequent formation of hydrogen bonds [51]. Therefore, one would expect a better bonding between albumin and high-MW HA. However, albumin adsorption was not HA MW-dependent. Albumin is an ellipsoidal-shaped molecule, of 3.8 nm diameter and 15 nm length, with a molecular weight of 69 kDa [52]. HA with a MW of 500 kDa has a chain contour length of 1 250 nm [53]. Hence, it seems that even low-MW HA, due to it being a much bigger molecule compared to albumin, is able to provide the same amount of bonding between these two molecules as high-MW HA.
Unlike albumin, γ-globulin adsorption on the AC surface was generally low, even for clear SF. All three HA solutions had no significant effect on the intensity of the light emitted within contact, as well as on the amount of adhered protein clusters. According to Park et al. [6], γ-globulin is not able to improve the lubrication of a healthy AC due to an adverse reaction between γ-globulin and some other SF components or component aggregates. However, in advance OA AC, γ-globulin decreased friction in a concentration-dependent manner. Therefore, the role of γ-globulin in AC lubrication could change with the degradation of the AC superficial layer.
In our previous study [42], we also demonstrated that the adsorbed boundary layer is predominantly formed by albumin clusters, which are sparely divided by γ-globulin. HA acts as a stabilizer of the protein layer. Since the albumin adsorption results are not MW-dependent, γ-globulin binds to albumin in equal amounts and its results are very similar for all three HA solutions.

4.2. Limitations

Considering some of the limitations of the study, the glass, as a counterpart to AC, should be mentioned. Mechanical properties or surface wettability significantly differ from AC. HA interacts chemically and mechanically by entanglement with PRG4 to attach to the AC surface. However, such attachment is not possible on a glass surface. Nevertheless, an optically smooth transparent material is a necessary part for in situ observation by fluorescence microscopy. Inter alia, we mainly focused on the formation and composition of a boundary lubricating layer on the AC surface, which should be possible in this type of configuration.
The composition of artificial SF fluid should be revised. Hydration lubrication of AC is based on the interaction between phospholipid bilayers [29,47]. Therefore, data from in situ measurements with fluorescently labeled phospholipids should be a part of our future studies. Furthermore, the tested artificial SF fluid contained the phospholipid L-α-phosphatidylcholine in the form of vesicles. This is in contrast to at least nine different phospholipids extracted from OA SF in a study by Cao et al. [31]. Some of the interactions are MW-dependent [26]. Therefore, artificial SF should contain more HA fractions with different MW, as well as other important SF constituents, such as PRG4 or ROS. The fibrous structure of OA AC would definitely affect the results of frictional measurements in comparison with pristine AC. Nevertheless, extraction of dozens of samples from OA bovine or porcine joints with the same stage of OA would be a challenge.

5. Conclusions

The present paper aimed to determine the role of viscosupplementation in AC friction and lubrication. Frictional measurements in a cartilage-on-glass configuration were carried out, while in situ observation of the contact area by fluorescence microscopy was also performed. The main emphasis was placed on the role of HA molecular weight on the COF, as well as on the reactions between HA and other SF constituents, with an impact on the formation of a boundary lubricating layer on the AC surface. The main findings can be summarized as follows:
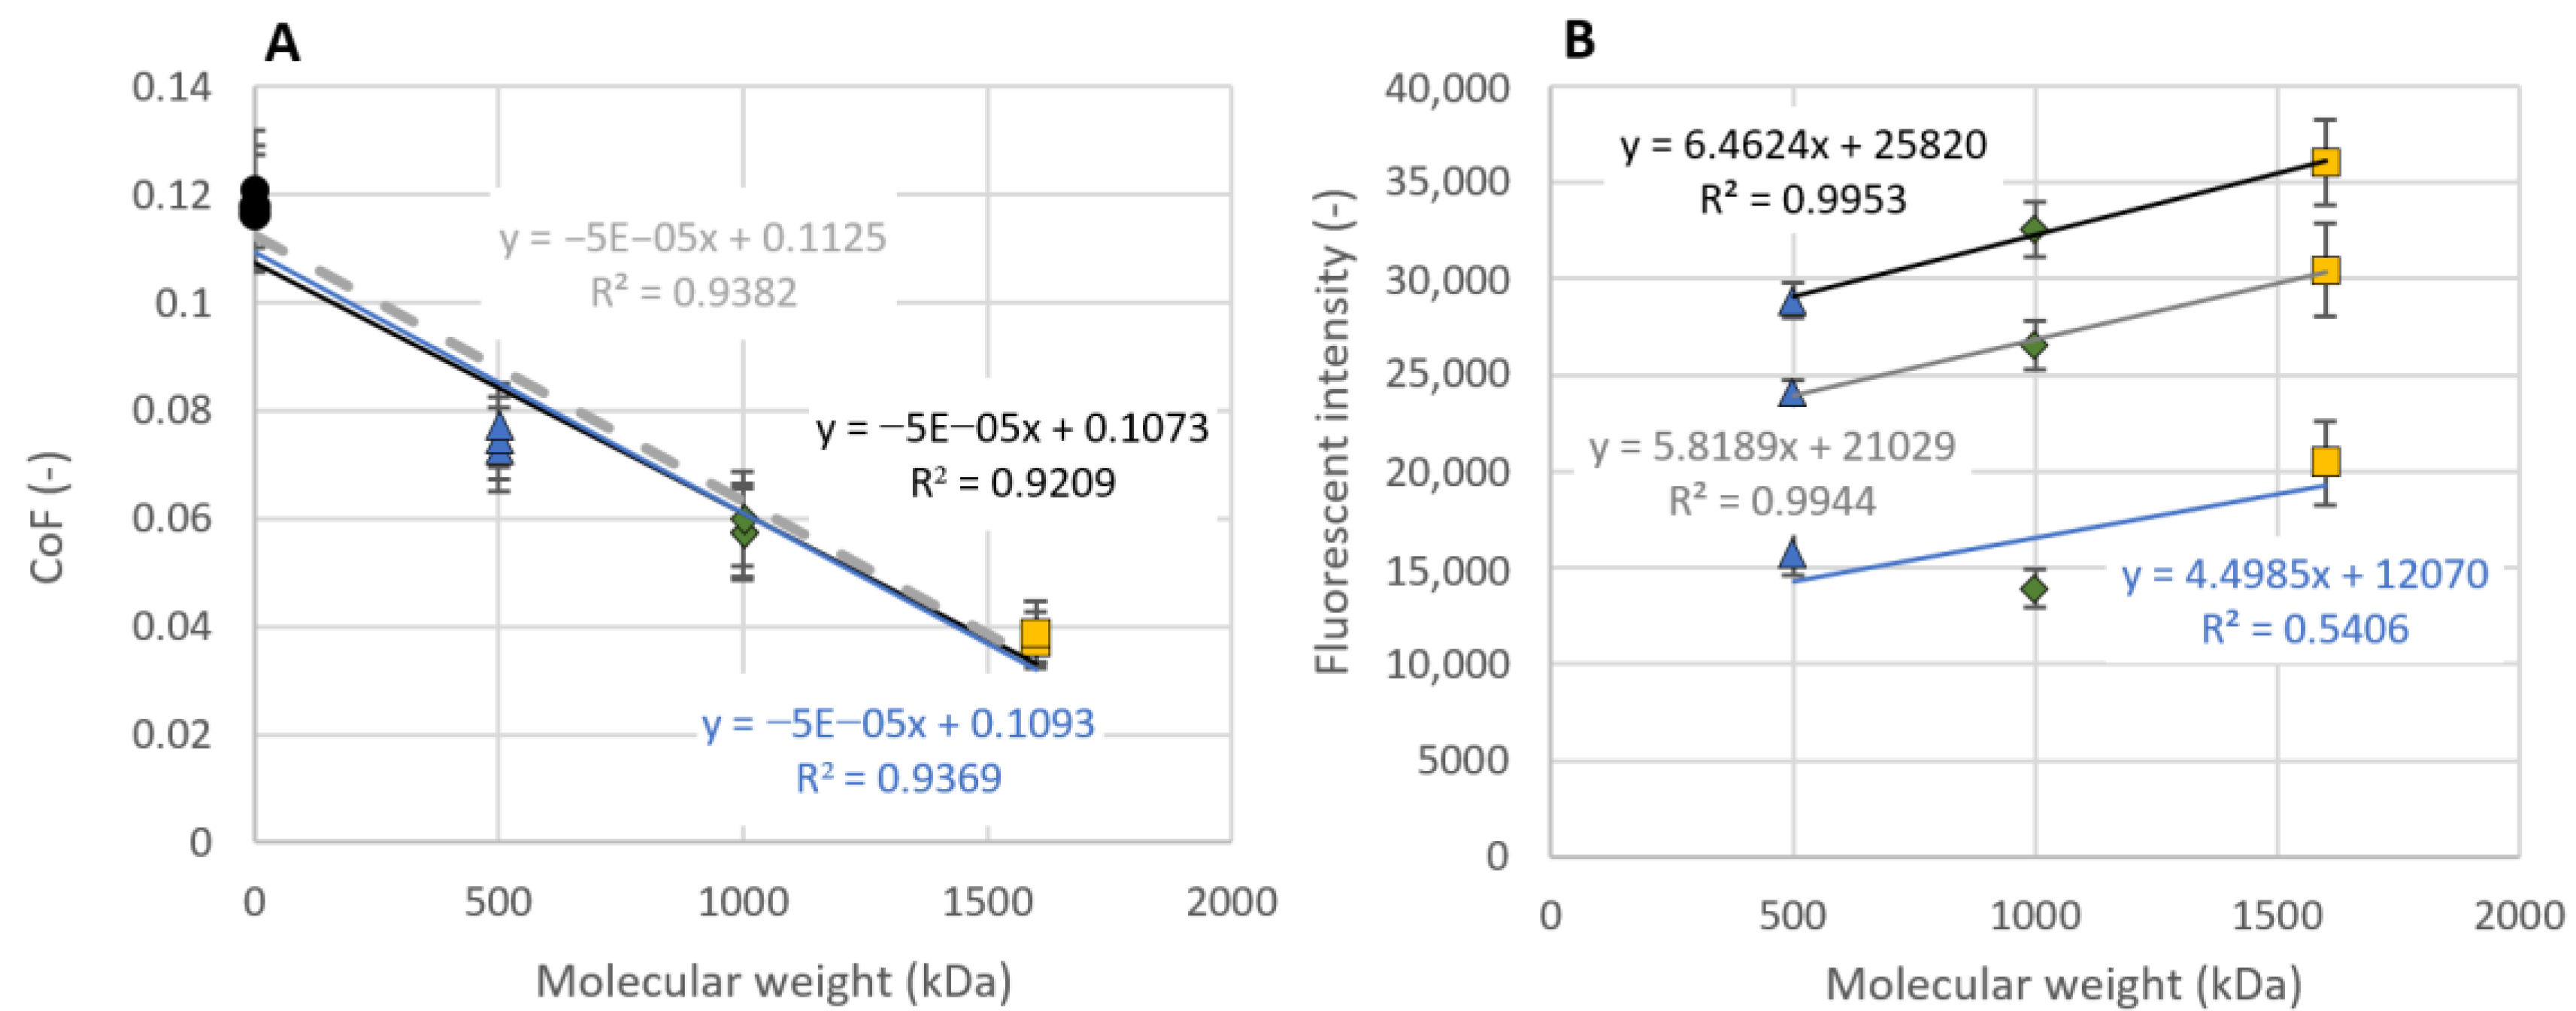
  • A statistically significant decrease in COF was observed after the addition of HA to SF. Various HA solutions also differ significantly from each other. An approximately linear dependence between HA MW and COF within cartilage-on-glass contact was reported, while the higher MW led to a lower COF.
  • In situ observation of fluorescently labeled HA revealed no adsorption, while the fluorescence intensity emitted by labeled HA was MW-dependent. High-MW HA strongly adheres to PRG4 on the AC surface to form a more robust boundary layer.
  • HA worsened the formation of the albumin boundary lubricating layer on the AC surface. However, the results were not MW-dependent.
  • γ-Globulin adsorption was relatively weak. The percentage coverage of the contact area by adsorbed protein clusters was only on the order of tenths of a percent, and none of the HA solutions affected it.

Author Contributions

Conceptualization, D.R. and M.R.; methodology, D.R. and M.R.; formal analysis, D.R., M.R. and P.Č.; investigation, D.R. and M.R.; resources, E.T. and M.V.; writing—original draft preparation, D.R.; writing—review and editing, M.R., P.Č., E.T. and M.V.; supervision, M.V.; project administration, M.V.; funding acquisition, M.V. All authors have read and agreed to the published version of the manuscript.

Funding

This research was carried out under the project “An Investigation of Synovial Fluid Viscosupplementation and its Impact on Friction and Lubrication” (grant number 20-00483S) with financial support from the Czech Science Foundation.

Data Availability Statement

Data sharing not applicable.

Conflicts of Interest

The authors declare no conflict of interest. The funders had no role in the design of the study; in the collection, analyses, or interpretation of data; in the writing of the manuscript; or in the decision to publish the results.

References

  1. Forster, H.; Fisher, J. The Influence of Loading Time and Lubricant on the Friction of Articular Cartilage. Proc. Inst. Mech. Eng. Part H J. Eng. Med. 1996, 210, 109–119. [Google Scholar] [CrossRef]
  2. Hodge, W.A.; Fijan, R.S.; Carlson, K.L.; Burgess, R.G.; Harris, W.H.; Mann, R.W. Contact pressures in the human hip joint measured in vivo. Proc. Natl. Acad. Sci. USA 1986, 83, 2879–2883. [Google Scholar] [CrossRef] [Green Version]
  3. Murakami, T. Importance of adaptive multimode lubrication mechanism in natural and artificial joints. Proc. Inst. Mech. Eng. Part J J. Eng. Tribol. 2012, 226, 827–837. [Google Scholar] [CrossRef]
  4. Ateshian, G.A. The role of interstitial fluid pressurization in articular cartilage lubrication. J. Biomech. 2009, 42, 1163–1176. [Google Scholar] [CrossRef] [Green Version]
  5. Schmidt, T.A.; Sah, R.L. Effect of synovial fluid on boundary lubrication of articular cartilage. Osteoarthr. Cartil. 2007, 15, 35–47. [Google Scholar] [CrossRef] [Green Version]
  6. Park, J.-Y.; Duong, C.-T.; Sharma, A.R.; Son, K.-M.; Thompson, M.S.; Park, S.; Chang, J.-D.; Nam, J.-S.; Park, S.; Lee, S.-S.; et al. Effects of Hyaluronic Acid and γ–Globulin Concentrations on the Frictional Response of Human Osteoarthritic Articular Cartilage. PLoS ONE 2014, 9, 112684. [Google Scholar] [CrossRef] [Green Version]
  7. Murakami, T.; Nakashima, K.; Sawae, Y.; Sakai, N.; Hosoda, N. Roles of adsorbed film and gel layer in hydration lubrication for articular cartilage. Proc. Inst. Mech. Eng. Part J J. Eng. Tribol. 2009, 223, 287–295. [Google Scholar] [CrossRef]
  8. Das, S.; Banquy, X.; Zappone, B.; Greene, G.W.; Jay, G.D.; Israelachvili, J.N. Synergistic Interactions between Grafted Hyaluronic Acid and Lubricin Provide Enhanced Wear Protection and Lubrication. Biomacromolecules 2013, 14, 1669–1677. [Google Scholar] [CrossRef]
  9. Bonnevie, E.D.; Galesso, D.; Secchieri, C.; Cohen, I.; Bonassar, L.J.; Awad, H.A. Elastoviscous Transitions of Articular Cartilage Reveal a Mechanism of Synergy between Lubricin and Hyaluronic Acid. PLoS ONE 2015, 10, 143415. [Google Scholar] [CrossRef]
  10. Goldberg, R.; Schroeder, A.; Silbert, G.; Turjeman, K.; Barenholz, Y.; Klein, J. Boundary Lubricants with Exceptionally Low Friction Coefficients Based on 2D Close-Packed Phosphatidylcholine Liposomes. Adv. Mater. 2011, 23, 3517–3521. [Google Scholar] [CrossRef]
  11. Wang, M.; Liu, C.; Thormann, E.; Dėdinaitė, A. Hyaluronan and Phospholipid Association in Biolubrication. Biomacromolecules 2013, 14, 4198–4206. [Google Scholar] [CrossRef]
  12. Murakami, T.; Yarimitsu, S.; Nakashima, K.; Sawae, Y.; Sakai, N. Influence of synovia constituents on tribological behaviors of articular cartilage. Friction 2013, 1, 150–162. [Google Scholar] [CrossRef] [Green Version]
  13. GBD 2017 Disease and Injury Incidence and Prevalence Collaborators. Global, regional, and national incidence, prevalence, and years lived with disability for 354 diseases and injuries for 195 countries and territories, 1990–2017: A systematic analysis for the global bur-den of disease study 2017. Lancet 2018, 392, 1789–1858. [Google Scholar] [CrossRef] [Green Version]
  14. Caligaris, M.; Canal, C.E.; Ahmad, C.S.; Gardner, T.R.; Ateshian, G.A. Investigation of the frictional response of osteoarthritic human tibiofemoral joints and the potential beneficial tribological effect of healthy synovial fluid. Osteoarthr. Cartil. 2009, 17, 1327–1332. [Google Scholar] [CrossRef] [Green Version]
  15. Galandáková, A.; Ulrichová, J.; Langová, K.; Hanáková, A.; Vrbka, M.; Hartl, M.; Gallo, J. Characteristics of synovial fluid required for optimization of lubrication fluid for biotribological experiments. J. Biomed. Mater. Res. Part B 2017, 105, 1422–1431. [Google Scholar] [CrossRef]
  16. Bastow, E.R.; Byers, S.; Golub, S.B.; Clarkin, C.E.; Pitsillides, A.A.; Fosang, A.J. Hyaluronan synthesis and degradation in cartilage and bone. Cell Mol. Life Sci. 2008, 65, 395–413. [Google Scholar] [CrossRef]
  17. Yoshida, M.; Sai, S.; Marumo, K.; Tanaka, T.; Itano, N.; Kimata, K.; Fujii, K. Expression analysis of three isoforms of hyaluronan synthase and hyaluronidase in the synovium of knees in osteoarthritis and rheumatoid arthritis by quantitative real-time reverse transcriptase polymerase chain reaction. Arthritis Res. Ther. 2004, 6, 514–520. [Google Scholar] [CrossRef] [Green Version]
  18. Šoltés, L.; Mendichi, R.; Kogan, G.; Schiller, J.; Stankovská, M.; Arnhold, J. Degradative Action of Reactive Oxygen Species on Hyaluronan. Biomacromolecules 2006, 7, 659–668. [Google Scholar]
  19. Tyrnenopoulou, P.; Rizos, E.; Chaintoutis, S.; Patsikas, M.; Papadopoulou, P.; Polizopoulou, Z.; Aggeli, A.; Papazoglou, P.; Diakakis, Z. Alterations in the Viscoelastic Properties of Equine Synovial Fluid from Fetlock Joints with Naturally Occurring Osteoarthritis. Arch. Vet. Sci. Med. 2020, 2020, 1–9. [Google Scholar]
  20. Mathieu, P.; Conrozier, T.; Vignon, E.; Rozand, Y.; Rinaudo, M. Rheologic Behavior of Osteoarthritic Synovial Fluid after Addition of Hyaluronic Acid: A Pilot Study. Clin. Orthop. Relat. Res. 2009, 467, 3002–3009. [Google Scholar] [CrossRef] [Green Version]
  21. Chen, S.X.; Bomfim, F.; Mukherjee, T.; Wilder, E.; Leyton-Mange, A.; Aharon, S.; Browne, L.; Toth, K.; Strauss, E.; Samuels, J. Viscosupplementation efficacy is similar in single vs. multi-week formulations but higher in younger patients and milder radiographic disease. Osteoarthr. Cartil. 2017, 25, S438. [Google Scholar] [CrossRef] [Green Version]
  22. Maheu, E.; Rannou, F.; Reginster, J.-Y. Efficacy and safety of hyaluronic acid in the management of osteoarthritis: Evidence from real-life setting trials and surveys. Semin. Arthritis Rheum. 2016, 45, S28–S33. [Google Scholar] [CrossRef] [PubMed]
  23. Jevsevar, D.; Donnelly, P.; Brown, G.A.; Cummins, D.S. Viscosupplementation for Osteoarthritis of the Knee. J. Bone Joint Surg. Am. 2015, 97, 2047–2060. [Google Scholar] [CrossRef]
  24. More, S.; Kotiya, A.; Kotia, A.; Ghosh, S.K.; Spyrou, L.A.; Sarris, I.E. Rheological properties of synovial fluid due to viscosupplements: A review for osteoarthritis remedy. Comput. Methods Prog. Biomed. 2020, 196, 105644. [Google Scholar] [CrossRef]
  25. Flowers, S.A.; Zieba, A.; Örnros, J.; Jin, C.; Rolfson, O.; Björkman, L.I.; Eisler, T.; Kalamajski, S.; Kamali-Moghaddam, M.; Karlsson, N.G. Lubricin binds cartilage proteins, cartilage oligomeric matrix protein, fibronectin and collagen II at the cartilage surface. Sci. Rep. 2017, 7, 13149. [Google Scholar] [CrossRef] [Green Version]
  26. Liu, Z.; Lin, W.; Fan, Y.; Kampf, N.; Wang, Y.; Klein, J. Effects of Hyaluronan Molecular Weight on the Lubrication of Cartilage-Emulating Boundary Layers. Biomacromolecules 2020, 21, 4345–4354. [Google Scholar] [CrossRef]
  27. Siódmiak, J.; Bełdowski, P.; Augé, W.; Ledziński, D.; Śmigiel, S.; Gadomski, A. Molecular Dynamic Analysis of Hyaluronic Acid and Phospholipid Interaction in Tribological Surgical Adjuvant Design for Osteoarthritis. Molecules 2017, 22, 1436. [Google Scholar] [CrossRef]
  28. Dėdinaitė, A.; Wieland, D.C.F.; Bełdowski, P.; Claesson, P.M. Biolubrication synergy: Hyaluronan—Phospholipid interactions at interfaces. Adv. Colloid Interface Sci. 2019, 274, 102050. [Google Scholar] [CrossRef]
  29. Seror, J.; Zhu, L.; Goldberg, R.; Day, A.J.; Klein, J. Supramolecular synergy in the boundary lubrication of synovial joints. Nat. Commun. 2015, 6, 7497. [Google Scholar] [CrossRef] [Green Version]
  30. Kwiecinski, J.J.; Dorosz, S.G.; Ludwig, T.E.; Abubacker, S.; Cowman, M.K.; Schmidt, T.A. The effect of molecular weight on hyaluronan’s cartilage boundary lubricating ability—Alone and in combination with proteoglycan 4. Osteoarthr. Cartil. 2011, 19, 1356–1362. [Google Scholar] [CrossRef] [Green Version]
  31. Cao, Y.; Kampf, N.; Kosinska, M.K.; Steinmeyer, J.; Klein, J. Interactions Between Bilayers of Phospholipids Extracted from Human Osteoarthritic Synovial Fluid. Biotribology 2021, 25, 100157. [Google Scholar] [CrossRef]
  32. Cao, Y.; Klein, J. Lipids and lipid mixtures in boundary layers: From hydration lubrication to osteoarthritis. Curr. Opin Colloid Interface Sci. 2022, 58, 101559. [Google Scholar] [CrossRef]
  33. Lin, W.; Klein, J. Recent Progress in Cartilage Lubrication. Adv. Mater. 2021, 33, 2005513. [Google Scholar] [CrossRef]
  34. Nitzan, D.W.; Nitzan, U.; Dan, P.; Yedgar, S. The role of hyaluronic acid in protecting surface-active phospholipids from lysis by exogenous phospholipase A2. Rheumatology 2001, 40, 336–340. [Google Scholar] [CrossRef] [Green Version]
  35. Murakami, T.; Nakashima, K.; Yarimitsu, S.; Sawae, Y.; Sakai, N. Effectiveness of adsorbed film and gel layer in hydration lubrication as adaptive multimode lubrication mechanism for articular cartilage. Proc. Inst. Mech. Eng. Part J J. Eng. Tribol. 2011, 225, 1174–1185. [Google Scholar] [CrossRef]
  36. Yarimitsu, S.; Nakashima, K.; Sawae, Y.; Murakami, T. Influences of lubricant composition on forming boundary film composed of synovia constituents. Tribol. Int. 2009, 42, 1615–1623. [Google Scholar] [CrossRef]
  37. Čípek, P.; Rebenda, D.; Nečas, D.; Vrbka, M.; Křupka, I.; Hartl, M. Visualization of Lubrication Film in Model of Synovial Joint. Tribol. Ind. 2019, 41, 387–393. [Google Scholar] [CrossRef]
  38. Rebenda, D.; Vrbka, M.; Nečas, D.; Toropitsyn, E.; Yarimitsu, S.; Čípek, P.; Pravda, M.; Hartl, M. Rheological and frictional analysis of viscosupplements towards improved lubrication of human joints. Tribol. Int. 2021, 160, 107030. [Google Scholar] [CrossRef]
  39. Nečas, D.; Vrbka, M.; Křupka, I.; Hartl, M.; Galandáková, A. Lubrication within hip replacements—Implication for ceramic-on-hard bearing couples. J. Mech. Behav. Biomed. Mater. 2016, 61, 371–383. [Google Scholar] [CrossRef]
  40. Greene, G.W.; Zappone, B.; Zhao, B.; Söderman, O.; Topgaard, D.; Rata, G.; Israelachvili, J.N. Changes in pore morphology and fluid transport in compressed articular cartilage and the implications for joint lubrication. Biomaterials 2008, 29, 4455–4462. [Google Scholar] [CrossRef]
  41. Forsey, R.; Fisher, J.; Thompson, J.; Stone, M.; Bell, C.; Ingham, E. The effect of hyaluronic acid and phospholipid based lubricants on friction within a human cartilage damage model. Biomaterials 2006, 27, 4581–4590. [Google Scholar] [CrossRef] [PubMed]
  42. Čípek, P.; Vrbka, M.; Rebenda, D.; Nečas, D.; Křupka, I. Biotribology of Synovial Cartilage: A New Method for Visualization of Lubricating Film and Simultaneous Measurement of the Friction Coefficient. Materials 2020, 13, 2075. [Google Scholar] [CrossRef] [PubMed]
  43. Rebenda, D.; Vrbka, M.; Čípek, P.; Toropitsyn, E.; Nečas, D.; Pravda, M.; Hartl, M. On the Dependence of Rheology of Hyaluronic Acid Solutions and Frictional Behavior of Articular Cartilage. Materials 2020, 13, 2659. [Google Scholar] [CrossRef]
  44. Bonnevie, E.D.; Galesso, D.; Secchieri, C.; Bonassar, L.J.; Awad, H.A. Frictional characterization of injectable hyaluronic acids is more predictive of clinical outcomes than traditional rheological or viscoelastic characterization. PLoS ONE 2019, 14, 216702. [Google Scholar] [CrossRef]
  45. Majd, S.E.; Kuijer, R.; Köwitsch, A.; Groth, T.; Schmidt, T.A.; Sharma, P.K. Both Hyaluronan and Collagen Type II Keep Proteoglycan 4 (Lubricin) at the Cartilage Surface in a Condition That Provides Low Friction during Boundary Lubrication. Langmuir 2014, 30, 14566–14572. [Google Scholar] [CrossRef]
  46. Jahn, S.; Seror, J.; Klein, J. Lubrication of Articular Cartilage. Annu. Rev. Biomed. Eng. 2016, 18, 235–258. [Google Scholar] [CrossRef]
  47. Krishnan, R.; Kopacz, M.; Ateshian, G.A. Experimental verification of the role of interstitial fluid pressurization in cartilage lubrication. J. Orthop. Res. 2004, 22, 565–570. [Google Scholar] [CrossRef]
  48. Jeyachandran, Y.L.; Mielczarski, E.; Rai, B.; Mielczarski, J.A. Quantitative and Qualitative Evaluation of Adsorption/Desorption of Bovine Serum Albumin on Hydrophilic and Hydrophobic Surfaces. Langmuir 2009, 25, 11614–11620. [Google Scholar] [CrossRef]
  49. McNary, S.M.; Athanasiou, K.A.; Reddi, A.H. Engineering Lubrication in Articular Cartilage. Tissue Eng. Part B Rev. 2012, 18, 88–100. [Google Scholar] [CrossRef] [Green Version]
  50. Furmann, D.; Nečas, D.; Rebenda, D.; Čípek, P.; Vrbka, M.; Křupka, I.; Hartl, M. The Effect of Synovial Fluid Composition, Speed and Load on Frictional Behaviour of Articular Cartilage. Materials 2020, 13, 1334. [Google Scholar] [CrossRef] [Green Version]
  51. Bełdowski, P.; Przybyłek, M.; Raczyński, P.; Dedinaite, A.; Górny, K.; Wieland, F.; Dendzik, Z.; Sionkowska, A.; Claesson, P.M. Albumin–Hyaluronan Interactions: Influence of Ionic Composition Probed by Molecular Dynamics. Int. J. Mol. Sci. 2021, 22, 12360. [Google Scholar] [CrossRef] [PubMed]
  52. Gekle, M. Renal Tubule Albumin Transport. Annu. Rev. Physiol. 2005, 67, 573–594. [Google Scholar] [CrossRef] [PubMed]
  53. Cowman, M.K.; Schmidt, T.A.; Raghavan, P.; Stecco, A. Viscoelastic Properties of Hyaluronan in Physiological Conditions. F1000Research 2015, 4, 622. [Google Scholar] [CrossRef] [PubMed]
Figure 1. Research plan.
Lubricants 11 00012 g001
Figure 2. COF as a function of a time for clear model SF and mixtures with different molecular weight HA solutions. Data are presented as mean ± SEM.
Lubricants 11 00012 g002
Figure 3. (A) Albumin-based fluorescence intensity as a function of a time for clear SF and mixtures with different molecular weight HA solutions. (B) Fluorescence images of AC surfaces during measurements (the symbols in the top left corner refer to same line in the graph). Data are presented as mean ± SEM.
Lubricants 11 00012 g003
Figure 4. (A) γ-Globulin-based fluorescence intensity as a function of a time for clear SF and mixtures with different molecular weight HA solutions. (B) Fluorescence images of AC surfaces during measurements (the symbols in the top left corner refer to same line in the graph). Data are presented as mean ± SEM.
Lubricants 11 00012 g004
Figure 5. (A) HA-based fluorescence intensity as a function of a time for mixtures of SF with different molecular weight HA solutions. (B) Fluorescence images of AC surfaces during measurements (the symbols in the top left corner refer to same line in the graph). Data are presented as mean ± SEM.
Lubricants 11 00012 g005
Figure 6. End values of percentage area of contact covered by protein (A) albumin and (B) γ-globulin before the first rehydration, before the second rehydration and at the end of measurements. Data are presented as mean ± SEM.
Lubricants 11 00012 g006
Figure 7. (A) CoF and (B) fluorescence intensity as a function of admixed HA molecular weight for mixtures of SF and HA. Data are presented as mean ± SEM. Blue lines represent data before the first rehydration, grey lines represent data before the second rehydration and black lines represent data at the end of measurements.
Lubricants 11 00012 g007
Table 1. Overview of the used lubricants. Fluorescently labeled components of SF are highlighted.
No.Albuminγ-GlobulinHAPhospholipidsViscosupplement
Fluorescently labeled albumin
124.9 mg/mL6.1 mg/mL1.49 mg/mL0.34 mg/mL-
224.9 mg/mL6.1 mg/mL1.49 mg/mL0.34 mg/mLHA500—20 mg/mL
324.9 mg/mL6.1 mg/mL1.49 mg/mL0.34 mg/mLHA1000—20 mg/mL
424.9 mg/mL6.1 mg/mL1.49 mg/mL0.34 mg/mLHA1600—20 mg/mL
Fluorescently labeled γ-globulin
524.9 mg/mL6.1 mg/mL1.49 mg/mL0.34 mg/mL-
624.9 mg/mL6.1 mg/mL1.49 mg/mL0.34 mg/mLHA500—20 mg/mL
724.9 mg/mL6.1 mg/mL1.49 mg/mL0.34 mg/mLHA1000—20 mg/mL
824.9 mg/mL6.1 mg/mL1.49 mg/mL0.34 mg/mLHA1600—20 mg/mL
Fluorescently labeled viscosupplement
924.9 mg/mL6.1 mg/mL1.49 mg/mL0.34 mg/mLHA500—20 mg/mL
1024.9 mg/mL6.1 mg/mL1.49 mg/mL0.34 mg/mLHA1000—20 mg/mL
1124.9 mg/mL6.1 mg/mL1.49 mg/mL0.34 mg/mLHA1600—20 mg/mL
Disclaimer/Publisher’s Note: The statements, opinions and data contained in all publications are solely those of the individual author(s) and contributor(s) and not of MDPI and/or the editor(s). MDPI and/or the editor(s) disclaim responsibility for any injury to people or property resulting from any ideas, methods, instructions or products referred to in the content.

