A Comparative Study of Hardfacing Deposits Using a Modified Tribological Testing Strategy


Abstract
1. Introduction
2. Materials and Methods
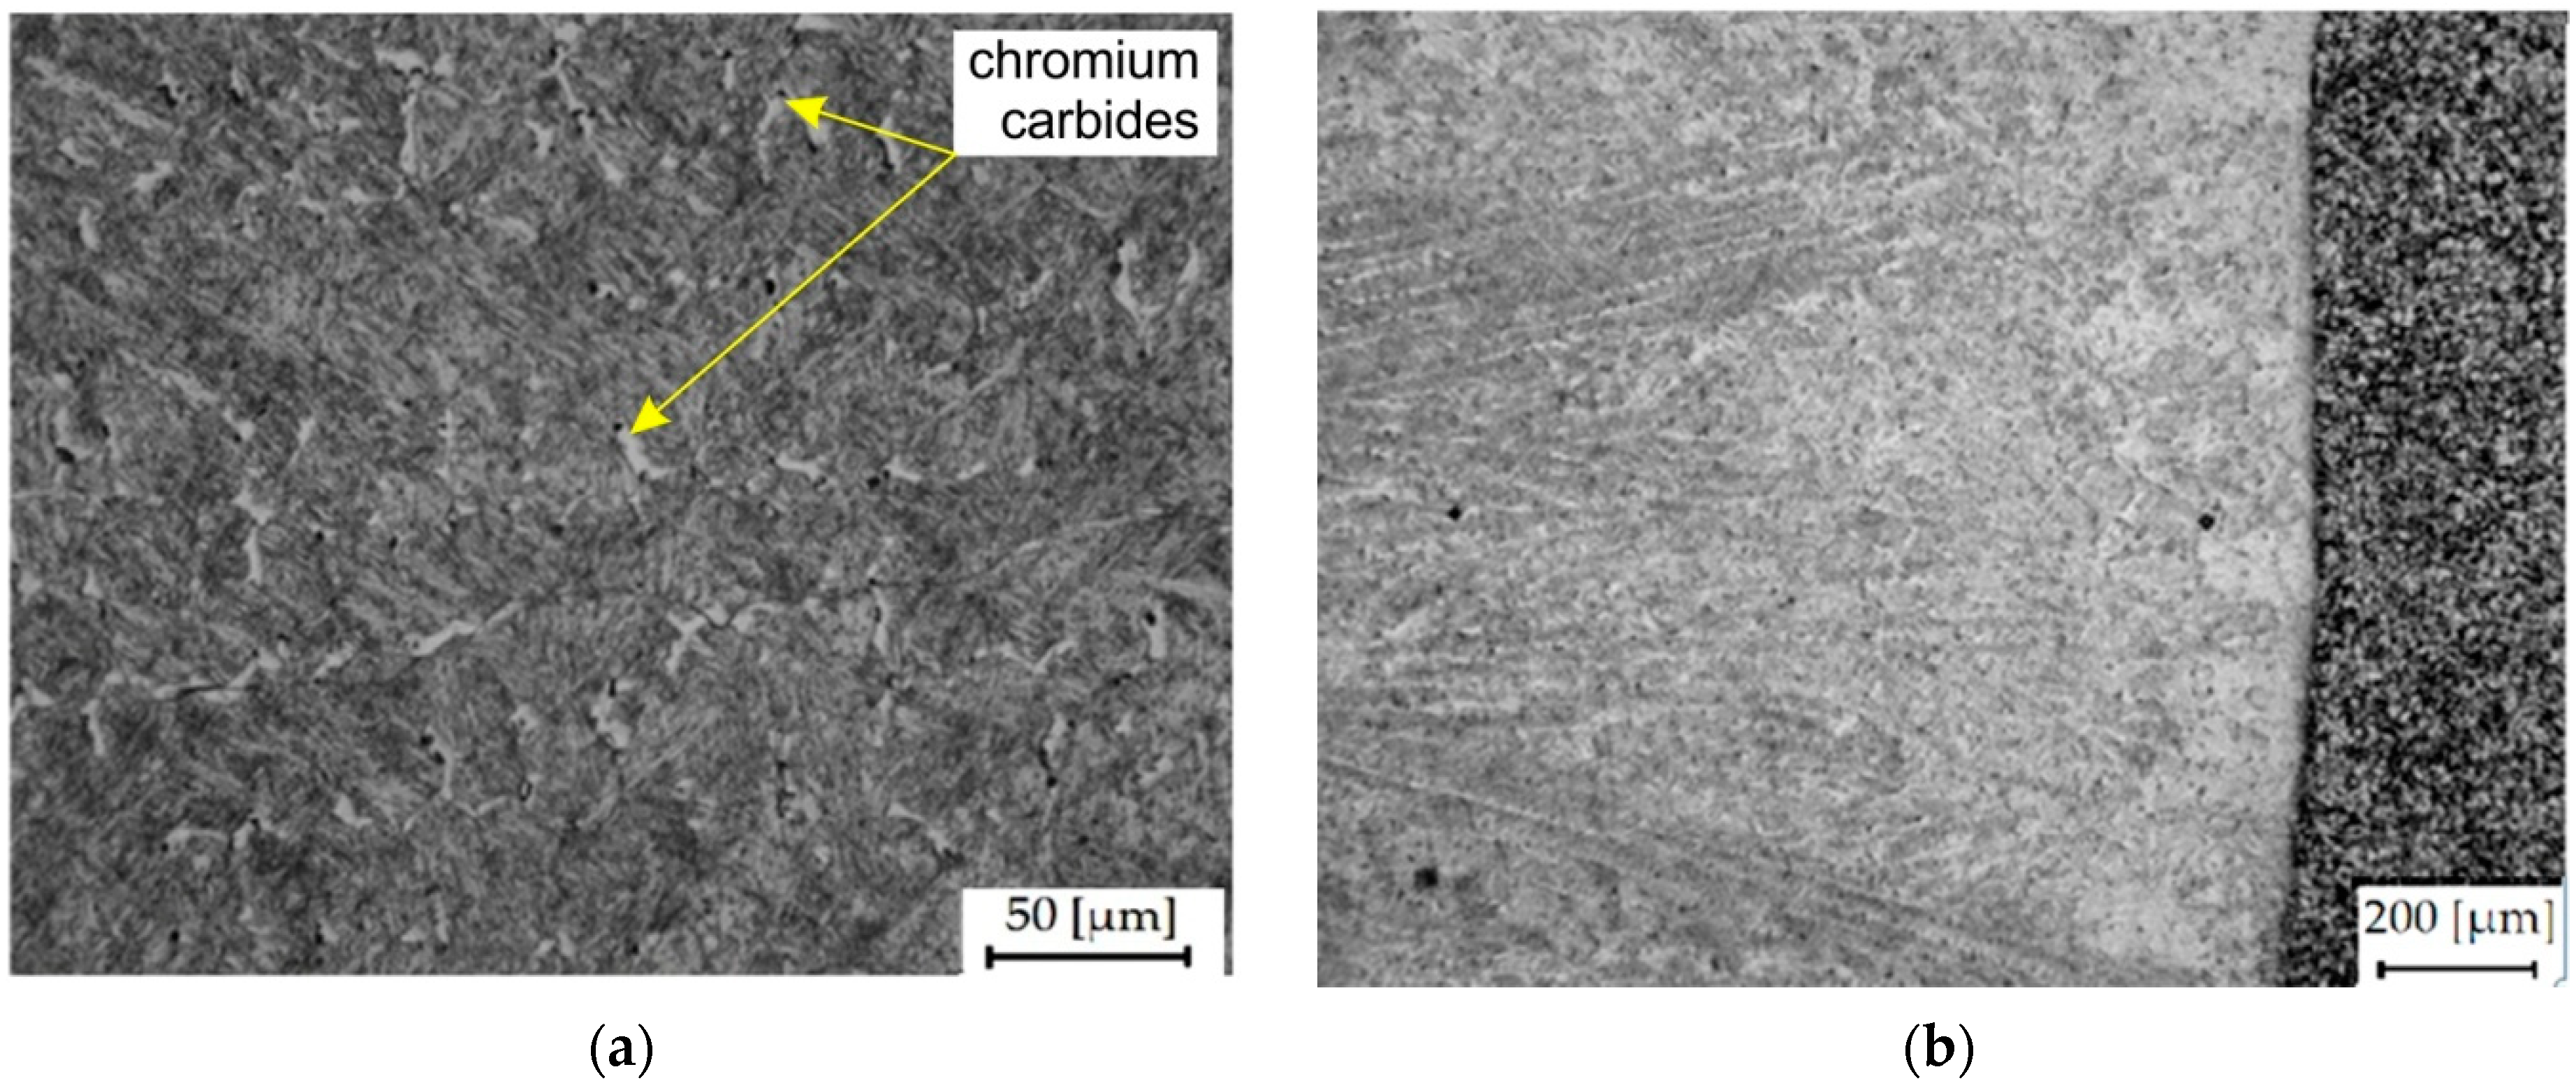
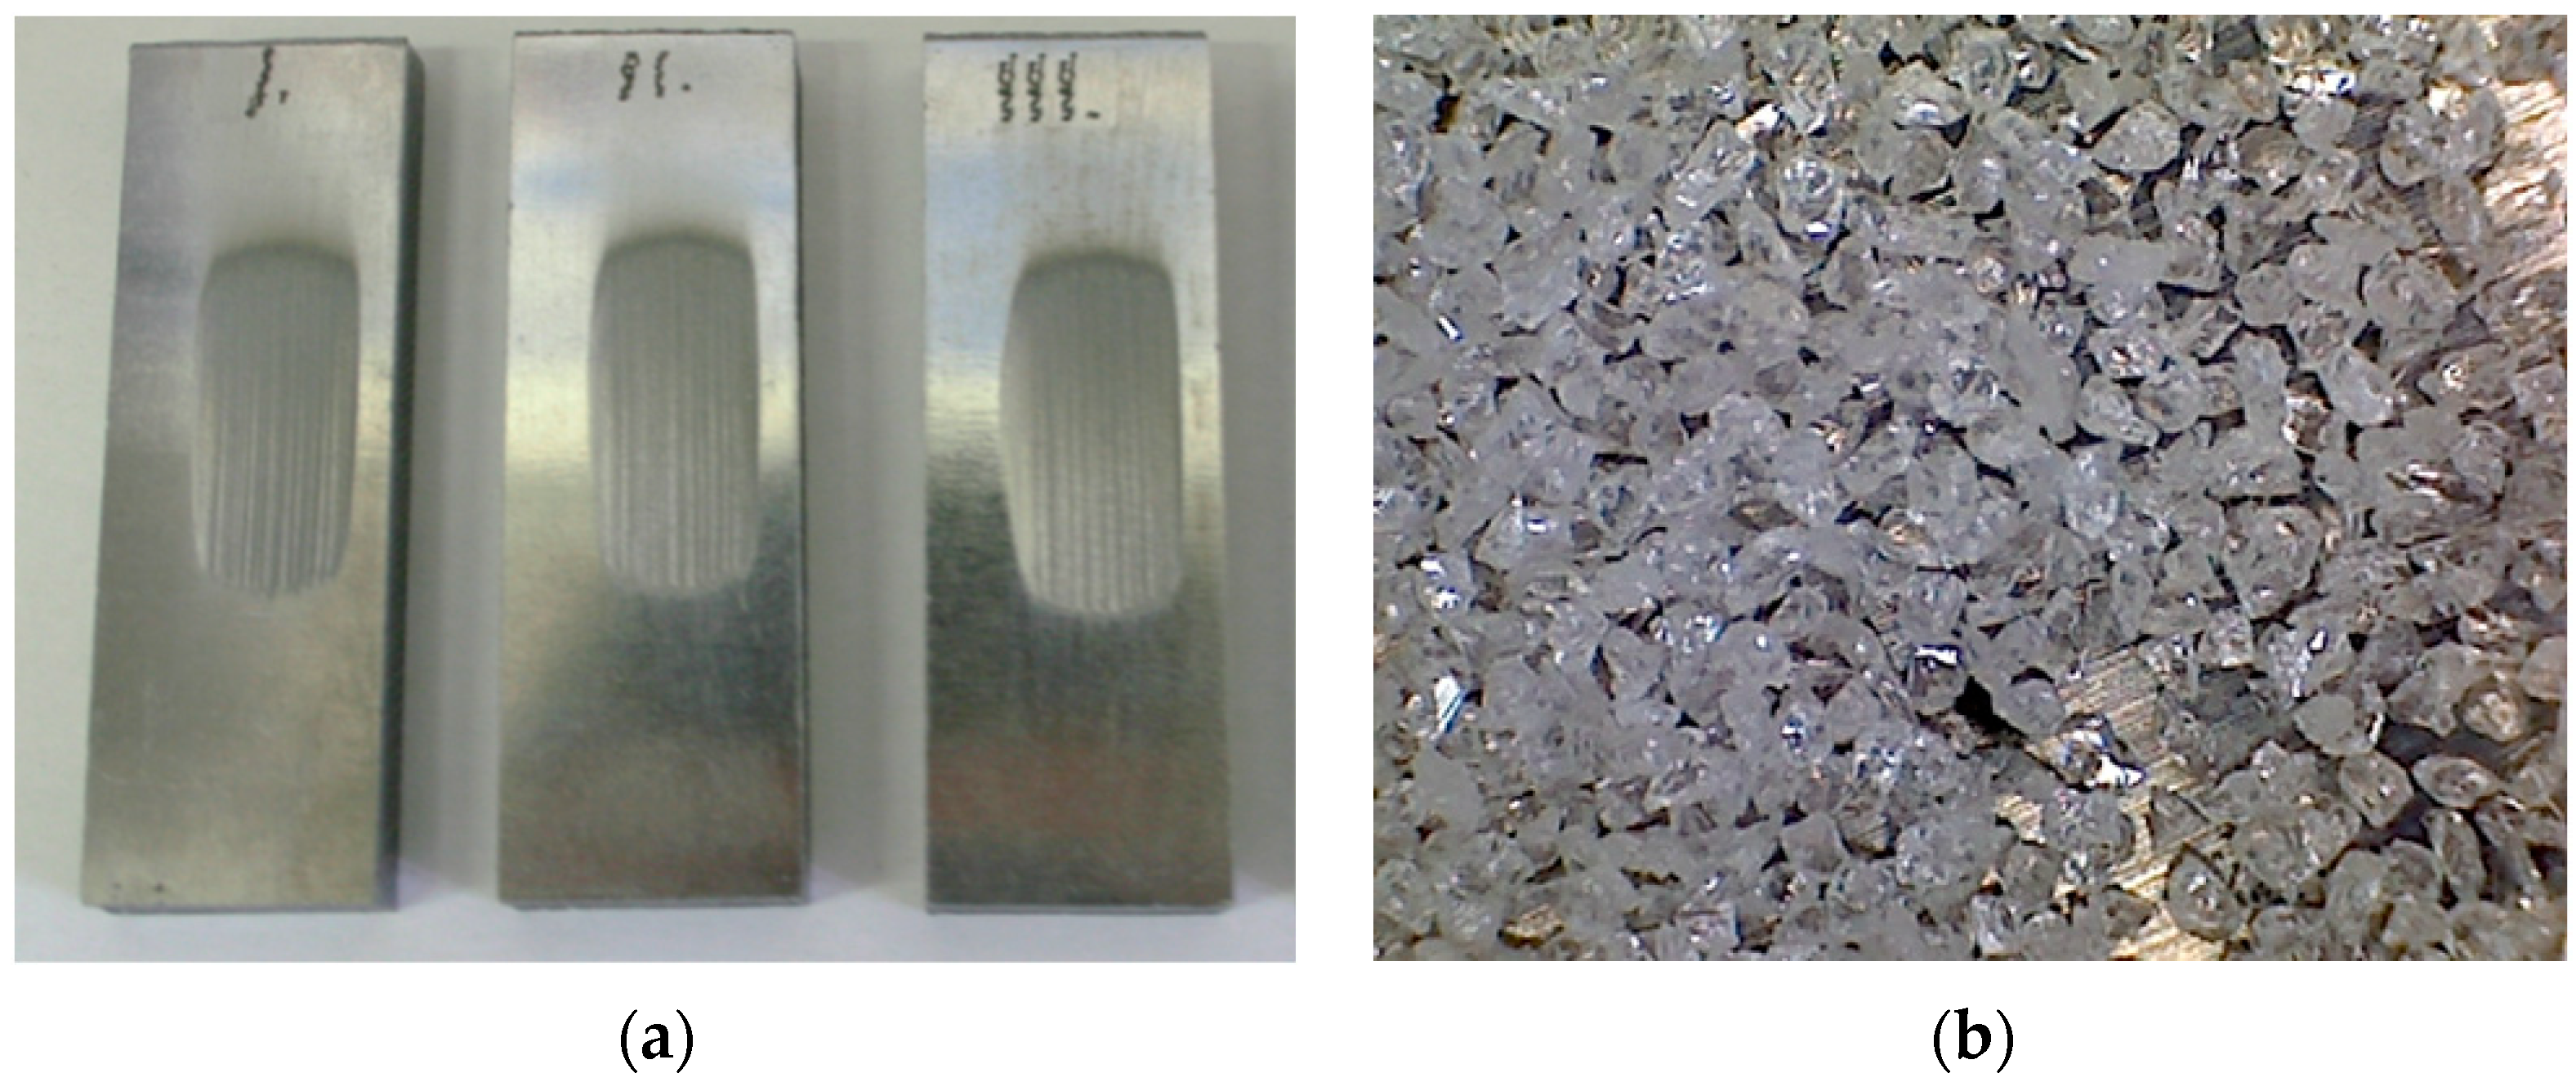
2.1. Material
2.2. Microhardness
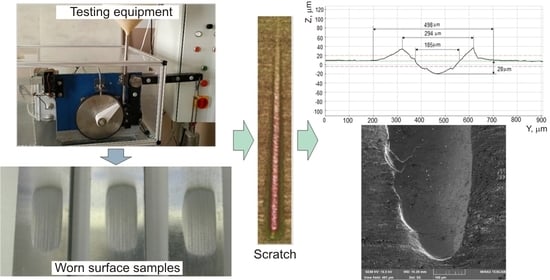
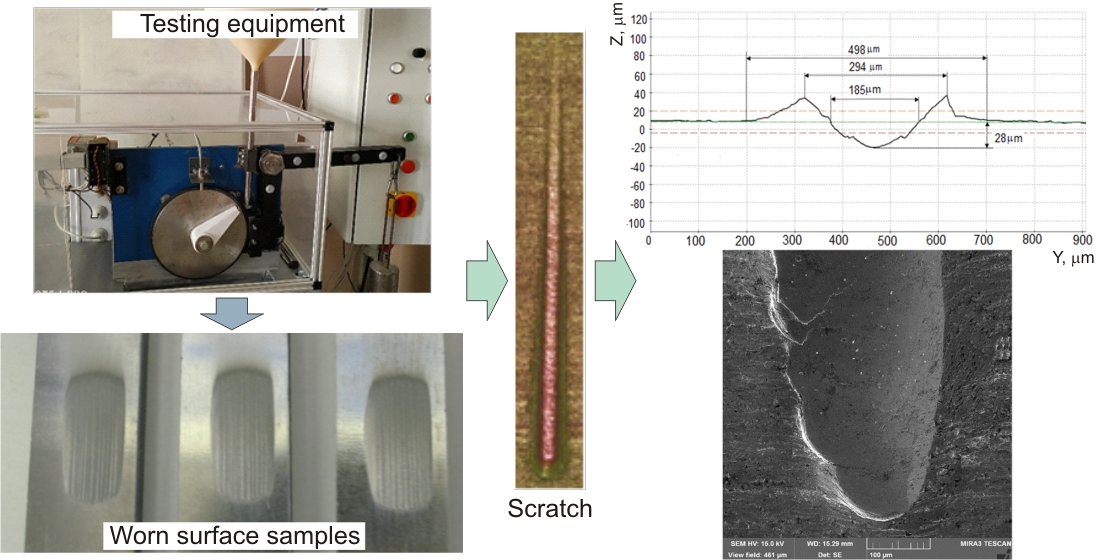
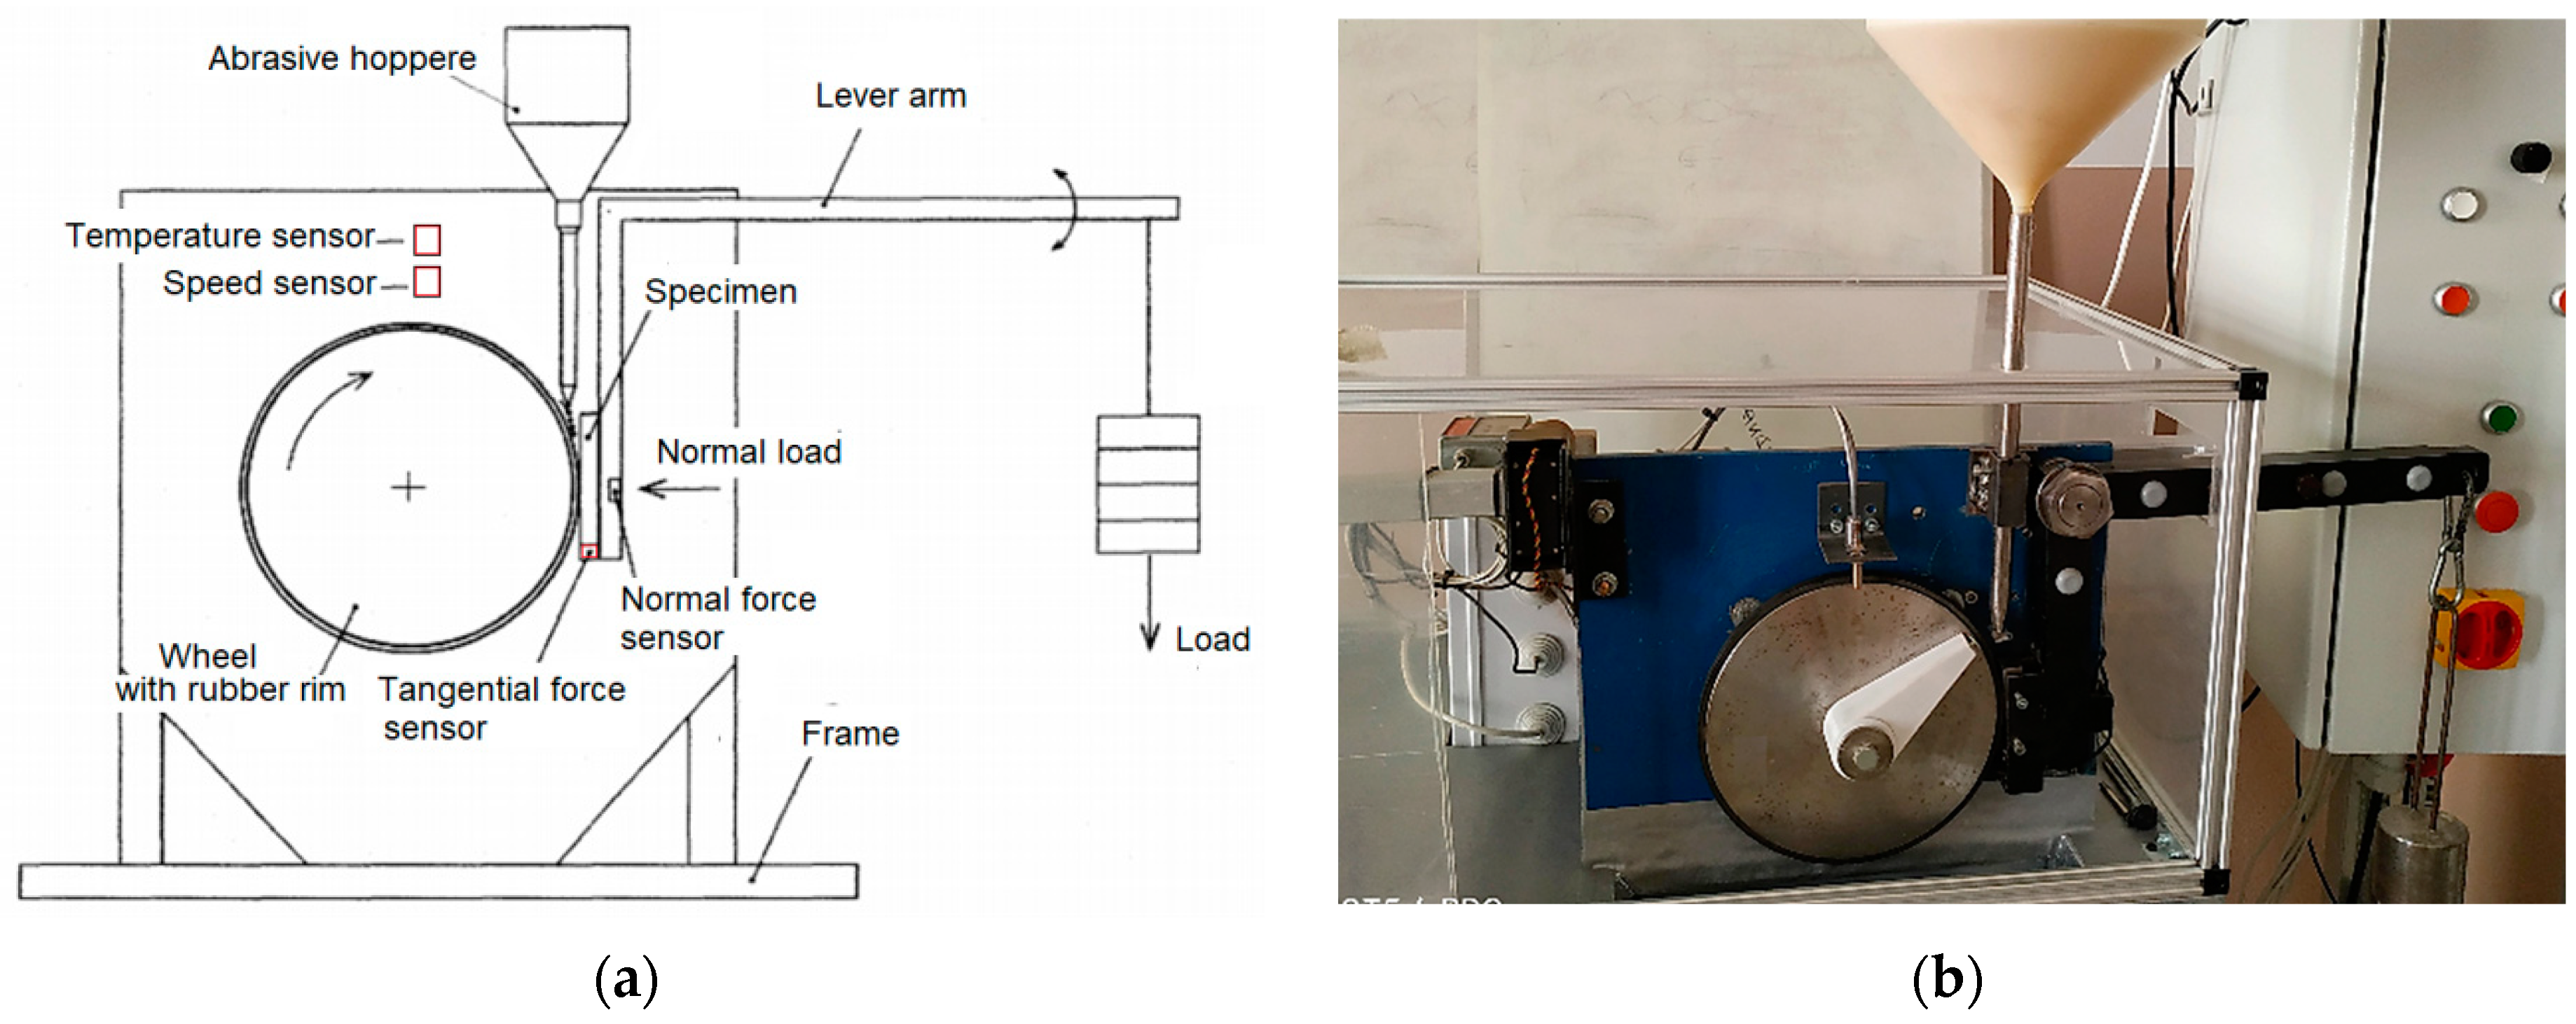
2.3. Abrasive Wear Test
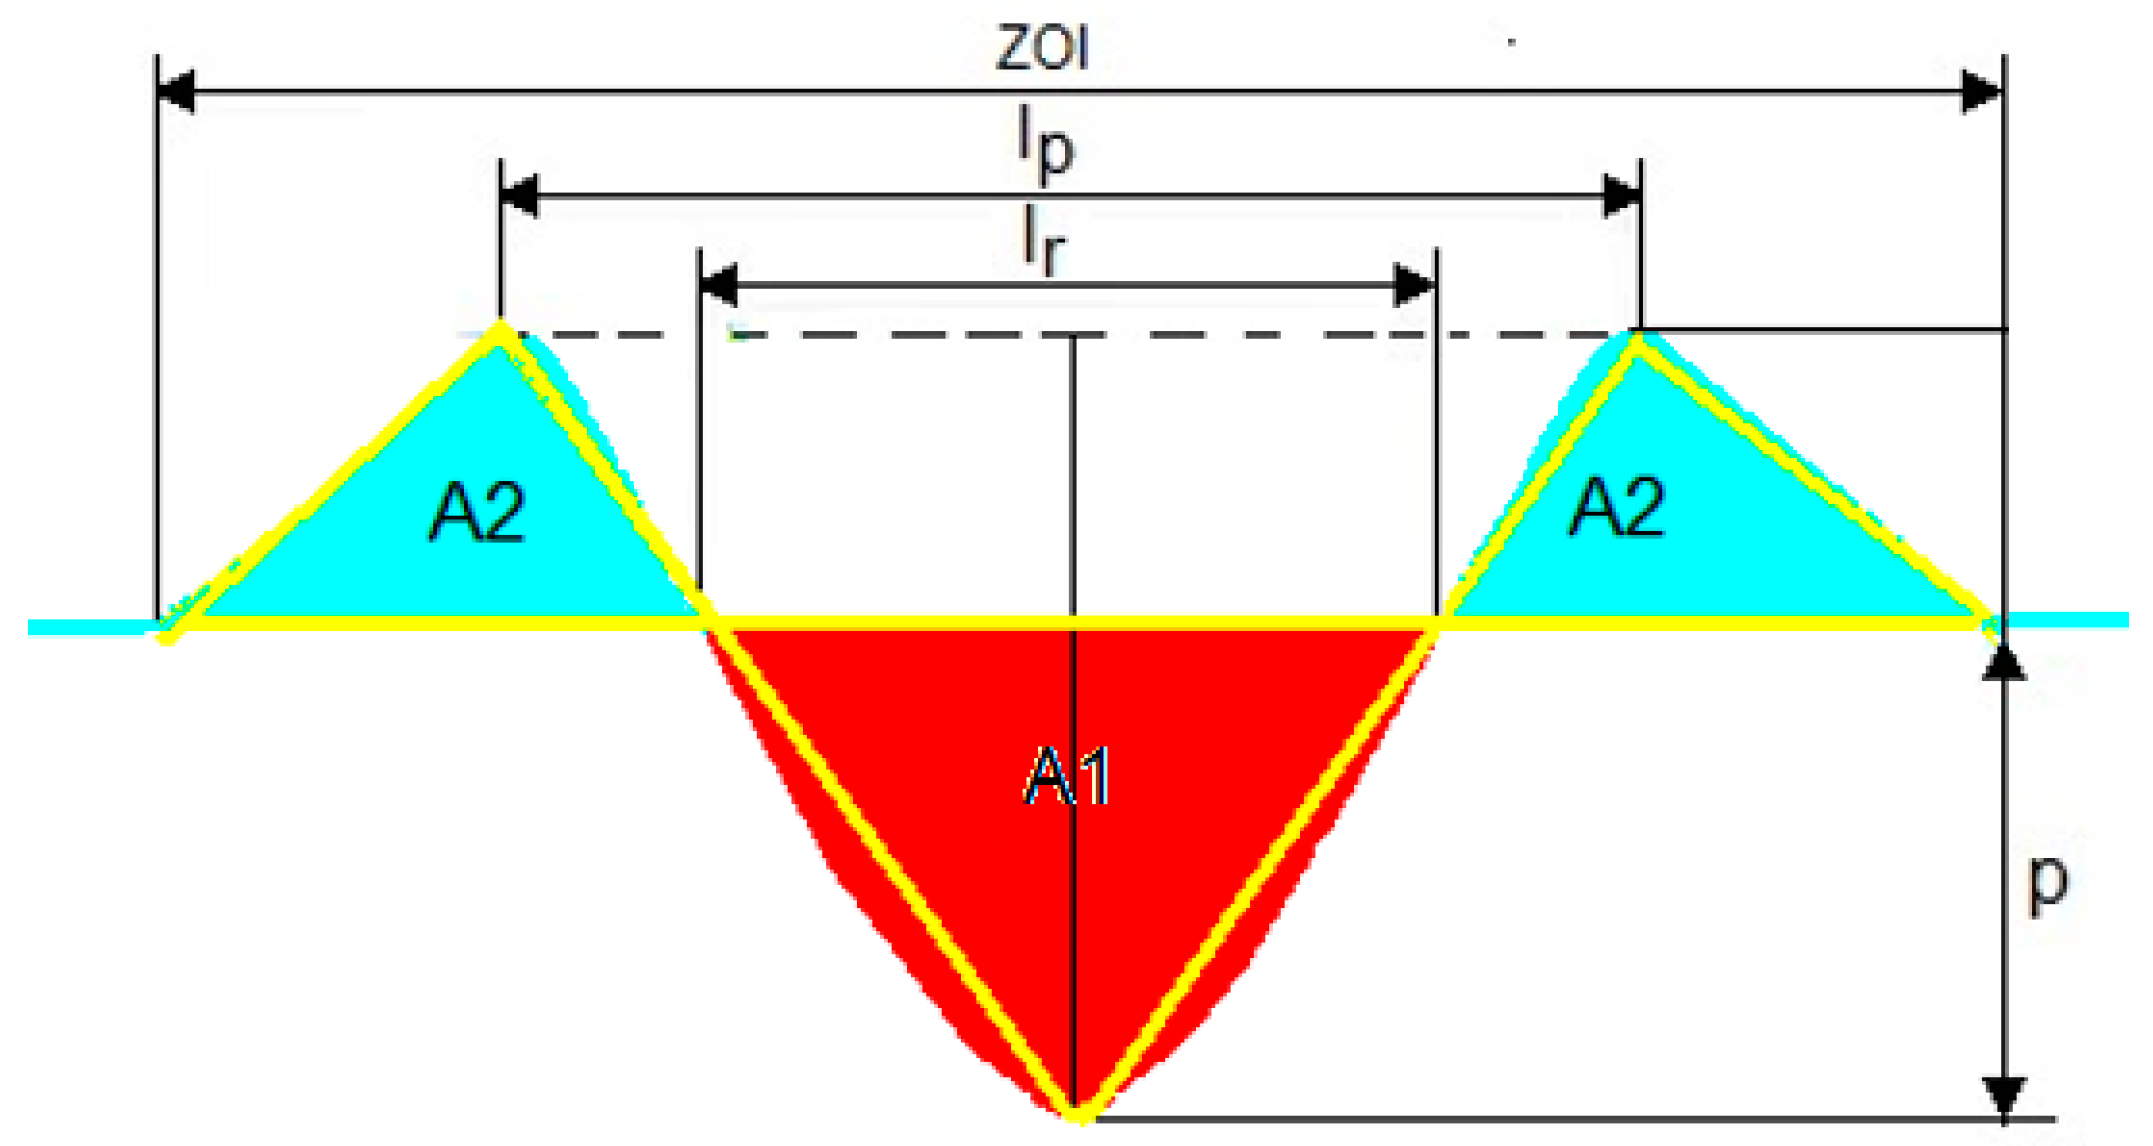
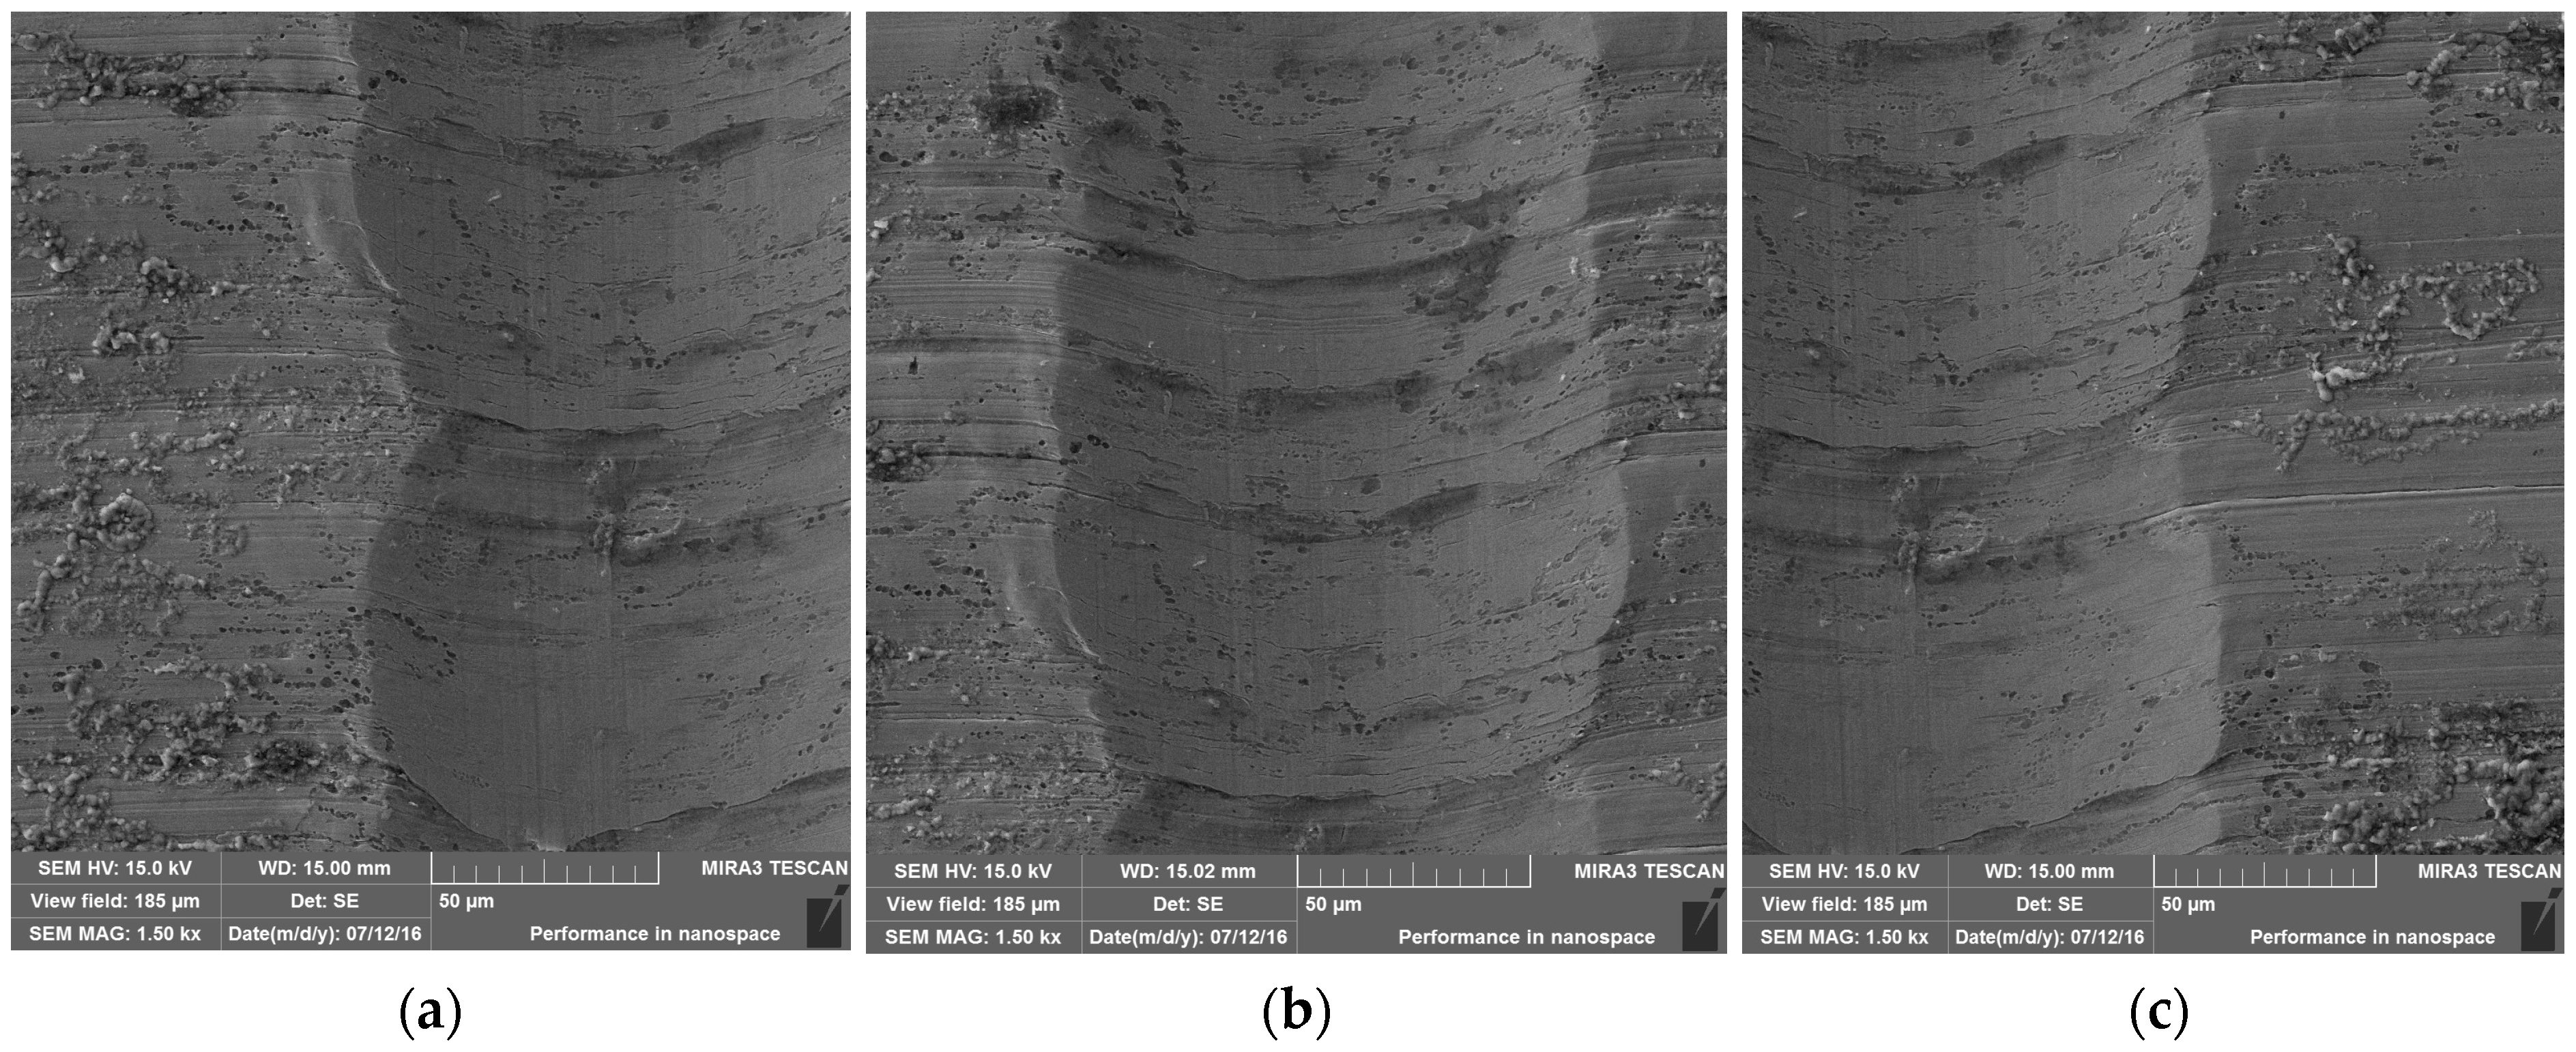
2.4. Scratch Test and Mechanism of Wear
3. Results
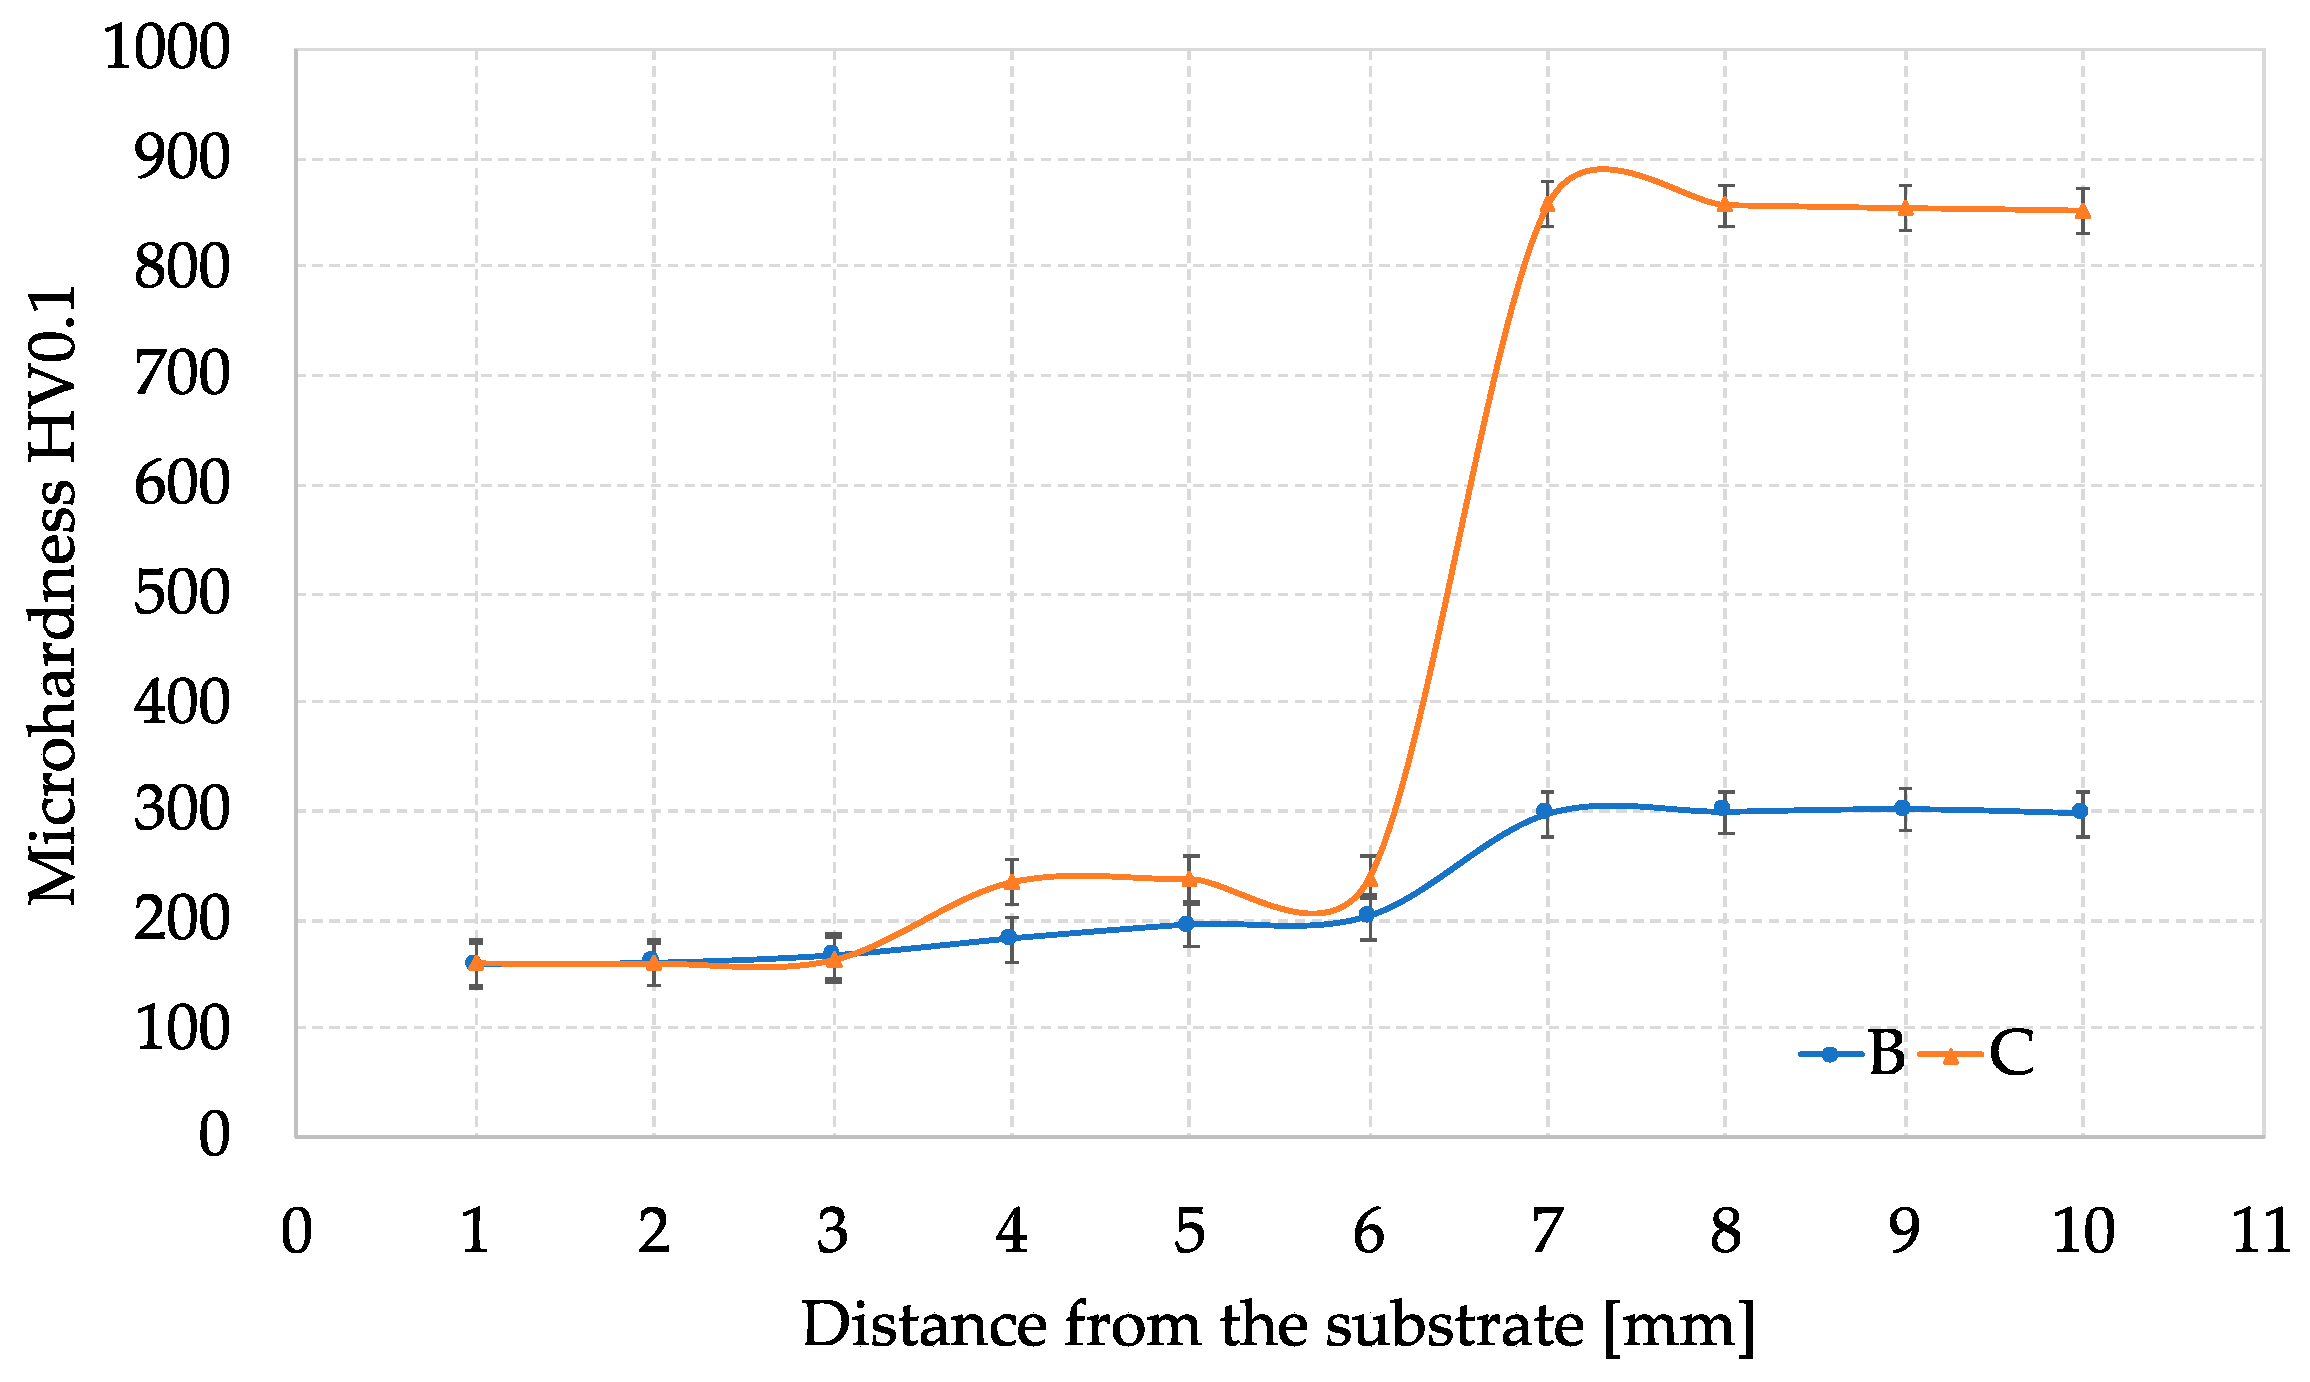
3.1. Microhardness
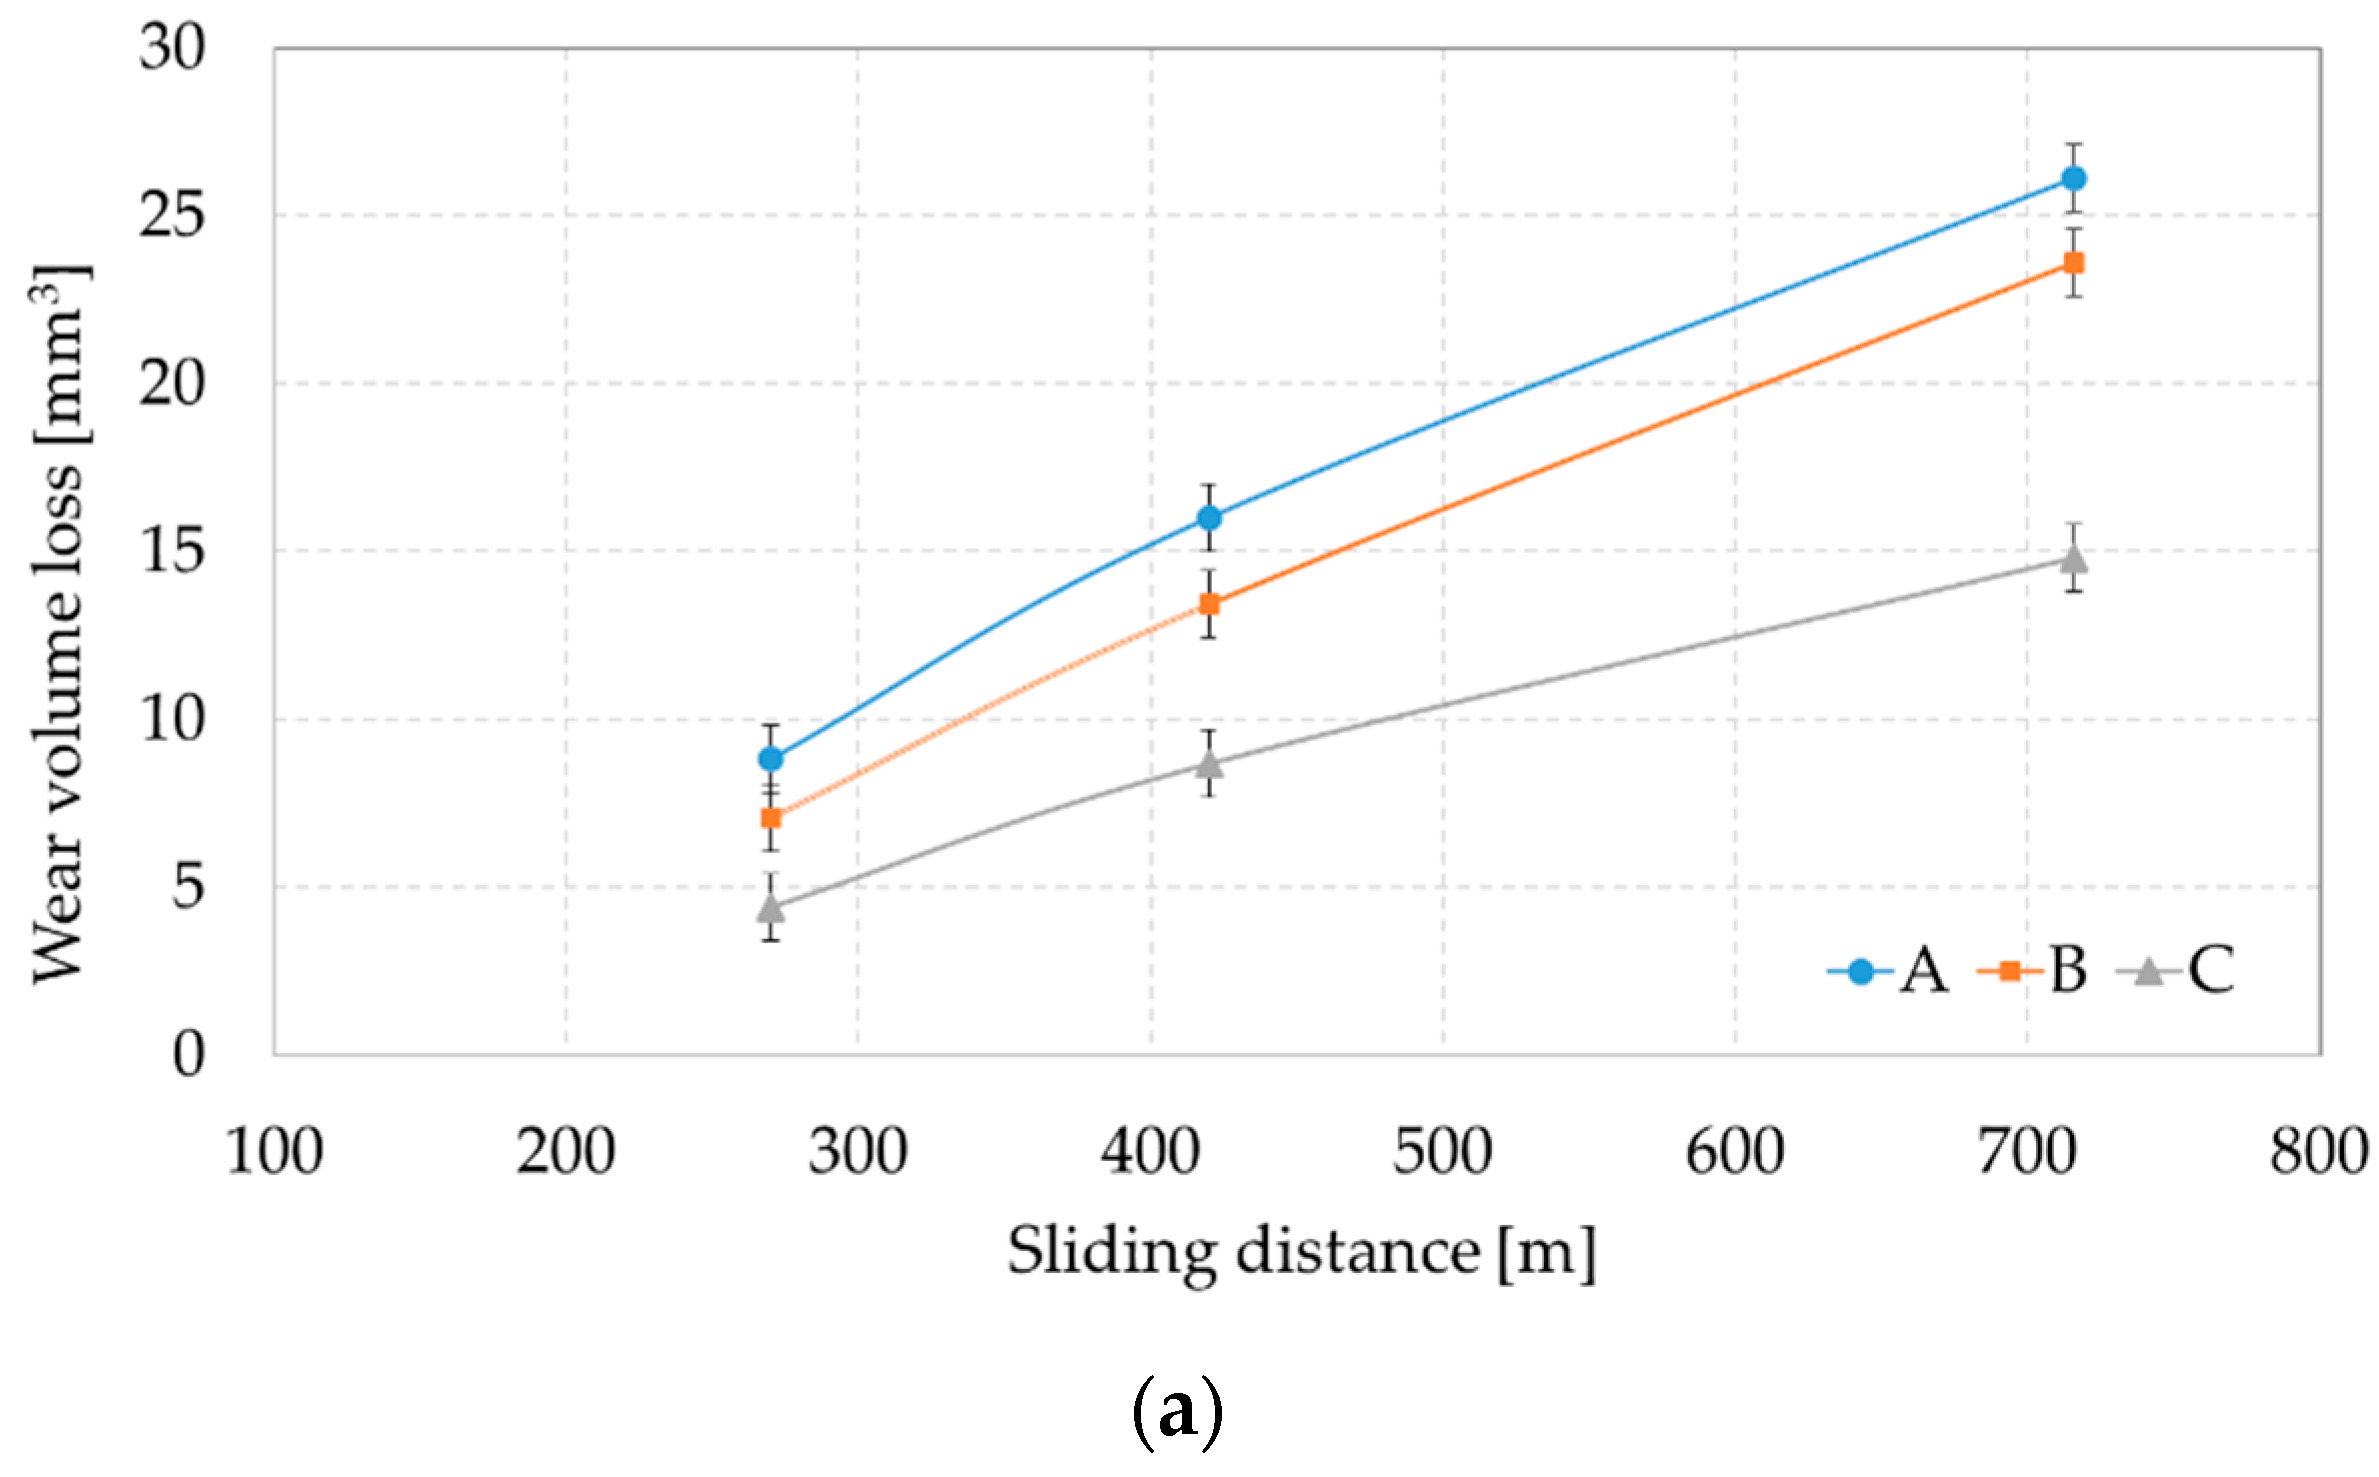
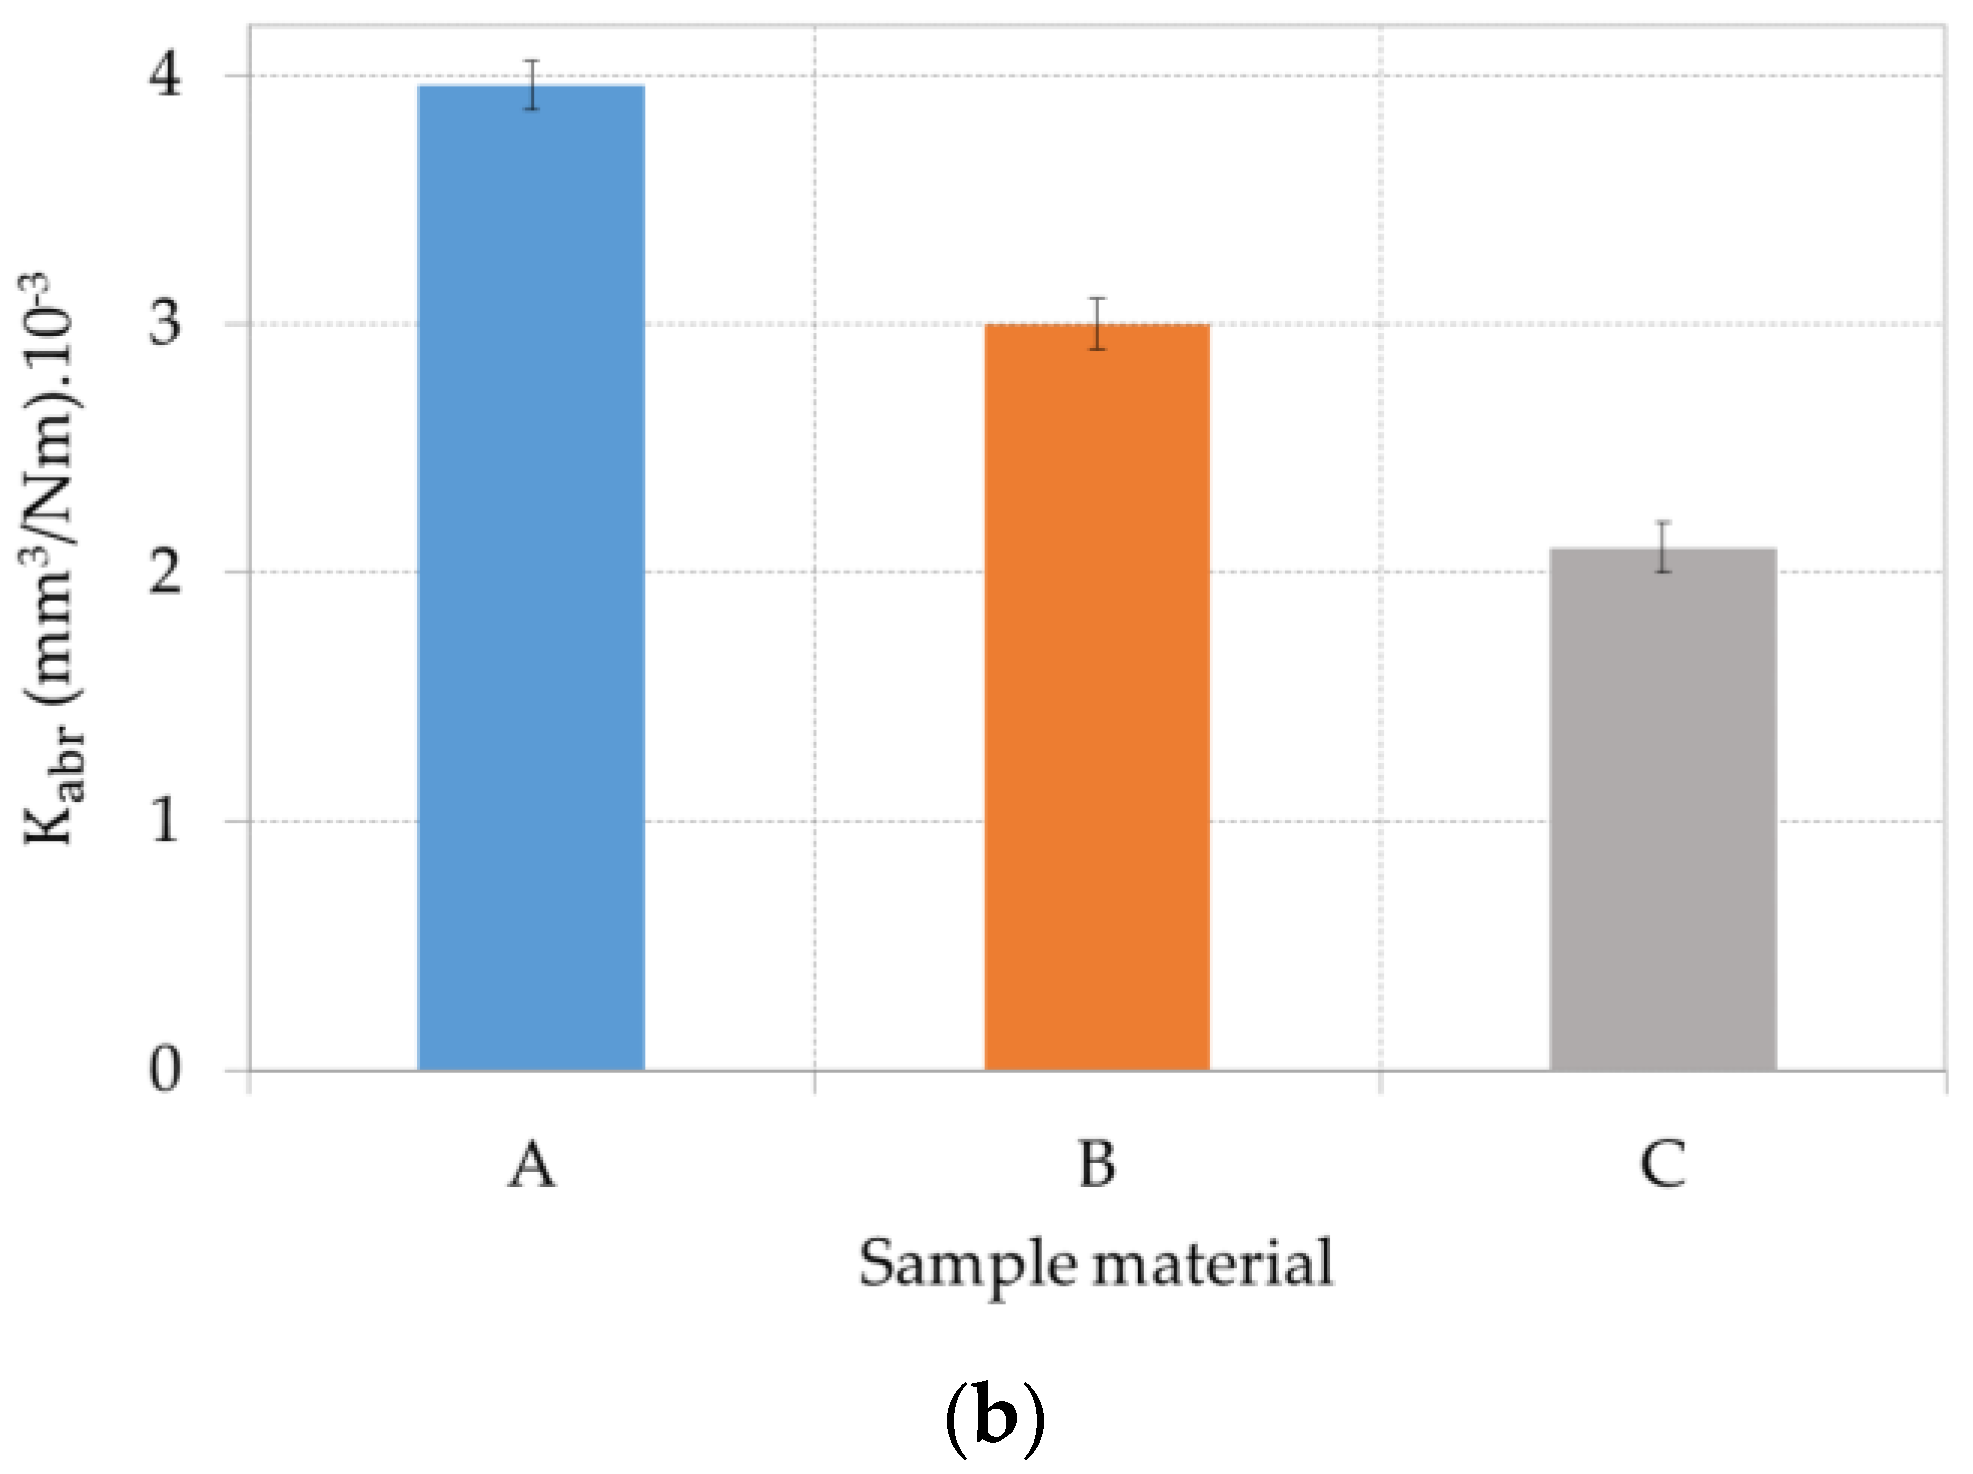
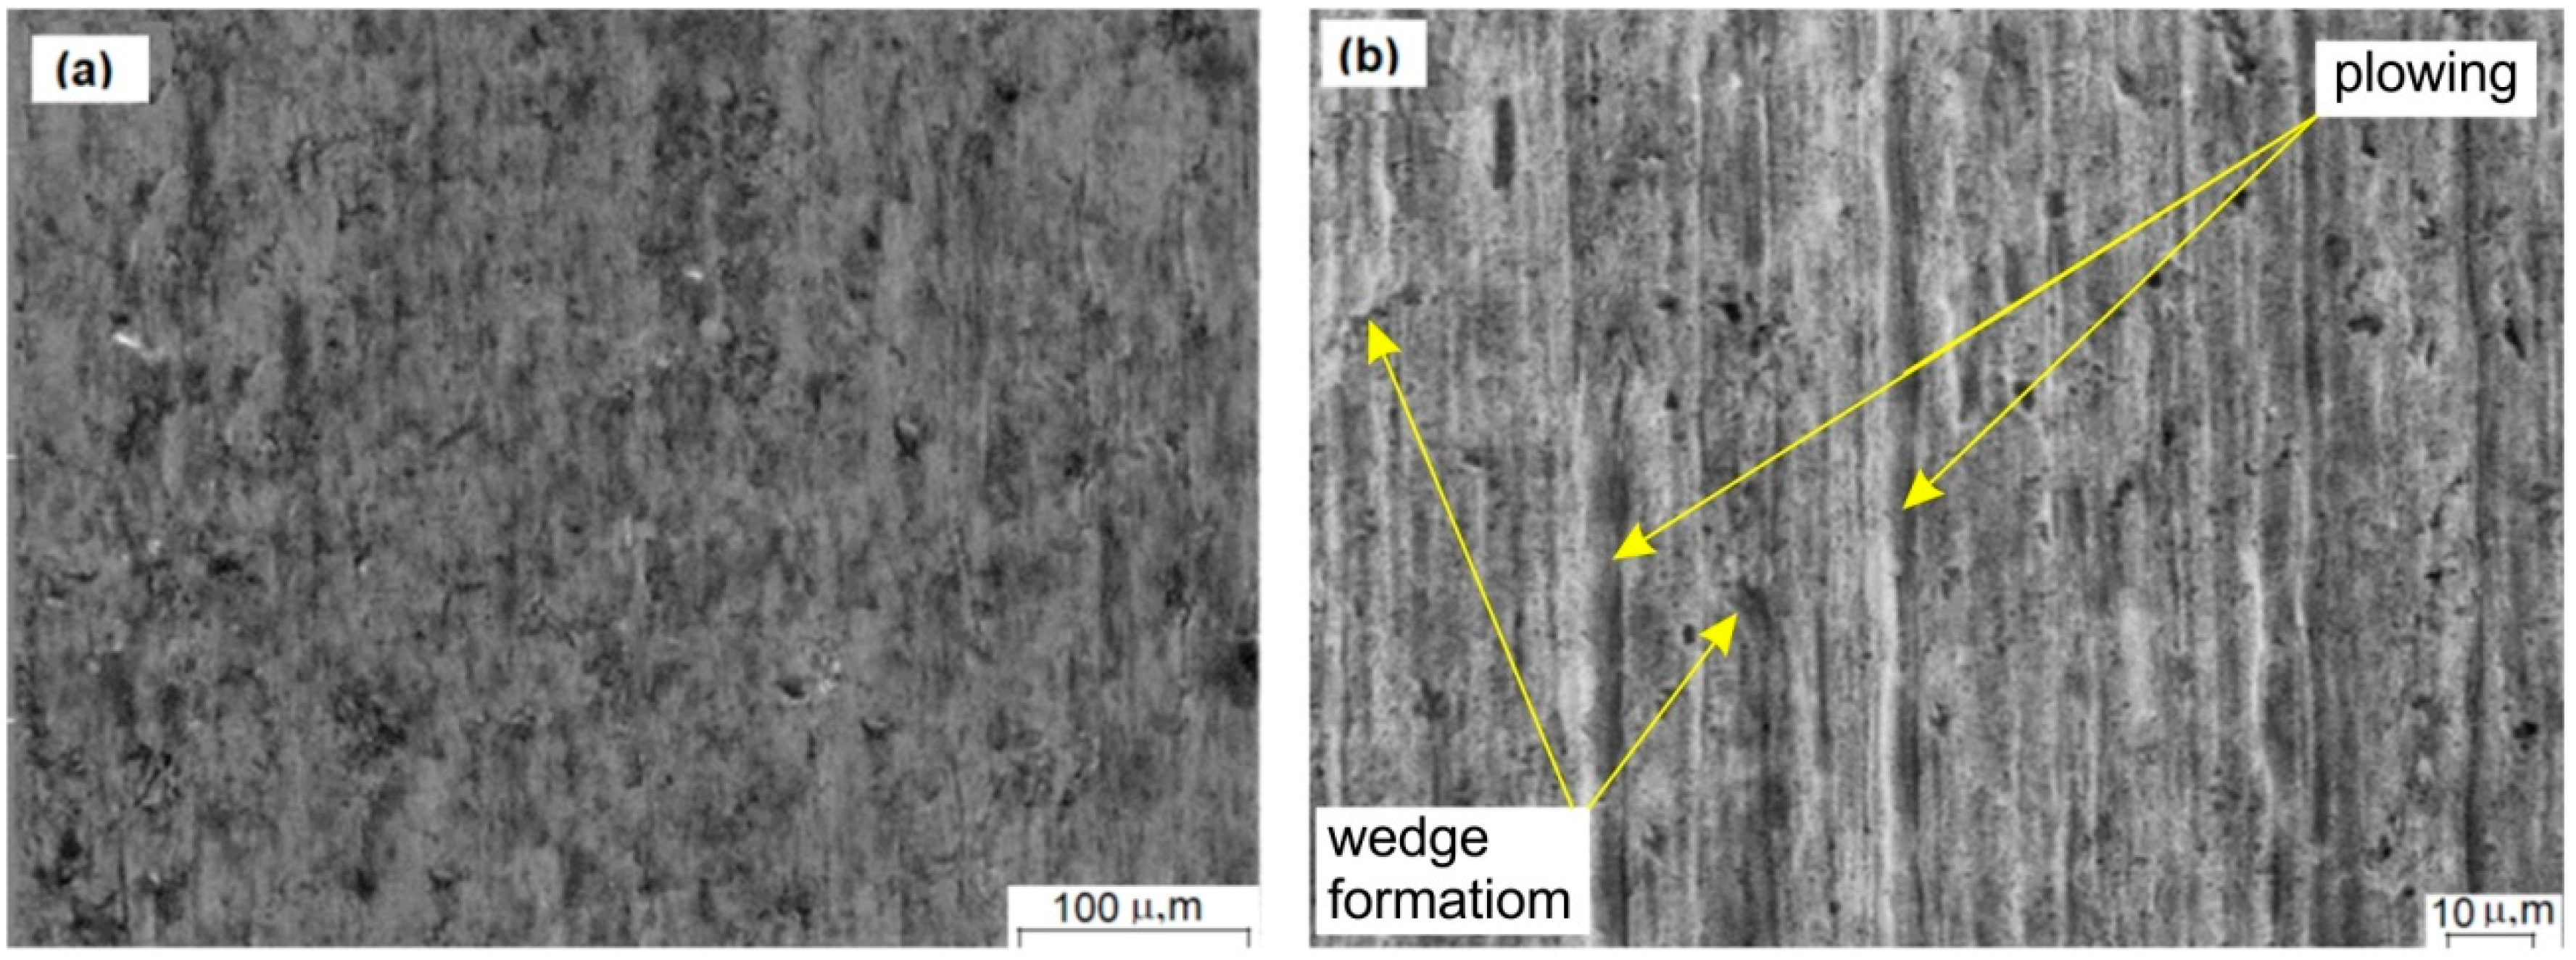
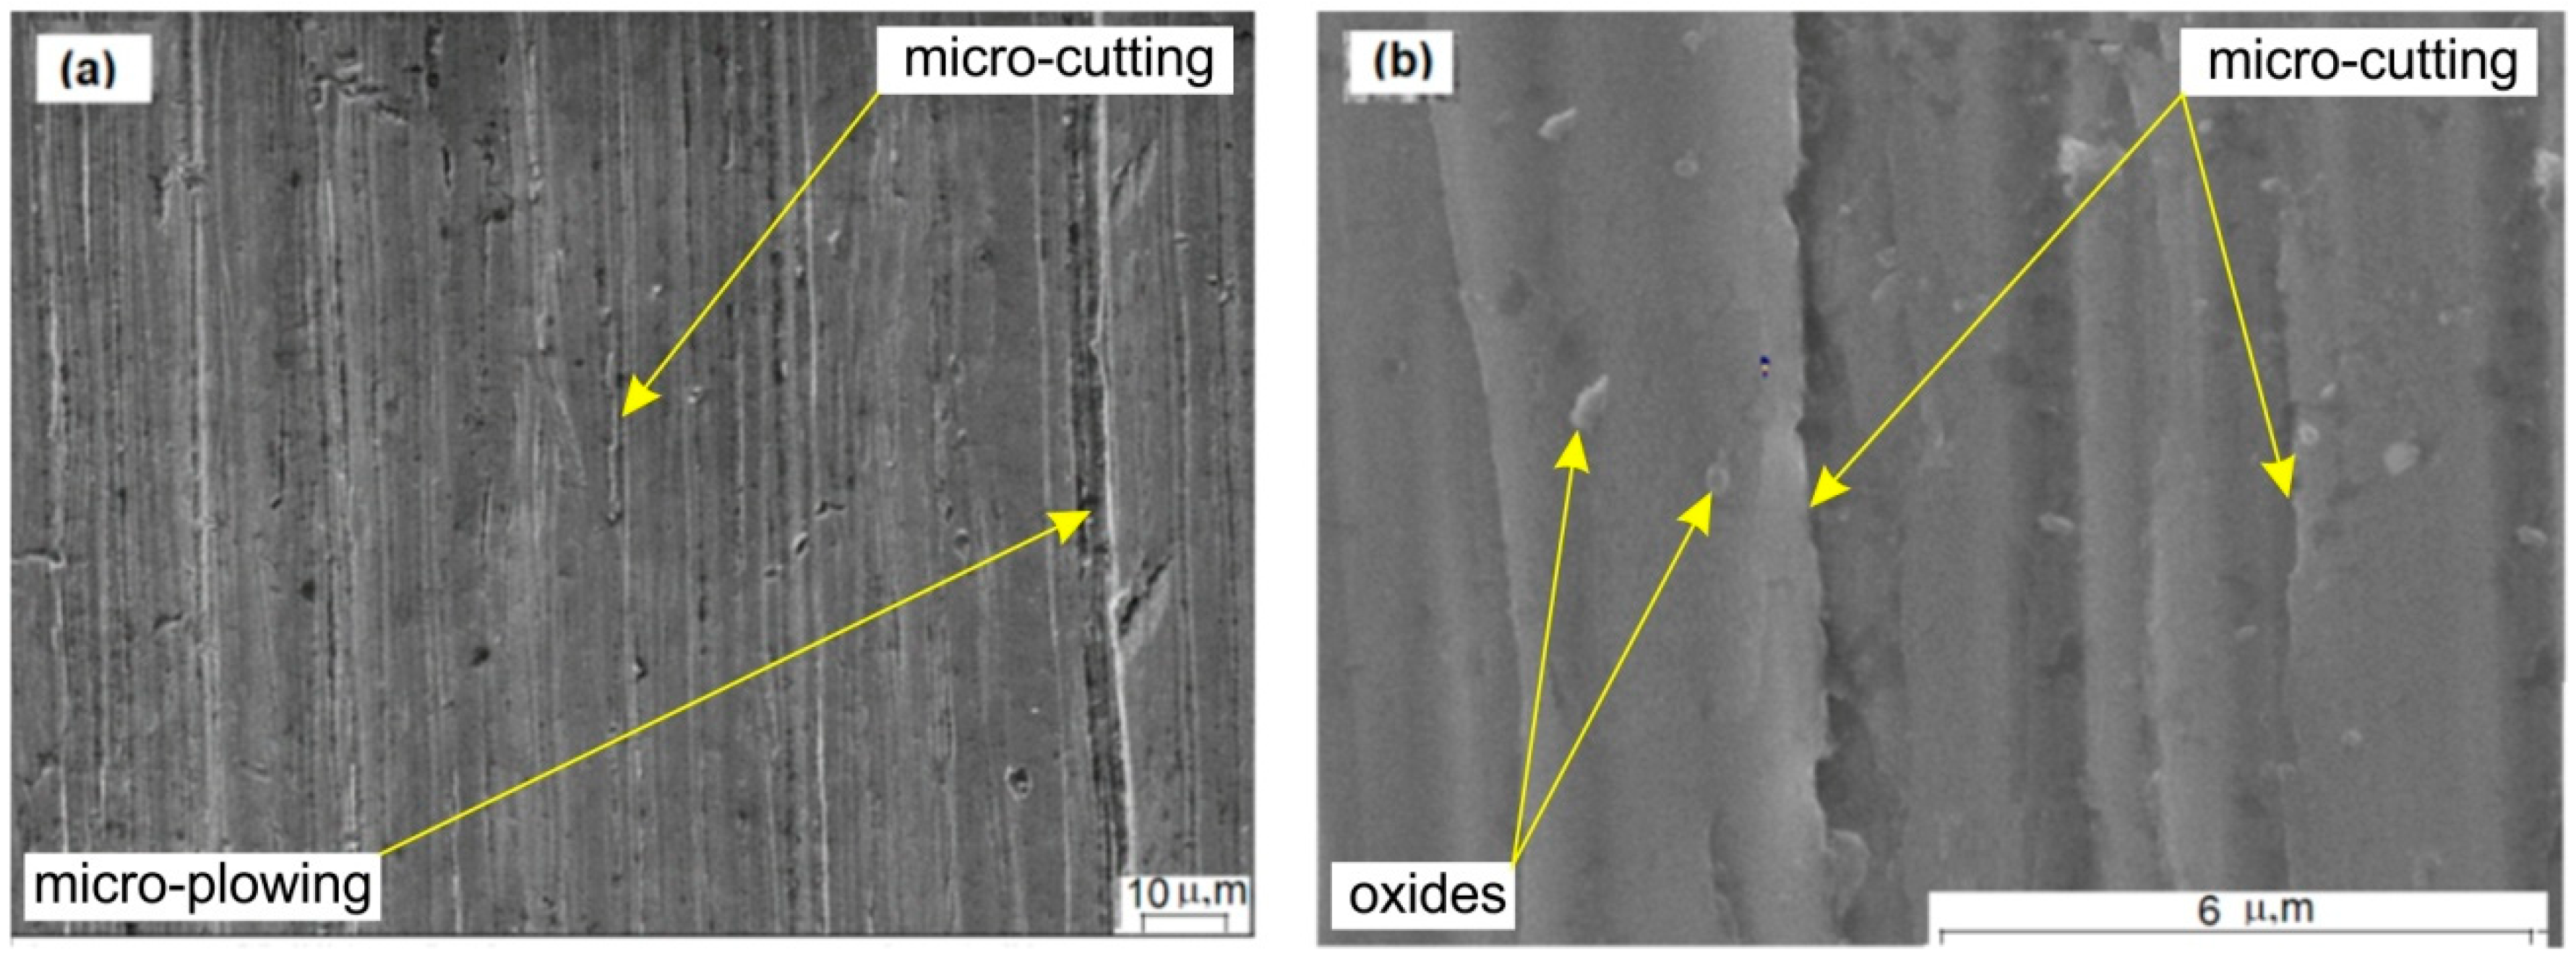
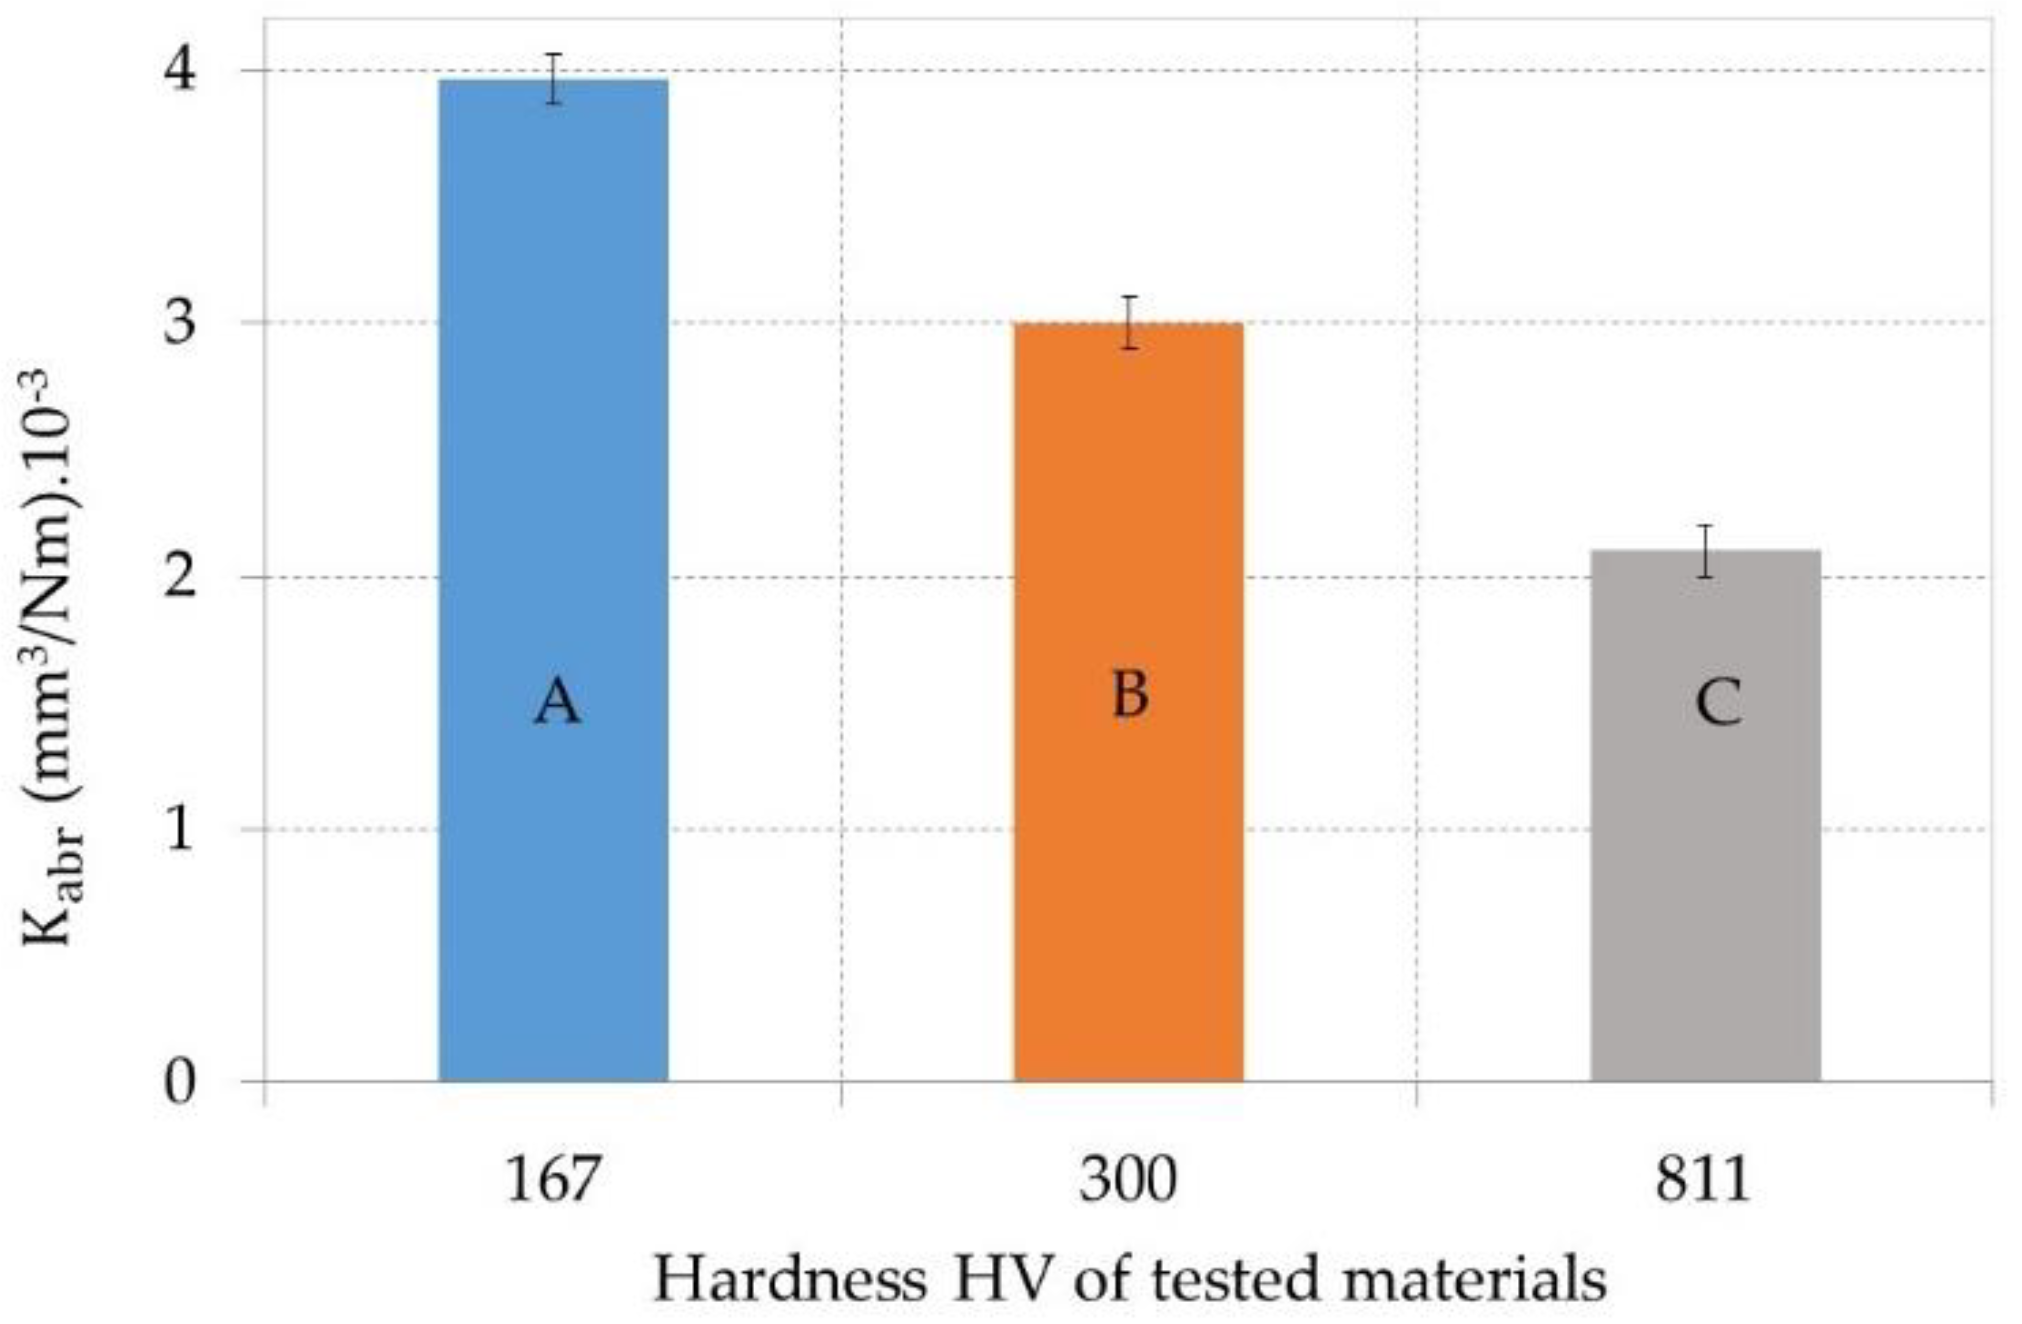
3.2. Results of the Abrasive Wear Test and Mechanism of Wear
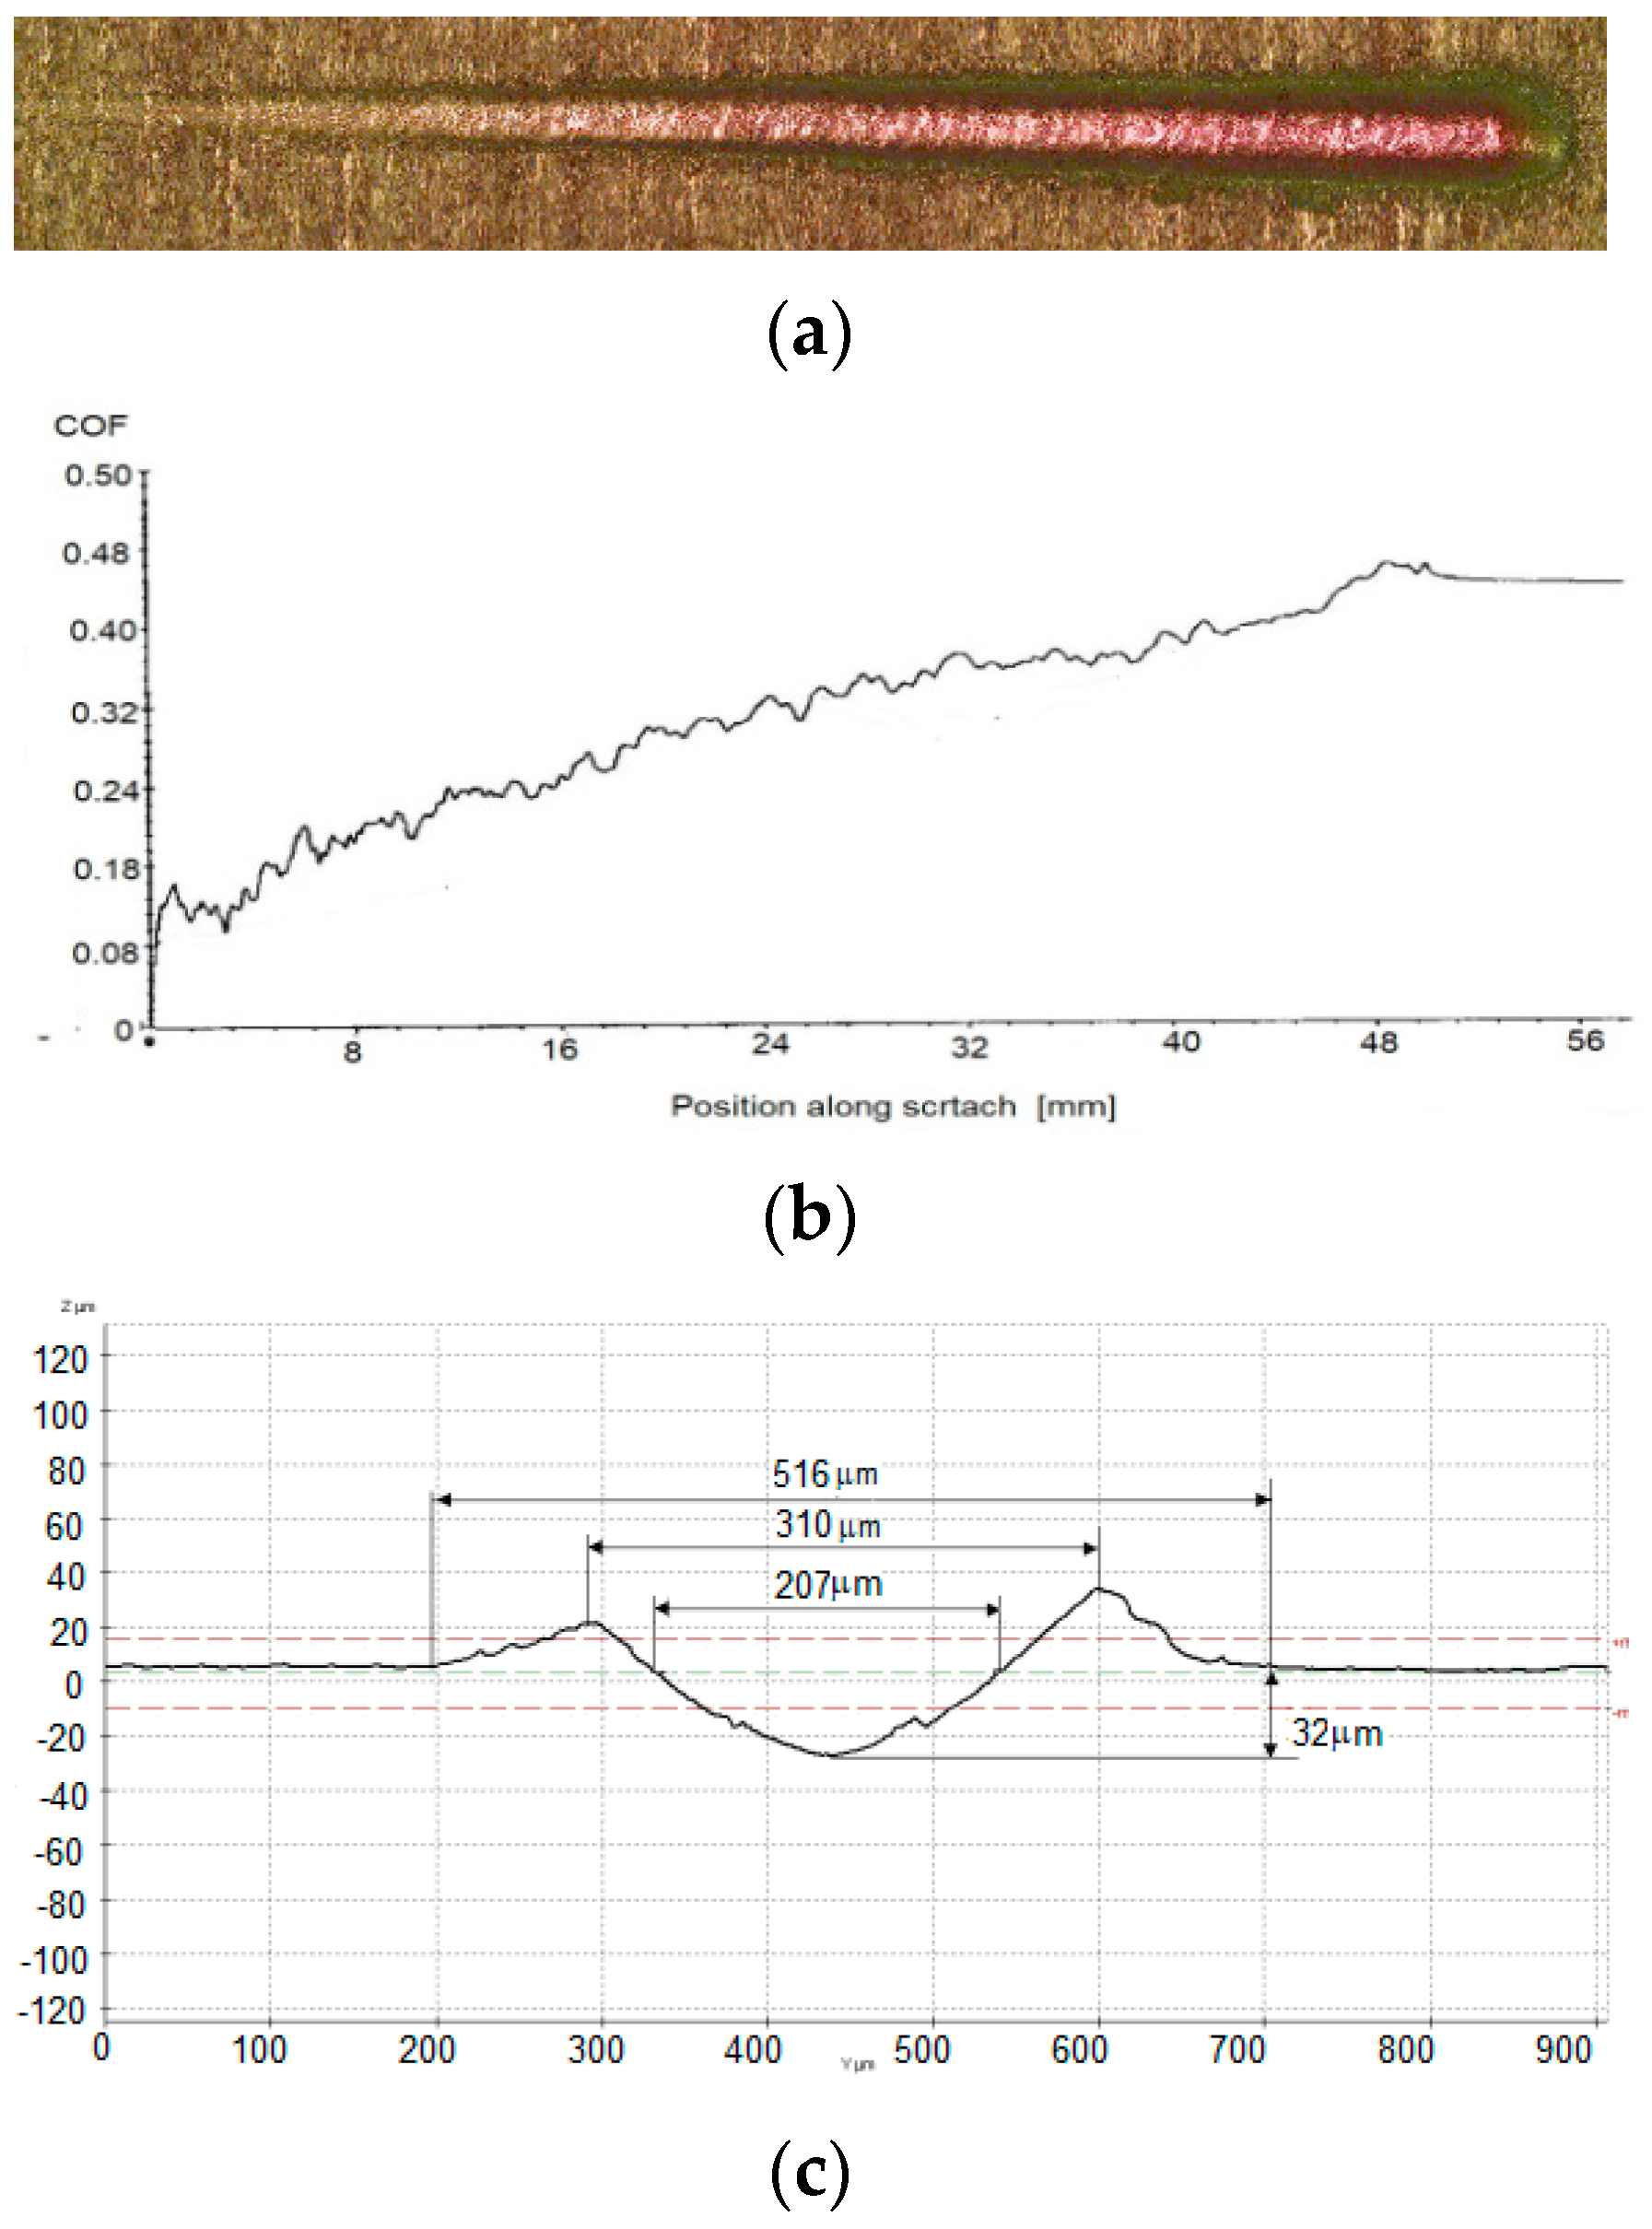
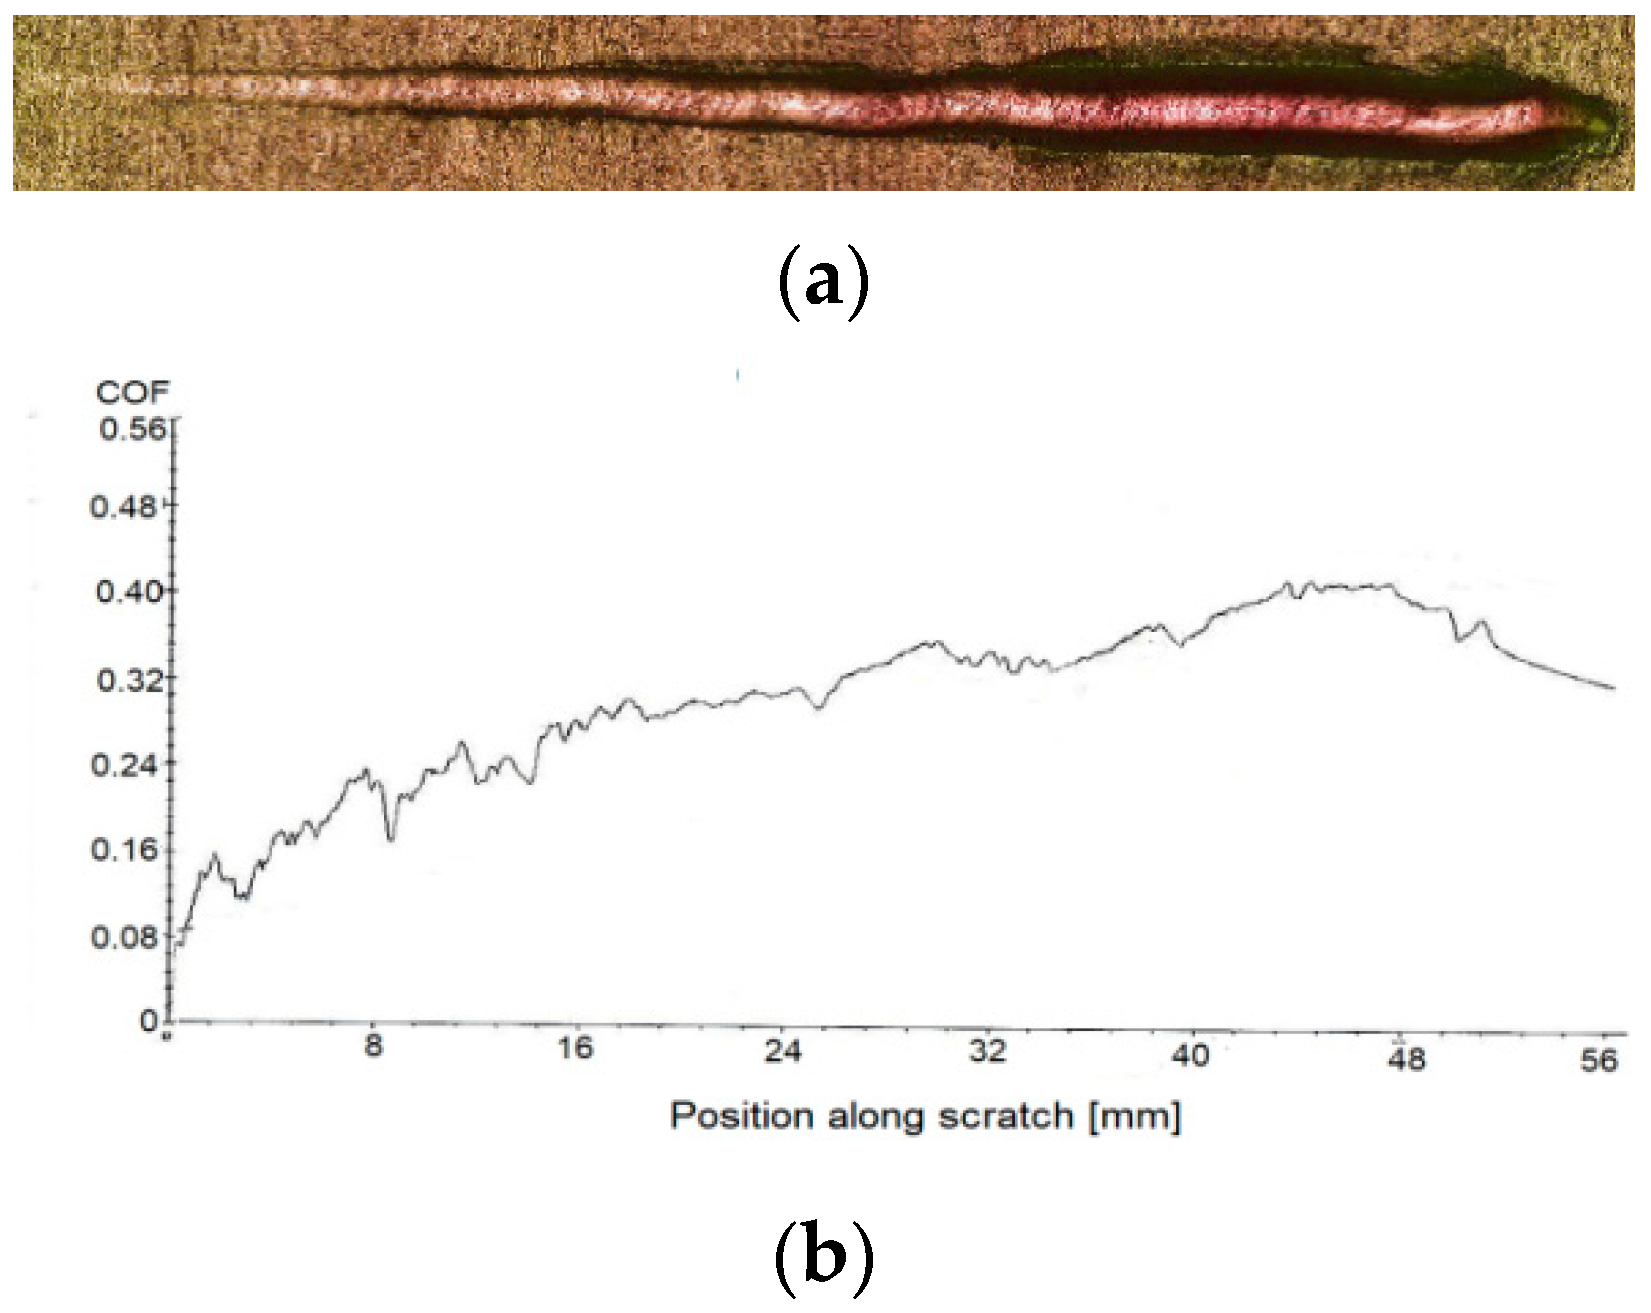
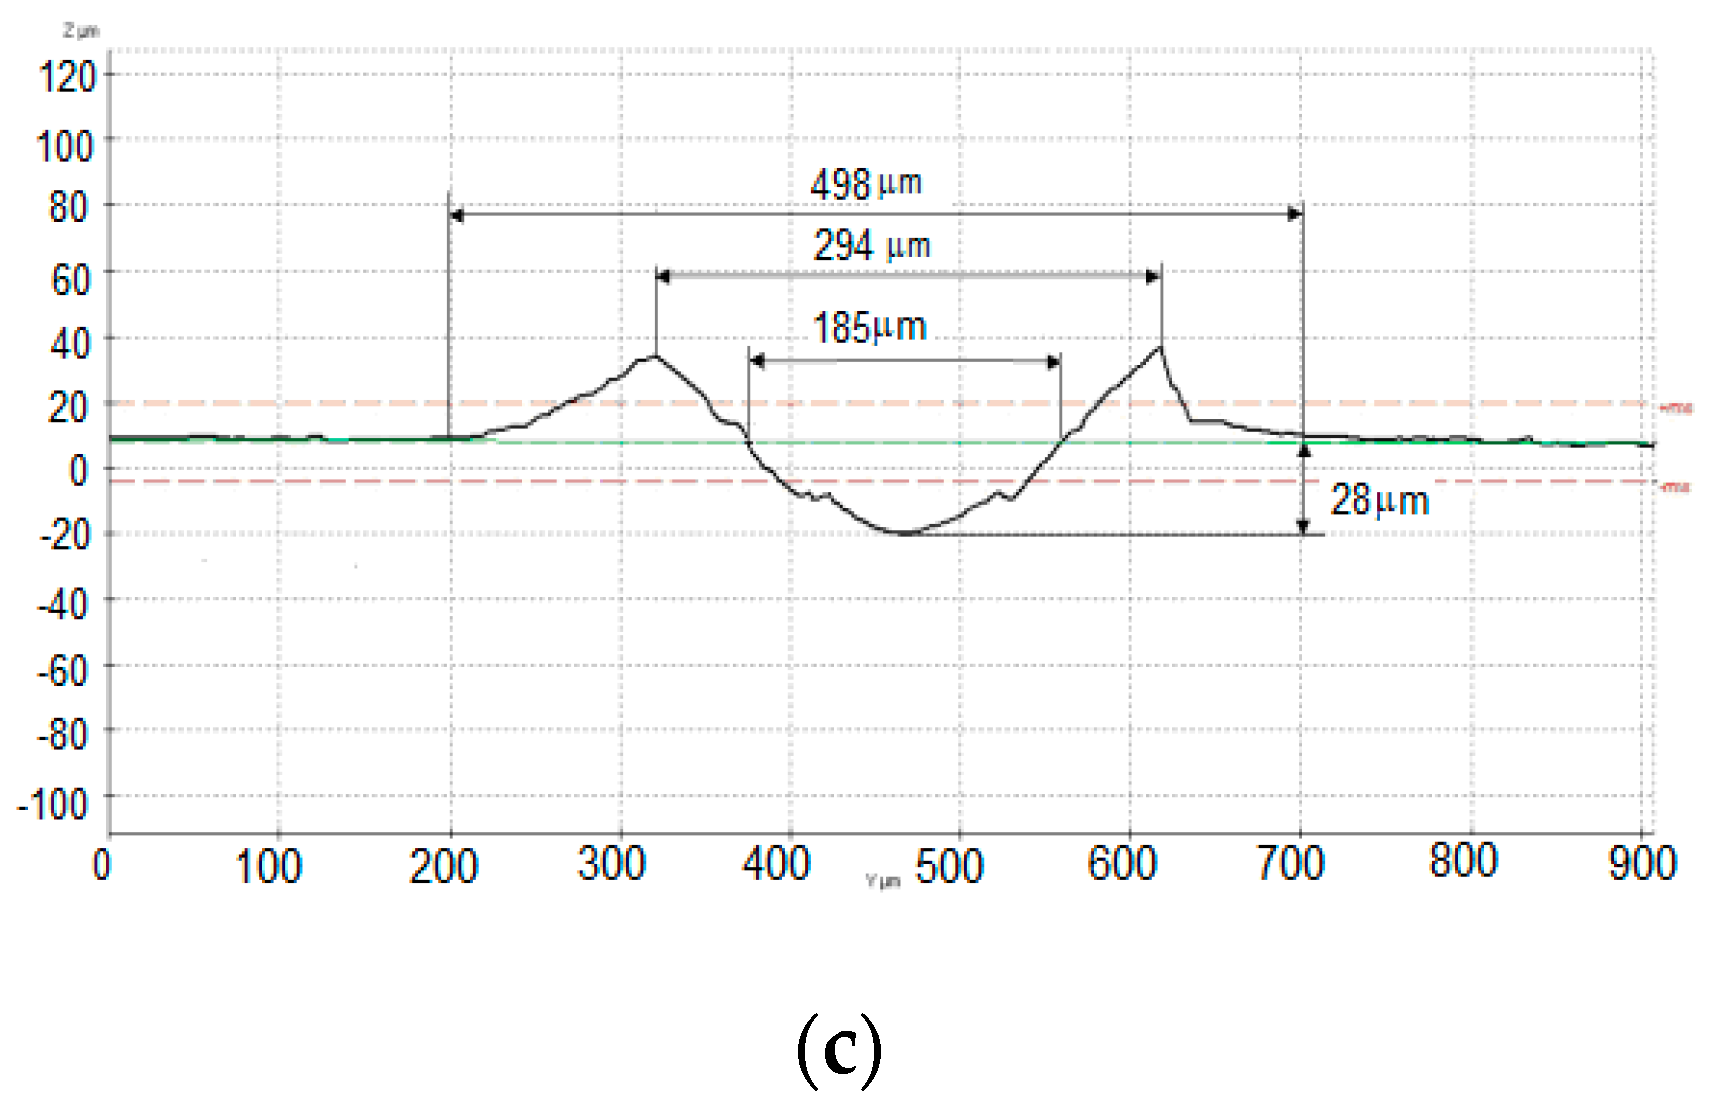
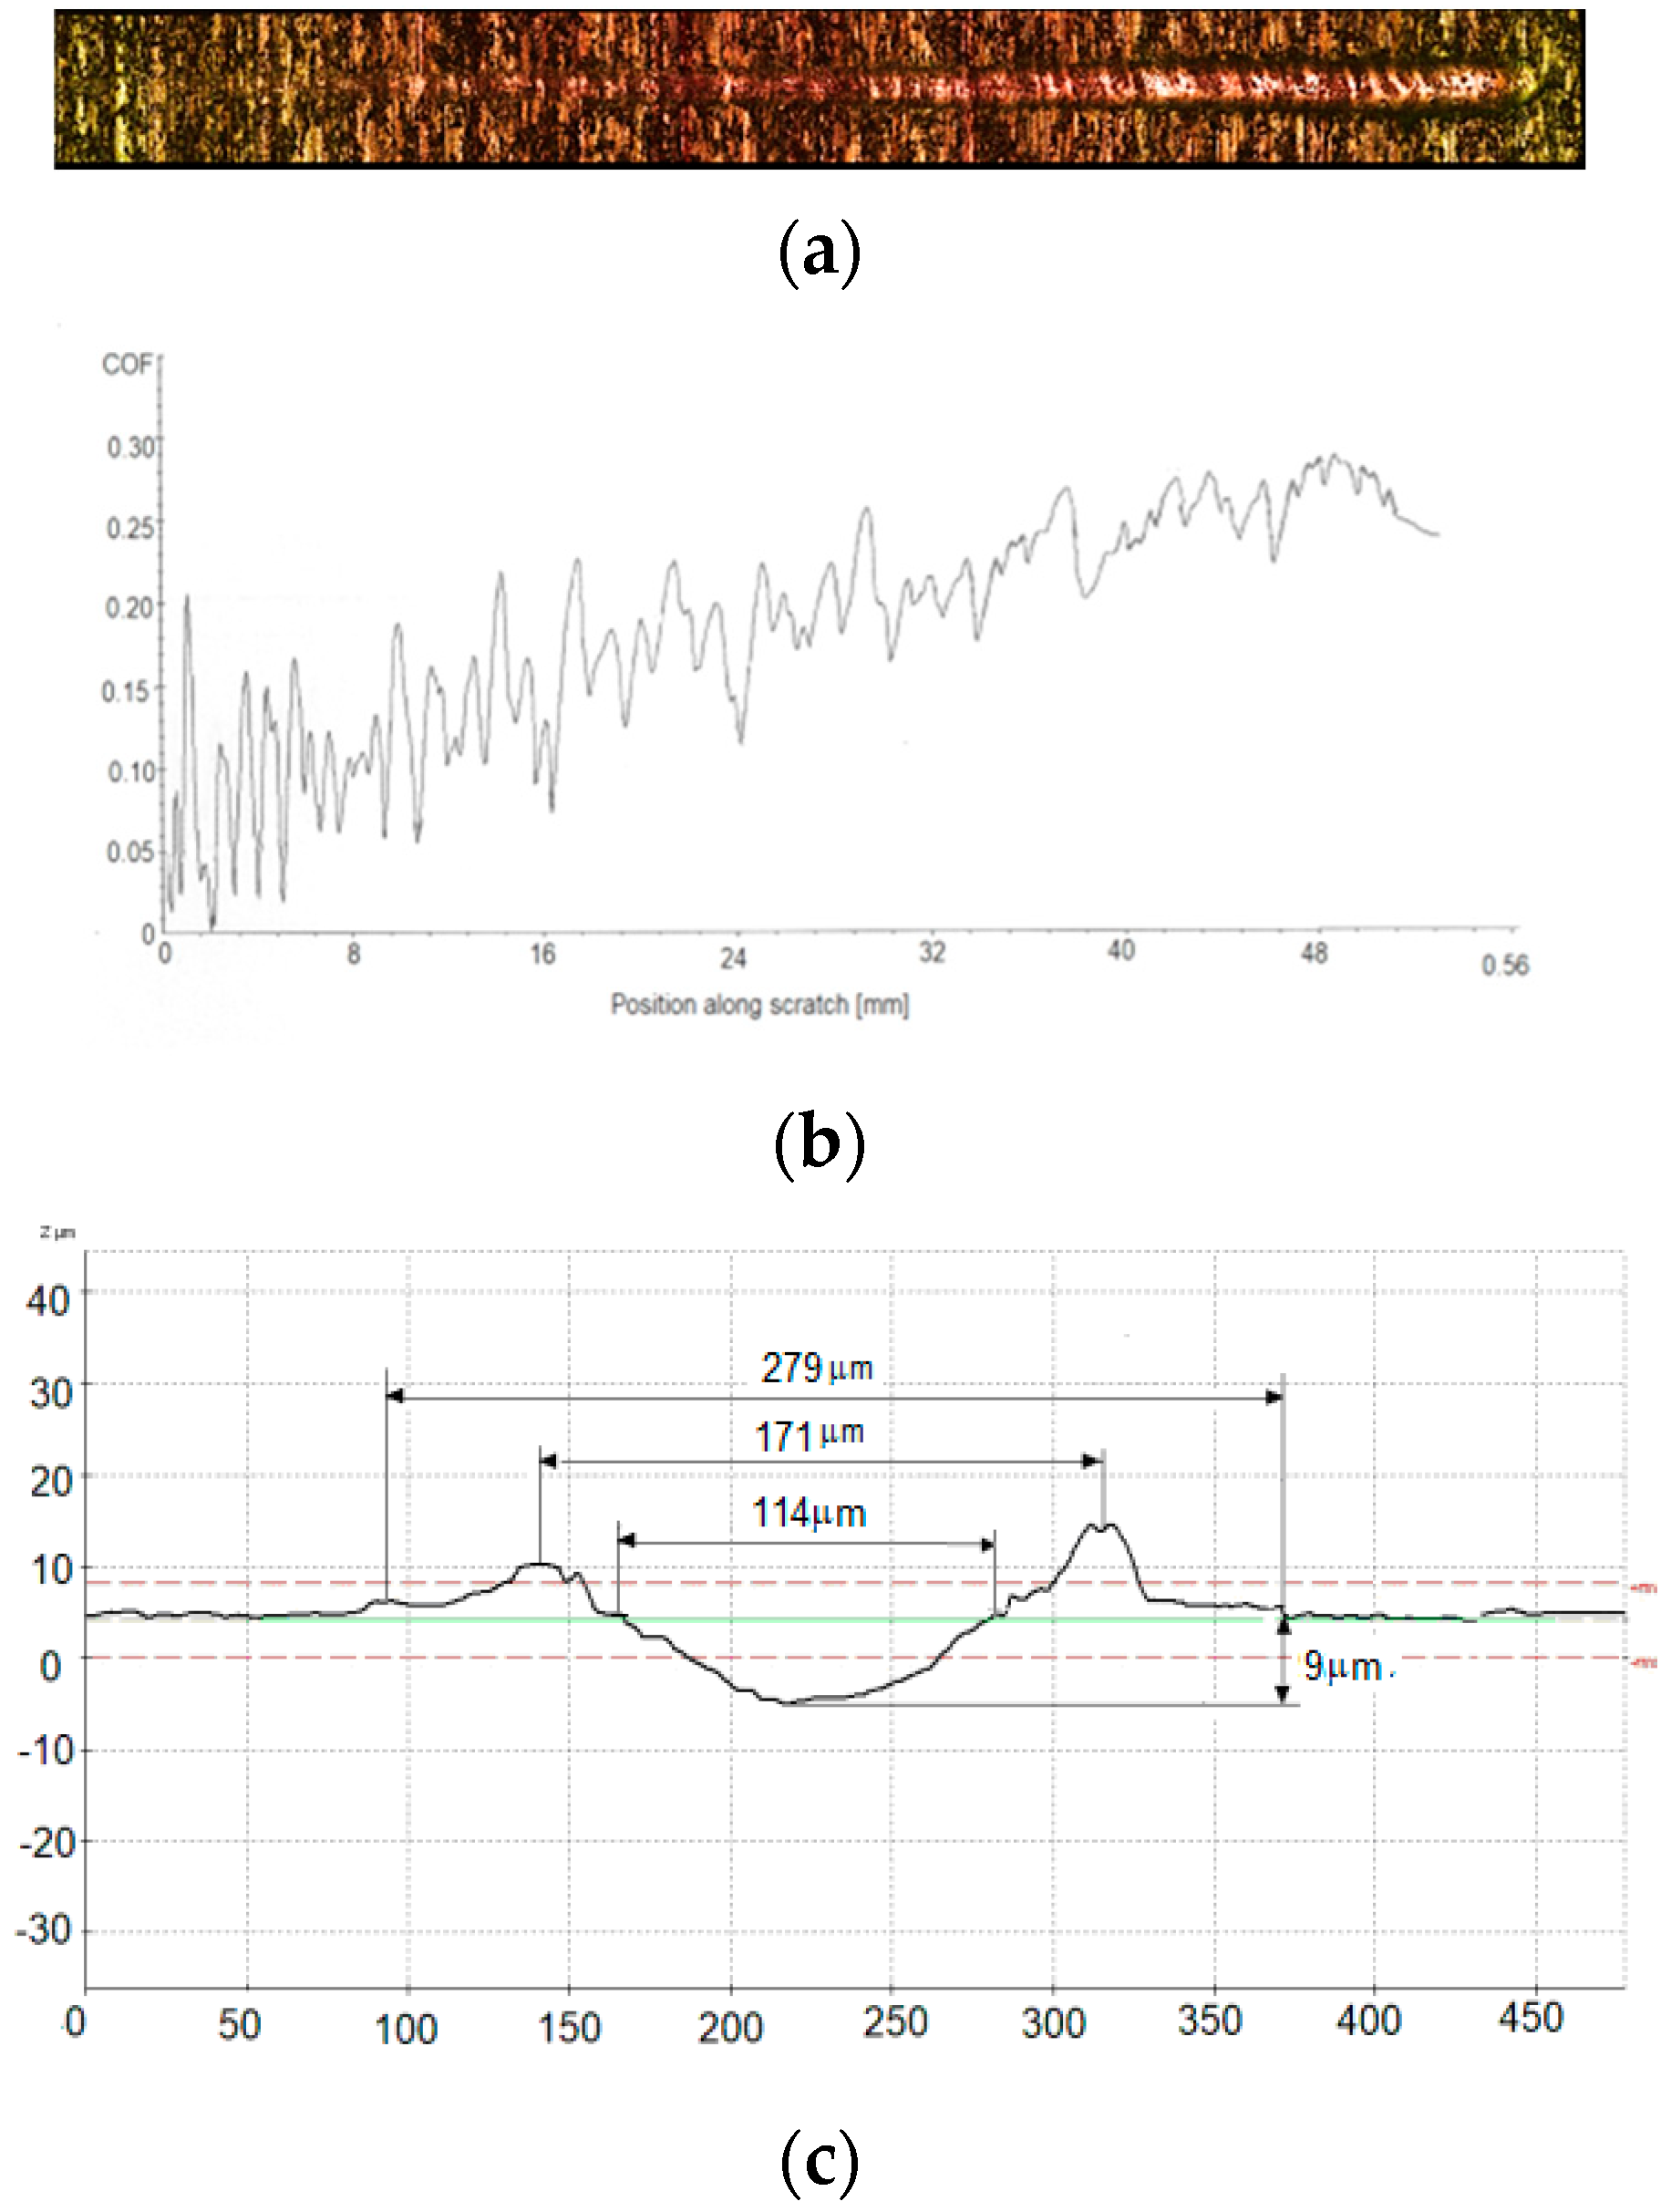
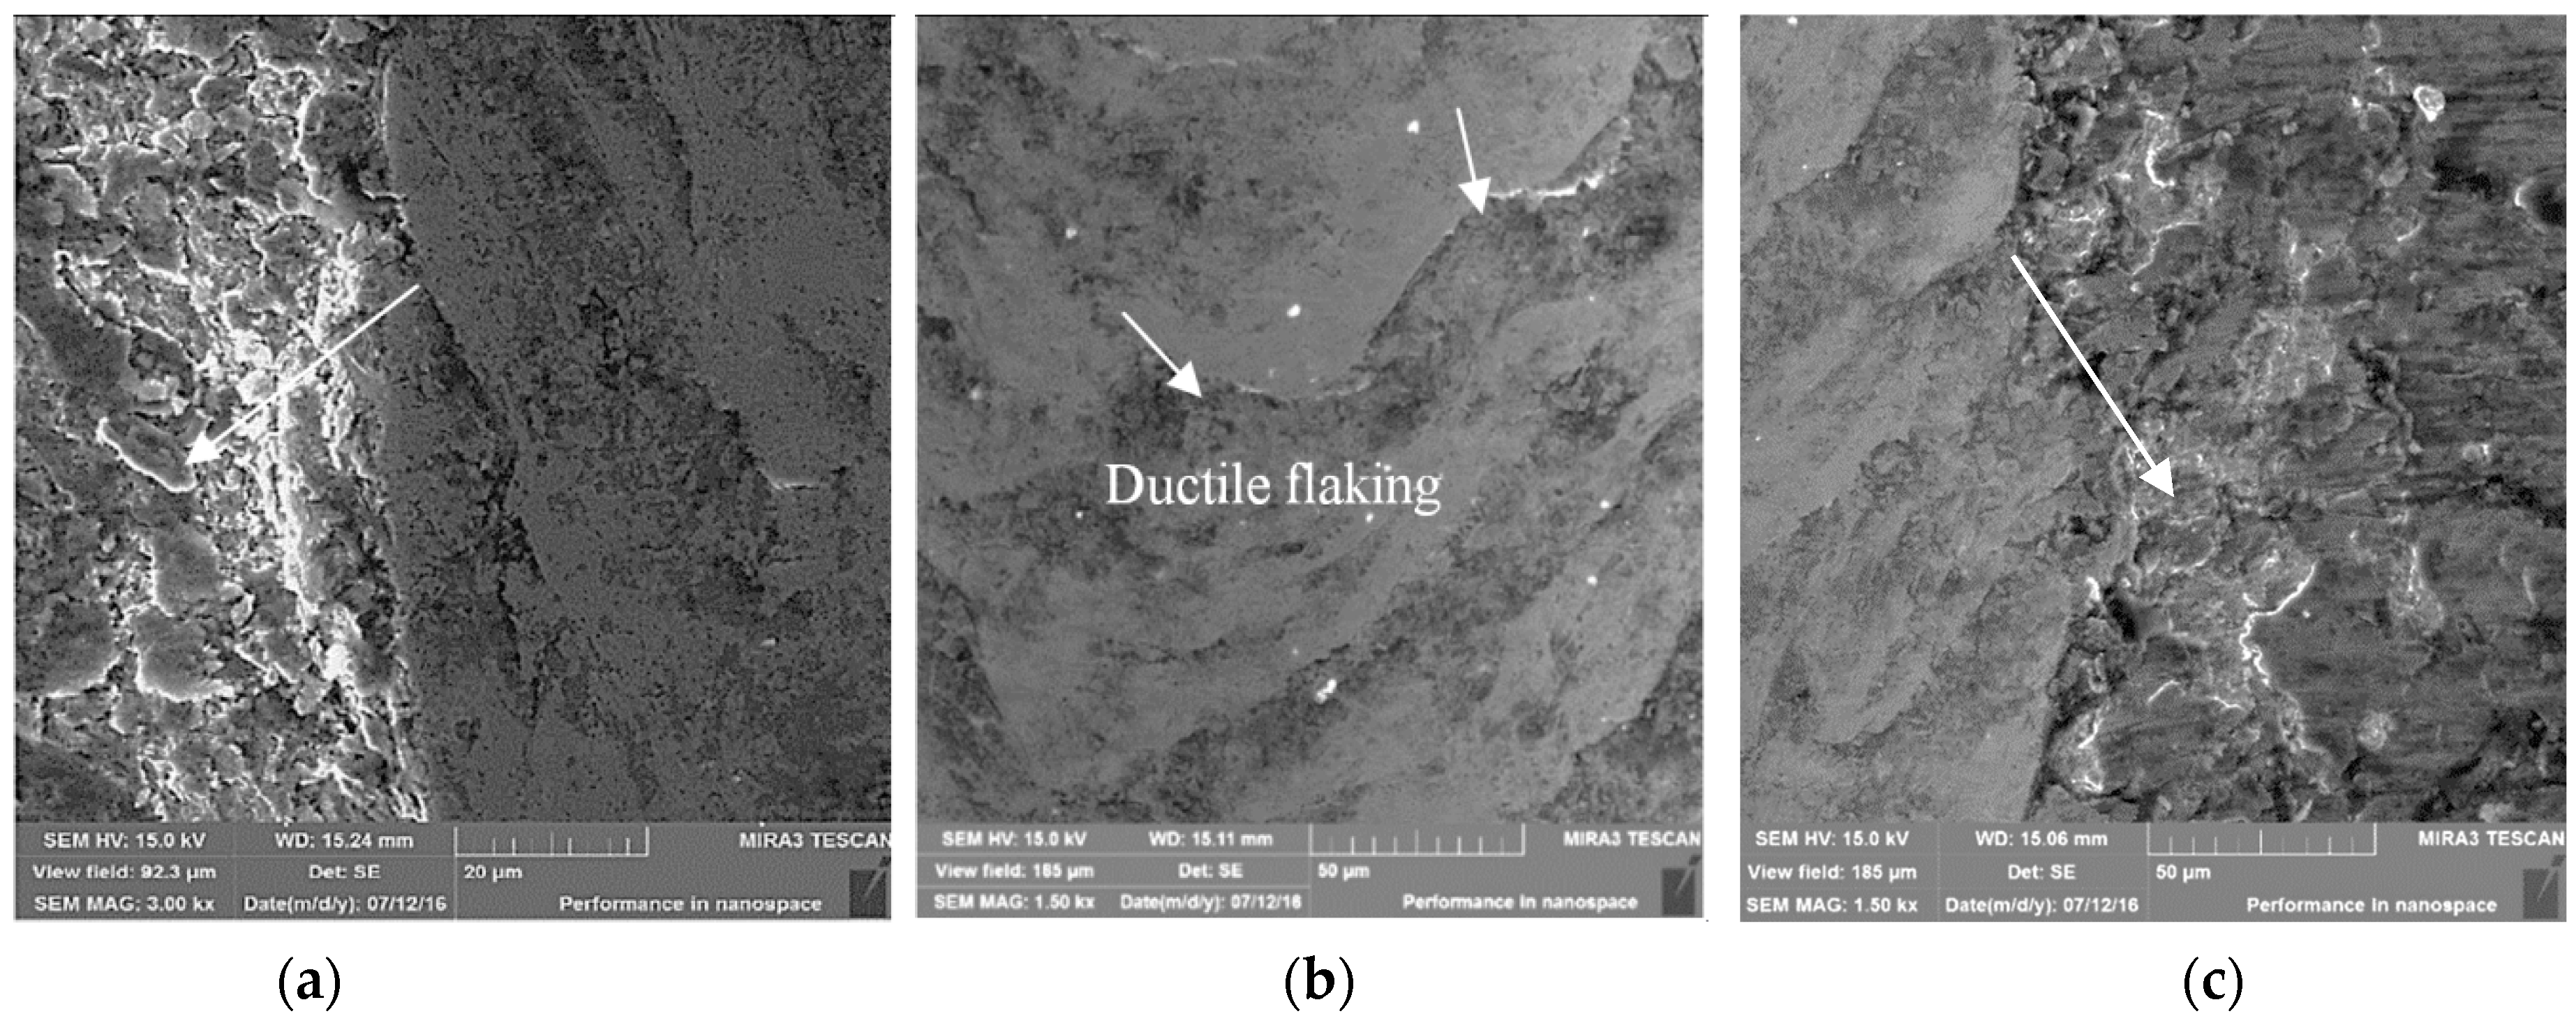
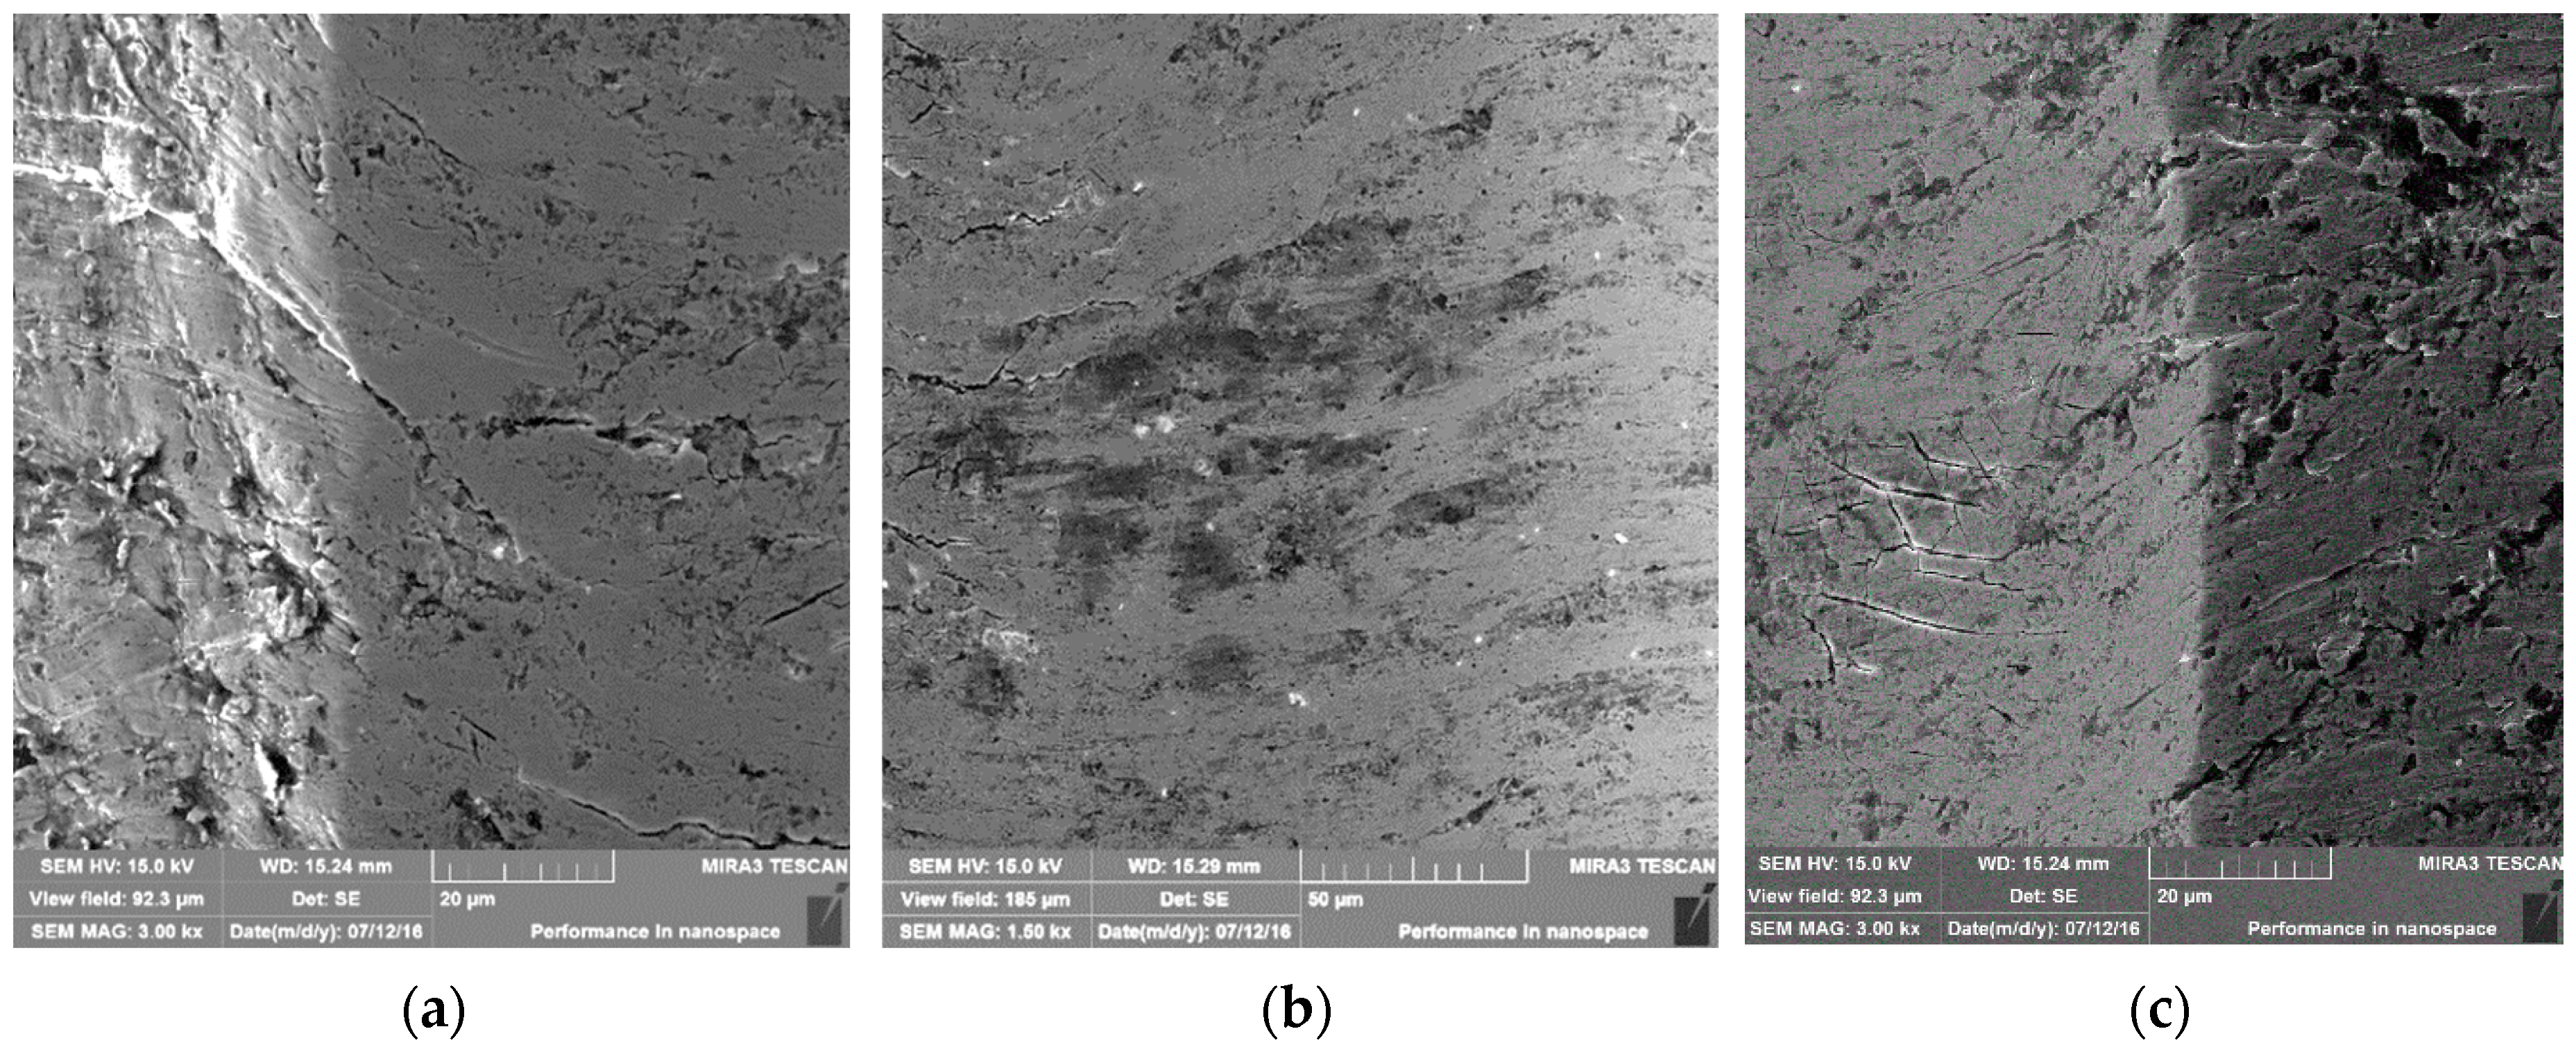
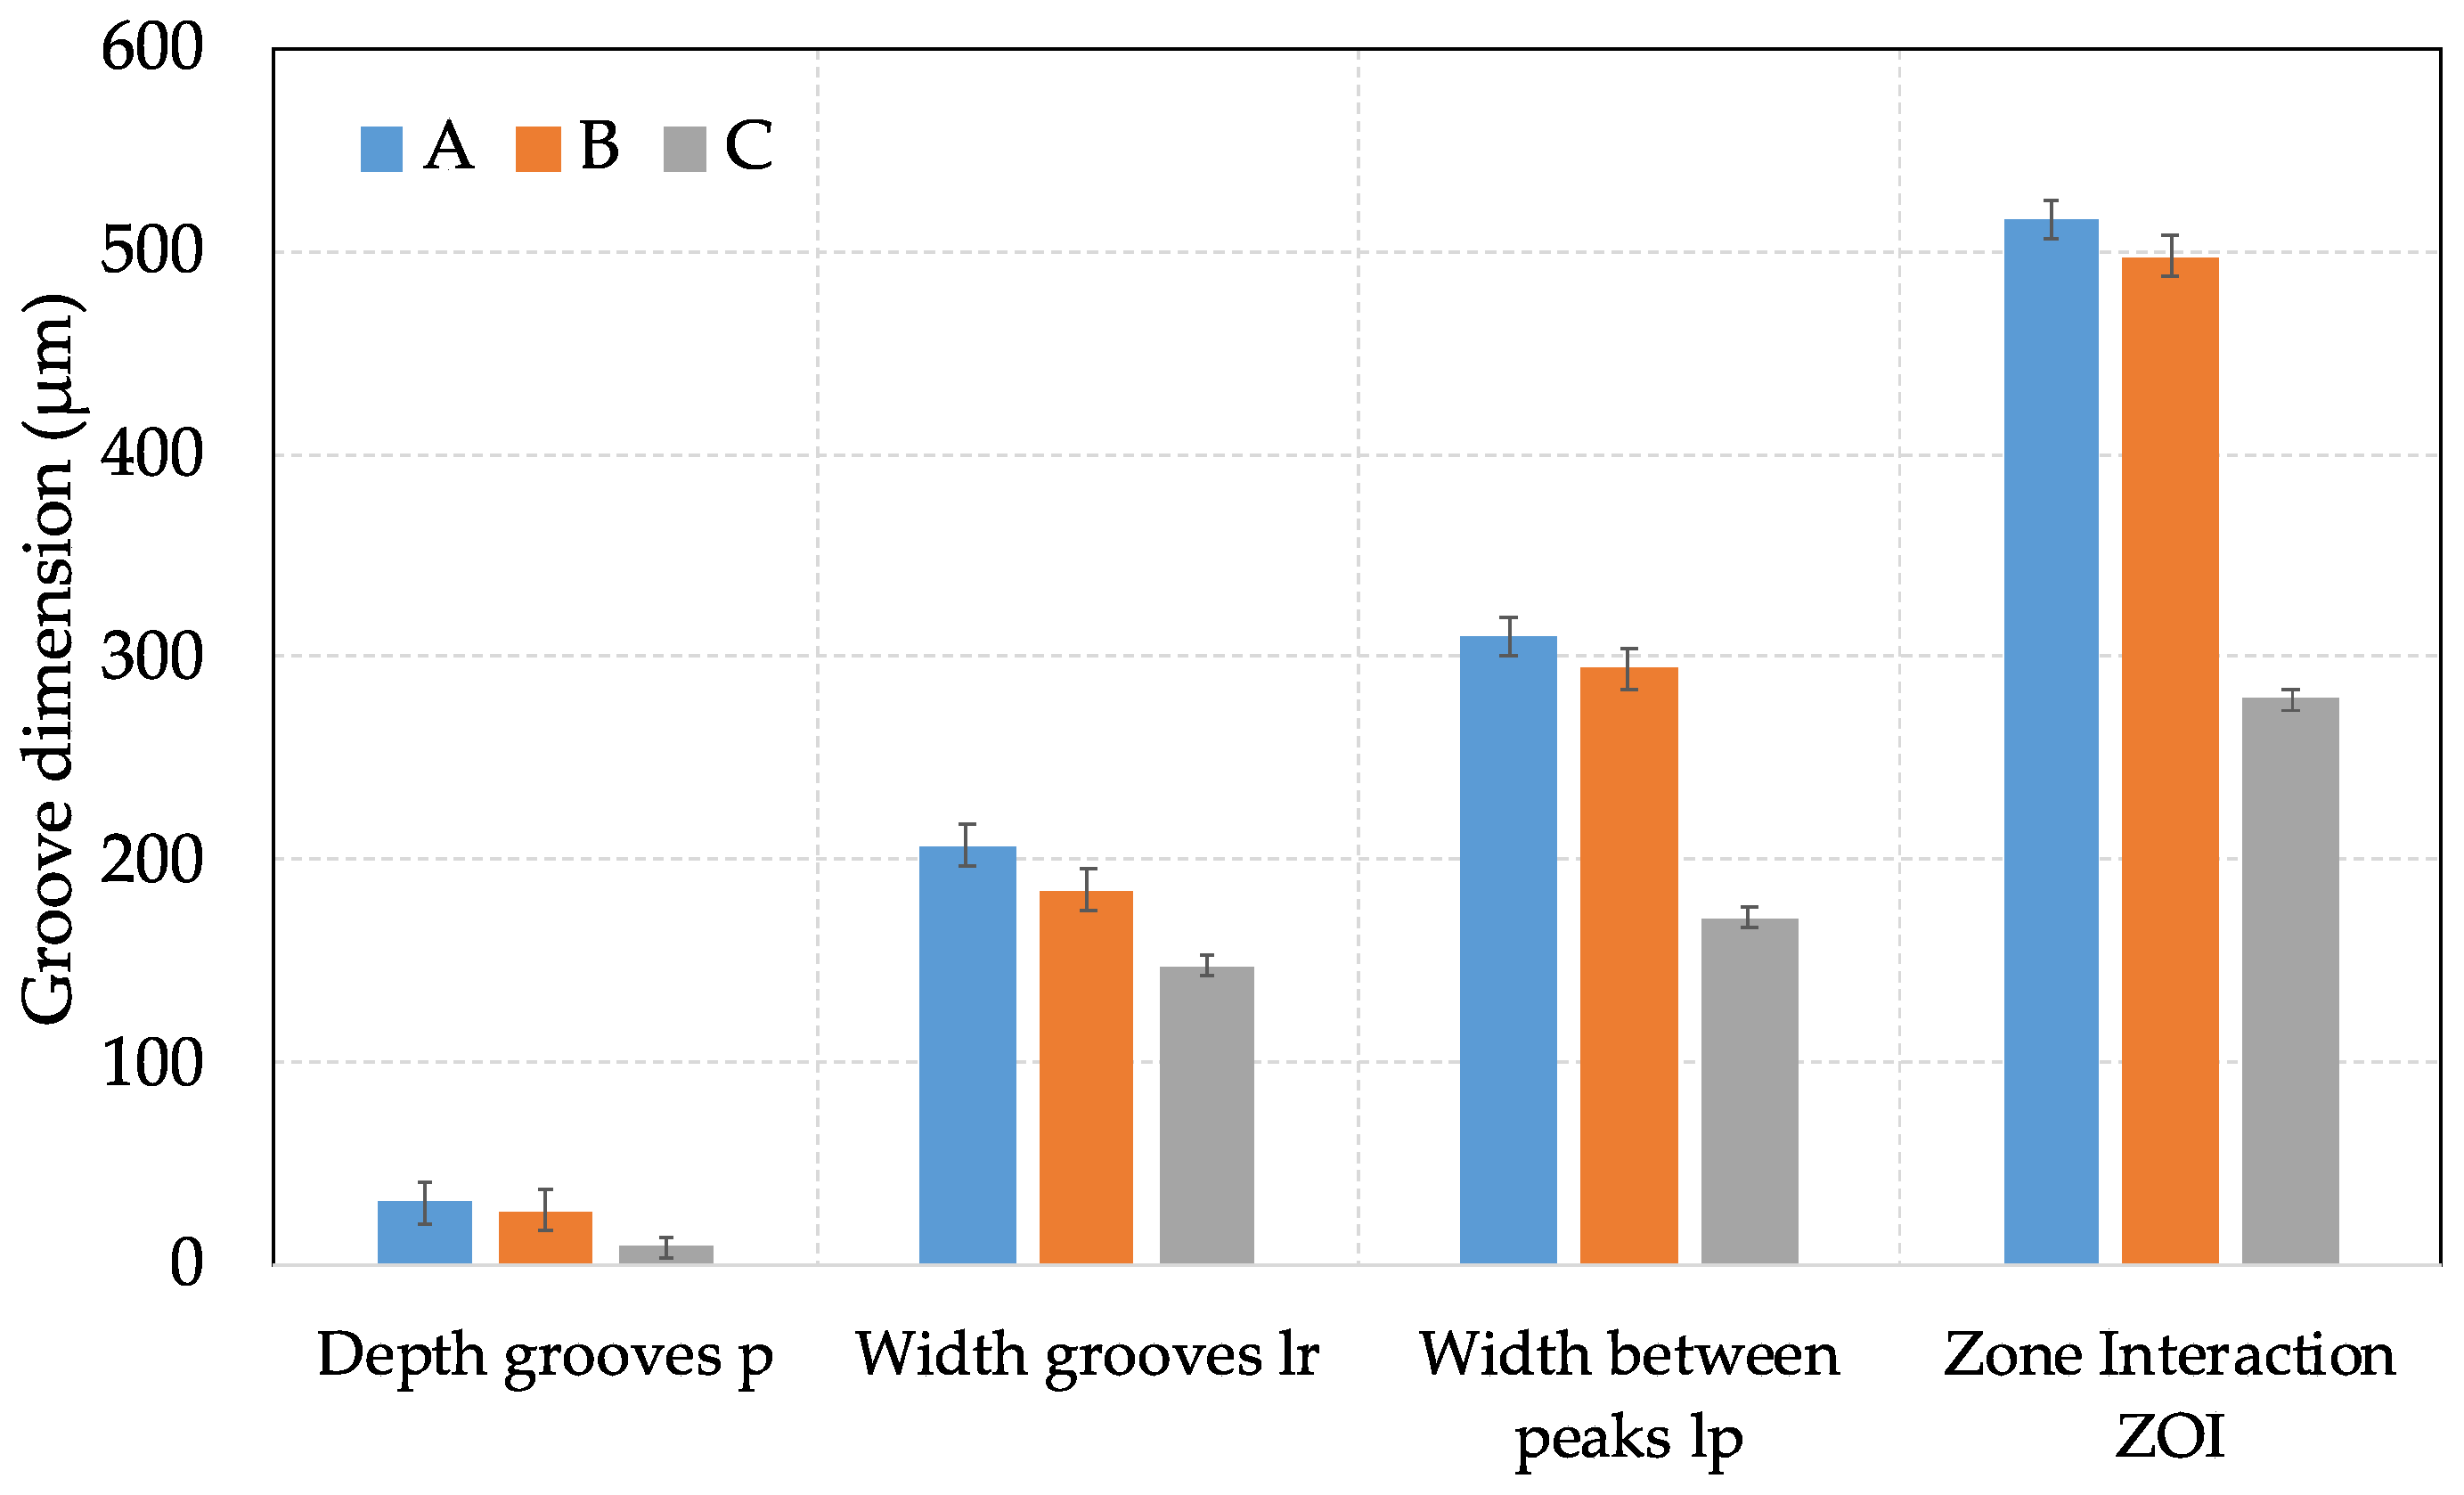
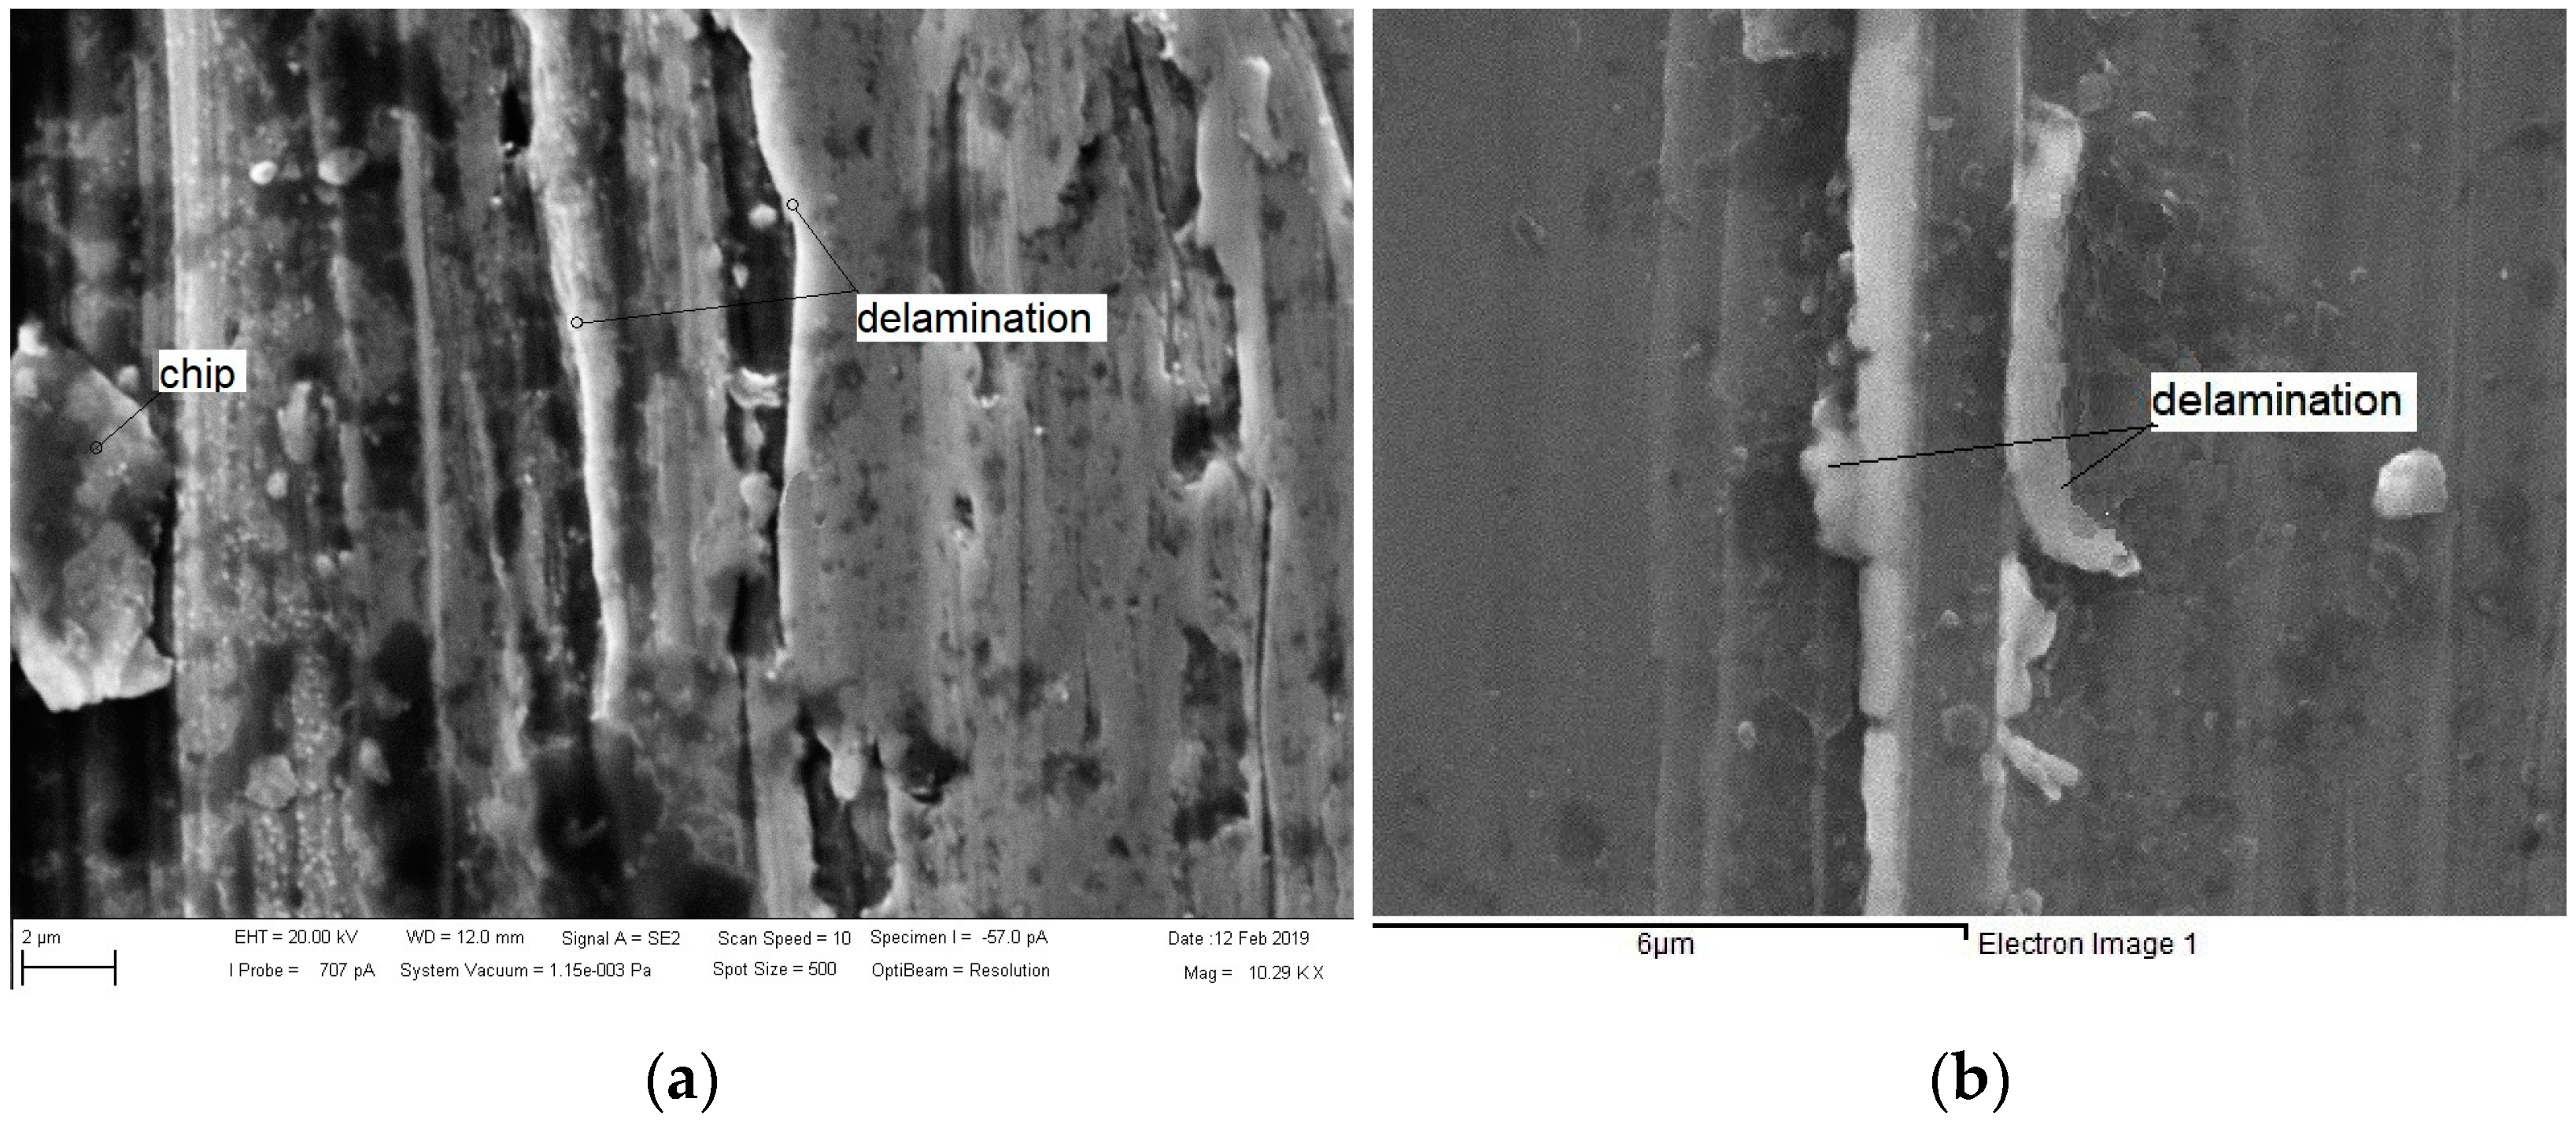
3.3. Scratch Tests Results and Mechanisms of Wear
3.4. Impact of Different Testing Methods on Selected Tribological Characteristics
4. Conclusions
- The abrasive wear loss of tested materials is proportional to their hardness. Weld deposit Fluxofil 58 (C) shows the most significant wear resistance amongst the three materials tested.
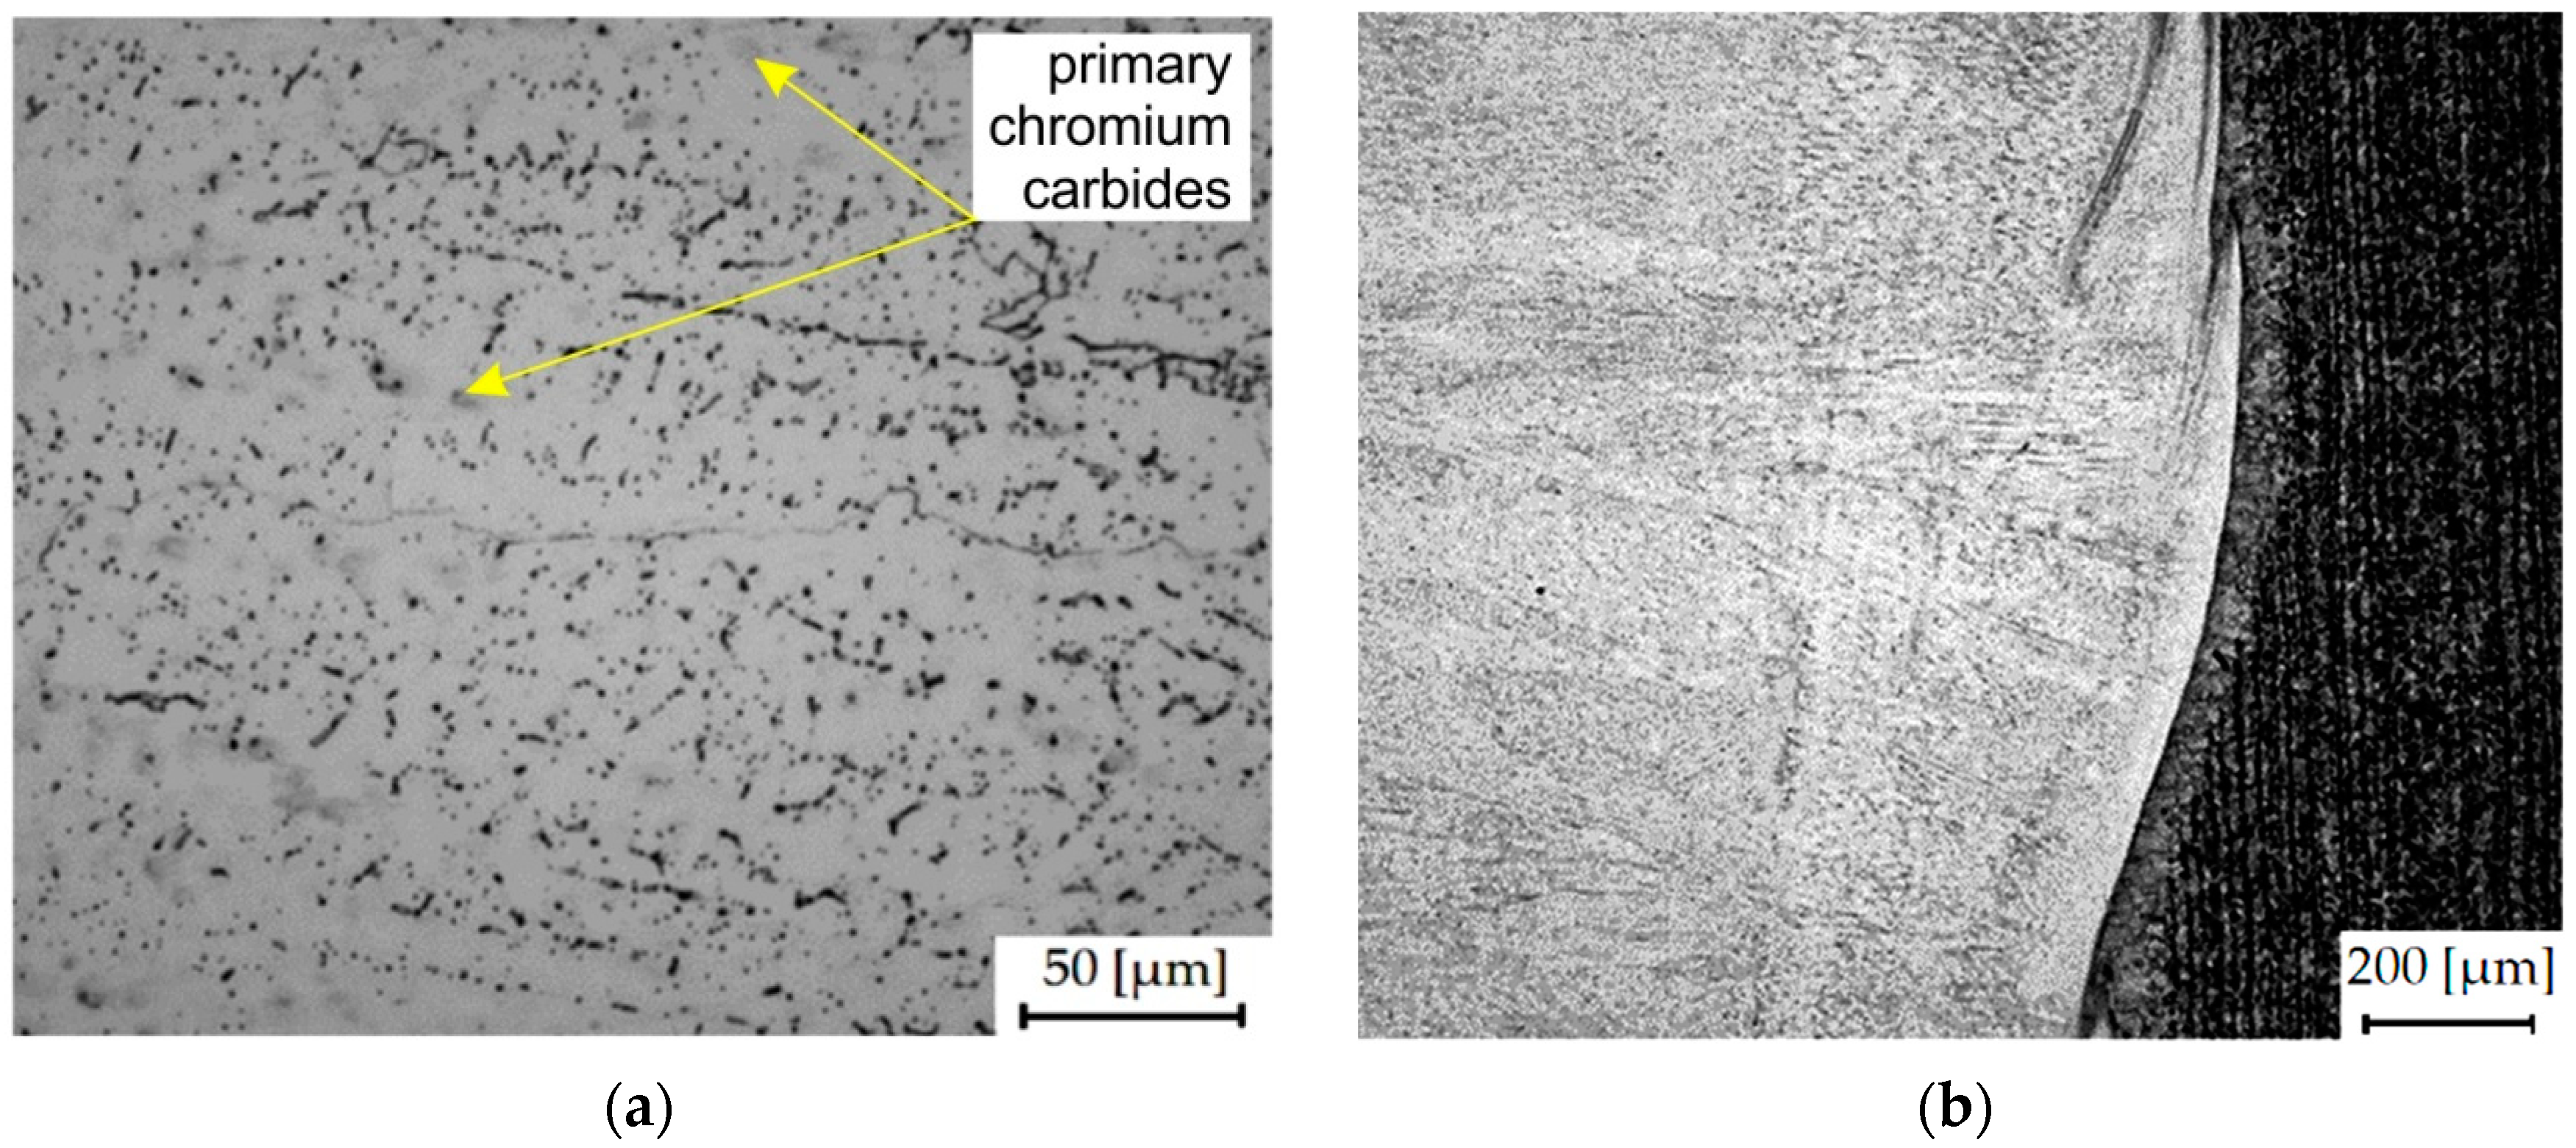
- Weld deposit Fluxofil 58 (C), which shows the most significant wear resistance, formed by homogeneously distributed carbides with the martensitic matrix, is an effective barrier against the entry of abrasives.
- It was demonstrated that the results of selected geometric parameters in the double-pass scratch test are correlated with the measurement of three-body wear tests. Sample hardfacing with Fluxofil 58 (C), with the best abrasion resistance, shows the lowest groove depth after the scratch test.
- The double-pass scratch test method can be used as the preliminary abrasion selection of materials for conditions of the real abrasive wear processes.
- The proposed new concept of the double-pass scratch test indicates the possibility to estimate the abrasion wear resistance of materials relatively quickly and easily.
Author Contributions
Funding
Data Availability Statement
Acknowledgments
Conflicts of Interest
References
- Rabinowicz, E. Friction and Wear of Materials; J. Wiley and Sons: New York, NY, USA, 1965. [Google Scholar]
- Sundstrom, A.; Rendnón, J.; Olsson, M. Wear behaviour of some low alloyed steels under combined impact/abrasion contact conditions. Wear 2001, 250, 744–754. [Google Scholar] [CrossRef]
- Bhushan, B. Principles and Applications of Tribology; J. Wiley and Sons: New York, NY, USA, 1999. [Google Scholar]
- Misra, A.; Finnie, I. A Review of the abrasive wear of metals. J. Eng. Mater. Technol. 1982, 104, 94–101. [Google Scholar] [CrossRef]
- Gahr, K.H.Z. Microstructure and Wear of Materials; Tribology Series 10; Elsevier: Amsterdam, Holland, 1987. [Google Scholar]
- Buchanan, V.E.; Shipway, P.H.; McCartney, D.G. Microstructure and abrasive wear behaviour of shielded metal arc welding hardfacings used in the sugarcane industry. Wear 2007, 263, 99–110. [Google Scholar] [CrossRef]
- Hutchings, I.M. Tribology: Friction and Wear of Engineering Materials. In Tribology; Arnold, E., Ed.; Butterworth-Heinemann: Cambridge, UK, 1992; pp. 133–171. [Google Scholar]
- Rendón, J.; Olsson, M. Abrasive wear resistance of some commercial abrasion resistant steels evaluated by laboratory test methods. Wear 2009, 267, 2055–2061. [Google Scholar] [CrossRef]
- Budinski, K.G.; Budinski, S.T. On replacing three-body abrasion testing with three-body abrasion testing. Wear 2017, 376–377, 1859–1865. [Google Scholar] [CrossRef]
- Franek, F.; Badisch, E.; Kirchgaßner, M. Advanced Methods for Characterisation of Abrasion/Erosion Resistance of Wear Protection Materials. FME Trans. 2009, 37, 61–70. [Google Scholar]
- Wirojanupatump, S.; Shipway, P.H. Abrasion of mild steel in wet and dry conditions with the rubber and steel wheel abrasion apparatus. Wear 2000, 239, 91–101. [Google Scholar] [CrossRef]
- Feugeas, J.; Rico, L.; Nosei, L.; Gómez, B.; Bemporad, E.; Lesage, J. Ferrón. Austenite modification of AISI 316L SS by pulsed nitrogen ion beams generated in dense plasma focus discharges. Surf. Coat. Technol. 2010, 204, 1193–1199. [Google Scholar] [CrossRef]
- Wang, X.; Liu, Z.; Chen, Y.; Sun, J.; He, Q.; Liu, Q.; Liu, G.; Xie, K. Abrasive resistance and corrosion properties of AISI 316 sieve via low temperature gaseous nitriding. Surf. Coat. Technol. 2019, 361, 349–356. [Google Scholar] [CrossRef]
- Linghui, S.W.; Linghui, S.; Qiao, S.Y.; Min, M. Effect of Carbide Orientation on Impact-Abrasive Wear Resistance of High-Cr Iron Used in Shot Blast Machine. Tribol. Lett. 2013, 50, 439–448. [Google Scholar]
- Ordoñez, M.F.C.; Amorim, C.L.G.; Krindges, I.; Aguzzoli, C.; Baumvol, I.J.; Figueroa, C.A.; Sinatora, A.; Souza, R.M.; Farias, M.C.M. Microstructure and micro-abrasive wear of sintered yttria-containing 316L stainless steel treated by plasma nitriding. Surf. Coat. Technol. 2019, 374, 700–712. [Google Scholar] [CrossRef]
- Chotěborský, R. Effect of heat treatment on the microstructure, hardness and abrasive wear resistance of high chromium hardfacing. Res. Agric. Eng. 2013, 59, 23–28. [Google Scholar] [CrossRef]
- Badisch, E.; Roy, M. Hardfacing for Wear, Erosion and Abrasion. In Surface Engineering for Enhanced Performance against Wear; Roy, M., Ed.; Springer: Vienna, Austria, 2013; pp. 149–191. [Google Scholar]
- Kenchireddy, K.M.; Jayadeva, C.T.; Sreenivasan, A. Influence of material characteristics on the abrasive wear response of some hardfacing alloys. Glob. J. Eng. Sci. Res. 2014, 1, 12–21. [Google Scholar]
- Annappa, A.R.; Basavarajappa, S. Some studies on three-body abrasive wear behaviour of hardfaced and normal plough tool material using Taguchi method. Int. J. Surf. Sci. Eng. 2013, 7, 14–26. [Google Scholar] [CrossRef]
- Pöhl, F.; Hardes, C.; Theisen, W. Deformation behavior and dominant abrasion micro mechanisms of tempering steel with varying carbon content under controlled scratch testing. Wear 2019, 422–423, 212–222. [Google Scholar] [CrossRef]
- Pirso, J.; Viljus, M.; Letunovitš, S.; Juhani, K.; Joost, R. Three-body abrasive wear of cermets. Wear 2011, 271, 2868–2878. [Google Scholar] [CrossRef]
- Stachowiak, G.W.; Batchelor, A.W. Engineering Tribology, 4th ed.; Butterworth-Heinemann: Oxford, UK, 2013. [Google Scholar]
- Venkatesh, B.; Sriker, K.; Prabhakar, V.S.V. Wear characteristics of hardfacing alloys: State-of-the-art. Procedia Mater. Sci. 2015, 10, 527–532. [Google Scholar] [CrossRef]
- Venkatesh, B.; Sriker, K.; Kumar, M.A. Wear characteristics of multi layer hardfacing alloys. AIP Conf. Proc. 2020, 2259, 020020. [Google Scholar]
- Dziedzic, K.; Jóźwik, J.; Barszcz, M.; Gauda, K. Wear characteristics of hardfacing coatings obtained by tungsten inert gas method. Adv. Sci. Technol. Res. J. 2019, 13, 8–14. [Google Scholar] [CrossRef]
- Paz-Triviño, F.; Buitrago-Sierra, R.; Santa-Marín, J.F. Wear resistance and hardness of nanostructured hardfacing coatings. Dyna 2020, 87, 146–154. [Google Scholar] [CrossRef]
- Vargova, M.; Tavodova, M.; Monkova, K.; Dzupon, M. Research of Resistance of Selected Materials to Abrasive Wear to Increase the Ploughshare Lifetime. Metals 2022, 12, 940. [Google Scholar] [CrossRef]
- Prysyazhnyuk, P.; Krauze, K.; Romanyshyn, L.; Mosora, Y. Increasing the wear resistance of mining machines equipment tools by FCAW with Fe-Mo-Mn-B-C hardfacing alloys. Min. Mach. 2020, 40, 64–70. [Google Scholar]
- Ferdinandov, N.V.; Gospodinov, D.D. Hardfacing of metal-cutting tools by arc welding in vacuum. J. Achiev. Mater. Manuf. Eng. 2020, 99, 49–56. [Google Scholar] [CrossRef]
- Winczek, J.; Gucwa, M.; Mičian, M.; Koňár, R.; Parzych, S. The evaluation of the wear mechanism of high-carbon hardfacing layers. Arch. Metall. Matals 2019, 64, 1111–1115. [Google Scholar]
- Öztürk, Z.T. Wear behavior and microstructure of Fe-C-Si-Cr-B-Ni hardfacing alloys. Mater. Test. 2021, 63, 231–234. [Google Scholar] [CrossRef]
- Nagentrau, M.; Mohd Tobi, A.L.; Kamdi, Z.; Ismail, M.I.; Sambu, M. Microstructure Analysis of Tungsten Carbide Hardfacing on Carbon Steel Blade. IOP Conference Series: Mater. Sci. Eng. 2017, 203, 012014. [Google Scholar] [CrossRef]
- da Silva, W.M.; Costa, H.L.; de Mello, J.D.B. Transitions in abrasive wear mechanisms: Effect of the superimposition of interactions. Wear 2011, 271, 977–986. [Google Scholar] [CrossRef]
- Kobrick, R.L.; Klaus, D.M.; Street, K.W. Standardization of a volumetric dis. placement measurement for two-body abrasion scratch test data analysis. Wear 2011, 270, 650–657. [Google Scholar] [CrossRef][Green Version]
- Xu, X.; van der Zwaag, S.; Xu, W. Prediction of the abrasion resistance of construction steels on the basis of the subsurface deformation layer in a multi-pass dual-indenter scratch test. Wear 2015, 338, 47–53. [Google Scholar] [CrossRef]
- Buttery, T.C.; Archard, J.F. Grinding and abrasive wear. Proc. Inst. Mech. Eng. 1970, 185, 537–552. [Google Scholar] [CrossRef]
- da Silva, W.M.; Mello, J.D.B. Using parallel scratches to simulate abrasive wear. Wear 2009, 267, 1987–1997. [Google Scholar] [CrossRef]
- Wang, C.; Wang, M.; Shi, J.; Hui, W.; Dong, H. Effect of microstructural refinement on the toughness of low carbon martensitic steel. Scr. Mater. 2008, 58, 492–495. [Google Scholar] [CrossRef]
- Masen, M.A.; de Rooij, M.B.; Schipper, D.J. Micro-contact based modelling of abrasive wear. Wear 2005, 258, 339–348. [Google Scholar] [CrossRef]
- Zum Gahr, K.H. Modelling of two-body abrasive wear. Wear 1988, 124, 87–103. [Google Scholar] [CrossRef]
- Torrance, A.A. Modelling abrasive wear. Wear 2005, 258, 281–293. [Google Scholar] [CrossRef]
- Xie, Y.; Williams, J.A. The prediction of friction and wear when a soft surface slides against a harder rough surface. Wear 1996, 196, 21–34. [Google Scholar] [CrossRef]
- Fang, L.; Liu, W.; Du, D.; Zhang, X.; Xue, Q. Predicting three-body abrasive wear using Monte Carlo methods. Wear 2004, 256, 685–694. [Google Scholar] [CrossRef]
- Jardret, V.; Zahouani, H.; Loubet, J.L.; Mathia, T.G. Understanding and quantification of elastic and plastic deformation during a scratch test. Wear 1998, 218, 8–14. [Google Scholar] [CrossRef]
- Badisch, E.; Kirchgaßner, M.; Polak, R.; Franek, F. The comparison of wear properties of different Fe-based hardfacing alloys in four kinds of testing methods. Lubr. Sci. 2008, 14, 225–233. [Google Scholar] [CrossRef]
- Xie, Y.; Bhushan, B. Effects of particle size, polishing pad and contact pressure in free abrasive polishing. Wear 1996, 200, 281–295. [Google Scholar] [CrossRef]
- Allsopp, D.N.; Trezona, R.I.; Hutchings, I.M. The effects of ball surface condition in the micro-scale abrasive wear test. Tribol. Lett. 1998, 5, 259–264. [Google Scholar] [CrossRef]
- Podgornik, B.; Hogmark, S.; Sandberg, O.; Leskovsek, V. Wear resistance and anti-sticking properties of duplex treated forming tool steel. Wear 2003, 254, 1113–1121. [Google Scholar] [CrossRef]
- Hokkirigawa, K.; Kato, K. An experimental and theoretical investigation of ploughing, cutting and wedge formation during abrasive wear. Tribol. Int. 1988, 21, 51–57. [Google Scholar] [CrossRef]
- Gates, J.D. Two-body and three-body abrasion: A critical discussion. Wear 1998, 214, 139–146. [Google Scholar] [CrossRef]
- Rigney, D.A. Fundamentals of Friction and Wear of Materials; American Society for Metals: Metals Park, OH, USA, 1981. [Google Scholar]
- Larsen-Basse, J. Effect of relative hardness on transition in abrasive wear mechanisms. In Wear of Materials; Ludema, K.C., Ed.; ASME: New York, NY, USA, 1983; pp. 161–166. [Google Scholar]
- Xu, X.; van der Zwaag, S.; Xu, W. A novel multi-pass dual-indenter scratch test to unravel abrasion damage formation in construction steels. Wear 2015, 322–323, 51–60. [Google Scholar] [CrossRef]
- Krauss, G. Martensite in steel: Strength and structure. Mater. Sci. Eng. A 1999, 273–275, 40–57. [Google Scholar] [CrossRef]
- Trezona, R.I.; Allsopp, D.N.; Hutchings, I.M. Transition between two-body and three-body abrasive wear: Influence of test conditions in the microscale abrasive wear test. Wear 1999, 225–229, 205–214. [Google Scholar] [CrossRef]
- Adachi, K.; Hutchings, I.M. Wear-mode mapping for the micro-scale abrasion test. Wear 2003, 255, 23–29. [Google Scholar] [CrossRef]
- Mediratta, S.R.; Ramaswamy, V.; Singh, V.; Ramarao, P. Dependence of strain hardening exponent on the volume fraction and carbon content of martensite in dual-phase steels during multistage work hardening. J. Mater. Sci. Lett. 1990, 9, 205–206. [Google Scholar] [CrossRef]


| Material | C | Mn | P | S | Si | Cr | Ni | Mo | Cu |
|---|---|---|---|---|---|---|---|---|---|
| A | 0.03 | 2.00 | 0.45 | 0.030 | 1.00 | 16.00–18.00 | 10.00–14.00 | - | - |
| B | 0.10 | 6.50 | 0.01 | 0.020 | - | 18.50 | 8.50 | 0.10 | 0.10 |
| C | 0.45 | 1.60 | - | - | 0.60 | 5.50 | - | 0.60 | - |
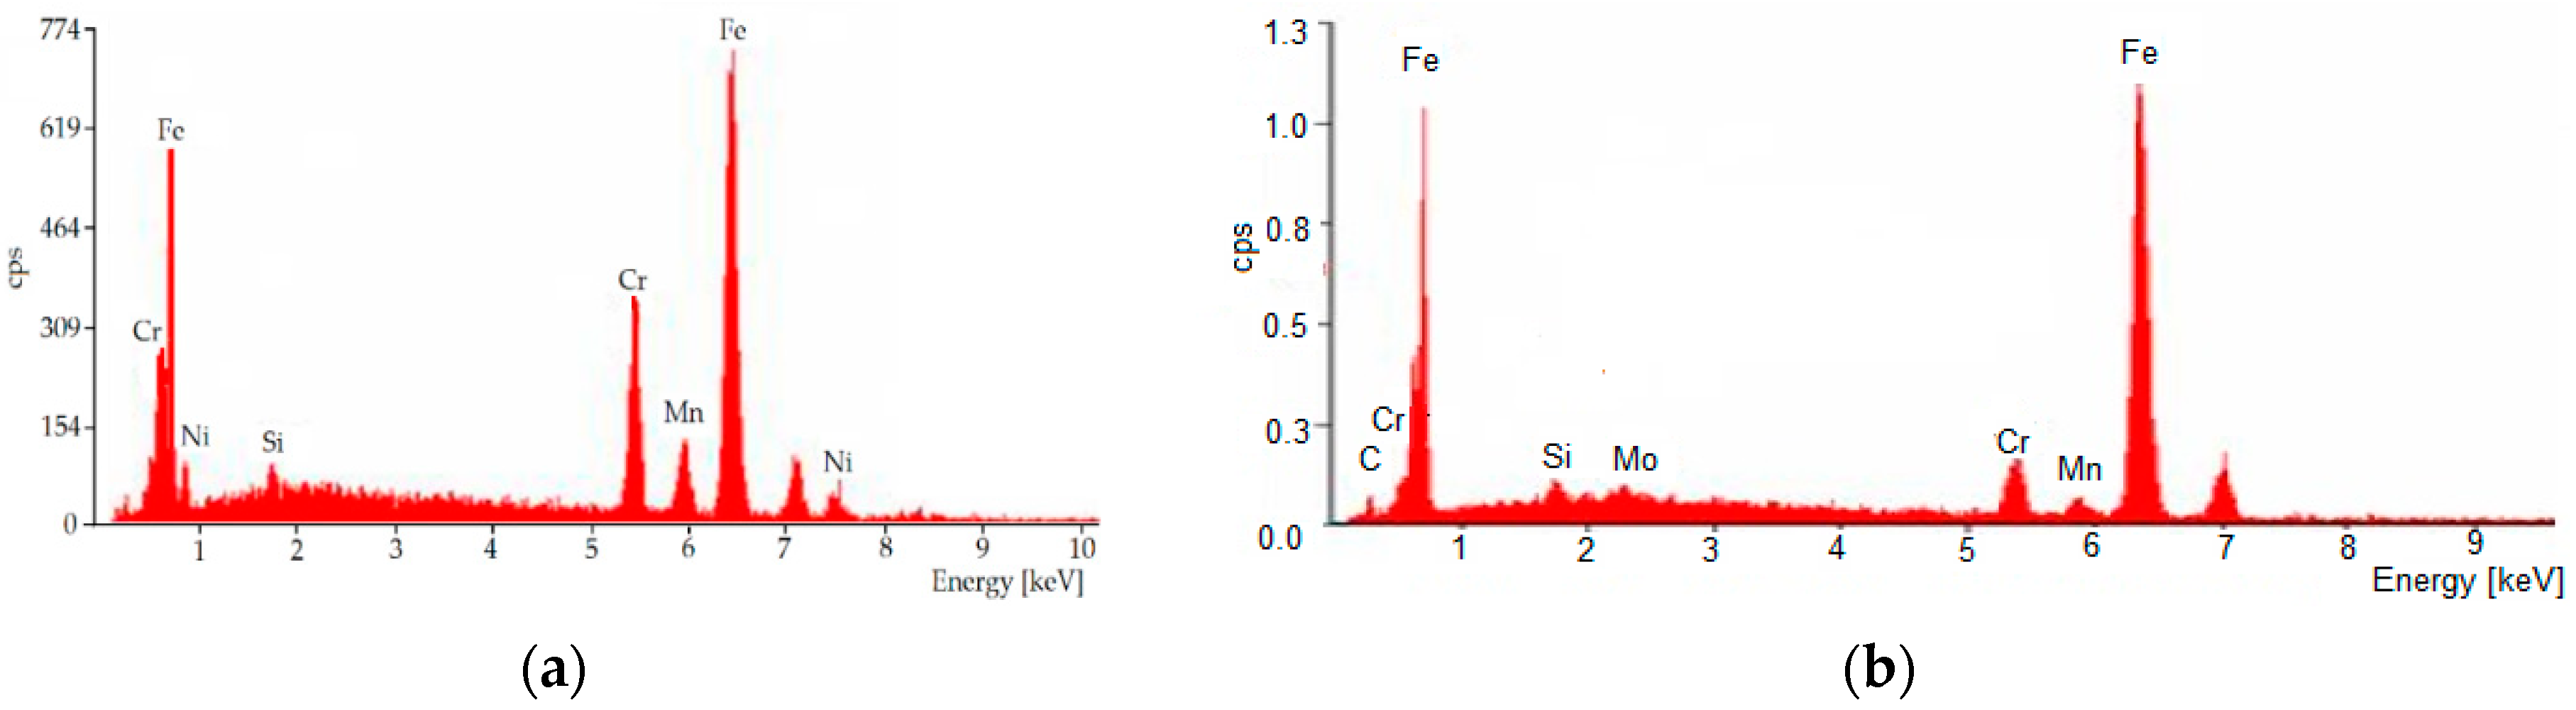
 | Element | Wt [%] | At [%] |
| Si | 0.76 | 1.48 | |
| Cr | 16.67 | 17.61 | |
| Mn | 5.88 | 5.88 | |
| Fe | 69.34 | 68.16 | |
| Ni | 7.35 | 6.88 | |
| Matrix | Correction | ZAF |
 | Element | Wt [%] | At [%] |
| C | 3.28 | 13.5 | |
| Si | 0.83 | 1.47 | |
| Mo | 1.31 | 0.68 | |
| Cr | 6.08 | 5.79 | |
| Mn | 2.03 | 1.83 | |
| Fe | 86.4 | 76.71 | |
| Matrix | Correction | ZAF |
| Test Parameter | Value |
|---|---|
| Rubber wheel speed (RPM) | 300 |
| Well diameter (mm) | 229 |
| Load (N) | 100 |
| Sample dimensions (mm) | 25 × 75 × 18 |
| Abrasive size of Ottawa sand (mm) | 0.2–0.315 |
| Sliding distance (m) | 210, 420, 716 |
| Abrasives flow (g/min) | 200 |
| Sample | Width Grooves lr (μm) | Width between Peaks lp (μm) | Zone of Interaction ZOI (μm) | Scratch Depth p (μm) |
|---|---|---|---|---|
| A | 207.31 ± 0.69 | 310.11 ± 0.64 | 516.13 ± 0.65 | 31.62 ± 0.66 |
| B | 185.22 ± 0.71 | 294.41 ± 0.70 | 498.21 ± 0.56 | 27.77 ± 0.65 |
| C | 141.45 ± 0.78 | 171.22 ± 0.56 | 279.33 ± 0.76 | 9.31 ± 0.66 |
Publisher’s Note: MDPI stays neutral with regard to jurisdictional claims in published maps and institutional affiliations. |
© 2022 by the authors. Licensee MDPI, Basel, Switzerland. This article is an open access article distributed under the terms and conditions of the Creative Commons Attribution (CC BY) license (https://creativecommons.org/licenses/by/4.0/).
Share and Cite
Slota, J.; Kubit, A.; Gajdoš, I.; Trzepieciński, T.; Kaščák, Ľ. A Comparative Study of Hardfacing Deposits Using a Modified Tribological Testing Strategy. Lubricants 2022, 10, 187. https://doi.org/10.3390/lubricants10080187
Slota J, Kubit A, Gajdoš I, Trzepieciński T, Kaščák Ľ. A Comparative Study of Hardfacing Deposits Using a Modified Tribological Testing Strategy. Lubricants. 2022; 10(8):187. https://doi.org/10.3390/lubricants10080187
Chicago/Turabian StyleSlota, Ján, Andrzej Kubit, Ivan Gajdoš, Tomasz Trzepieciński, and Ľuboš Kaščák. 2022. "A Comparative Study of Hardfacing Deposits Using a Modified Tribological Testing Strategy" Lubricants 10, no. 8: 187. https://doi.org/10.3390/lubricants10080187
APA StyleSlota, J., Kubit, A., Gajdoš, I., Trzepieciński, T., & Kaščák, Ľ. (2022). A Comparative Study of Hardfacing Deposits Using a Modified Tribological Testing Strategy. Lubricants, 10(8), 187. https://doi.org/10.3390/lubricants10080187