Article

Boundary Lubricity of Vegetable-Oil-Derived Trimethylolpropane (TMP) Ester

1
Faculty of Mechanical Engineering, Universiti Teknologi Malaysia (UTM), Johor Bahru 81310, Johor, Malaysia
2
Automotive Development Centre (ADC), Institute for Vehicle Systems and Engineering (IVeSE), Universiti Teknologi Malaysia (UTM), Johor Bahru 81310, Johor, Malaysia
3
Faculty of Engineering and Physical Sciences, University of Southampton Malaysia, Iskandar Puteri 79100, Johor, Malaysia
4
China-UK Low Carbon College, Shanghai Jiao Tong University, Shanghai 201306, China
*
Author to whom correspondence should be addressed.
Lubricants 2022, 10(12), 346; https://doi.org/10.3390/lubricants10120346
Submission received: 10 November 2022 / Revised: 29 November 2022 / Accepted: 1 December 2022 / Published: 2 December 2022
(This article belongs to the Special Issue Advances in Boundary Lubrication)

Abstract

:
Vegetable-oil-based biolubricants are an excellent alternative to conventional lubricants. Instead of focusing on novel feedstocks, these biolubricants should be further elucidated based on their fatty acid composition, which influences their tribological properties. Therefore, the study utilises gene expression programming (GEP) to derive a boundary lubricity model for vegetable-oil-derived trimethylolpropane (TMP) esters, considering the fatty acid composition (saturation and monounsaturation levels), load and speed. Neat vegetable oil and blends from seven feedstocks are selected following a wide range of fatty acid profiles to synthesise TMP esters using a two-stage transesterification process. The TMP esters are spin-coated on wear discs that are subsequently rotated against a ball using a purpose-built tribometer. The frictional performance of the TMP esters with balanced saturation and monounsaturation levels of fatty acid are measured to improve it at higher speeds. The GEP model is statistically evaluated by adopting the friction data, a showing good generalisation and predictability capability. The model demonstrates that friction decreases with increasing saturation levels of the TMP ester. The GEP model for vegetable oil TMP esters allows for the tribological performance prediction of TMP esters following the fatty acid profile, providing a platform to optimise such biolubricant for desired applications.

Graphical Abstract

1. Introduction

The global biolubricant market was estimated at USD 1.9 billion in 2020 and is projected to reach USD 2.7 billion by the year 2027 [1]. The estimated growth in the biolubricant sector at a compound annual growth rate (CAGR) of 5.2% is driven by concerns about the rapid depletion of fossil fuel resources and environmental pollution arising from improper disposal of lubricants derived from such resources. Biolubricants are an alternative to conventional lubricants derived from fossil fuel resources. They are biodegradable (70–100% [2]) and renewable, with the most common type being vegetable oil or its derivatives (approximately 45% of the global biolubricant market [1]). In addition to not being toxic, vegetable oil also has excellent lubrication properties, attributed to its unique combination structure of polar and nonpolar molecular groups. The carboxyl polar group of vegetable oil adsorbs to the rubbing surfaces to form a lubricant film, protecting them from undesired wear and tear.
Vegetable oil’s high fatty acid content (between 80–90%) is the primary factor in its lubricating efficacy [3]. However, the β -hydrogen atoms in the hydroxyl groups and unsaturated free fatty acids (FFA) of the vegetable oil triglycerides promote fast crystallisation, resulting in poor thermo-oxidative stability. Therefore, converting vegetable oil into synthetic esters through chemical modifications (e.g., epoxidation, hydrogenation and transesterification [4]) can remedy this deficiency. One of the economically feasible solutions is to convert vegetable oil into a synthetic polyol ester, namely, trimethylolpropane ester (TMP ester), using transesterification. On top of an improved thermo-oxidative stability [4,5], numerous research studies on such polyol esters derived from vegetable oil have produced biolubricants with a lubricity that is on par or superior to conventional lubricants [6,7]. To date, vegetable oils, such as palm oil [8], jatropha oil [9], rice bran [4], karanja oil [4], sunflower oil [9], soybean oil [9,10] and cotton seed oil [11], have been transesterified to produce TMP esters. Recently, studies on TMP esters have shifted towards specific fatty acid chains, namely, from TMP trioleate [12,13]. TMP trioleate, synthesised from oleic acid, has been demonstrated to possess a good lubricity and has often been suggested for use as hydraulic oil.
A recent bibliometric study by Lee et al. [14] highlighted the importance of correlational studies on the lubricity of vegetable oil biolubricant and its fatty acid composition. The chemical structure of vegetable-oil-derived biolubricants and their fatty acid composition is vital to their physicochemical and tribological properties [15,16,17]. According to the study by Biresaw and Bantchev [18], the lubricant film is influenced by the degree of unsaturation, fatty acid chain length and the polar group of the vegetable oil. Correlating the fatty acid compositions of vegetable-oil-based lubricants with rheological properties has been reported on numerous occasions in the literature [9,19,20]. For example, the monounsaturated or polyunsaturated fatty acids influence the viscosity of vegetable oil [19]. Specifically, Kim et al. demonstrated that the viscosity of vegetable oil increased with a higher concentration of oleic acid (C18:1) while it decreased with a higher linoleic acid (C18:2) content [20]. Apart from viscosity, it has also been reported that a low thermo-oxidative stability is attributed to higher levels of unsaturation [9] while high pour points are attributed to higher levels of saturation [21].
On the other hand, the influence of fatty acid profiles on vegetable oil’s frictional and wear properties have also been studied. For example, stearic acid in vegetable-oil-based lubricants could reduce friction and wear [3]. High linoleic and oleic acid concentrations in vegetable oils, namely soybean oil, have also produced a lower friction and wear, arising from the formation of denser fatty acid monolayer film [22,23]. Hamdan et al. suggested that decreasing the ratio of monounsaturation to total saturation level could result in reducing the friction of vegetable-oil-derived fatty acid methyl ester (FAME) [24]. A reducing ratio would also reflect an increasing saturation level (assuming a constant monounsaturation). Similarly, the increasing saturation level of vegetable oil FAME has also been reported to lead to a friction drop by Rajasozhaperumal and Kannan [23]. They explained that saturated fatty acid molecules adsorbed more efficiently on the surface to form a more effective lubricating film.
The literature mentioned above often highlights the effect of the fatty acid composition of vegetable-oil-based lubricants with little effort on mathematically quantifying the effect. Neat vegetable oil feedstocks are often investigated along with different chemical modification and additivation approaches. Instead of using a trial-and-error approach, a proper quantification of such effect would be imperative for optimising the tribological properties of vegetable oil for developing more effective biolubricants, allowing an optimum fatty acid configuration of biolubricant to be attained for the desired applications. Therefore, machine learning techniques should be explored when determining the effect of fatty acid composition on the tribological properties of vegetable-oil-based biolubricants. Machine learning allows complex processes to be systematically quantified in an efficient manner [25], suitable for tribological systems, often involving multiphysics phenomena.
Marian and Tremmel recently reviewed the penetration of machine learning techniques in the field of tribology research [26]. Their review showed that most tribological research adopting machine learning techniques are related to composite or advanced materials, lubrication systems for motion generation or power transmissions (including bearings, seals, brakes and clutches), surface texturing and lubricants. With relation to lubricants, the reported literature focuses more on additive studies [27,28,29]. Artificial Neural Networks (ANNs) and genetic algorithms are the majority of machine learning techniques adopted in tribology. Machine learning techniques solve the identified problem by training using available data from a simulation, experiment or the literature. To date, ANNs have been demonstrated to produce predictive models with a high coherence to experimental data [30]. However, it remains a challenge to derive an empirical formulation of an ANN model for practical applications due to the complex nature of ANN models [31].
An alternative machine learning technique is gene expression programming (GEP), an extension of genetic programming that incorporates simple and linear chromosomes to generate small programs with explicit equations [32]. GEP has the genetic algorithm’s simplicity and the abilities of genetic programming [33]. This technique produces simple mathematical expressions in the form of subexpression trees with high prediction capabilities that can be adopted for practical applications. More importantly, the expressions from GEP have been reported in the literature to have a good generalisation and predictive capability, not limited to correlations [30,34,35]. Recently, GEP has been adopted to study material removal via machining [36], with most studies still revolving around civil engineering applications [30,37].
Knowing the influence of different fatty acid compositions on the physicochemical and tribological properties of vegetable-oil-based biolubricant is essential. A lubricant’s fluid film lubrication performance is heavily influenced by its viscosity. However, the same cannot be said of its boundary lubrication properties. Therefore, as a first approximation, the present study aims to develop a practical empirical expression using GEP to describe the effect of vegetable-oil-based trimethylolpropane (TMP) ester’s fatty acid composition on its boundary frictional performance. The generated GEP model prepares an empirical platform to further explore the boundary lubricity of TMP esters as an alternative to conventional mineral-oil-based lubricants. More importantly, the GEP model is expected to predict the frictional performance of vegetable-oil-based TMP esters following the operating conditions of the desired applications. To the authors’ knowledge, adopting the GEP technique in deriving a generalised empirical model for vegetable-oil-derived TMP esters’ boundary frictional performance, considering fatty acid composition, has yet to be reported in the literature.

2. Methodology

2.1. Materials

The present study derived trimethylolpropane (TMP) esters from vegetable oil feedstocks, namely palm, olive, coconut, grapeseed–coconut (1:1 ratio by volume), canola, canola–sunflower (1:1 ratio by volume) and canola–palm–soybean (1:1:1 ratio by volume). It is noted that these vegetable oils were commercially procured from the consumer product market. The methanol and potassium hydroxide (KOH) used in the methyl ester synthesis were of the QRëC brand. TMP: 1,1,1-Tris(hydroxymethyl)propane, dist., ≥98.0% (by gas chromatography) and 30 wt% sodium methoxide solution in methanol were purchased from Sigma-Aldrich (Selangor, Malaysia) for synthesising trimethylolpropane (TMP) ester. All chemicals used in the production were of analytical grade. On the other hand, BSTFA: N,O-Bis(trimethylsilyl)trifluoroacetamide (synthesis grade, purity >99%) and ethyl acetate (ACS reagent grade) were also purchased from Sigma-Aldrich (Malaysia) for the gas chromatography (GC) analysis of the produced TMP ester.

2.2. Vegetable-Oil-Derived Trimethylolpropane (TMP) Ester

The synthesis of TMP esters for the selected vegetable oil feedstocks was carried out through a two-stage transesterification process as described in the process flow diagram given in Figure 1. In the first stage of the transesterification (process flows 1 to 7), the triglyceride of vegetable oil was reacted with methanol in the presence of a base catalyst (KOH), forming a fatty acid methyl ester (FAME) and glycerol. The collected FAME was then sent for gas chromatography–mass spectrometry (GCMS) using a Shimadzu GCMS-QP2010 Series coupled with a BP5 MS column (20 m × 0.18 mm (inside diameter), film thickness 0.18 μm) to identify their saturation (SA), monounsaturation (MU) and polyunsaturation (PU) levels.
The methodology for GCMS was modified following Tarif et al. [38]. The column temperature was set from 120 °C to 330 °C at rate of 10 °C/min. Both injector and detector temperatures were set at 250 °C. A quantity of 1.0 μL of test samples in ethyl acetate was injected with a split ratio of 1:10. Helium gas was used as the carrier gas at a flow rate of 1.5 mL/min. The mass spectrometers were then identified with the National Institute of Standards and Technology (NIST) mass spectrometer library across a range of 50–550 m/z with an electron impact (EI) ionisation mode. The fatty acid composition for the synthesised FAME is tabulated in Table 1. The present study accepted only a distribution yield of at least 96.5% (following the EN14214 standard) from the FAME for each vegetable oil to ensure a high conversion of the TMP ester production in the subsequent transesterification process.
In the second stage of transesterification (process flows 8 to 15 in Figure 1), the FAME was reacted with TMP in the presence of sodium methoxide as the base catalyst in reflux and vacuum conditions at 130 °C. After five hours of reaction time, the reactant fluid was vacuum filtered using a Whatman Grade 5 qualitative filter paper to remove all unused by-products. Finally, the filtrated reactant fluid underwent distillation to remove the excess FAME, leaving behind the desired TMP ester. The two-stage transesterification allowed the β -hydrogen in the glycerol of the vegetable oil to be replaced by TMP, conjugating the FAME into a synthetic ester.
The quantification of the yield of TMP esters was then conducted through a gas chromatography (GC) system (Perkin Elmer Clarus 680) equipped with a flame ionisation detector (FID). The GC instrument was operated on an Elite-5 capillary column (30 m × 0.25 mm (inside diameter), with a film thickness of 0.25 μm). The GC technique followed the methodology from Yunus et al. [39]) with minor modifications to suit the column used. A (0.03 ± 0.005) g of the TMP ester was weighed and diluted with 1.0 mL of ethyl acetate and 0.5 mL of BSTFA. The samples were heated in a water bath at 40 °C for silylation. During the GC analysis, hydrogen gas was employed as a carrier gas with a split ratio of 50:1. The oven temperature was first held at 80 °C for three minutes initially and heated up to 330 °C at 5 °C/min, before being held for another eight minutes. The injector and detector temperatures were set at 300 °C and 330 °C, respectively.
The number of peaks in the gas chromatogram (GC) is related to the concentration of a specific component in the test samples. The GC peaks illustrate the number of carbon atoms bound in an ester structure. The present study used methyl oleate (MO) and trimethylolpropane oleate (TMPO) to identify the corresponding C18 bond in both MO and TMPO. MO with a ≥98.5% purity was purchased from Sigma-Aldrich (Selangor, Malaysia), while Wilmar Oleochemicals (Jiangsu, China) provided the TMPO. The respective chromatograms are given in Figure 2a,b. The ester formation for the produced TMP ester can be recognised by comparing the GC peaks with MO and TMPO. For example, Figure 2c illustrates the chromatogram for the palm TMP ester. MO’s most prominent GC peak occurs at 27.5 min, identified as methyl oleate. On the other hand, the highest GC peak in TMPO is at 57.7 min, identified as trimethylolpropane oleate. In comparison, the GC peaks of the palm TMP ester appear around 57 min. These peaks demonstrate the combination of TMP esters formed from the C18 methyl ester families (C18:0. C18:1, C18:2 and C18:3). In the present study, the synthesis of TMP esters was optimised to ensure a TMP ester yield distribution of at least 85% for each vegetable oil. For example, by the weight percentage calculation, the palm TMP ester produced was estimated to contain 87% of TMP ester. It is noted that the produced TMP esters were also subjected to distillation to remove any residue or remaining FAME before further characterisation.

2.3. Physicochemical Properties of Trimethylolpropane (TMP) Esters

The viscosities of the derived TMP esters were measured using a Brookfield DV-11+ Pro viscometer, equipped with a constant-temperature bath to control the temperature of the tested liquid at 40 °C and 100 °C. The kinematic viscosity and viscosity index (VI) were determined following ASTM D445 and ASTM D2270, respectively. The flash points of the TMP esters were also measured based on ASTM D93-94, using a Pensky–Martens closed-cup tester (Anton Paar, Graz, Austria). At the same time, the pour point was measured according to ASTM D97-93 (Stanhope-seta). The density was determined using the Anton Paar DMA 4100. Lastly, the thermogravimetric analysis (TGA) was carried out using a TA Instruments (New Castle, DE, USA) Thermogravimetric Analyzer (modular TGA Q500) in a temperature range from room temperature to 1000 °C in a nitrogen gas atmosphere at a 10 °C/min heating rate to determine the thermal decomposition onset temperature of the TMP esters.

2.4. Spin Coating of Lubricant Film

In the present study, a dynamic spin-coating method was adopted to deposit a thin layer of TMP ester on a 304 2B finished stainless steel wear disc (50 mm diameter and 1 mm thickness). The stainless steel wear discs were first rinsed with water, followed by sonication in acetone to remove residual machining or cutting fluid, before being washed with distilled water. The discs were dried in the oven and kept in ethanol as a pretreatment to improve their adhesion properties. Subsequently, the stainless steel wear discs were removed from the ethanol and dried in the oven at 80 °C for 30 min to evaporate the ethanol before being cooled to room temperature. During spin coating, 0.5 mL of TMP ester was added dropwise to the middle of the stainless steel wear discs. The centripetal acceleration was set at 3000 rev/min, spreading the TMP ester while forming a thin layer of lubricant film on the surface of the wear discs. The wear discs coated with TMP ester were weighed with the thickness of the coated film being evaluated using the mass difference relative to the uncoated discs, following reference [40]. It is noted that the spin-coating approach was adopted to allow for the characterisation of the TMP ester at a boundary lubrication regime.

2.5. Friction Measurement

The friction test was conducted under ambient conditions with an in-house purpose-built ball-on-disc tribometer, given in Figure 3. The purpose-built ball-on-disc tribometer used a high-speed brushless DC motor, allowing a rotational speed of up to 6000 rev/min for the wear disc with a gear reducer. The friction was measured using a calibrated load cell, while the rotational speed was measured using a Hall effect sensor. The 304 2B finished stainless steel wear disc (spin-coated with TMP esters) was rotated against a steel ball of 6 mm diameter (fixed at 1.75 cm from the centre of the discs) at varied normal loads, w (392–1177 mN, giving an estimated maximum Hertzian pressure of 0.5–0.7 GPa) and rotating speeds, u (0.36–7.33 m/s). The friction for each test configuration was measured for 90 s. Before the friction test, the steel ball was cleaned with acetone while a new set of steel balls and wear discs was used for each TMP ester. The wear discs’ arithmetic average roughness ( R a ) and root mean square average roughness ( R q ) were 1.25 μm and 1.61 μm, respectively. The R a and R q for the ball bearing were 0.2 μm and 0.3 μm, respectively.
The lambda parameter (λ) was estimated from the ratio between the minimum film thickness ( h m i n ) and the composite surface roughness ( σ ), allowing for the interpretation of the operating lubrication regime. The minimum film thickness ( h m i n ) was determined at each operating condition following the expression by Hamrock and Dowson [41], while the term σ was the composite surface roughness of the wear disc and ball bearing. The expression for h m i n was given as:
h m i n R = 3.63 U 0.68 G 0.49 W 0.073 1 e 0.68
where:
  • G + α E ;
  • U = u η 0 / E R ;
  • W = w / E R 2 ;
  • R = curvature radius of ball;
  • E = reduced modulus of elasticity; ( = 2 ( 1 ν 1 2 ) / E 1 + ( 1 ν 2 2 ) / E 2 1 )
  • E = modulus of elasticity for wear disc and ball;
  • ν = Poisson’s ratio for wear disc and ball;
  • w = load;
  • u = sliding speed;
  • η 0 = dynamic viscosity.

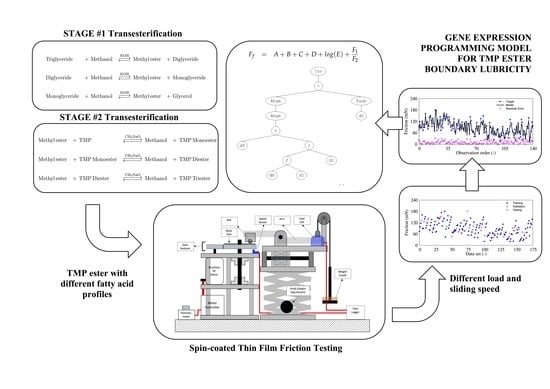
2.6. Gene Expression Programming (GEP)

The present study adopted a gene expression programming (GEP) approach to determine a meaningful relationship between the friction force (Ff) and the fatty acid composition of the vegetable-oil-derived TMP esters. The variables identified were saturation (SA), monounsaturation (MU), polyunsaturation (PU), load and speed. The interdependency of variables could result in models with poor performance, where the strength between these variable pairs could be exaggerated due to multicollinearity [42,43]. It is noted that the average carbon chain lengths were excluded as an input variable due to their marginal difference, where the lengths of the selected vegetable-oil-derived TMP esters were mostly 18, except for coconut (15) and grapeseed–coconut (16) TMP esters. Therefore, in the present study, the multicollinearity of variables was identified using the correlation coefficient between the variables as in Table 2. The PU–SA and PU–MU variable pairs gave relatively higher correlation coefficients than other variable pairs. Thus, as a first approximation, the variable PU was removed from the GEP model generation, giving a function as follows:
F f = f S A , M U , l o a d , s p e e d
An acceptable machine-learning-based model is suggested to have a ratio of total data points to total input variables of at least three, preferably exceeding five [34]. In the present study, the GEP database was formed from 175 values measured through friction tests, giving a ratio of more than 40 with four input variables. Then, the database was randomly distributed into training, validation and test subsets using a stratified sampling technique. A total of 141 (80%) values were taken for the GEP training process. The remaining values were equally divided for the validation (17 values—10%) and test (17 values—10%) subsets required to validate the GEP model’s generalisation capability. For every 2000 generations during GEP, the complexity was increased by automatically adding a gene to the model. A parametric study was conducted on the number of chromosomes, head size and the number of genes using the training data to achieve a proper GEP architecture. The optimum configuration based on best fitness and correlation coefficient for the current data set could be obtained using 225 chromosomes, a head size of 10 and 6 genes. Appendix A provides the input parameters for the GEP algorithm using GeneXproTools Software (Version 5.0). It is noted that the GEP in the present study was terminated at 20,000 generations.
The performance evaluation of the GEP model was based on the statistical parameters for training, validation and test subsets. The parameters considered were the root-mean-square error ( R M S E ), mean absolute error ( M A E ), relative standard error ( R S E ), relative root-mean-square error ( R R M S E ), correlation coefficient (R) and determination coefficient ( R 2 ). A performance index, ρ , was introduced following Gandomi and Roke [34]. On top of these parameters, the present study also conducted an external validation to evaluate the prediction capability of the GEP model. The parameters considered were the slope of the regression lines (k and k ), the squared correlation coefficient through the origins ( R o 2 ) and the coefficient between the experiment and model ( R o 2 ) [30]. Overfitting models due to excessive data training could result in a decreased training error but an increased testing error [44]. Therefore, an objective function (OBF) parameter was used to measure the overall performance of the GEP model. The equations for these statistical parameters are given in Appendix B.

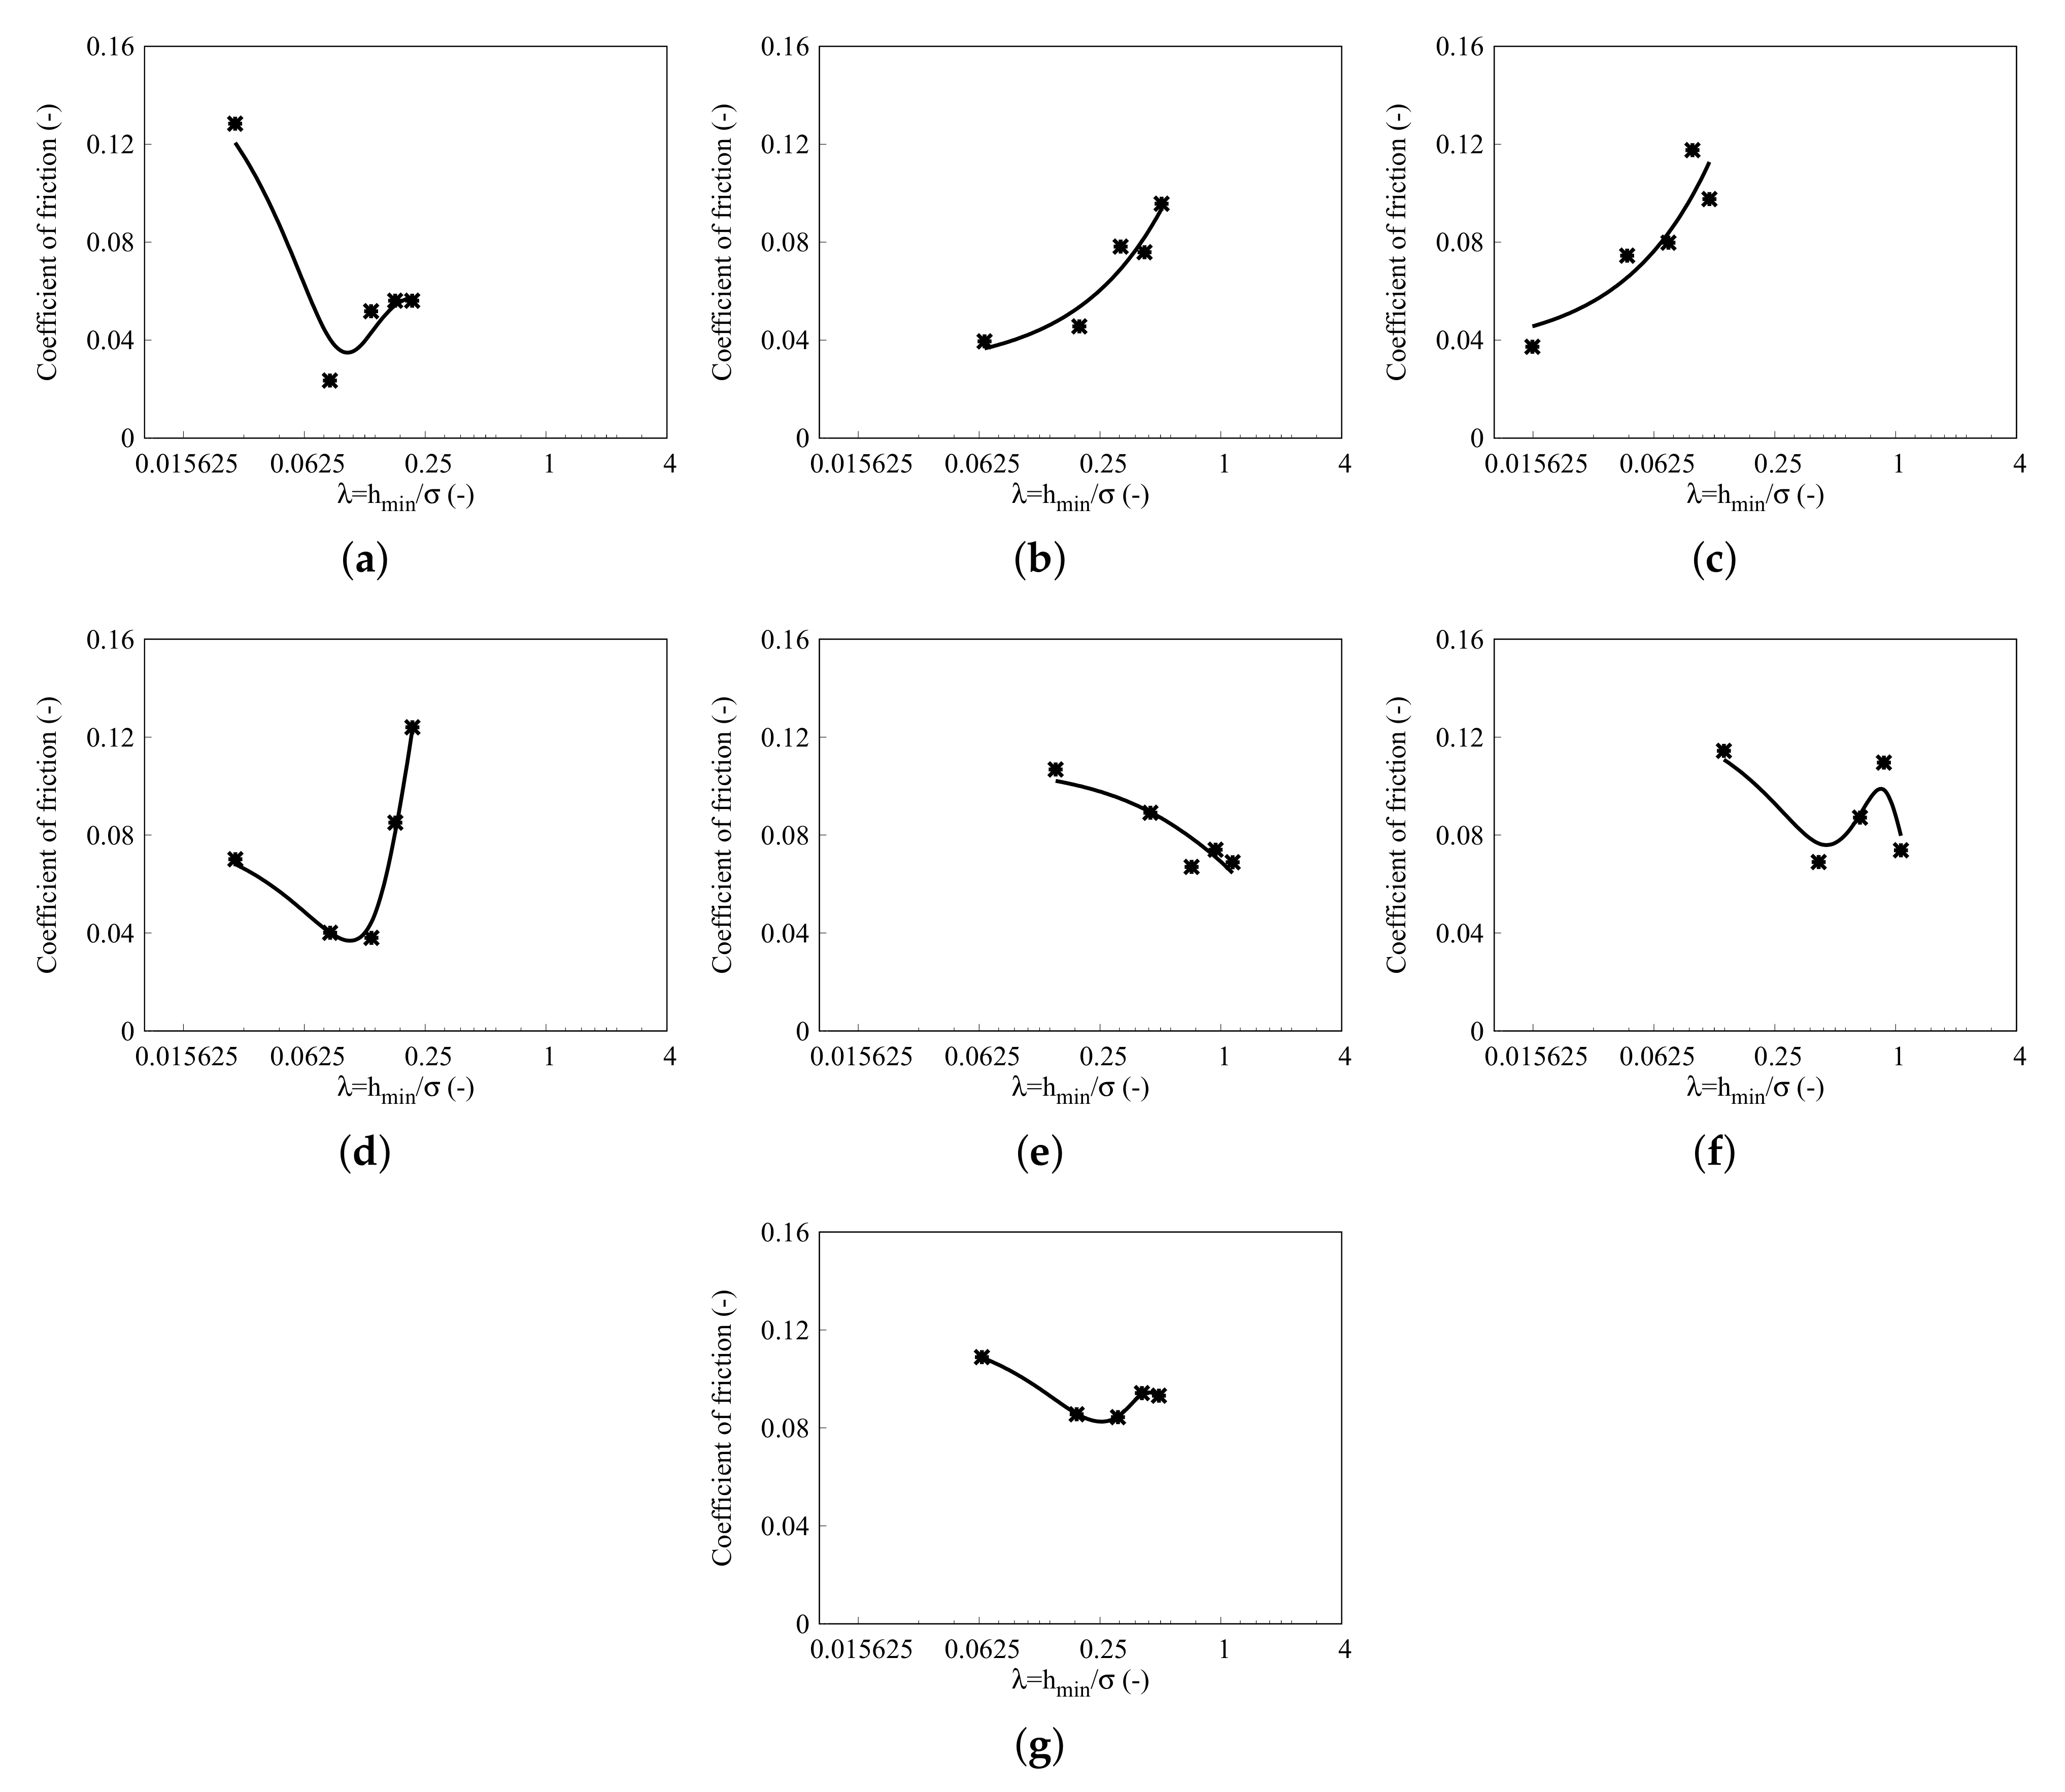
3. Results and Discussion

Table 3 summarises the physicochemical properties of the vegetable-oil-derived TMP esters. Based on the kinematic viscosity values, the palm and grapeseed–canola TMP esters fell under the ISO VG 22 grade. On the other hand, the olive and canola–palm-soybean TMP esters could be classified under ISO VG 68, while canola and canola–sunflower followed ISO VG 150. Contrary to the observation by Kim et al. [20], instead of a lower viscosity, higher viscosity values for canola and canola–sunflower could result from the coupled effect of the high mono- and polyunsaturation levels as shown in Table 1. On the other hand, the derived coconut TMP ester produced the lowest viscosity, attributed to its shorter alkyl carboxylic chain (predominantly C12 to C16). At the present state, this TMP ester also could not be satisfactorily classified as its viscosity fell between ISO VG 10 and 15. However, the coconut TMP ester could be modified with suitable viscosity modifiers to suit either viscosity grade.
The viscosity index (VI) values for most of the derived TMP esters were calculated to be higher or comparable to reported typical values of oil-based engine lubricants. The canola and canola–sunflower TMP esters’ VI values were lower among the derived TMP esters at 121 and 132, respectively. By referring to Table 1, the lower VI values from these TMP esters could be attributed to their high PU levels (>50%). The highest VI value was recorded by the coconut TMP ester at 259, potentially resulting from its high SA levels. Such a high VI value shows potential for the coconut TMP ester to be adopted for systems operating under harsh conditions. The thermal decomposition onset temperature determined using TGA can indicate the lubricant’s thermal stability. In the present study, all the derived TMP esters exhibited a decomposition onset temperature above 300 °C, which was much higher than the values reported for engine lubricants (230 to 260 °C) [45].
The flash point is affected by the unsaturated carbon–carbon bonds in the fatty acid chain of an ester. It is also subjected to the numbers and the location of the double bond in the chain. The double bond in the fatty acid chain act as the active side for oxidation [46]. In other words, the flash point of the TMP ester is expected to be higher with increasing SA. Referring to Table 3, the palm TMP ester (46% SA) had the highest flash point while TMP-canola (2.7% SA) had the lowest flash point, corresponding to 152 °C and 98 °C. Contrary to the pour point characterisation, defined as the lowest temperature fluidity of a lubricant, a lower degree of SA gives a better cold flow behaviour [47]. The obtained pour point for each TMP ester was found to follow the expected trend, where the pour point of canola was much lower than that of palm and coconut. It is noted that the flash and pour points of the TMP esters remained undesirable compared to commercial engine lubricants (≈ 220 °C for flash point and ≈ −50 °C for pour point) and hydraulic oil (≈ −20 °C for pour point). Thus, it can be surmised that the derived TMP esters would need further enhancements through flash point additives and pour point depressants.
The friction force measured for the derived vegetable-oil-derived TMP esters is given in Figure 4. The friction forces changed linearly with the applied loads for all the TMP esters. It is noted that the determination coefficient ( R 2 ) for the friction forces as a function of load was above 0.85 when considering a linear regression. Such a trend followed the ones expected of boundary lubrication. However, the coefficient of friction (slope of the friction curve) varied when the sliding speed was increased. Another noticeable trend presented in Figure 4 is the vertical shift or offset of the measured friction force with the increasing sliding speeds. The offset indicated a varying intercept at the friction force axis. The observed nonzero intercept, also known as a dynamical friction parameter, could result from the TMP ester molecules adsorbing on the rubbing surfaces to form a boundary film [48], generating an interfacial shear resistance that needs to be overcome to sustain the sliding action. Overall, the frictional property of the palm TMP ester improved with higher speeds, leading to a lower friction coefficient than the other TMP esters. Such an improvement in boundary lubricity could result from the balanced saturation and monounsaturation levels of palm TMP ester, not seen in other TMP esters.
Figure 5 plots the coefficient of friction for the TMP esters against the lambda parameter ( λ ). It is noted that the coefficient of friction was taken as the slope of the measured friction force against the load provided in Figure 4 at its respective speed. An average λ was taken upon observing that the ratio was relatively constant for each load at its respective sliding speed. It is shown that all the TMP esters operated in mixed and boundary lubrication regimes ( λ < 1.15). Interestingly, the coefficient of friction for all the TMP esters, except for the olive and coconut TMP esters, exhibited a Stribeck like property. The coefficient of friction dropped with increasing λ values until reaching a minimum before increasing slightly or saturating at higher λ values. Such a behaviour could result from an increased hydrodynamic effect even with a fixed amount of lubricant supply, encouraging the contact to transition from boundary to mixed lubrication regimes. The coefficient of friction for the olive and coconut TMP esters was observed to keep increasing with larger λ values. Such a trend indicated that these TMP esters might not sustain the film under a high shear stress, potentially attributed to the molecules’ lesser ability to adsorb to the wear disks. It is noted that the coefficient of friction for all TMP esters was in the range of 0.03 and 0.14, much lower than the measured coefficient for a dry contact (0.34), indicating mixed and boundary lubrication regimes that were consistent with the λ values.

GEP Model for TMP Ester Boundary Lubricity

The measured friction forces for the vegetable-oil-derived TMP esters were demonstrated to vary among each other. Considering the tested loads and speeds were fixed, such variation could be due to the influence of the fatty acid composition. However, such a correlation can only be qualitatively observed via the measured friction or coefficient of friction plots, but it remains challenging to quantify them mathematically. Even when it is possible to correlate them using typical regression models, the lack of generalisation capability limits the usage of the obtained correlations. Therefore, as a first approximation, the present study used the GEP model to describe the friction force as a function of the fatty acid composition of the TMP esters. Figure 6 illustrates the values for the training, validation and testing subsets, randomly assigned using a stratified sampling technique. The values for the validation and testing subsets were shown to sufficiently cover the range of data points represented by the training set. The GEP used the training subset to generate subexpression trees for the model, while the validation and testing subsets were adopted independently to validate the generated GEP model.
The GEP model generated for the TMP ester friction is represented by six subexpression trees, each representing a gene from the GEP, in Figure 7 and Figure 8. Each subexpression tree forms a term in the expression produced by the GEP model. Translating the subexpression trees would result in a correlation for the friction force that follows Equation (2). The friction force, F f (mN), can be predicted using the following empirical equation:
F f = A + B + C + D + l o g ( E ) + F 1 F 2
where
  • A = 1.0 t a n 1 ( t a n 1 ( d 3 + d 0 / d 1 2 ) t a n h ( d 0 ) ;
  • B = d 3 + 7.015 + t a n 1 ( d 3 d 0 + 29.447 ) × d 2 3
  • C = d 2 2 3 6.21 + ( d 1 d 3 7.647 ) × ( d 2 + d 1 ) 3 ;
  • D = 5.072 + t a n h ( l o g ( d 1 × d 3 ) ) × ( 20.438 + d 0 ) × d 1 2 3 ;
  • E = e d 3 2 + 2.787 × 10 9 d 0 ;
  • F 1 = d 1 × 1.743 d 0 d 1 ;
  • F 2 = t a n 1 4.338 d 3 + d 1 8.083 .
The terms A to E are taken from subexpression trees one to five, while the terms F 1 and F 2 are from subexpression tree six6. The terms d 0 , d 1 , d 2 and d 3 refer to SA (%), MU (%), load (mN) and speed (m/s), respectively.
Figure 7. Subexpression trees 1 to 3 of the generated GEP model for vegetable-oil-derived TMP ester boundary lubricity. (a) Subexpression tree 1. (b) Subexpression tree 2. (c) Subexpression tree 3. (Note: "3Rt" refers to cubic root, "+" refers to addition, "-" refers to subtraction and "/" refers to division).
Lubricants 10 00346 g007
Figure 8. Subexpression trees 4 to 6 of the generated GEP model for vegetable-oil-derived TMP ester boundary lubricity. (a) Subexpression tree 4. (b) Subexpression tree 5. (c) Subexpression tree 6. (Note: 3Rt refers to cubic root, "+" refers to addition, "-" refers to subtraction and "/" refers to division).
Lubricants 10 00346 g008
Figure 9 gives the friction force comparison between the experiment (target) and model. The absolute error values are also provided in the exact figure. It can be observed that the model predicted friction force trends that followed the experimentally measured values for the training, validation and testing subsets. Table 4 summarises the statistical parameters for evaluating the GEP model performance. The determination coefficient ( R 2 ) for the training, validation and testing subsets were 0.858, 0.824 and 0.916, respectively. On the other hand, the correlation coefficients (R) were 0.926, 0.908 and 0.957 for the training, validation and training subsets, respectively. These values were larger than 0.8 [34], indicating a strong correlation between experiment and model. The values for R M S E , M A E , R S E and R R M S E were fairly similar among the training, validation and testing sets, indicating good generalisation capability of the model. Along with the near zero performance index, ρ , the generalisation capability of the generated GEP model was shown to be statistically reliable. The O B F values for the validation and testing subsets were 0.078 and 0.076, respectively. The near-zero values for O B F also indicated there were no overfitting issues [34].
The GEP model was also externally validated using other statistical parameters as highlighted by Iqbal et al. [30]. The external validation’s purpose was to evaluate the GEP model’s generalisation capability further. Table 5 tabulated the statistical parameters adopted in the present study for the external validation of the GEP model. The slopes of the regression lines, k and k , for the training, validation and tests subsets were 0.976, 0.998 and 0.957, respectively. The values, close to unity, verified the correctness of the correlation produced by the GEP model [35]. The squared correlation coefficient through the origins ( R o 2 ) and the coefficient between the experiment and model ( R o 2 ) were close to unity for all sets of data. Such trends strongly indicated that the generated GEP model had a statistically reliable generalisation capability and was not merely a correlation. More importantly, it can be surmised that the GEP model possessed a high generalisation capacity and excellent ability to predict reliable outcomes for unseen data or values.
The variable importance level for the GEP model is also highlighted in Figure 10 along with the influence of each variable on the friction of the derived vegetable-oil-derived TMP esters. The GEP model highlighted that the load (38% contribution) was an essential variable, where increasing the load applied to the contact increased the friction force of the vegetable-oil-derived TMP esters. The saturation level, SA, was the second most important variable at 29%, where higher SA levels would result in a friction reduction. On the contrary, the GEP model indicated that the MU level (21%) and sliding speed (12%) were less significant in affecting the TMP ester friction force than load and SA. The lesser significance of the sliding speed from the GEP model was an expected trend as this corroborates the characteristic of boundary lubrication following the Stribeck curve, where the sliding speed has little influence on the boundary friction. Referring to Figure 10e, the friction force gradually increased with the sliding speed. The significance could be amplified further when the sliding speed increases beyond the range selected for the present study, potentially attributing to the growing hydrodynamic effect. However, it can be said that the present GEP model could be less accurate at higher sliding speeds, especially when the operating lubrication regime transitions more towards fluid film lubrication, attributed to the lack of information on lubrication regimes outside of the ones provided for the present model.

4. Conclusions

The present study synthesised TMP esters from different vegetable oil feedstocks with varying fatty acid profiles using a two-stage transesterification process. Except for the coconut TMP ester, the TMP esters could be mapped to ISO VG 22 (palm and grapeseed–canola TMP esters), ISO VG 68 (olive and canola–palm–soybean TMP esters) and ISO VG 150 (canola and canola–sunflower TMP esters). The VI values of the TMP esters were comparable to typical engine lubricants. Lower VI values could be attributed to higher polyunsaturation levels while the opposite could be achieved with higher saturation levels.
The study then determined the boundary lubricity of vegetable-oil-derived TMP esters using a purpose-built ball-on-disc tribometer. The TMP esters were spin-coated on stainless steel wear discs, allowing the friction test to be carried out in a boundary lubrication regime. The coefficient of friction for all TMP esters, except olive and coconut TMP esters, exhibited a Stribeck like trend, potentially indicating the transition of operating lubrication regimes from boundary to mixed. Among the studied TMP esters, the palm TMP ester exhibited improved frictional performance with higher speeds, potentially due to its more balanced saturation and monounsaturation levels of fatty acid profile compared to the other tested TMP esters.
A gene expression programming (GEP) was adopted to model the boundary lubricity of the TMP esters. A set of simple and explicit equations was produced to describe the boundary lubricity of the TMP ester considering the fatty acid composition (saturation and monounsaturation levels), load and speed. The GEP model was empirical and agreed well with the measured friction force. The statistical evaluation of the GEP model, including an external validation, demonstrated that the model had a high generalisation and prediction capability. The model also showed that the friction force for the TMP esters decreased with higher saturation levels. On the contrary, the lesser influence of the speed followed the characteristics of boundary lubrication, where hydrodynamic action is negligible. Thus, the GEP model is expected to provide a fundamental and empirical platform for further studies to optimise the boundary tribological properties of vegetable-oil-based TMP esters, encouraging the widespread adoption of such a biolubricant as an alternative to conventional lubricants.

Author Contributions

Conceptualization, C.T.L., W.W.F.C., J.-H.N. and C.T.C.; data curation, C.T.L., M.B.L. and K.J.W.; formal analysis, C.T.L., W.W.F.C. and J.-H.N.; funding acquisition, W.W.F.C.; investigation, C.T.L. and M.B.L.; methodology, C.T.L. and J.-H.N.; project administration, W.W.F.C. and K.J.W.; resources, W.W.F.C. and K.J.W.; supervision, W.W.F.C., J.-H.N. and C.T.C.; validation, C.T.L. and M.B.L.; visualization, C.T.L. and W.W.F.C.; writing—original draft, C.T.L. and W.W.F.C.; writing—review and editing, W.W.F.C., J.-H.N. and C.T.C. All authors have read and agreed to the published version of the manuscript.

Funding

This research study was funded by the UTM Fundamental Research Grant, Universiti Teknologi Malaysia (UTM) under project no. Q.J130000.3851.22H02 (PY/2015/04925).

Data Availability Statement

Not applicable.

Acknowledgments

The authors would like to acknowledge the technical advice on machine learning techniques provided by Kuan Yew Wong from the Faculty of Mechanical Engineering, Universiti Teknologi Malaysia.

Conflicts of Interest

The authors declare no conflict of interest.

Appendix A. Input Parameters for GEP Algorithm

ParametersSettings
General parameters
Number of chromosomes75, 150, 225
Head size6, 8, 10
Number of genes3, 6, 9
Linking functionAddition
Fitness functionEnhanced RSE
Function set+, -, ×, ÷, exp, natural logarithm, power of 2, cube root,
arctangent, hyperbolic tangent
Genetic operators
StrategyOptimal evolution
Mutation rate0.00138
Inversion rate0.00546
IS transportation rate0.00546
RIS transportation rate0.00546
One-point recombination rate0.00277
Two-point recombination rate0.00277
Gene recombination rate0.00277
Gene transposition rate0.00277
Numerical constants
Constants per gene10
Data typeFloating point
Upper-bound value−10
Lower-bound value10

Appendix B. Statistical Parameters

The statistical parameters used in the present study are summarised below:
R M S E = ( i = 1 n e i m i 2 n ) M A E = i = 1 n e i m i n R S E = i = 1 n m i e i 2 i = 1 n e ¯ e i 2 R R M S E = 1 | e ¯ | × R M S E R = i = 1 n e i e ¯ m i m ¯ i = 1 n e i e ¯ 2 m i m ¯ 2 R 2 = R × R ρ = R R M S E 1 + R k = ( i = 1 n e i m i 2 e i 2 ) k = ( i = 1 n e i m i 2 m i 2 ) R o 2 = 1 i = 1 n m i e i o 2 i = 1 n m i m i o 2 R o 2 = 1 i = 1 n e i m i o 2 i = 1 n e i e i o 2 e i o = k × m i m i o = k × e i O B F = n T n V n × ρ T + 2 n v n ρ v
The terms e and e ¯ refer to the experiment and its average values. In comparison, the terms m and m ¯ refer to the model and its average values, with the subscript i being the output value for the experiment and model. On the other hand, the term n is the number of values with subscripts T and V referring to training and validation subsets.

References

  1. Research and Markets. Biolubricants—Global Market Trajectory & Analytics. 2022. Available online: https://www.researchandmarkets.com/reports/1824122/biolubricants_global_market_trajectory_and (accessed on 2 November 2022).
  2. Singh, A.K.; Gupta, A.K. Metalworking fluids from vegetable oils. J. Synth. Lub. 2006, 23, 167–176. [Google Scholar] [CrossRef]
  3. Fox, N.J.; Tyrer, B.; Stachowiak, G.W. Boundary lubrication performance of free fatty acids in sunflower oil. Tribol. Lett. 2004, 16, 275–281. [Google Scholar] [CrossRef]
  4. Edla, S.; Thampi, A.D.; Prasannakumar, P.; Rani, S. Evaluation of physicochemical, tribological and oxidative stability properties of chemically modified rice bran and karanja oils as viable lubricant base stocks for industrial applications. Tribol. Int. 2022, 2022, 107631. [Google Scholar] [CrossRef]
  5. Owuna, F.J.; Dabai, M.U.; Sokoto, M.A.; Dangoggo, S.M.; Bagudo, B.U.; Birnin-Yauri, U.A.; Hassan, L.G.; Sada, I.; Abubakar, A.L.; Jibrin, M.S. Chemical modification of vegetable oils for the production of biolubricants using trimethylolpropane: A review. Egypt. J. Petrol. 2020, 29, 75–82. [Google Scholar] [CrossRef]
  6. Zulkifli, N.W.M.; Azman, S.S.N.; Kalam, M.A.; Masjuki, H.H.; Yunus, R.; Gulzar, M. Lubricity of bio-based lubricant derived from different chemically modified fatty acid methyl ester. Tribol. Int. 2016, 93, 555–562. [Google Scholar] [CrossRef]
  7. Narayanasarma, S.; Kuzhiveli, B.T. Evaluation of lubricant properties of polyolester oil blended with sesame oil-An experimental investigation. J. Clean. Prod. 2021, 281, 125347. [Google Scholar] [CrossRef]
  8. Aziz, N.A.M.; Yunus, R.; Hamid, H.A.; Ghassan, A.A.K.; Omar, R.; Rashid, U.; Abbas, Z. An acceleration of microwave-assisted transesterification of palm oil-based methyl ester into trimethylolpropane ester. Sci. Rep. 2020, 10, 1–17. [Google Scholar]
  9. Attia, N.K.; El-Mekkawi, S.A.; Elardy, O.A.; Abdelkader, E.A. Chemical and rheological assessment of produced biolubricants from different vegetable oils. Fuel 2020, 271, 117578. [Google Scholar] [CrossRef]
  10. Carvalho, W.C.A.; Luiz, J.H.H.; Fernandez-Lafuente, R.; Hirata, D.B.; Mendes, A.A. Eco-friendly production of trimethylolpropane triesters from refined and used soybean cooking oils using an immobilized low-cost lipase (Eversa>® Transform 2.0) as heterogeneous catalyst. Biomass Bioener 2021, 155, 106302. [Google Scholar] [CrossRef]
  11. Gul, M.; Zulkifli, N.W.M.; Masjuki, H.H.; Kalam, M.A.; Mujtaba, M.A.; Harith, M.H.; Syahir, A.Z.; Ahmed, W.; Farooq, A.B. Effect of TMP-based-cottonseed oil-biolubricant blends on tribological behavior of cylinder liner-piston ring combinations. Fuel 2020, 278, 118242. [Google Scholar] [CrossRef]
  12. Guimarey, M.J.G.; Goncalves, D.E.P.; del Río, J.M.L.; Comuñas, M.J.P.; Fernández, J.; Seabra, J.H.O. Lubricant properties of trimethylolpropane trioleate biodegradable oil: High pressure density and viscosity, film thickness, Stribeck curves and influence of nanoadditives. J. Mol. Liq. 2021, 335, 116410. [Google Scholar] [CrossRef]
  13. Elmelawy, M.S.; El-Meligy, A.; Mawgoud, H.A.; Morshedy, A.S.; Hanafy, S.A.; El-sayed, I.E. Synthesis and kinetics study of trimethylolpropane fatty acid triester from oleic acid methyl ester as potential biolubricant. Biomass Convers. Biorefinery 2021. [Google Scholar] [CrossRef]
  14. Lee, C.T.; Lee, M.B.; Mong, G.R.; Chong, W.W.F. A bibliometric analysis on the tribological and physicochemical properties of vegetable oil–based bio-lubricants (2010–2021). Environ. Sci. Pollut. Environ. 2022, 29, 56215–56248. [Google Scholar] [CrossRef]
  15. Rahim, E.A.; Amiril, S.A.S.; Mohid, Z.; Syahrullail, S. Tribological evaluation on vegetable oils based trimethylolpropane (TMP) ester as sustainable metalworking fluids in machining applications. In Proceedings of the 7th International Conference Mechanical, Manufacturing Engineering, Yogyakarta, Indonesia, 1–3 August 2016; pp. 1–8. [Google Scholar]
  16. Verma, P.; Sharma, M.P. Review of process parameters for biodiesel production from different feedstocks. Renew. Sustain. Energy Rev. 2016, 62, 1063–1071. [Google Scholar] [CrossRef]
  17. Zainal, N.A.; Zulkifli, N.W.M.; Gulzar, M.; Masjuki, H.H. A review on the chemistry, production, and technological potential of bio-based lubricants. Renew. Sustain. Energy Rev. 2018, 82, 80–102. [Google Scholar] [CrossRef]
  18. Biresaw, G.; Bantchev, G.B. Pressure viscosity coefficient of vegetable oils. Tribol. Lett. 2013, 49, 501–512. [Google Scholar] [CrossRef]
  19. Fasina, O.O.; Hallman, H.; Craig-Schmidt, M.; Clements, C. Predicting temperature-dependence viscosity of vegetable oils from fatty acid composition. J. Am. Oil Chem. Soc. 2006, 83, 899–903. [Google Scholar] [CrossRef]
  20. Kim, J.; Kim, D.N.; Lee, S.H.; Yoo, S.; Lee, S. Correlation of fatty acid composition of vegetable oils with rheological behaviour and oil uptake. Food Chem. 2010, 118, 398–402. [Google Scholar] [CrossRef]
  21. Verma, P.; Sharma, M.P.; Dwivedi, G. Evaluation and enhancement of cold flow properties of palm oil and its biodiesel. Energy Rep. 2016, 2, 8–13. [Google Scholar] [CrossRef] [Green Version]
  22. Siniawski, M.T.; Saniei, N.; Adhikari, B.; Doezema, L.A. Influence of fatty acid composition on the tribological performance of two vegetable-based lubricants. J. Synth. Lub. 2007, 24, 101–110. [Google Scholar] [CrossRef]
  23. Rajasozhaperumal, G.; Kannan, C. Influence of Fatty Acid Composition on the Tribological Performance of Methyl Esters Under Boundary Lubrication Regime. Arab. J. Sci. Eng. 2022. [Google Scholar] [CrossRef]
  24. Hamdan, S.H.; Chong, W.W.F.; Ng, J.H.; Ghazali, M.J.G.; Wood, R.J.K. Influence of fatty acid methyl ester composition on tribological properties of vegetable oils and duck fat derived biodiesel. Tribol. Int. 2017, 113, 76–82. [Google Scholar] [CrossRef]
  25. Rosenkranz, A.; Marian, M.; Profito, F.J.; Aragon, N.; Shah, R. The use of artificial intelligence in tribology—A perspective. Lubricants 2020, 9, 2. [Google Scholar] [CrossRef]
  26. Marian, M.; Tremmel, S. Current trends and applications of machine learning in tribology? A review. Lubricants 2021, 9, 86. [Google Scholar] [CrossRef]
  27. Durak, E.; Salman, Ö.; Kurbanoğlu, C. Analysis of effects of oil additive into friction coefficient variations on journal bearing using artificial neural network. Ind. Lub. Tribol. 2008, 60, 309–316. [Google Scholar] [CrossRef]
  28. Bhaumik, S.; Mathew, B.R.; Datta, S. Computational intelligence-based design of lubricant with vegetable oil blend and various nano friction modifiers. Fuel 2019, 241, 733–743. [Google Scholar] [CrossRef]
  29. Sattari Baboukani, B.; Ye, Z.; G Reyes, K.; Nalam, P.C. Prediction of nanoscale friction for two-dimensional materials using a machine learning approach. Tribol. Lett. 2020, 68, 1–14. [Google Scholar] [CrossRef]
  30. Iqbal, M.F.; Liu, Q.; Azim, I.; Zhu, X.; Yang, J.; Javed, M.F.; Rauf, M. Prediction of mechanical properties of green concrete incorporating waste foundry sand based on gene expression programming. J. Hazard. Mater. 2020, 384, 121322. [Google Scholar] [CrossRef]
  31. Sebaaly, H.; Varma, S.; Maina, J.W. Optimizing asphalt mix design process using artificial neural network and genetic algorithm. Construct. Build. Mater. 2018, 168, 660–670. [Google Scholar] [CrossRef] [Green Version]
  32. Ferreira, C. Gene expression programming: A new adaptive algorithm for solving problems. arXiv 2001, arXiv:cs/0102027. [Google Scholar]
  33. Faradonbeh, R.S.; Armaghani, D.J.; Monjezi, M.; Mohamad, E.T. Genetic programming and gene expression programming for flyrock assessment due to mine blasting. Int. J. Rock. Mech. Mining Sci. 2016, 88, 254–264. [Google Scholar] [CrossRef]
  34. Gandomi, A.H.; Roke, D.A. Assessment of artificial neural network and genetic programming as predictive tools. Adv. Eng. Softw. 2015, 88, 63–72. [Google Scholar] [CrossRef]
  35. Aslam, F.; Farooq, F.; Amin, M.N.; Khan, K.; Waheed, A.; Akbar, A.; Javed, M.F.; Alyousef, R.; Alabdulijabbar, H. Applications of gene expression programming for estimating compressive strength of high-strength concrete. Adv. Civ. Eng. 2020, 2020. [Google Scholar] [CrossRef]
  36. Ren, L.; Wang, N.; Pang, W.; Li, Y.; Zhang, G. Modeling and monitoring the material removal rate of abrasive belt grinding based on vision measurement and the gene expression programming (GEP) algorithm. Int. J. Adv. Manufact. Tech. 2022, 120, 385–401. [Google Scholar] [CrossRef]
  37. Mahdinia, S.; Eskandari-Naddaf, H.; Shadnia, R. Effect of cement strength class on the prediction of compressive strength of cement mortar using GEP method. Construct. Build. Mater. 2019, 198, 27–41. [Google Scholar] [CrossRef]
  38. Tariq, M.; Ali, S.; Ahmad, F.; Ahmad, M.; Zafar, M.; Khalid, N.; Khan, M.A. Identification, FT-IR, NMR (1H and 13C) and GC/MS studies of fatty acid methyl esters in biodiesel from rocket seed oil. Fuel Process. Technol. 2011, 92, 336–341. [Google Scholar] [CrossRef]
  39. Yunus, R.; Lye, O.T.; Fakhru’l-Razi, A.; Basri, S. A simple capillary column GC method for analysis of palm oil-based polyol esters. J. Am. Oil Chem. Soc. 2002, 79, 1075–1080. [Google Scholar] [CrossRef]
  40. Meng, F.; Han, H.; Ma, Z.; Tang, B. Effects of Aviation Lubrication on Tribological Performances of Graphene/MoS2 Composite Coating. J. Tribol. 2021, 143, 031401. [Google Scholar] [CrossRef]
  41. Hamrock, B.J.; Dowson, D. Isothermal elastohydrodynamic lubrication of point contacts: Part IV–starvation results. J. Lubrication Tech. 1977, 99, 15–23. [Google Scholar] [CrossRef]
  42. Dunlop, P.; Smith, S. Estimating key characteristics of the concrete delivery and placement process using linear regression analysis. Civ. Eng. Environ. Syst. 2003, 20, 273–290. [Google Scholar] [CrossRef]
  43. Mousavi, S.M.; Aminian, P.; Gandomi, A.H.; Alavi, A.H.; Bolandi, H. A new predictive model for compressive strength of HPC using gene expression programming. Adv. Eng. Softw. 2012, 45, 105–114. [Google Scholar] [CrossRef]
  44. Gandomi, A.H.; Babanajad, S.K.; Alavi, A.H.; Farnam, Y. Novel approach to strength modeling of concrete under triaxial compression. J. Mater. Civ. Eng. 2012, 24, 1132–1143. [Google Scholar] [CrossRef]
  45. Lee, C.T.; Lee, M.B.; Hamdan, S.H.; Chong, W.W.F.; Chong, C.T.; Zhang, H.; Chen, A.W.L. Trimethylolpropane trioleate as eco-friendly lubricant additive. Eng. Sci. Tech. Int. J. 2022, 35, 101068. [Google Scholar] [CrossRef]
  46. Yuan, W.; Hansen, A.C.; Zhang, Q. Vapor pressure and normal boiling point predictions for pure methyl esters and biodiesel fuels. Fuel 2005, 84, 943–950. [Google Scholar] [CrossRef]
  47. Folayan, A.J.; Anawe, P.A.L.; Aladejare, A.E.; Ayeni, A.O. Experimental investigation of the effect of fatty acids configuration, chain length, branching and degree of unsaturation on biodiesel fuel properties obtained from lauric oils, high-oleic and high-linoleic vegetable oil biomass. Energy Rep. 2019, 5, 793–806. [Google Scholar] [CrossRef]
  48. He, Y.; Fujikawa, Y.; Zhang, H.; Fukuzawa, K.; Mitsuya, Y. Evaluations of tribological characteristics of PFPE lubricants on DLC surfaces of magnetic disks. Tribol. Lett. 2007, 27, 1–11. [Google Scholar] [CrossRef]
Figure 1. Two-stage transesterification process flow diagram for TMP ester synthesis.
Lubricants 10 00346 g001
Figure 2. Example gas chromatogram for palm TMP ester. (a) Methyl oleate (MO), (b) trimethylolpropane oleate (TMPO), (c) palm TMP ester.
Lubricants 10 00346 g002
Figure 3. Purpose-built ball-on-disc tribometer.
Lubricants 10 00346 g003
Figure 4. Friction force for vegetable-oil-derived TMP esters at varied loads and speeds. (a) Palm. (b) Olive. (c) Coconut. (d) Grapeseed–coconut. (e) Canola. (f) Canola–sunflower. (g) Canola–palm–soybean.
Lubricants 10 00346 g004
Figure 5. Coefficient of friction for vegetable-oil-derived TMP esters against the lambda parameter ( λ = h m i n / σ ). (a) Palm. (b) Olive. (c) Coconut. (d) Grapeseed–coconut. (e) Canola. (f) Canola–sunflower. (g) Canola–palm–soybean. (Note: The dots represent the experiment data, while the lines represent the fitted trend line.)
Lubricants 10 00346 g005
Figure 6. GEP model data from vegetable-oil-derived TMP ester friction tests for training, validation and testing sets.
Lubricants 10 00346 g006
Figure 9. Friction force comparison between experiment (target) and GEP model for vegetable-oil-derived TMP esters. (a) Training subset. (b) Validation subset. (c) Testing subset.
Lubricants 10 00346 g009
Figure 10. GEP model correlation between input variables and friction force for vegetable-oil-derived TMP esters. (a) Variable importance. (b) Saturation level (SA). (c) Monounsaturation level (MU). (d) Load. (e) Speed.
Lubricants 10 00346 g010
Table 1. Fatty acid composition of vegetable oils.
ParameterPalmOliveCoconutGrapeseed–CoconutCanolaCanola–SunflowerCanola–Palm–Soybean
C8:00.020.073.893.79-0.130.09
C10:00.010.105.164.820.010.190.09
C12:00.131.0319.3014.990.031.810.98
C14:01.510.5512.899.930.021.082.05
C16:034.4716.8310.1610.400.0411.0525.22
C18:06.514.994.372.580.125.736.79
C20:0-1.920.361.430.091.701.57
C21:0-0.36-0.402.28-0.06
C16:10.514.530.091.310.690.830.75
C18:148.0547.8313.212.0711.3115.2113.42
C20:10.811.490.703.012.272.981.08
C18:20.38---73.832.561.42
C18:30.334.273.5626.755.2144.9339.21
Other7.2716.0426.3018.524.1011.787.27
Saturation, SA (%)46.0030.7976.1759.322.7024.6039.74
Monounsaturation, MU (%)53.2464.1319.007.8514.8821.5716.44
Polyunsaturation, PU (%)0.765.084.8332.8382.4253.8343.82
Table 2. Correlation coefficient matrix for variables.
ParametersSA (%)MU (%)PU (%)Load (mN)Speed (m/s)
SA (%)1
MU (%)−0.1031
PU (%)−0.715−0.6211
Load (mN)−0.027−0.0470.0541
Speed (m/s)0.0580.033−0.069−0.0431
Table 3. Physicochemical properties and spin-coated film thickness of vegetable-oil-derived TMP esters.
ParameterPalmOliveCoconutGrapeseed–CoconutCanolaCanola–SunflowerCanola–Palm–Soybean
Density (g/mL)
@25 °C0.9020.9210.8980.9540.9350.9370.922
Kin. viscosity (mm/s2
@40 °C22.9572.2912.8720.82154.50142.1665.34
@100 °C5.4513.854.124.7918.0317.2312.04
ISO viscosity gradeVG 22VG 68-VG 22VG 150VG 150VG 68
Viscosity index (VI)188199259160121132184
Flash point (°C)15211614014898102118
Pour point (°C)11−87−6−9−46
Decomposition
onset temperature (°C)362384345326401392367
Spin-coated film
thickness (μm)4.858.63.844.2111.410.277.42
Viscosity–pressure
coefficient, α @25 °C
(×10−8 Pa−1)1.631.691.291.72.242.21.77
Table 4. Statistical parameters of the GEP model.
ParametersTrainingValidationTesting
R M S E 13.56711.17312.049
M A E 10.9209.04710.161
R S E 0.1430.2010.093
R R M S E 0.1540.1350.119
R0.9260.9080.957
R 2 0.8580.8240.916
ρ 0.0800.0710.061
O B F -0.0780.076
Table 5. Statistical parameters of the GEP model for external validation.
ParametersCriteriaTrainingValidationTesting
k 0.85 < k < 1.15 0.9760.9980.957
k 0.85 < k < 1.15 1.0030.9861.033
R o 2 R o 2 1 0.9730.9990.894
R o 2 R o 2 1 0.9990.9880.933
Publisher’s Note: MDPI stays neutral with regard to jurisdictional claims in published maps and institutional affiliations.

