Article

Performance Characteristics of Spur Gears Hobbed under MQL, Flood Lubrication, and Dry Environments

1
Department of Mechanical Engineering, IIT Bombay, Mumbai 400 076, India
2
Department of Mechanical Engineering, IIT Indore, Indore 453 553, India
3
Mechanical and Industrial Engineering Technology, University of Johannesburg, Doornfontein Campus, Johannesburg 2028, South Africa
*
Author to whom correspondence should be addressed.
Lubricants 2022, 10(10), 230; https://doi.org/10.3390/lubricants10100230
Submission received: 26 August 2022 / Revised: 15 September 2022 / Accepted: 20 September 2022 / Published: 21 September 2022

Abstract

:
This paper presents the influence of three lubrication environments, namely hobbing with minimum quantity lubrication (HWMQL), hobbing with flood lubrication (HWFL), and hobbing without any lubrication (HWAL), on the wear characteristics, microhardness, functional performance parameters, generation of noise and vibrations, flank surface roughness, and microgeometry deviation parameters of spur gears. Convective heat transfer coefficients in HWMQL and HWFL are evaluated to study the cooling mechanism involved and their heat dissipation capabilities during spur gear manufacturing. It is found that HWMQL-manufactured spur gears exhibited higher microhardness and smaller values of microgeometry deviations, flank surface roughness, functional performance parameters, wear rate, wear volume, and noise and vibrations than the spur gears manufactured by HWFL and HWAL. HWMQL facilitated a significantly higher convective heat transfer coefficient than HWFL, indicating its superior hobbing performance. An examination of the worn flank surfaces of HWMQL-manufactured gears revealed a wear track that resulted in less abrasive wear, wear debris, and subsurface damage, whereas the worn flank surfaces of HWFL-manufactured gears showed deep grooves, feed marks, and surface defects. This study proves that HWMQL is capable of manufacturing gears with better accuracy, enhanced wear resistance, smoother and quieter operational performance, and longer service life due to its better cooling and lubrication action. The results of this study will be very helpful for the manufacturers and users of spur gears.

Graphical Abstract

1. Introduction

Spur gears are the most commonly used type of cylindrical gears. They are used for the transmission of torque and/or speed between parallel shafts for various applications in automobiles, agriculture and farm machineries, construction equipment, material handling equipment, miniature devices, office automation, power plants, wind turbines, etc.
The transmission of torque and speed by a gear causes the continuous rolling and sliding contact of its flank surfaces with the flank surfaces of its mating gear. This causes wear in the gear through the continuous and gradual removal of material from its flank surfaces, which grow progressively with its prolonged use [1,2]. Gears usually exhibit two types of wear modes, i.e., abrasive wear and adhesive wear, depending on factors such as load, speed, and temperature. Abrasive wear occurs when a hard rough surface slides across a softer surface, removing material from it. It occurs in the early stages of gear contact. Adhesive wear occurs due to sliding one solid surface along another surface when both are loaded against each other and the whole contact load is carried only by the very small area of asperity contacts. It usually occurs over the time, resulting from excessive load, low velocity, and reduced oil viscosity. Strong atomic bonding at the surface initiates the removal of the material from the softer material. Surfaces with higher hardness have less adhesive wear [3]. Wear in gears causes higher noise and vibrations. It adversely affects the performance of a gear and could even lead to its untimely premature failure. Therefore, it is mandatory to manufacture gears of good quality and have higher wear resistance for their prolonged service life and higher transmission efficiency [4]. Figure 1a presents parameters that influence the generation of gear noise and vibrations and Figure 1b depicts the gear parameters that determine its quality. It can be observed that these parameters include microgeometry deviations (i.e., total profile deviation ‘Fa’, total lead deviation ‘Fβ’, total or cumulative pitch deviation ‘Fp’, and analytic-testing-determined radial runout ‘Fra’), the maximum and average roughness of the flank surface (‘Rmax’ and ‘Ra’), functional performance parameters (i.e., total composite error ‘Fi’, tooth-to-tooth composite error ‘fi’, and functional-testing-determined radial runout ‘Frf’), and the microhardness and wear aspects of the surface integrity. These factors contribute approximately 30% of the generation of gear noise and vibrations [5]. Superior wear resistance, lower noise and vibrations, efficient motion transmission, and longer service life are the most important aspects that determine the gear quality.
The manufacturing of better-quality and quiet gears can be achieved by minimizing the parameters of microgeometry deviations and flank roughness and improving the microhardness and wear characteristics of gear flank surfaces. Gear hobbing is one of the most widely used material removal processes for cylindrical gear manufacturing. However, hobbing uses a large amount of synthetic machining fluids (SMF) through conventional flood lubrication to minimize heat generation in the machining zone so as to improve gear quality. SMF in hobbing with flood lubrication (HWFL) constitutes about 20% of the total manufacturing costs, and it has been found to adversely affect the environment and human health, thus hampering the sustainability of gear hobbing process. Additionally, gears manufactured by HWFL require different finishing processes to minimize the parameters of flank surface roughness, microgeometry deviations, and functional performance. It prolongs the process chain and contributes nearly 60–70% to the overall manufacturing cost of a gear [6]. These limitations associated with the usage of SMF in HWFL have led to exploring various new alternative techniques, such as dry hobbing or hobbing without any lubrication (HWAL), near-dry hobbing or hobbing with minimum quantity lubrication (HWMQL), minimum quantity cooling (MQC), cryogenic cooling, minimum quantity cooling and lubrication (MQLC), and cold air MQL (CAMQL), to minimize the consumption of harmful SMF and improve gear quality and the sustainability of the process. Minimum quantity lubrication (MQL) is a prominent near-dry lubrication technique which involves the direct supply of an aerosol mixture consisting of a very small quantity of lubricants (50–200 mL/h) and compressed air to the machining zone. It is being extensively explored for use in conventional machining as well as the gear hobbing process with an objective to improve process sustainability without compromising the product quality and process productivity. The use of environment- and human-friendly lubricants such as vegetable oils, fatty alcohols, and synthetic esters in MQL further reduces the detrimental environmental effects of SMF. The convective heat transfer coefficients of the machining fluids used in different lubrication conditions determine their capability to take away the heat from the machining zone. The poor heat transfer capability of a lubricant and coolant causes the thermal distortion of the manufactured product including gears. Limited investigations have been reported on the use of MQL in the gear manufacturing process. Fratila [7] used MQL in the gear milling process and reported that MQL resulted in a better surface quality of helical gear flank surfaces as compared to conventional and dry cutting. Fratila [8] also studied the geometric accuracy of the milled gears under the influence of different cooling and lubrication techniques. It was revealed that MQL-assisted milling yielded better results than conventional FL techniques. Zhang and Wei [9] carried out experiments on MQL-equipped gear hobbing and performed multiperformance optimization for gear surface roughness and hob wear. They concluded that an MQL oil flow rate of 40 mL/h, a cold air temperature of −45 °C, and a feed rate of 0.2 mm/rev were optimum parameters to obtain reduced flank surface roughness. Moreover, past investigations on the effect of different sustainable lubrication techniques, such as dry lubrication, MQL, cryo-MQL (using cryogenic fluids), and cryogenic cooling, in machining processes have reported superior performances as compared to flood lubrication in terms of microhardness and microstructure [10,11,12,13].
However, no work has been reported on the effect of hobbing under different lubrication conditions on the performance characteristics of spur gears. In addition, no literature is available on the study of the heat-carrying abilities of different cooling and lubrication environments in hobbing. Therefore, in the present investigation, attempts have been made to study the capability and efficiency of HWMQL for manufacturing gears without the use of any subsequent postprocessing processes as compared to HWFL and HWAL.
The following are the detailed objectives of the present work:
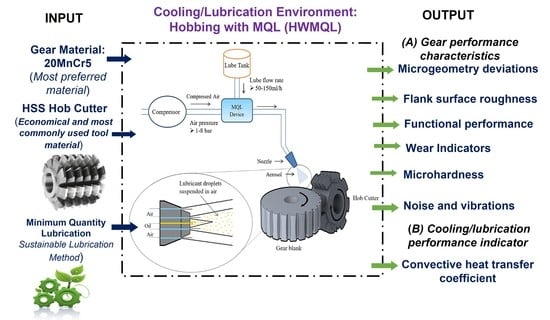
  • To study the influence of three hobbing lubrication environments, i.e., HWAL, HWMQL, and HWFL, on the performance characteristics of the best-quality spur gears (manufactured using their corresponding optimum parametric combinations) in terms of wear, microhardness, functional performance, noise and vibrations, flank surface roughness, and microgeometry deviations.
  • To study heat dissipation from the hobbing zone in HWMQL and HWFL during spur gear manufacturing by estimating their convective heat transfer coefficients theoretically and experimentally.
The outcome of the present work will help in establishing HWMQL as the most efficient and sustainable process for improving the performance characteristics of near-net-shaped manufactured spur gears without compromising on productivity.

2. Materials and Methods

2.1. Materials and Experimental Apparatus

Alloy steel 20MnCr5 (having chemical composition 0.8–1.1% Cr, 1–1.3% Mn, 0.14–0.19% C, 0.035% P and S, and 0.15–0.40% and balanced Fe) was selected as the gear material due to its very good machinability and widespread commercial applications. It is one of the most commonly used materials for the commercial production of heavy-duty gears shafts, axles, etc., owing to its higher tensile strength of 1000−1300 N/mm2 and hardness of around 35 HRC. A single-start hob cutter made of Emo5Co5 high speed steel (HSS) was used for manufacturing spur gears under three considered lubrication environments. MQL system MT-MQL V2.2 (as shown in Figure 2a) was used to supply biodegradable fatty alcohol-based lubricant ‘Hyspray 1536’ (having flash point of 194 °C and kinematic viscosity of 28 mm2/s) through 4 micronozzles to the hobbing zone on the vertical hobbing machine (from DG Panchal Ahmedabad, India). A mixture of water, hydrocarbon oil, and machining fluid ‘Servocut S’ (having a flash point of 150 °C and a kinematic viscosity of 20 mm2/s) was used as the lubricant in HWFL. Figure 2b depicts the experimental apparatus used for HWMQL, HWFL, and HWAL. The specifications of the manufactured spur gears (depicted in Figure 2c) were: involute profile; 3 mm module; 16 teeth; 54 mm outer diameter; 10 mm face width; and 20° pressure angle.

2.2. Experimentation

Nine full factorial experiments were conducted by varying hob cutter speed ‘V’ and axial feed rate ‘f’’ at three levels each (i.e., at 15, 22, and 29 m/min and at 0.32, 0.44, and 0.56 mm/rev, respectively) for each lubrication environment, namely HWMQL, HWFL, and HWAL (thus in total 27 experiments were conducted), to identify their optimum values using the criteria of the simultaneous minimization of surface roughness and microgeometry deviations and the maximization of material removal rate (MRR). The identified optimum values of hob cutter speed and axial feed rate were: (i) 29 m/min and 0.44 mm/rev for HWMQL, (ii) 22 m/min and 0.44 mm/rev for HWFL, and (iii) 29 m/min and 0.32 mm/rev for HWAL. The previously identified optimum values of MQL parameters (i.e., 100 mL/h as lubricant flow rate, 4 bar as compressed air pressure, and 30° as nozzle inclination angle) by Kharka et al. [14] were used in HWMQL. A lubricant flow rate of 2500 mL/h was used in HWFL, and no lubricant was used in HWAL. A constant value of depth of cut of 2.25 mm was used for HWMQL, HWFL, and HWAL environments. Spur gears manufactured using these identified optimum parameters of HWMQL, HWFL, and HWAL are referred to as the best-quality gears in the subsequent texts, and their performance characteristics have been investigated.

2.3. Measurement of Responses

The following subsections describe the measurement of wear-indicating parameters, microhardness, noise and vibration levels, functional performance parameters, microgeometry deviations, flank surface roughness, and the estimation of convective heat transfer coefficients in HWMQL and HWFL.

2.3.1. Wear-Indicating Parameters and Microhardness

Wear significantly affects the overall performance of gears, and therefore manufacturing gears having higher wear resistance is crucial. Gear wear is also influenced by the microhardness of flank surfaces. Gears having higher microhardness and minimum values of wear indicators exhibit superior resistance to wear during high motion/power transmission applications [4]. The fretting wear test is used to determine the wear resistance of gears manufactured by hobbing in different lubrication environments. The fretting wear test was carried out on an arbitrarily chosen tooth of the best-quality spur gear manufactured by HWMQL, HWFL, and HWAL using the tribometer CM-9104 from Ducom, India. The sample was prepared by removing the chosen tooth from the gear by the wire spark erosion machining process and embedding it in a cold mount block. The test was performed by sliding a 5 mm diameter stainless-steel ball along the profile of the embedded gear flank surface for 5 mm distance with a 20 Hz frequency for 20 min under a 20 N applied load. It resulted in 1876.2 MPa as the maximum value of Hertzian contact pressure considering contact between the spherical stainless-steel ball (Poisson’s ratio = 0.265; Young’s modulus of elasticity = 210 GPa) and gear tooth (i.e., plane surface) made of 20MnCr5 (Poisson’s ratio = 0.3; Young’s modulus of elasticity = 190 GPa). The ball had Rockwell hardness 66 on the C-scale. The tribometer also yielded values of the frictional force and coefficient of friction with time in graphical form. The specific wear rate ‘ki’ (mm3/N-m) was evaluated using the Archard relation, which is given by Equation (1) [15]:
k i = m i ρ g F S
Here, ‘F’ is the applied normal load (N); ‘S’ is the total sliding distance (m) which is equal to twice the value obtained by multiplying the sliding distance, frequency, and time duration; ‘mi’ is the mass loss during the wear test (g); and ‘ρg’ is the density of the gear material (7.85 × 10⁻³ g/mm3). The mass lost during wear in the gear tooth was measured using a precision weighing balance having the least count of 0.01 mg. The wear rate (mm3/m) was obtained by multiplying specific wear rate and applied load, i.e., the wear rate was independent of the load applied, and the wear volume (mm3) during the fretting wear test ‘Vi’ was obtained as the product of wear rate and total sliding distance. Microscopic images of the worn gear surfaces were taken using JSM-7610F Plus Schottky field emission scanning electron microscope (FE-SEM) to study the wear pattern and worn surface morphology.
The microhardness of the best-quality manufactured spur gears was evaluated by applying a load of 100, 200, and 300 g for 15 s each on Vicker’s microhardness tester VMH-002 from Walter UHL, Germany. Microhardness values were measured at the different depths of 0, 20, 40, and 60 µm from the flank surface, where zero depth denotes the microhardness measurement at the flank surface of a manufactured spur gear. Three indentations were made for each applied load at each depth and the average of the measured microhardness values was used for the analysis.

2.3.2. Noise and Vibration Levels

The vibration of gears during operation affects the stability of the system and also results in unwanted noise generation [16]. The generation of noise and vibrations with time is also affected by the wear in gears, which grows gradually with usage.
The noise and vibrations of each spur gear manufactured by HWMQL, HWFL, and HWAL were measured using the in-house developed test rig [17] as shown in Figure 3. It was equipped with a gearbox for testing the spur gear and its master gear by mounting them on the parallel shafts which were supported by pedestal bearings at the other end. The motor of the gearbox was run at the four different speeds of 250, 500, 750, and 1000 r/min under 0.027, 0.054, 0.081, and 0.108 Nm applied load. Vibration signals were acquired by a tri-axial accelerometer mounted over the test rig gearbox, and noise signals were acquired by a microphone placed at a standard distance of 1 m from the gearbox. The acquired signals were transferred to the 4-channel noise and vibrations data acquisition system OR 35 from OROS, France. NV Gate 9.0, a 3-series software from OROS, France, was used to analyze the acquired signals.

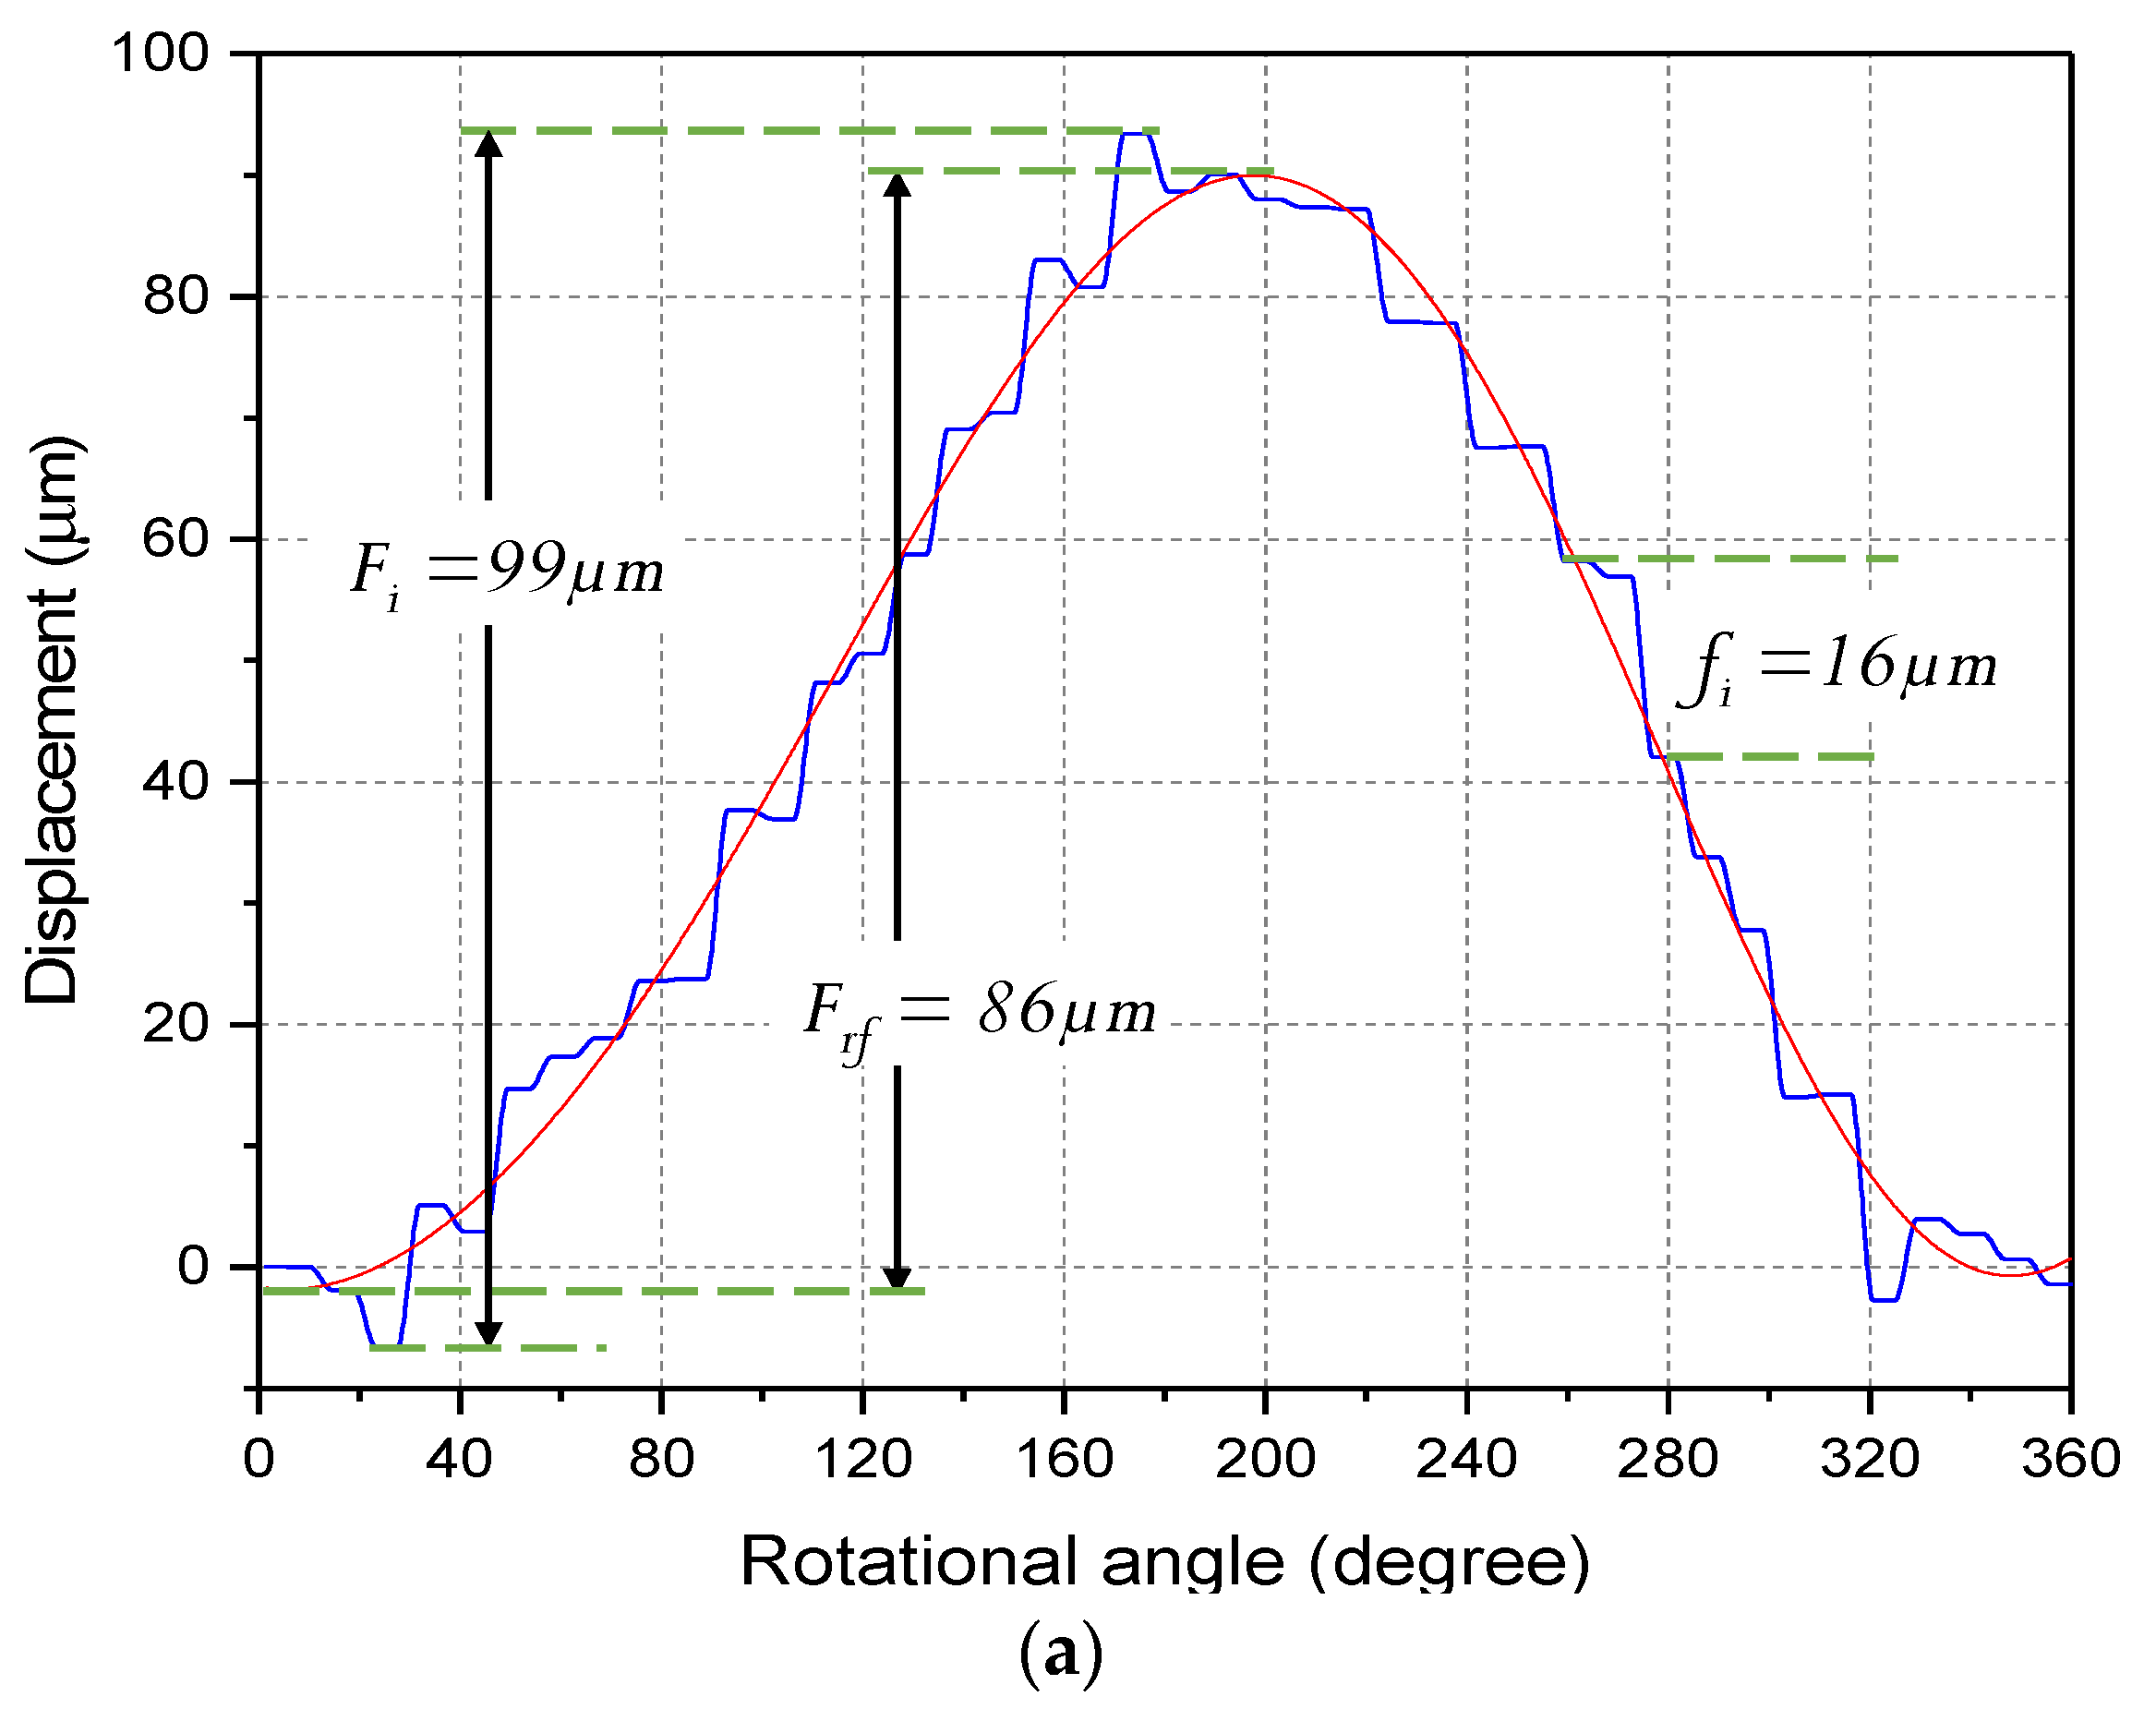
2.3.3. Functional Performance Parameters

The functional testing of a gear simulates its actual running condition, and functional performance parameters capture combined the effects of microgeometry deviations, misalignment, and transmission efficiency. Functional performance parameters, namely total composite error ‘Fi’, tooth-to-tooth composite error ‘fi’, and radial runout ‘Frf’, assess the actual operational performance of a gear when rotated in mesh with a master gear, thus simulating its actual working condition. The tooth-to-tooth composite error ‘fi’ is a variation in the center-to-center distance per tooth per revolution (i.e., 360/number of teeth) of the test gear. Total composite error ‘Fi’ is the total change in the center-to-center distance in one complete revolution of the test gear. It is the combination of radial runout with tooth-to-tooth composite error. Functional-testing-determined radial runout ‘Frf’ is the variation between the maximum and the minimum radial distance from the test gear axis evaluated by eliminating the short-term or undulation pitch deviations and only considering the long-term sinusoidal waveform. A dual flank roll tester was developed [17] and subsequently integrated with a stepper motor, Arduino-programmed microcontroller, and a laser displacement sensor was used to evaluate the functional performance parameters of the best-quality spur gears manufactured by HWMQL, HWFL, and HWAL. Figure 4 shows its photograph.

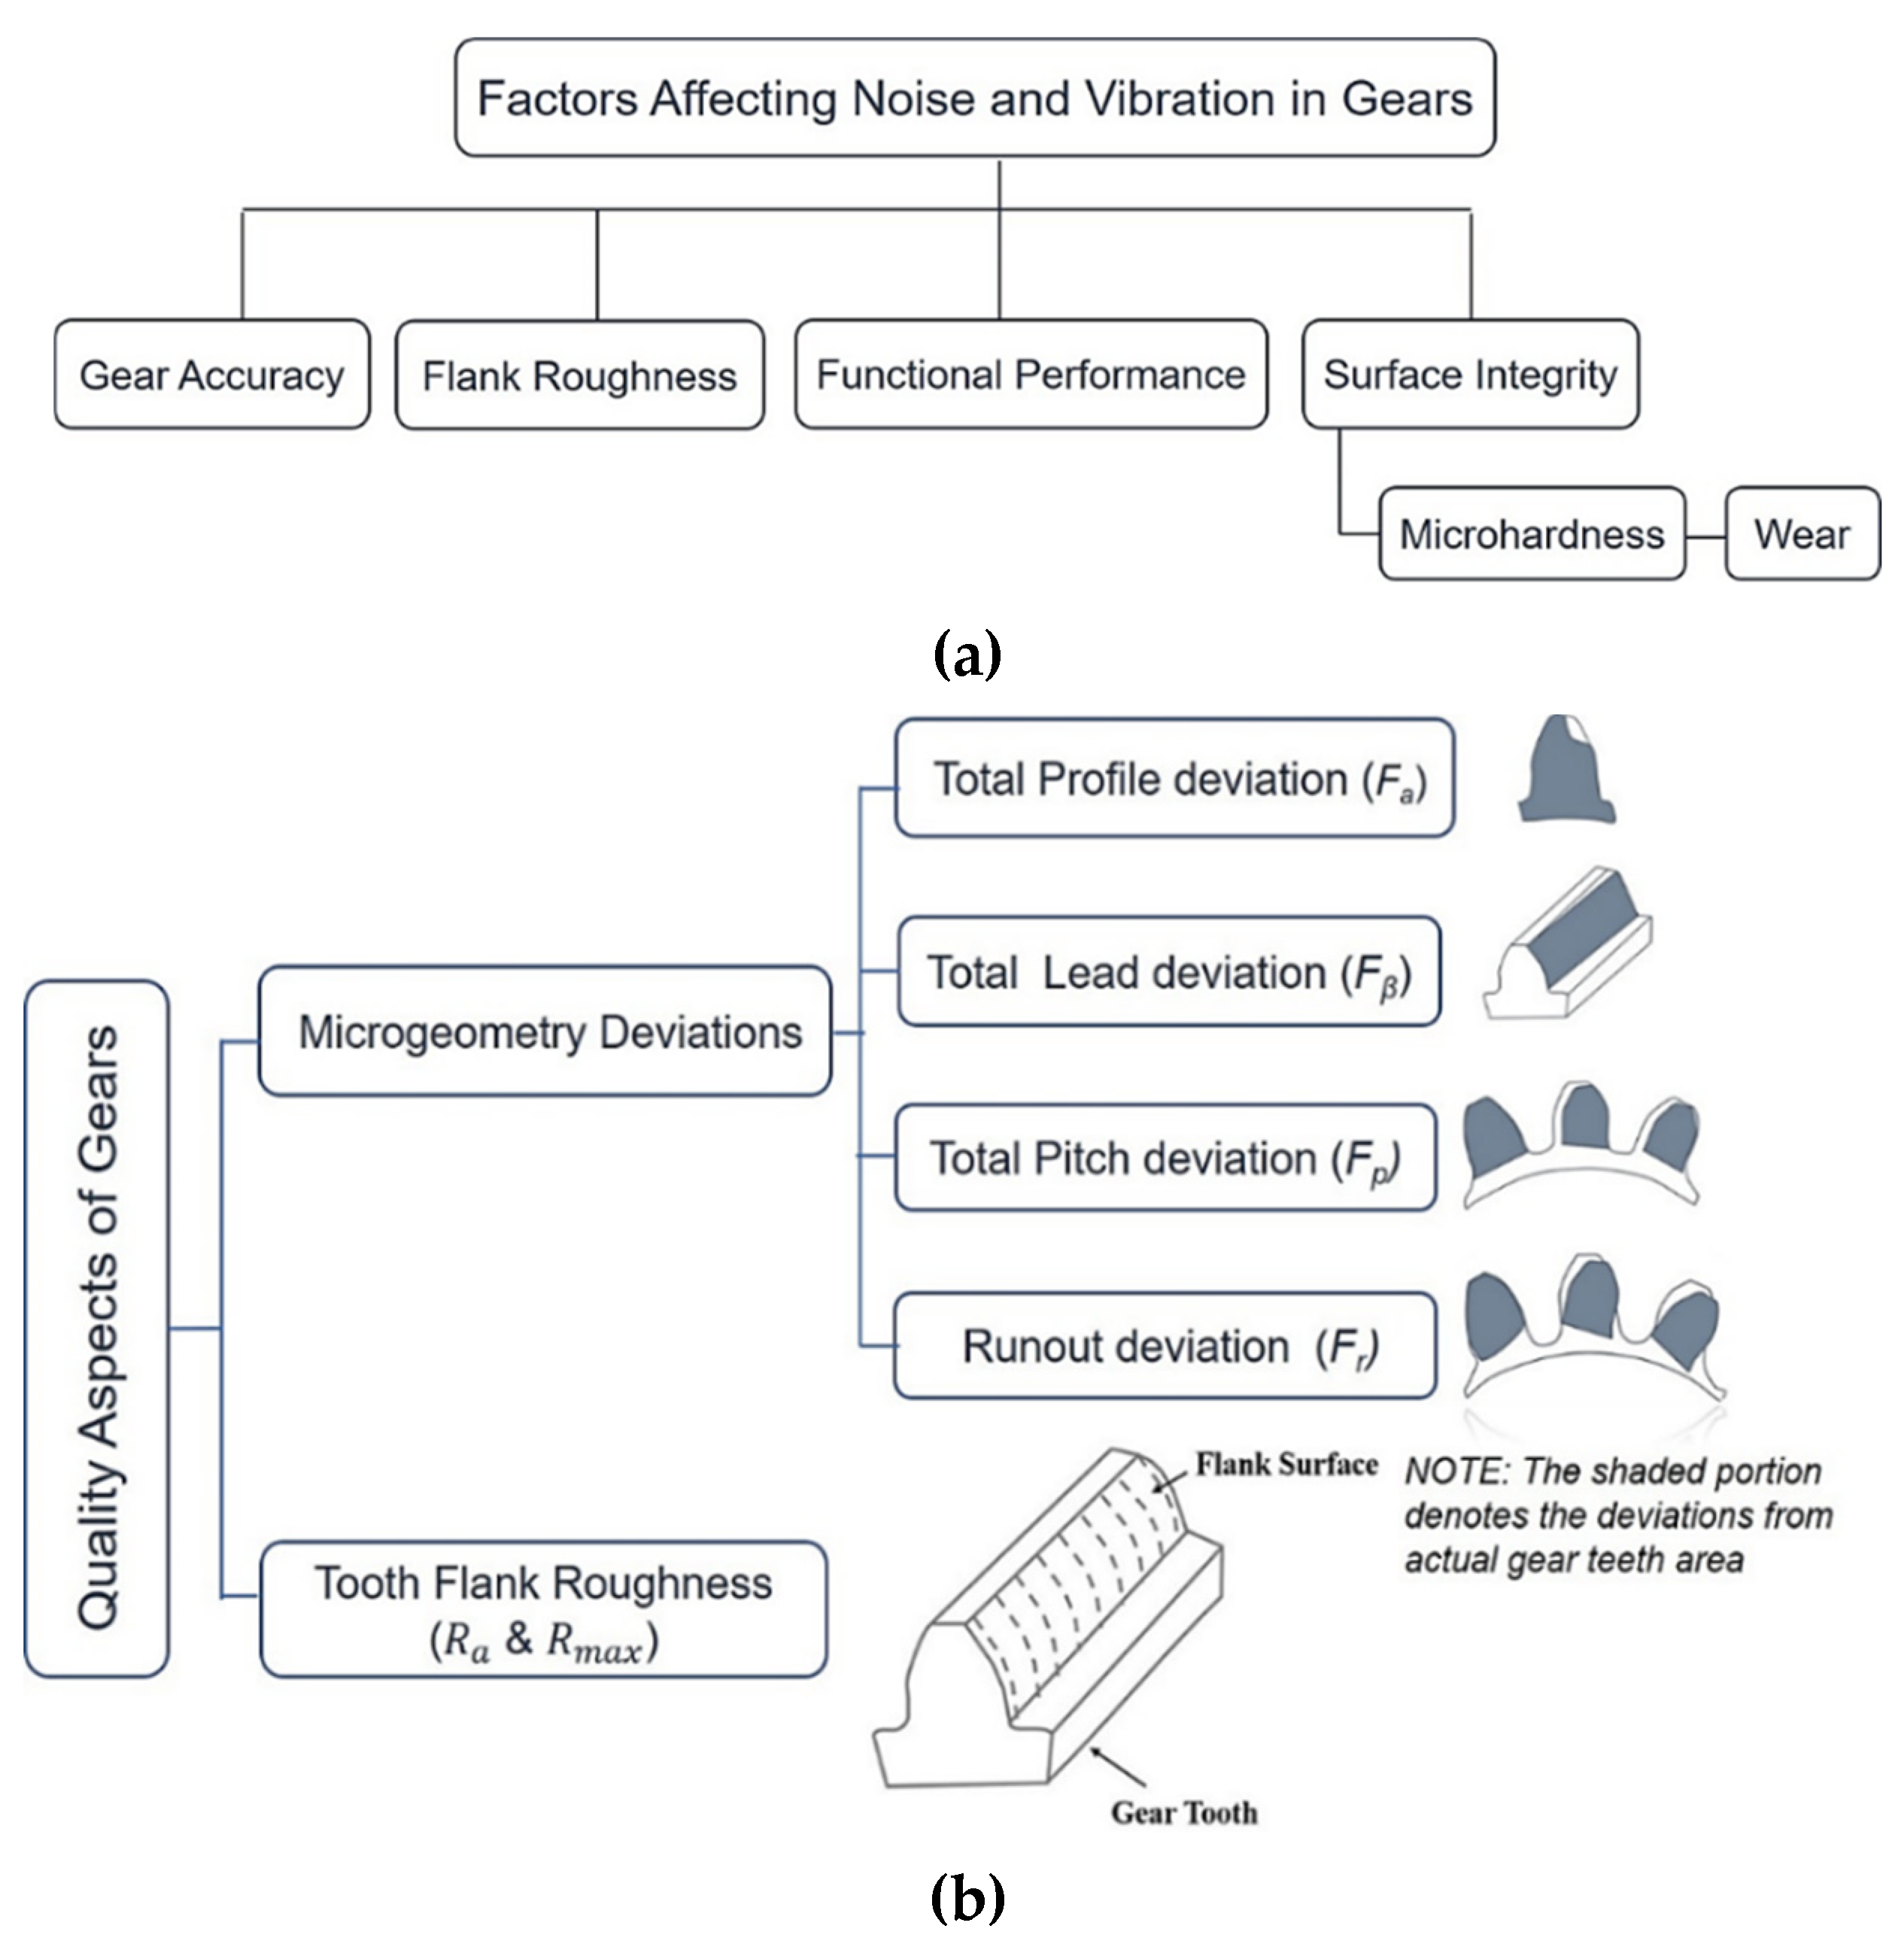
2.3.4. Microgeometry Deviations and Flank Surface Roughness

Microgeometry deviations and flank roughness parameters significantly impact the geometric accuracy of gears. Deviations in gear microgeometry include: (i) form errors (i.e., total deviation in profile ‘Fa’ and total deviation in lead ‘Fβ’) which refer to variation in shape and slope of the gear tooth and (ii) location errors (i.e., total or cumulative pitch deviation ‘Fp’ and analytic-testing-determined radial runout ‘Fra’), which indicate variations in the positioning of gear teeth along the circumference. Microgeometry deviations for the best-quality spur gears were measured on the computer numerically controlled (CNC) gear metrology machine SmartGear 500 from Wenzel GearTec, Germany, against DIN 9 quality corresponding to DIN 3962 standard, which is one of the most widely used standards by gear manufacturing industries. Measurements were taken on the left and right flank surfaces of 4 randomly selected gear teeth for the evaluation of ‘Fa’ and ‘Fβ’ (i.e., a total of 8 measurements was taken for ‘Fa’ and ‘Fβ’ each) and the arithmetic mean was used for analyses. Measurements were taken over the left and right flanks of all 16 teeth for evaluation of ‘Fp’ and ‘Fra’ (i.e., 32 total measurements were taken for ‘Fp’ and ‘Fra’ each) and the arithmetic mean was considered for further study. The maximum and average roughness (‘Rmax’ and ‘Ra’) values were measured by tracing a 2 µm diameter probe on the left and right flank surfaces of two randomly chosen teeth of the best-quality spur gear on 3D surface roughness measuring equipment MarSurf LD-130 from Mahr Metrology, Germany. Thus, 8 values of ‘Rmax’ and 8 values of ‘Ra’ were measured for one manufactured gear. A cut-off length of 0.8 mm, evaluation length of 4 mm, and Gaussian filter were used to distinguish between roughness and waviness parameters. The arithmetic mean of the 8 measured values of ‘Rmax’ (or ‘Ra’) was used for further analysis. Microscopic images of the flank surfaces of the best-quality gear manufactured by HWMQL, HWFL, and HWAL were examined by optical microscopic DM2500 from Leica.

2.3.5. Evaluation of Convective Heat Transfer Coefficient in HWMQL and HWFL

Heat generated at the hobbing zone during teeth generation directly influences the quality of the gears manufactured. Hence, it is very crucial to minimize heat accumulation and carry away the generated heat for improving the hobbing efficiency and manufacturing better-quality gears. The convective heat transfer coefficient is an important parameter to quantify the dissipation of heat from the hobbing zone. It depends on the flow characteristic of the lubricants, nature, and geometry of the tool and workpiece used [18]. Therefore, the estimation of the convective heat transfer coefficient between the gear tooth–hob interface and environment is necessary for understanding the effectiveness of the lubrication environment.
The heat transfer mechanism of the machining fluids in the gear hobbing process can be considered analogous to the heat carried away by a fluid flowing across a rotating cylinder. Neglecting the effects of natural convection and radiation, the heat transfer can be considered entirely due to forced convection. Heat loss by forced convection from the teeth generating zone of the gear blank mounted in the hobbing process can be expressed by Equation (2):
Q = h   A g   ( T g T c f )
where ‘Q’ is the heat taken away by the lubricant (W), ‘h’ is the convective heat transfer coefficient (W/m2K), ‘Ag’ is the surface area of the gear blank (m2), ‘Tg’ is the temperature of the gear blank at the hobbing zone (K), and ‘Tcf’ is the temperature of the lubricant (K). The convective heat transfer coefficient in HWMQL ‘hHWMQL’ can be expressed in terms of Nusselt number ‘Nu’ by the following relation:
h H W M Q L = N u k m L c
where ‘km’ is the thermal conductivity of the mixture of lubricant and its carrier used in HWFL and HWMQL (W/mK) and ‘Lc’ is the characteristic length (m). Nusselt number can be estimated using Equation (4):
N u = C ( R e ) b ( P r ) 1 3
Here, ‘Re’ is Reynold number and ‘Pr’ is Prandtl number, and they are computed using Equations (5) and (6), respectively:
R e = ρ m U m L c µ m
P r = µ m   C p m k m
Here, ‘ρm’, ‘Um’, ‘µm’, and ‘Cpm’ are the density (kg/m3), velocity (m/s), dynamic viscosity (kg/m s), and specific heat (J/kg K) of the mixture of lubricant and its carrier, respectively, and ‘C’ and ‘b’ are constants whose values can be determined from Table 1 according to the computed value of Reynold number.

2.3.6. Evaluation of Theoretical Heat Transfer Coefficient in HWMQL

Heat is regulated by an aerosol mixture of a lubricant mist and compressed air during teeth generation in HWMQL. For computing the convective heat transfer coefficient in HWMQL, this aerosol mixture can be considered as homogenous in which all the particles possess the same velocity and temperature and the interaction among the droplet particles can be ignored due to their smaller size and less density [19]. The mass fraction of the mist particles of lubricant ‘Ӯ’ in the aerosol mixture can be calculated by Equation (7) as mentioned by Graham [20]:
ӯ = ρ a   V a ρ f   V f + ρ a V a
Here, ‘ρa’ is the density of air (kg/m3), ‘ρf’ is the density of the lubricant (kg/m3), ‘Vf’ is the volumetric flow rate of the lubricant (m3/s), and ‘Va’ is the volumetric flow rate of air (m3/s), which can be expressed by Equation (8):
  V a = U a A
Here, ‘A’ is the cross-sectional area of the nozzle and ‘Ua’ is the velocity of air (m/s), which can be obtained by Bernoulli’s equation given by:
U a = 2 ( P a P a t m ) ρ a
Here, ‘Pa’ and ‘ρa’ are the pressure (N/m2) and density (kg/m3) of the compressed air, respectively, and ‘Patm’ is the atmospheric pressure (N/m2). The density ‘ρm’(kg/m3), dynamic viscosity ‘µm’ (kg/m.s), thermal conductivity ‘km’ (W/m K), and specific heat ‘Cpm’ (J/kg K) of the mixture of the lubricant and its carrier can be calculated with the help of Equations (10)–(13), as mentioned by Levy [21]:
ρ m = ( ӯ ρ a + 1 ӯ ρ f ) 1
µ m = ( ӯ µ a + 1 ӯ µ f ) 1
k m = ( ӯ k a + 1 ӯ k f ) 1  
C p m = ( ӯ C p a + 1 ӯ C p f ) 1
Here, ‘µa’ is the dynamic viscosity (kg/m. s), ‘ka’ is the thermal conductivity (W/m.k), and ‘Cpa’ is the specific heat (J/kg.K) of the compressed air, respectively, and ‘µf’ is the dynamic viscosity (kg/m.s), ‘kf’ is the thermal conductivity (W/m. k), and ‘Cpf’ is the specific heat (J/kg.K) of the lubricant, respectively. The Nusselt number, Reynold number, and Prandtl number of the aerosol mixture used in HWMQL can be calculated using Equations (4)–(6), respectively, using the values computed by Equations (10)–(13). Subsequently, the theoretical value of the convective heat transfer coefficient of the aerosol mixture in HWMQL can be computed using Equation (3).

2.3.7. Evaluation of Theoretical Convective Heat Transfer Coefficient in HWFL

The amount of heat carried away by the machining fluids in HWFL entirely depends on its properties such as specific heat, thermal conductivity, and dynamic viscosity. Heat transfer is mostly performed by the quenching and cooling effects caused due to the forced convection induced by the machining fluids [22]. Substituting Equation (4) in Equation (3) yields the following equation of the convective heat transfer coefficient for HWFL:
h H W F L = C ( R e ) b ( P r ) 1 3   k f L c
The machining fluid used in HWFL consists of a mixture of lubricant and water which is used to improve its cooling abilities. Therefore, Equations (10)–(13) can be used to compute the properties of this mixture. The theoretical convective heat transfer coefficient for HWFL can be computed using Equation (14) after determining the Reynold and Prandtl numbers from Equations (5) and (6), respectively.

2.3.8. Measurement of Experimental Values of Convective Heat Transfer Coefficients

The heat lost from the teeth generating zone of gear surfaces to the lubricant ‘Q’ used in HWMQL and HWFL can be experimentally calculated using the specific heat equation given by:
Q = ρ g V g C p g Δ T
Here, ‘ρg’, ‘Vg’, and ‘Cpg’ are the density (kg/m3), volume (m3), and specific heat of the gear material (J/kg K), respectively, and Δ T is the temperature reduction in the gear surface after the supply of lubricant in HWMQL or HWFL. Equating Equations (1) and (15) gives the following relation:
h   A g   ( T g T c f ) = ρ g V g C p g Δ T
The temperature of the gear blank at hobbing zone ‘Tg’ and the temperature reduction ‘ Δ T ’ of the mounted gear surfaces before and after supplying the lubricant in HWMQL or HWFL were measured when no further significant temperature decrease was observed, i.e., when the temperature reached the equilibrium. The experimental values of heat transfer coefficients in HWMQL and HWFL were computed by Equation (16) using the properties of the lubricant, air, and gear material and values of other parameters presented as mentioned in Table 2. The theoretical values of heat transfer coefficients in HWMQL and HWFL were computed by Equations 3 and 14, respectively, using properties presented in Table 2.

3. Results and Discussion

3.1. Microgeometry Deviations, Flank Surface Roughness, and Functional Performance

Table 3 presents a comparison of the parameters of flank surface roughness, microgeometry deviation, and dual roll testing for the best-quality spur gears manufactured by HWMQL, HWFL, and HWAL. Figure 5 presents the results of dual flank roll testing for the best-quality spur gear manufactured by HWMQL, HWAL, and HWFL, depicting a variation in center-to-center distance as a displacement in μm with rotation angle along with the computed values of total composite error ‘Fi’, tooth-to-tooth composite error ‘fi’, and radial runout ‘Frf’ computed from these graphs. The results of Table 3 and Figure 5 show that HWMQL-manufactured best-quality spur gear has the smallest values of the parameters of microgeometry deviation (i.e., Fa as 45.1 µm, Fβ as 13.1 µm, Fp as 100.6 µm, and Fra as 112.5 µm), flank surface roughness (i.e., Ra as 0.61 µm and Rmax as 5.14 µm), and functional performance (i.e., Fi as 99 µm, fi as 16 µm, and Frf as 86 µm), followed by HWAL-manufactured best-quality gear. Whereas HWFL gives the largest values of these parameters for its best-quality manufactured gear, more importantly, HWMQL has given these results with higher MRR as compared to HWFL and HWAL.
Smaller values of functional performance parameters indicate a uniform and efficient transmission of motion and power, resulting in a better operating performance of HWMQL-manufactured gear. This can be attributed to the superior lubrication of the fine lubricant particles in HWMQL which formed a layer of tribo-film over the tool–workpiece interfaces, thereby minimizing heat accumulation at the hobbing zone [23]. The largest values of microgeometry deviations, flank roughness, and functional performance parameters in HWFL-manufactured best-quality gear reveal inefficient lubrication by the larger lubricant particles under a flood lubrication environment. It results in higher heat accumulation at the hobbing zone, leading to higher thermal expansion, which increases microgeometry deviations and flank surface roughness due to BUE formation [24]. The identified optimum hobbing parameters of HWAL yielded lower values in microgeometry deviation, flank surface roughness, and functional performance as compared to HWFL due to the smoother chip flow action facilitated by low MRR and higher hob cutter speed. However, HWFL gives higher MRR than HWAL. Figure 6 shows the microscopic images and 3D surface roughness profiles of the flank surfaces of the best-quality gears manufactured by HWFL (Figure 6a), HWAL (Figure 6b), and HWMQL (Figure 6c). It can be seen from these images that HWFL-manufactured best-quality gear (Figure 6a) has the worst flank surface, having deeper grooves and feed marks than the comparatively smoother flank surfaces given by HWMQL (Figure 6c) and HWAL (Figure 6b). Deterioration in gear flank surface and microgeometry deviations in HWFL is due to increased tool wear resulting from higher heat generation at the hobbing zone [24].

3.2. Wear Indicators and Microhardness

Figure 7 shows the variation in the coefficient of friction with time obtained from the fretting wear test for the flank surfaces of the best-quality spur gears manufactured by HWMQL, HWAL, and HWFL. Table 4 presents the results of the fretting wear test, showing the maximum value of the coefficient of friction computed from the graph of Figure 7 and the computed values of specific wear rate or Archard’s coefficient using Equation (1), wear rate, and wear volume.
It is evident from Figure 7 and Table 4 that HWMQL-manufactured best-quality spur gears exhibit the minimum values of maximum sliding friction force and coefficient of sliding friction, specific wear rate, wear rate, and sliding wear volume of its flank surfaces. This is due to smaller flank surface roughness by HWMQL, which can be attributed to the prevention of heat accumulation and BUE formation at the hobbing zone, which is facilitated by the superior lubrication of fine lubricant particles. It reduces surface defects and irregularities on the flank surfaces of HWMQL-manufactured spur gear, resulting in a smoother interaction during the fretting wear test, thereby minimizing the wear volume. A lower wear volume in HWMQL-manufactured gear suggests less wear in the mating gear surfaces with time, ensuing improved service life and mechanical efficiency. Higher values in maximum frictional force and the maximum coefficient of friction in the cases of HWFL- and HWAL-manufactured spur gears can be linked to the presence of irregularities and peaks on their flank surfaces arising from higher heat generation at the hobbing zone, which is due to ineffective cooling and lubrication in HWFL and the absence of lubrication in HWAL. Higher flank surface roughness results in the generation of much larger frictional force during the fretting wear test, which consequently increases the coefficient of friction, specific wear rate, wear rate, and sliding wear volume. Table 5 presents the results of Vicker’s microhardness test for the best-quality spur gears manufactured by HWMQL, HWFL, and HWAL, and Figure 8 presents a bar diagram comparing the evaluated microhardness values for the three values of the applied load along with standard deviation marked for each case.
It can be observed from the results presented in Table 5 and Figure 8 that for all the values of indentation force (i) the average diagonal length and average depth of indention for HWMQL-manufactured gear is smaller than for HWFL and HWAL gear and (ii) the average microhardness of HWMQL-manufactured spur gear is the highest, whereas the HWAL-manufactured gear has the least microhardness. These can be explained with the following facts:
  • The generation of a large amount of heat in the hobbing zone increases the surface temperature of the manufactured gear, which results in the formation of residual tensile stresses within the gear material after its cooling [25]. The presence of tensile residual stresses significantly decreases the microhardness, thereby adversely affecting the wear and fatigue resistance of gear material. Heat generation is significantly reduced in the case of HWMQL due to an enhanced lubrication action by the lubricant particles in the hobbing zone and cooling provided by the accompanying compressed air. It decreases residual tensile stresses, thereby increasing the microhardness of HWMQL-manufactured gear. The absence of lubrication in HWAL increases surface temperature but not enough to reach the phase transformation point, resulting in a softening of the gear material, thereby decreasing the microhardness.
  • The cutting and ploughing action of the hob cutter over the gear workpiece during hobbing results in severe plastic deformation and work hardening, which leads to the generation of compressive stress within the material [26]. Since HWMQL was carried out with higher MRR at the identified optimum parametric combination of hob cutter speed as 29 m/min and axial feed rate as 0.44 mm/rev as compared to HWFL (having a combination of 22 m/min and 0.44 mm/rev) and HWAL (having a combination of 29 m/min and 0.32 mm/rev), significant plastic deformation occurred in the surface and subsurface region, which resulted in higher compressive residual stress formation, yielding higher values of microhardness [27]. The least amount of plastic deformation occurred in the case of HWAL, resulting in less values of microhardness, whereas HWFL-manufactured gear yielded intermediate values.
  • The effect of subsurface microhardness on wear resistance is clearly evident from the fact that the HWAL-manufactured gear, despite showing lower values of friction force (13.7 N) and coefficient of friction (as 0.685) than the HWFL-manufactured gear (15.6 N; 0.784), exhibited less wear resistance, resulting in higher values of specific wear rate, wear rate, and sliding wear volume. This is due to the higher microhardness of HWFL-manufactured gear as compared to HWAL caused by higher plastic deformation. Thus, after the irregularities and peaks present on the flank surface in HWFL gear are worn out via abrasive wear modes, the subsurface resists further adhesive wear due to predominant effect of higher microhardness. Superior wear resistance exhibited by HWMQL-manufactured spur gear is due to a higher subsurface microhardness of its flank surface.
During the fretting wear test, wear occurs initially due to the sliding motion which causes abrasion and results in wearing out the peaks and irregularities present on the relatively softer gear flank surface (as compared to the SS ball tester). After the surface has worn out, adhesive wear becomes predominant due to the large contact pressure, which initiates the further removal of the softer material. Figure 9, Figure 10 and Figure 11 depict scanning electron micrograph images of fretting wear tracks on the flank surfaces of the best-quality spur gear manufactured by HWAL (Figure 9), HWFL (Figure 10), and HWMQL (Figure 11) at 50×, 100×, and 300× magnification, revealing their wear mechanisms. The worn surface of HWAL-manufactured spur gear (Figure 9) depicts a severely worn flank surface consisting of significant wear debris, scuffing, abrasive wear, and subsurface damage due to lower subsurface microhardness which influenced both the abrasive and adhesive wear in the flank surface. The HWFL-manufactured gear flank surface (Figure 10) reveals a higher wear resistance, showing comparatively less material displacement and abrasive wear as compared to HWAL-manufactured gear. The worn flank surface of HWMQL-manufactured gear (Figure 11) showed less wear debris, traces of abrasive wear, and subsurface damage due to adhesion, owing to its better surface finish and higher microhardness, which reduced abrasive and adhesive wear, respectively.

3.3. Noise and Vibration Characteristics

Table 6 presents the values of the noise and vibrations of the best-quality spur gears manufactured by HWMQL, HWFL, and HWAL for different combinations of rotational speed and applied load. Figure 12 depicts variations in vibration (Figure 12a) and in sound pressure level (Figure 12b) with the applied load for rotational speeds of 500 r/min and 750 r/min.
The following are the observations and their explanations for the results of Table 6 and Figure 12:
  • There were considerable changes in the noise and vibrations levels of spur gears at the rotational speeds of 500 r/min and 750 r/min.
  • HWMQL-manufactured spur gears resulted in the minimum noise generation for all the values of applied load and rotational speed as compared to HWAL and HWFL manufactured spur gears. They resulted in a maximum reduction in noise by 1.7 dBA and 1.8 dBA, respectively (refer experiment no. 10 of Table 6), at 750 r/min and an applied load of 0.054 Nm greater than that of HWFL and HWAL manufactured gears. This is due to the least amount of heat generation facilitated by the lubrication of fine particles and forcing the convective effect of the compressed air supplied in HWMQL. It reduces thermal deviations and BUE formation, thus resulting in smoother surfaces, helping to reduce the generation of noise and vibrations.
  • The vibration of HWMQL-manufactured spur gears was also found to be lowest for all combinations of speed and applied load. It can be observed that the vibration reductions are more for speeds of 500 r/min and 750 r/min. Although reductions were also achieved for the speeds of 250 r/min and 1000 r/min, the results are insignificant. HWMQL-manufactured spur gears performed significantly better by reducing the vibration level by almost 1.09 m/s2 at a speed of 500 r/min and an applied load of 0.081 Nm, as compared to HWFL-manufactured gear. The vibration of HWMQL-manufactured spur gear was less by 1.03 m/s2 at a speed of 750 r/min and a load of 0.027 Nm than HWAL-manufactured gear. HWAL-manufactured spur gear also resulted in less vibrations as compared to HWFL-manufactured gear. Although values are almost comparable for most of the combinations of speed and applied load, it can be observed that vibration is reduced by a maximum of 0.69 m/s2 at 500 r/min and 0.054 Nm applied load.
  • HWAL-manufactured spur gears also exhibited less noise generation than HWFL-manufactured spur gears for most of the combinations of speed and applied load. This is due to higher values of flank surface roughness, microgeometry deviations, and functional performance parameters in HWFL, which are caused due to inefficient lubrication conditions at comparatively higher MRR than HWAL, leading to higher heat generation and BUE formation.

3.4. Convective Heat Transfer Coefficients

Table 7 presents gear blank surface temperature reductions for HWMQL and HWFL after the application of MQL and FL, along with the values of net heat loss calculated by Equation (15). Table 8 presents theoretically computed and experimentally measured values of convective heat transfer coefficients in HWMQL and HWFL.
It is evident from the results of Table 8 that heat transfer equations are able to closely estimate convective heat transfer coefficients in HWMQL and HWFL with up to 87% accuracy, which can be regarded as satisfactory considering the complexity of the hobbing process. Better accessibility of fine lubricant particles mixed with the compressed air used in HWMQL helps to give an almost 9 times higher convective heat transfer coefficient than larger-size lubricant particles used in HWFL. This explains the reason for efficient heat removal from the hobbing zone in HWMQL, along with regulating the frictional heat generation. This minimizes the effects of heat generation and reduces thermal distortions, thereby improving gear accuracy along with improving the process productivity of gear hobbing.

4. Conclusions

This paper presented a comparative study of the performance characteristics of the best-quality spur gears manufactured under three lubrication environments, namely HWFL, HWAL, and HWMQL. Flank surface roughness, microgeometry deviations, functional performance, wear indicators, microhardness, and noise and vibrations were used as the measures of gear performance characteristics. The convective heat transfer coefficient was also evaluated to understand the cooling mechanism of the lubrication environments. The following conclusions can be drawn from this study:
  • HWMQL-manufactured gears yielded the minimum values of microgeometry deviations, flank surface roughness, and functional performance parameters and simultaneously higher MRR values, as compared to HWFL and HWAL, due to the superior lubrication facilitated by the better dispersion of the lubricant particles to the hobbing zone.
  • Better accessibility of the finer lubricant particles mixed with compressed air used in HWMQL helped to give a heat transfer coefficient almost nine times that of HWFL. A reduction in heat generation reduces the thermal distortion and BUE formation, thereby giving a smoother flank surface and better accuracy gears, enabling a reduction in the generation of noise and vibrations.
  • HWMQL-manufactured gear yielded the minimum values of all the indicators of wear, implying their better wear resistance in actual working conditions.
  • HWMQL improved the microhardness of the gear flank through the minimization of the heat accumulation at the hobbing zone, leading to a reduction in tensile residual stresses which occurs at high workpiece temperature, thereby improving the fatigue strength of the manufactured gear.
  • HWFL gear exhibited better wear resistance than HWAL due to higher flank microhardness at higher MRR, whereas HWAL accounted for better gear accuracy with a comparatively smoother flank surface, although with less MRR.
  • This study proves that HWMQL is capable of manufacturing comparatively better gears than HWFL and HWAL by simultaneously improving flank surface finish and microgeometry with smoother and quieter operational performance, superior wear resistance, higher fatigue strength, and longer service life, owing to its better cooling and lubrication actions. The results of this study will be very helpful for the manufacturers and users of spur gears.

Author Contributions

All authors contributed to the study’s conception and design. Writing—original draft preparation, V.K.; Planning and Experiments, Data Collection and Analysis: V.K., V.R.; Supervision and Editing: N.K.J. and K.G. All authors have read and agreed to the published version of the manuscript.

Funding

This research received no external funding.

Data Availability Statement

All experimental findings are presented in the manuscript.

Acknowledgments

Authors sincerely thank DST-FIST Center of Excellence in Gear Engineering and other labs of IIT Indore for providing research facilities to conduct the research work presented in this paper. The second author wishes to thank the Department of Science and Technology (DST), Govt. of India, for funding him as a DST-INSPIRE Research Fellow. Article publishing charge (APC) was waived off by the MDPI.

Conflicts of Interest

The authors declare no conflict of interest.

Nomenclature

ACross-section area of nozzle (m2)
AgSurface area of gear blank (m2)
CpaSpecific heat of compressed air (J/kg K)
CpfSpecific heat of lubricant (J/kg K)
CpgSpecific heat of gear material (J/kg K)
CpmSpecific heat of mixture of lubricant and its carrier (J/kg K)
DDepth of cut (mm)
dDiameter of nozzle (mm)
fAxial feed rate (mm/rev)
FApplied normal load during the fretting wear test (N)
FmaxMax. value of sliding frictional force (N)
FaTotal profile deviation (μm)
FiTotal composite error (μm)
fiTooth-to-tooth composite error (μm)
FpTotal or cumulative pitch deviation (μm)
FraRadial runout by analytical testing (μm)
FrfRadial runout by functional testing (μm)
FβTotal lead deviation (μm)
hHWMQLConvective heat transfer coefficient in HWMQL (W/m2K)
hHWFLConvective heat transfer coefficient in HWFL (W/m2K)
kaThermal conductivity of air (W/m K)
kfThermal conductivity of lubricant (W/m K)
kgThermal conductivity of gear material (W/m K)
kiSpecific wear rate (mm3/Nm);
kmThermal conductivity of mixture of lubricant and its carrier (W/m K)
LcCharacteristic length (m)
miMass loss during the wear test (g)
NuNusselt number
Pa Pressure of compressed air (N/m2)
PatmAtmospheric pressure (N/m2)
PrPrandtl number
QHeat taken away by lubricant (W)
𝑅𝑎Average surface roughness (μm)
ReReynold number
𝑅𝑚𝑎𝑥Maximum surface roughness (μm)
STotal sliding distance in the fretting wear test (mm)
TcfTemperature of lubricant (K)
TgTemperature of gear blank surface at hobbing zone (K)
tmax Maximum interface temperature (K)
TTemperature reduction in the gear blank after supply of lubricant in HWMQL or HWFL (K)
Ua Velocity of compressed air (m/s)
Uf Velocity of lubricant (m/s)
VHob cutter speed (m/min)
VaVolumetric flow rate of compressed air (m3/s)
VfVolumetric flow rate of lubricant (m3/s)
ViTotal sliding wear volume during the fretting wear test (mm3)
VgVolume of gear blanks (m3)
WWeight of gear material lost during hobbing (g)
WblankWeight of gear blank (g)
WgearWeight of the manufactured gear (g)
ӯ Mass fraction of the lubricant mist particles in aerosol mixture in HWMQL
ΔN Change in noise level (dBA)
ΔT Reduction in temperature at workpiece (K)
ΔV Change in vibration level (mm/s2)
αNozzle inclination angle (degrees)
µaDynamic viscosity of compressed air (kg/m s)
µfDynamic viscosity of lubricant (kg/m s)
µmDynamic viscosity of mixture of lubricant and its carrier (kg/m s)
ρa Density of compressed air (kg/m3)
ρfDensity of lubricant (kg/m3)
ρgDensity of gear material (kg/m3)
ρmDensity of lubricant and its carrier (kg/mm3)

References

  1. Davis, J.R. Gear Materials, Properties and Manufacture, 1st ed.; ASM International: Materials Park, OH, USA, 2005. [Google Scholar] [CrossRef]
  2. Sekar, R.; Sathishkumar, R. Enhancement of wear resistance on normal contact ratio spur gear pairs through non-standard gears. Wear 2017, 380–381, 228–239. [Google Scholar] [CrossRef]
  3. Sikorski, M.E. Correlation of the Coefficient of Adhesion with Various Physical and Mechanical Properties of Metals. Trans. ASME Ser. D—J. Basic Eng. 1963, 85, 279–285. [Google Scholar] [CrossRef]
  4. Petare, A.C.; Jain, N.K. On simultaneous improvement of wear characteristics, surface finish and microgeometry of straight bevel gears by abrasive flow finishing process. Wear 2018, 404–405, 38–49. [Google Scholar] [CrossRef]
  5. Kohara Gear Industry, Gear Noise. 2020. Available online: https://khkgears.net/gear-knowledge/introduction-to-gears/gear-noise/ (accessed on 6 January 2020).
  6. Kharka, V.; Jain, N.K. Achieving sustainability in machining of cylindrical gears. In Sustainable Manufacturing: Handbooks in Advanced Manufacturing; Gupta, K., Salonitis, K., Eds.; Elsevier: Amsterdam, The Netherlands, 2021; pp. 391–426. [Google Scholar] [CrossRef]
  7. Fratila, D. Evaluation of near-dry machining effects on gear milling process efficiency. J. Clean. Prod. 2009, 17, 839–845. [Google Scholar] [CrossRef]
  8. Fratila, D. Research of environment-friendly techniques influence on gear accuracy in context of sustainable manufacturing. Acta Mech. Slovaca 2012, 16, 58–65. [Google Scholar] [CrossRef]
  9. Zhang, G.; Wei, H. Selection of optimal process parameters for gear hobbing under cold air minimum quantity lubrication cutting environment. In Proceedings of the 36th International MATADOR Conference, Manchester, UK, July 2010; Hinduja, S., Li, L., Eds.; Springer: London, UK, 2010; pp. 231–234. [Google Scholar]
  10. Rotella, G.; Dillon, O.W.; Umbrello, D.; Settineri, L.; Jawahir, I.S. The effects of cooling conditions on surface integrity in machining of Ti6Al4V alloy. Int. J. Adv. Manuf. Technol. 2014, 71, 47–55. [Google Scholar] [CrossRef]
  11. Bordin, A.; Bruschi, S.; Ghiotti, A. The effect of cutting speed and feed rate on the surface integrity in dry turning of CoCrMo alloy. Procedia CIRP 2014, 13, 219–224. [Google Scholar] [CrossRef]
  12. Qu, D.; Zhang, P.; Xue, J.; Fan, Y.; Chen, Z.; Wang, B. Experimental study on the effects of coolants on surface quality and mechanical properties of micromilled thin-walled elgiloy. Materials 2018, 11, 1497. [Google Scholar] [CrossRef] [PubMed] [Green Version]
  13. Klocke, F.; Döbbeler, B.; Lung, S.; Seelbach, T.; Jawahir, I.S. Analysis of surface integrity in machining of AISI 304 stainless steel under various cooling and cutting conditions. AIP Conf. Proc. 2018, 1960, 070015. [Google Scholar] [CrossRef]
  14. Kharka, V.; Jain, N.K.; Gupta, K. Influence of MQL and hobbing parameters on microgeometry deviations and flank roughness of spur gears manufactured by MQL assisted hobbing. J. Mater. Res. Technol. 2020, 9, 9646–9656. [Google Scholar] [CrossRef]
  15. Sawant, M.S.; Jain, N.K. Investigations on wear characteristics of stellite coating by micro-plasma transferred arc powder deposition process. Wear 2017, 378–379, 155–164. [Google Scholar] [CrossRef]
  16. Zhou, J.; Sun, W.; Cao, L. Vibration and noise characteristics of a gear reducer under different operation conditions. J. Low Freq. Noise Vib. Active Control 2019, 38, 574–591. [Google Scholar] [CrossRef]
  17. Rana, V.; Petare, A.; Jain, N.K.; Parey, A. Using abrasive flow finishing process to reduce noise and vibrations of cylindrical and conical gears. Proc. Inst. Mech. Eng. Part B J. Eng. Manuf. 2022, 236, 1341–1354. [Google Scholar] [CrossRef]
  18. Shokrani, A.; Betts, J.; Carnevale, M. Thermal analysis in MQL end milling operations. Procedia CIRP 2021, 101, 358–361. [Google Scholar] [CrossRef]
  19. Hadad, M.; Sadeghi, B. Thermal analysis of minimum quantity lubrication-MQL grinding process. Int. J. Mach. Tools Manuf. 2012, 63, 1–15. [Google Scholar] [CrossRef]
  20. Graham, D. Dry Out; Cutting Tool Engineering. 2000, pp. 56–65. Available online: https://www.ctemag.com/news/articles/dry-out (accessed on 20 October 2021).
  21. Levy, S. Two-Phase Flow in Complex Systems; John Wiley & Sons: New York, NY, USA, 1999. [Google Scholar]
  22. Dogu, Y.; Aslan, E.; Camuscu, N. A numerical model to determine temperature distribution in orthogonal metal cutting. J. Mater. Processing Technol. 2006, 171, 1–9. [Google Scholar] [CrossRef]
  23. Ganguli, S.; Kapoor, S.G. Improving the performance of milling of titanium alloys using the atomization-based cutting fluid application system. J. Manuf. Proc. 2016, 23, 29–36. [Google Scholar] [CrossRef]
  24. Gupta, K.; Laubscher, R.F.; Davim, J.P.; Jain, N.K. Recent developments in sustainable manufacturing of gears: A review. J. Clean. Prod. 2016, 112, 3320–3330. [Google Scholar] [CrossRef]
  25. Marques, A.; Guimarães, C.; Da Silva, R.; Cindra, F.M.; Falco, S.W.; Machado, A. Surface integrity analysis of Inconel 718 after turning with different solid lubricants dispersed in neat oil delivered by MQL. Proc. Manuf. 2016, 5, 609–620. [Google Scholar] [CrossRef]
  26. Yan, P.; Rong, Y.; Wang, X.; Zhu, J.; Jiao, L.; Liang, Z. Effect of cutting fluid on precision machined surface integrity of heat-resistant stainless steel. Proc. Inst. Mech. Eng. J. Eng. Manuf. 2016, 232, 1535–1548. [Google Scholar] [CrossRef]
  27. Sakhvadze, G.; Shokhin, A.; Kikvidze, O. Residual stress and microhardness increasing induced by two-sided laser shock processing. Vibroengineering Procedia 2016, 8, 434–439. Available online: https://www.extrica.com/article/17665 (accessed on 18 September 2021).
Figure 1. Gear parameters that influence its: (a) noise and vibration characteristics and (b) quality.
Lubricants 10 00230 g001
Figure 2. Photographs of the (a) MQL system; (b) experimental apparatus used for HWMQL, HWFL, and HWAL of spur gears; and (c) 3D views of the manufactured spur gears.
Lubricants 10 00230 g002aLubricants 10 00230 g002b
Figure 3. Photograph of an in-house developed test rig for measurement of noise and vibrations of cylindrical gears (modified version from [17]).
Lubricants 10 00230 g003
Figure 4. Photograph of the dual flank roll tester used for functional testing of spur gears (modified version from [17]).
Lubricants 10 00230 g004
Figure 5. Dual flank roll testing results showing variation in center-to-center distance with rotation angle of the best-quality spur gear manufactured by (a) HWMQL, (b) HWAL, and (c) HWFL.
Lubricants 10 00230 g005aLubricants 10 00230 g005b
Figure 6. Microscopic images and 3D surface roughness profiles of flank surfaces of best-quality spur gear manufactured by (a) HWFL (V: 22 m/min; f: 0.44 mm/rev), (b) HWAL (V: 29 m/min; f: 0.32 mm/rev), and (c) HWMQL (V:29 m/min; f: 0.44 mm/rev).
Lubricants 10 00230 g006
Figure 7. Variation in coefficient of friction with time during fretting wear test of tooth flank surface of the best-quality spur gear manufactured by HWFL, HWMQL, and HWAL.
Lubricants 10 00230 g007
Figure 8. Variation in microhardness for the best-quality spur gears manufactured by HWMQL, HWFL, and HWAL along with standard deviation marked for it.
Lubricants 10 00230 g008
Figure 9. SEM images of worn flank surface of the best-quality spur gear manufactured by HWAL observed at magnification of (a) 50×, (b) 100×, and (c) 300×.
Lubricants 10 00230 g009
Figure 10. SEM images of worn flank surface of the best-quality spur gear manufactured by HWFL observed at magnification of (a) 50×, (b) 100×, and (c) 300×.
Lubricants 10 00230 g010
Figure 11. SEM images of worn flank surface of the best-quality spur gear manufactured by HWMQL observed at magnification of (a) 50×, (b) 100×, and (c) 300×.
Lubricants 10 00230 g011
Figure 12. Variation in (a) vibrations and (b) sound pressure levels, with applied load and speed for best-quality gear manufactured gears by HWMQL, HWFL, and HWAL.
Lubricants 10 00230 g012
Table 1. Values of constants ‘C’ and ‘b’ for different ranges of Reynold number.
Range of Reynold NumberValues of Constants
Cb
0.4–40.9890.330
4–400.9110.385
40–40000.6830.466
4000–40,0000.1930.618
40,000–400,0000.02660.805
Table 2. Properties of lubricants, air, and gear material and values of the parameters used in computation of convective transfer coefficients in HWMQL and HWFL.
PropertyHWMQLHWFL
AirLubricantMixtureWaterLubricantMixture
Density (kg/m3)1.2258381.361000880994
Thermal conductivity (W/m.k)0.0260.2560.0290.5610.3780.55
Specific heat (J/kg K)10122494.031075421728624138.62
Dynamic viscosity (kg/m s)1.81 × 10−52.35 × 10−22.01 × 10−51.7 × 10−34.6 × 10−21.9 × 10−3
Fixed parametersDiameter of nozzle: 3 (mm)
Air pressure: 3 × 10⁵ (N/m2)
Flow rate of air: 4.03 × 10⁻² (m3/s)
Flow rate of lubricant: 2.7 × 10⁻⁸ (m3/s)
Velocity of air and lubricant: 571.4 (m/s)
Diameter of pipe: 15 (mm)
Flow rate of lubricant: 6.94 × 10⁻⁷ (m3/s)
Velocity of air and lubricant: 3.92 × 10⁻³ (m/s)
Properties of gear material Density: 7800 (kg/m3); specific heat: 460 (J/kg.K);
area of gear blank ‘Ag’: 4.8 × 10⁻³ (m2); vol. of gear blank ‘Vg’: 153,631.2 × 10−9 (m3)
Table 3. Values of parameters of flank surface roughness, microgeometry deviations, and functional performance for the best-quality spur gears made by HWMQL, HWFL, and HWAL.
Responses Best-Quality Spur Gear Manufactured by
HWMQLHWALHWFL
Microgeometry deviation parameters determined by analytical testing
 Total profile deviation ‘Fa (µm)45.159.361.2
 Total lead deviation ‘Fβ’ (µm)13.114.717.7
 Total pitch deviation ‘Fp’ (µm)100.6109.7118.2
 Radial runout ‘Fra’ (µm)112.5120.7134.4
Functional performance parameters determined by dual flank roll testing
 Total composite error ‘Fi’ (µm)99126170
 Tooth-to-tooth composite error ‘fi’ (µm)163338
 Radial runout ‘Frf’ (µm)86119158
Flank surface roughness parameters
 Max. surface roughness ‘Rmax’ (µm)5.14 5.87 7.37
 Avg. surface roughness ‘Ra’(µm)0.610.630.64
Table 4. Fretting wear test results for best-quality spur gear manufactured by HWFL, HWMQL, and HWAL.
ParametersHWFLHWMQLHWAL
Max. value of frictional force 15.612.213.7
Max. value of coefficient of friction 0.7840.6130.685
Specific wear rate ‘ki’ ( m m 3 /N-m)1.63 × 10−50.52 × 10−52.21 × 10⁻⁵
Wear rate ( m m 3 /m)3.25 × 10−41.04 × 10−44.42 × 10⁻⁴
Wear volume ‘Vi’ ( m m 3 )0.0780.0250.106
Table 5. Microhardness test results for the best-quality spur gears manufactured by HWMQL, HWFL, and HWAL.
ParametersHWFLHWMQLHWAL
Indentation force (g)100200300100200300100200300
Average diagonal length (µm)37.142.350.420.327.634.938.545.252.7
Average depth of indentation (µm)3.84.36.42.43.64.15.86.26.5
Average microhardness (HV)423365309515477396398352284
Standard deviation (HV)192722221418412619
Table 6. Values of noise and vibrations for the best-quality spur gears manufactured by HWMQL, HWAL, and HWFL for different combinations of speed and applied load.
Exp. No.Rotational Speed (r/min)Applied Load (Nm)For the Best-Quality Spur Gear
Noise Level (dBA)Vibration (m/s2)
HWFLHWALHWMQLΔNFDΔNFMΔNDMHWFLHWALHWMQLΔVFDΔVFMΔVDM
12500.02765.365.965.1−0.60.20.82.322.272.160.050.160.11
20.05465.865.164.90.70.90.22.342.322.160.020.180.16
30.08165.464.864.80.60.602.372.342.200.030.170.14
40.1086565.264.90.10.10.32.342.332.150.010.180.18
55000.0277675.6750.410.63.472.832.680.640.790.15
60.05476.27674.80.21.41.23.522.852.550.670.970.3
70.08176.176.575.3−0.40.81.23.623.062.530.561.090.53
80.10876.575.575.111.40.43.543.002.500.541.040.5
97500.02779.17977.60.11.51.43.924.022.99−0.10.931.03
100.05479.279.377.5−0.11.71.83.974.053.18−0.080.790.87
110.08179.37977.90.31.41.14.164.023.430.140.730.59
120.10880.179.778.10.221.64.424.113.360.311.060.75
1310000.02780.780.380.10.60.40.24.914.604.340.310.570.26
140.05481.180.480.10.710.34.664.524.190.140.470.33
150.08180.980.880.50.40.10.34.994.834.320.160.670.51
160.1088180.779.90.31.10.84.764.904.08−0.140.680.82
ΔNFD = difference in sound pressure levels of HWFL- and HWAL-manufactured spur gears (dBA); ΔNFM = difference in sound pressure levels of HWFL- and HWMQL-manufactured spur gears (dBA); ΔNDM = difference in sound pressure levels of HWAL- and HWMQL-manufactured spur gears (dBA); ΔVFD = difference in vibration levels of HWFL- and HWAL-manufactured spur gears (m/s2); ΔVFM = difference in vibration levels of HWFL- and HWMQL-manufactured spur gears (m/s2); ΔVDM = difference in vibration levels of HWAL- and HWMQL-manufactured spur gears (m/s2).
Table 7. Values of temperature reduction and amount of net heat loss in HWMQL and HWFL.
ProcessIdentified Optimum ParametersReading NumberTemperature Change Δ T   ( ° C ) Net Heat Loss Q (W)
Measured ValuesAverage
HWMQLHob cutter speed: 29 m/min
Axial feed rate: 0.44 mm/rev
R-163.567.02638.4
R-267.2
R-364.8
R-472.3
R-569.5
HWFLHob cutter speed: 22 m/min
Axial feed rate: 0.44 mm/rev
R-134.732.5271.3
R-233.6
R-332.9
R-430.3
R-531.5
Table 8. Theoretically computed and experimentally measured values of convective heat transfer coefficients in HWMQL and HWFL.
ProcessConvective Heat Transfer Coefficient ( W / m 2 K )
Theoretically ComputedExperimentally MeasuredError %
HWMQL2782.813214.413.4
HWFL303.23353.314.1
Publisher’s Note: MDPI stays neutral with regard to jurisdictional claims in published maps and institutional affiliations.

