Significance of Thermophoretic Particle Deposition, Arrhenius Activation Energy and Chemical Reaction on the Dynamics of Wall Jet Nanofluid Flow Subject to Lorentz Forces

 ,
,  ,
,  , and
, and 
Abstract
:1. Introduction
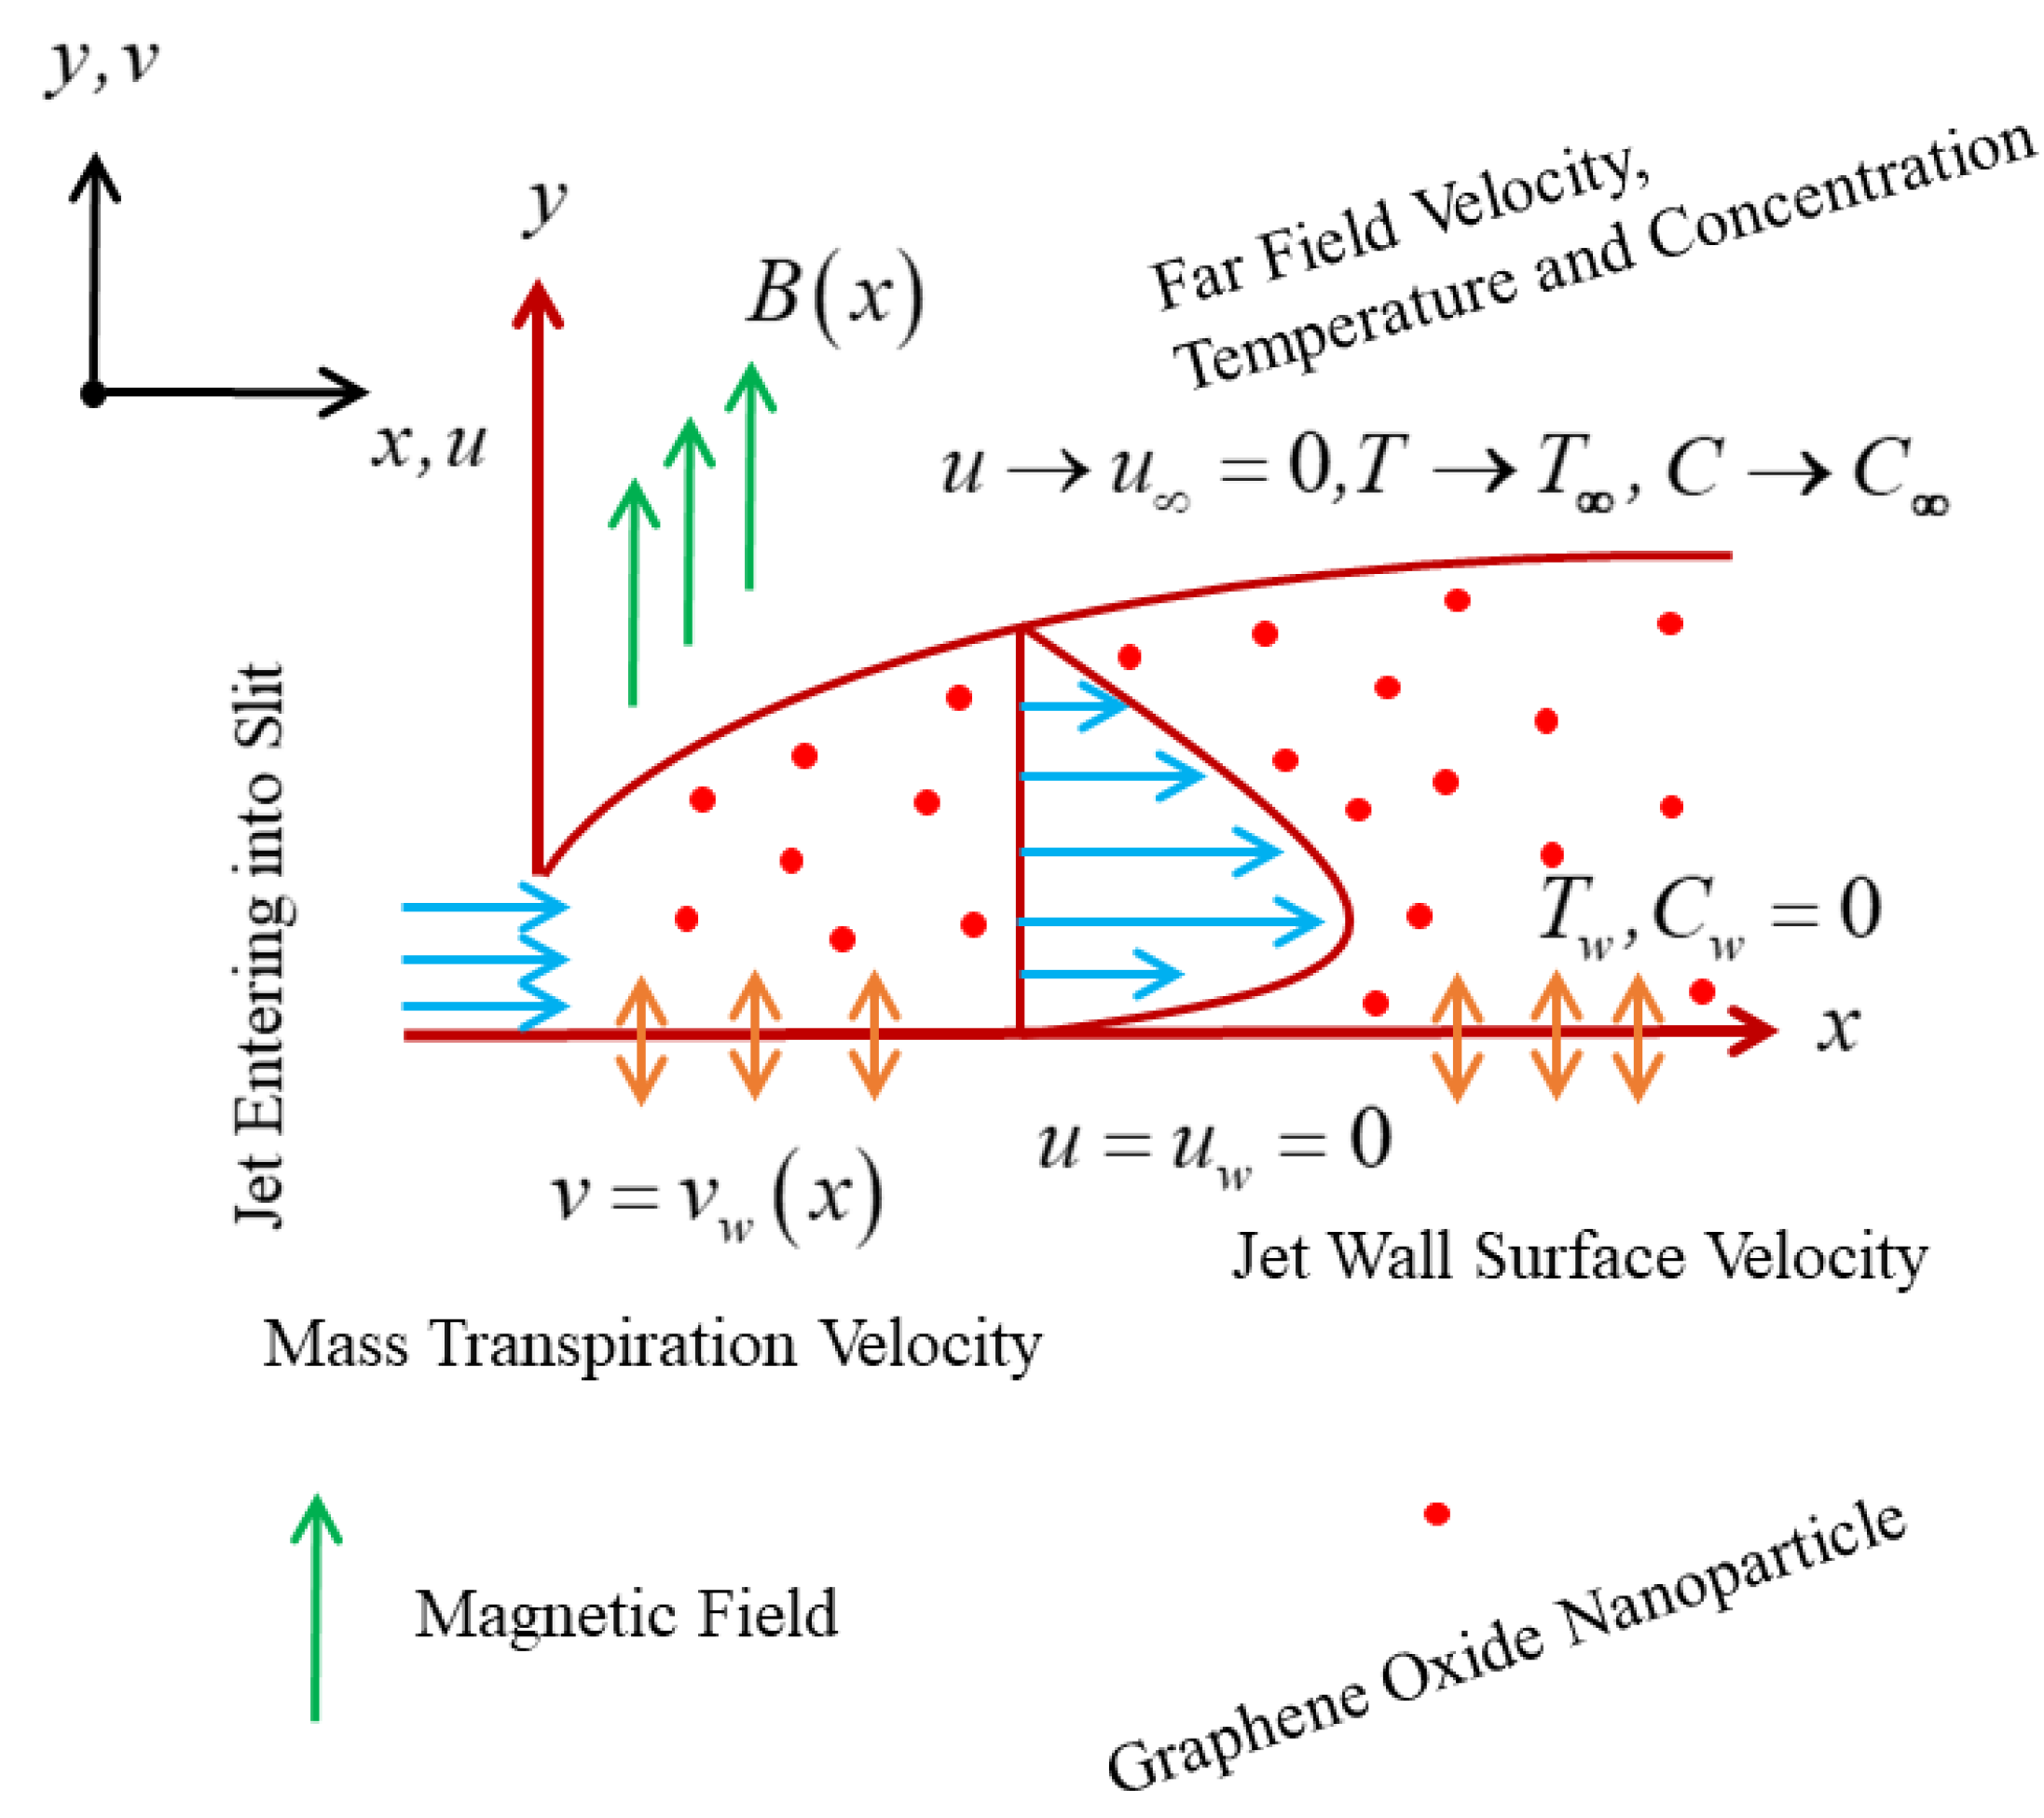
2. Mathematical Background of the Problem
2.1. Similarity Variables
2.2. Momentum Similarity Equation
2.3. Energy Similarity Equation
2.4. Concentration Similarity Equation
2.5. Transformed Boundary Conditions
2.6. Gradients
3. Numerical Methodology
Numerical Authentication of the Scheme
4. Analysis of the Results
4.1. Physical Interpretation of the Tables
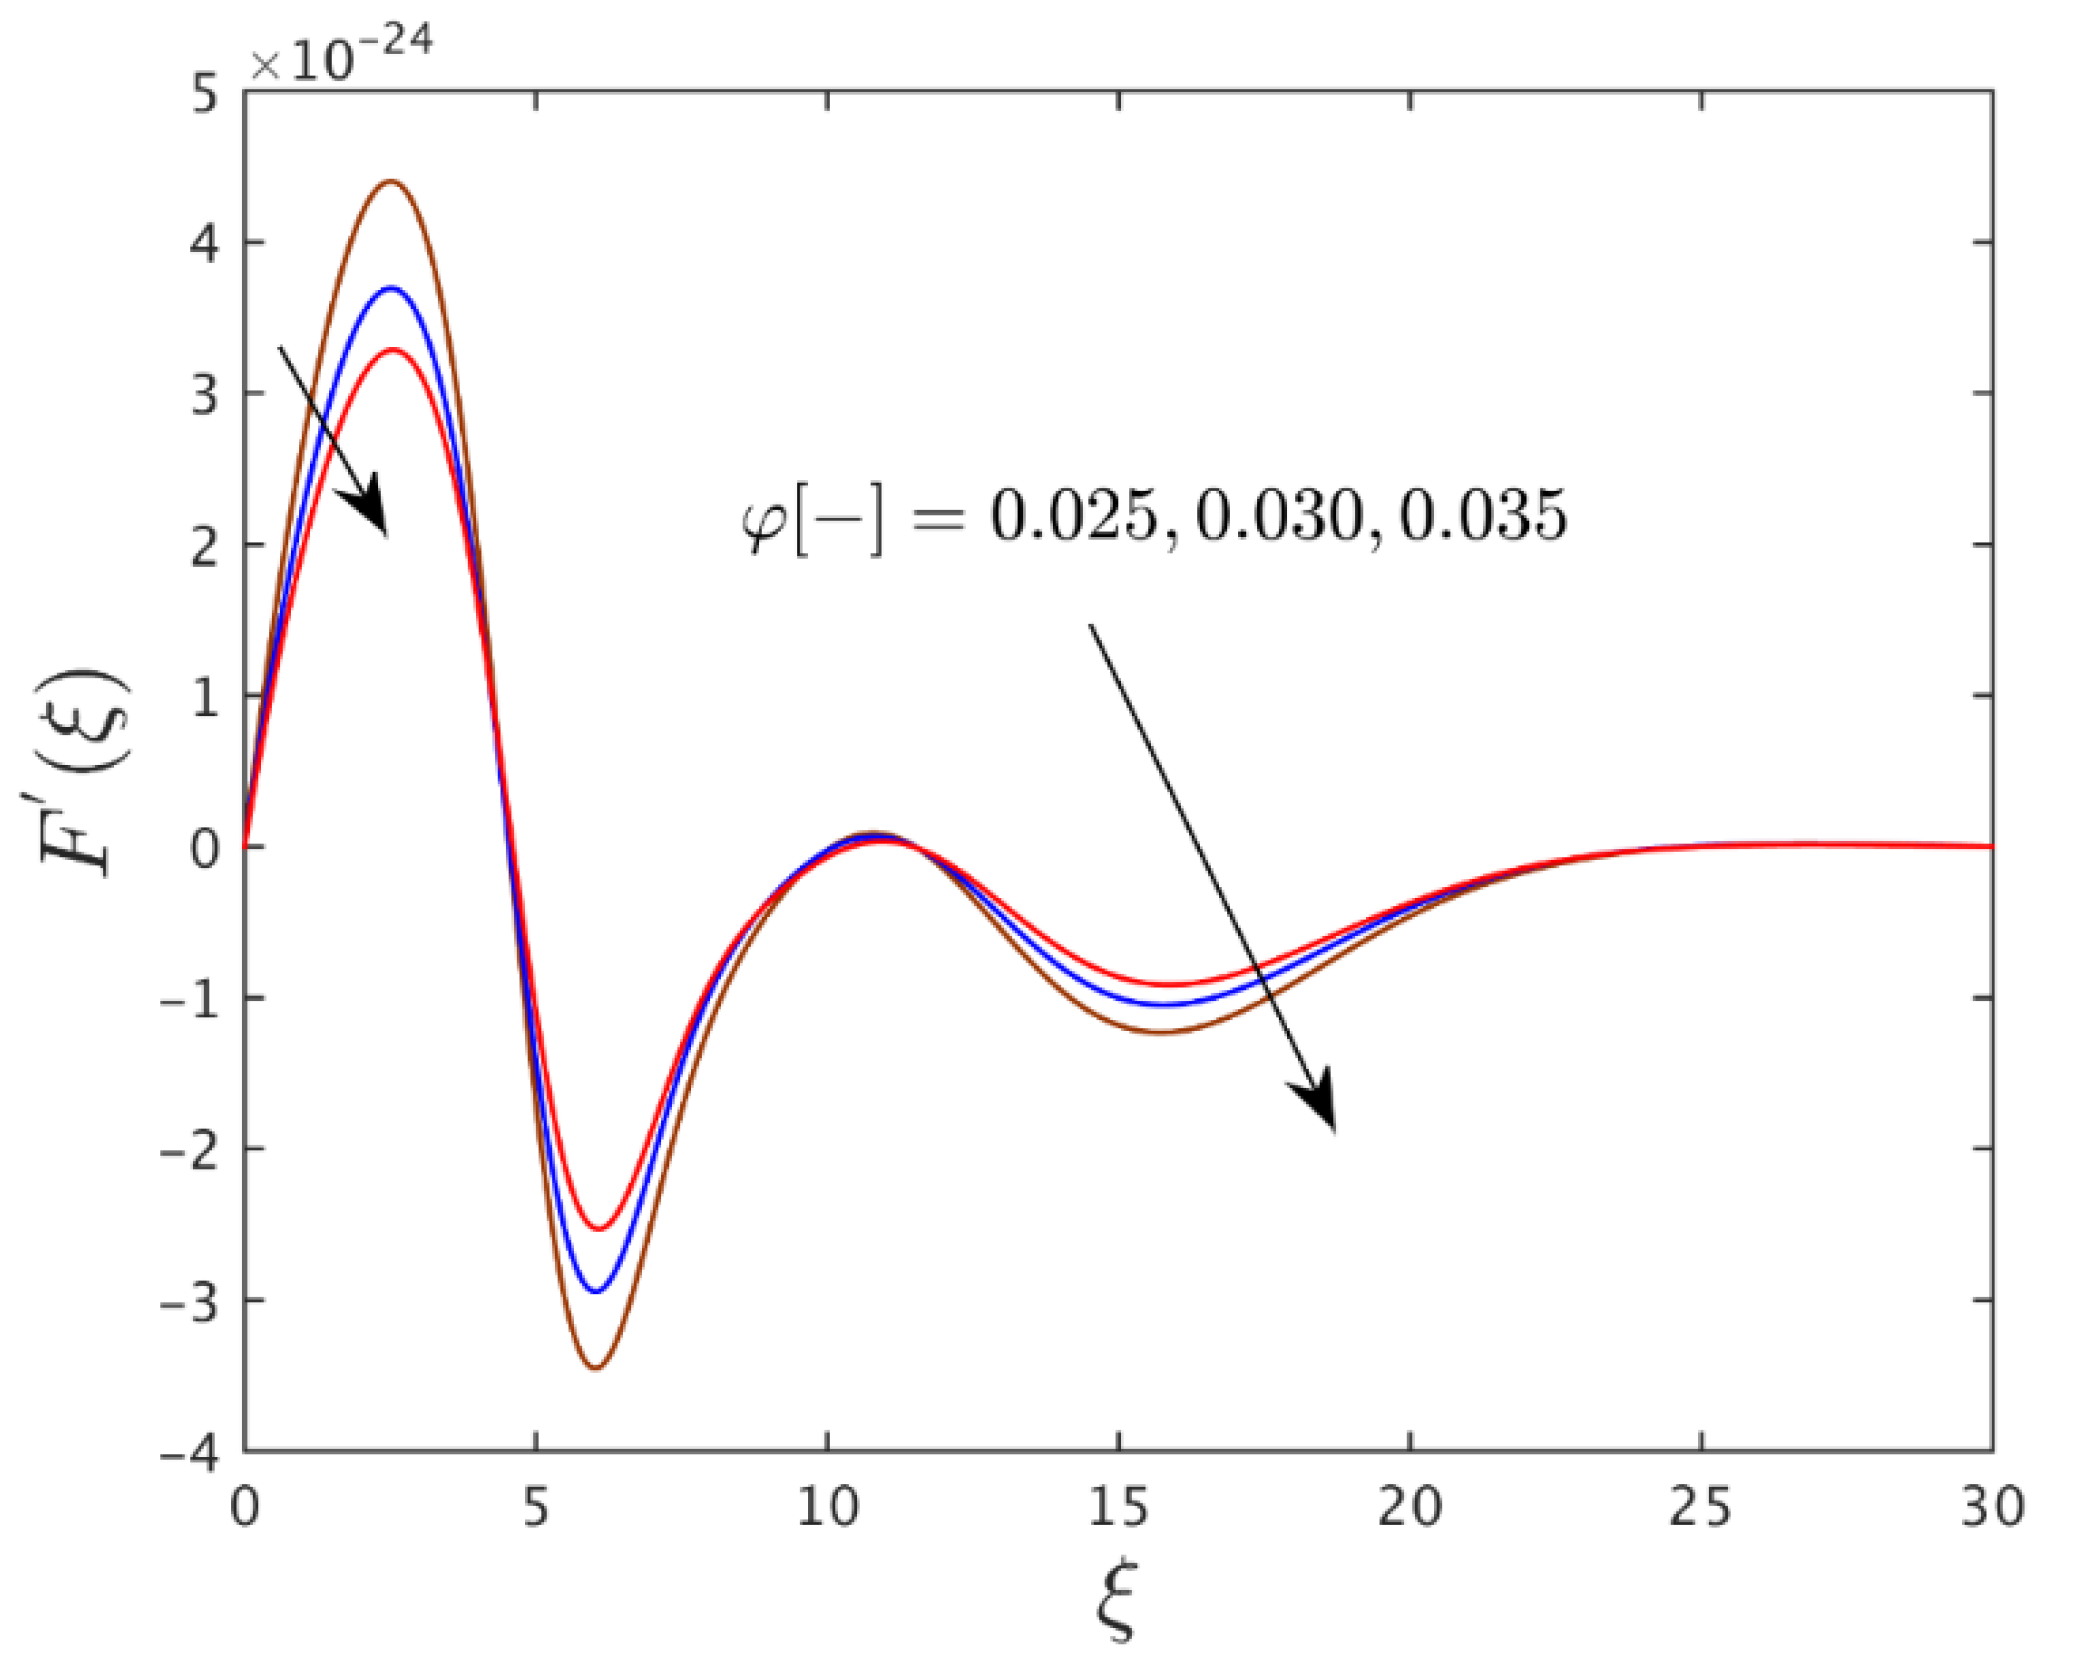
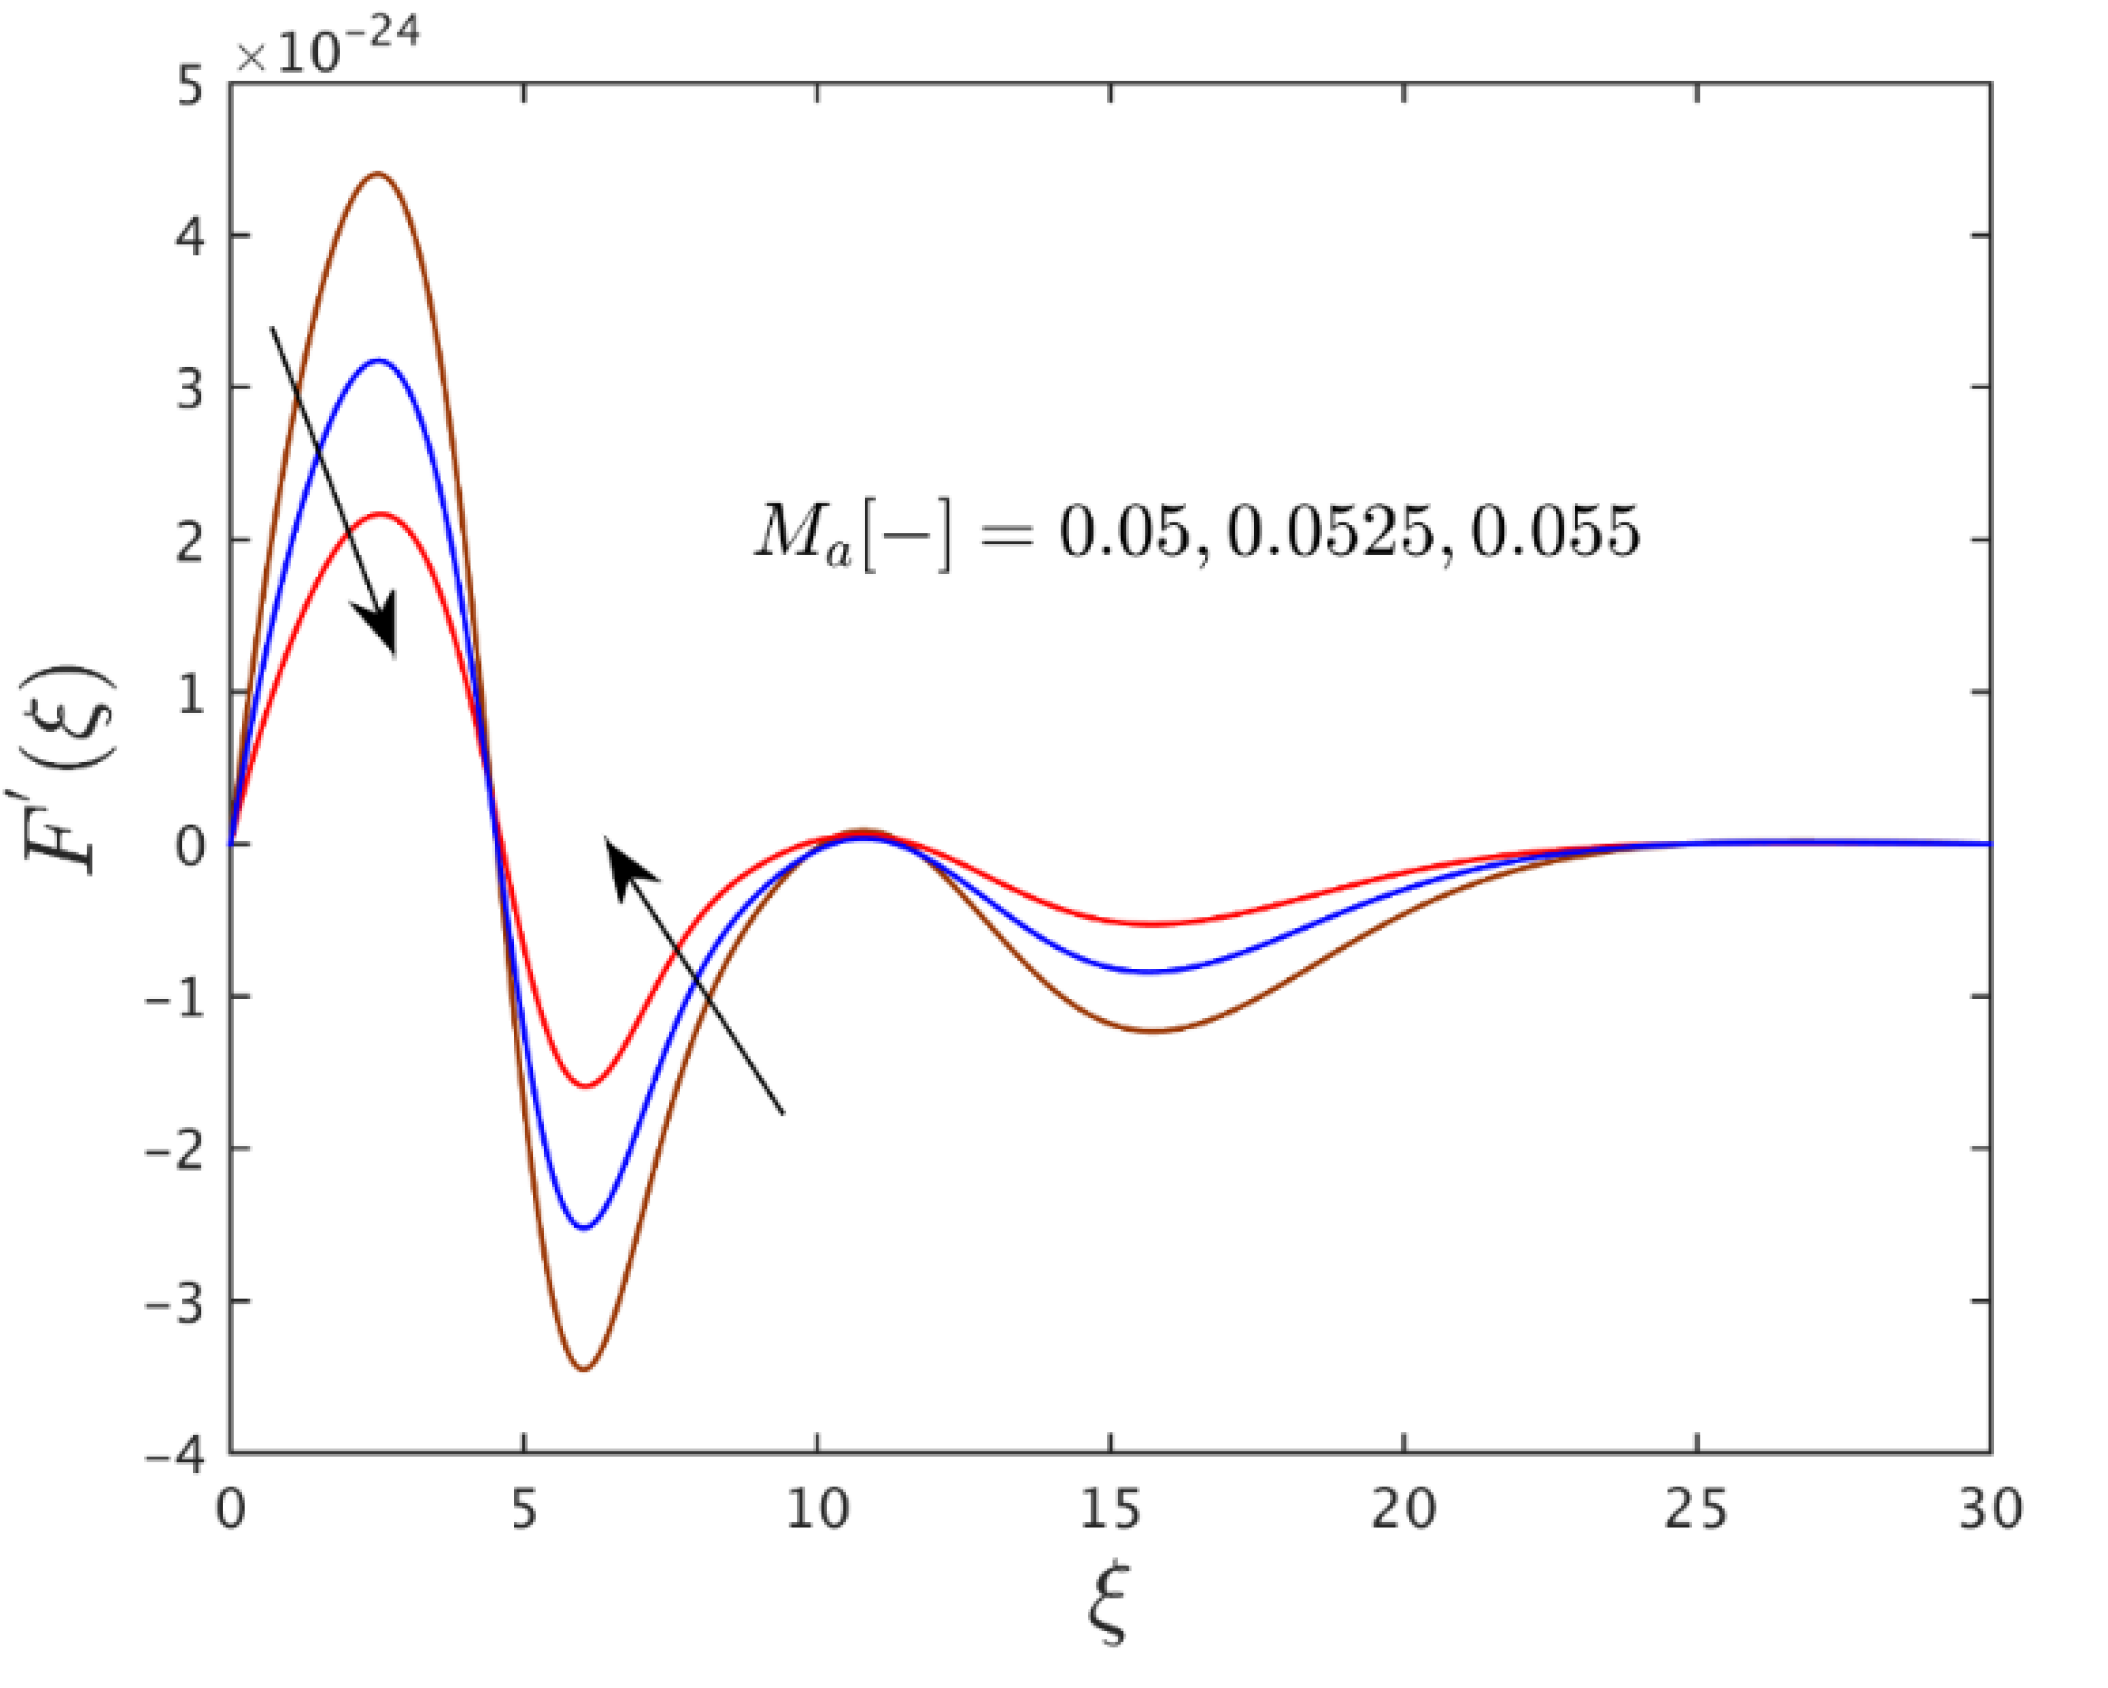
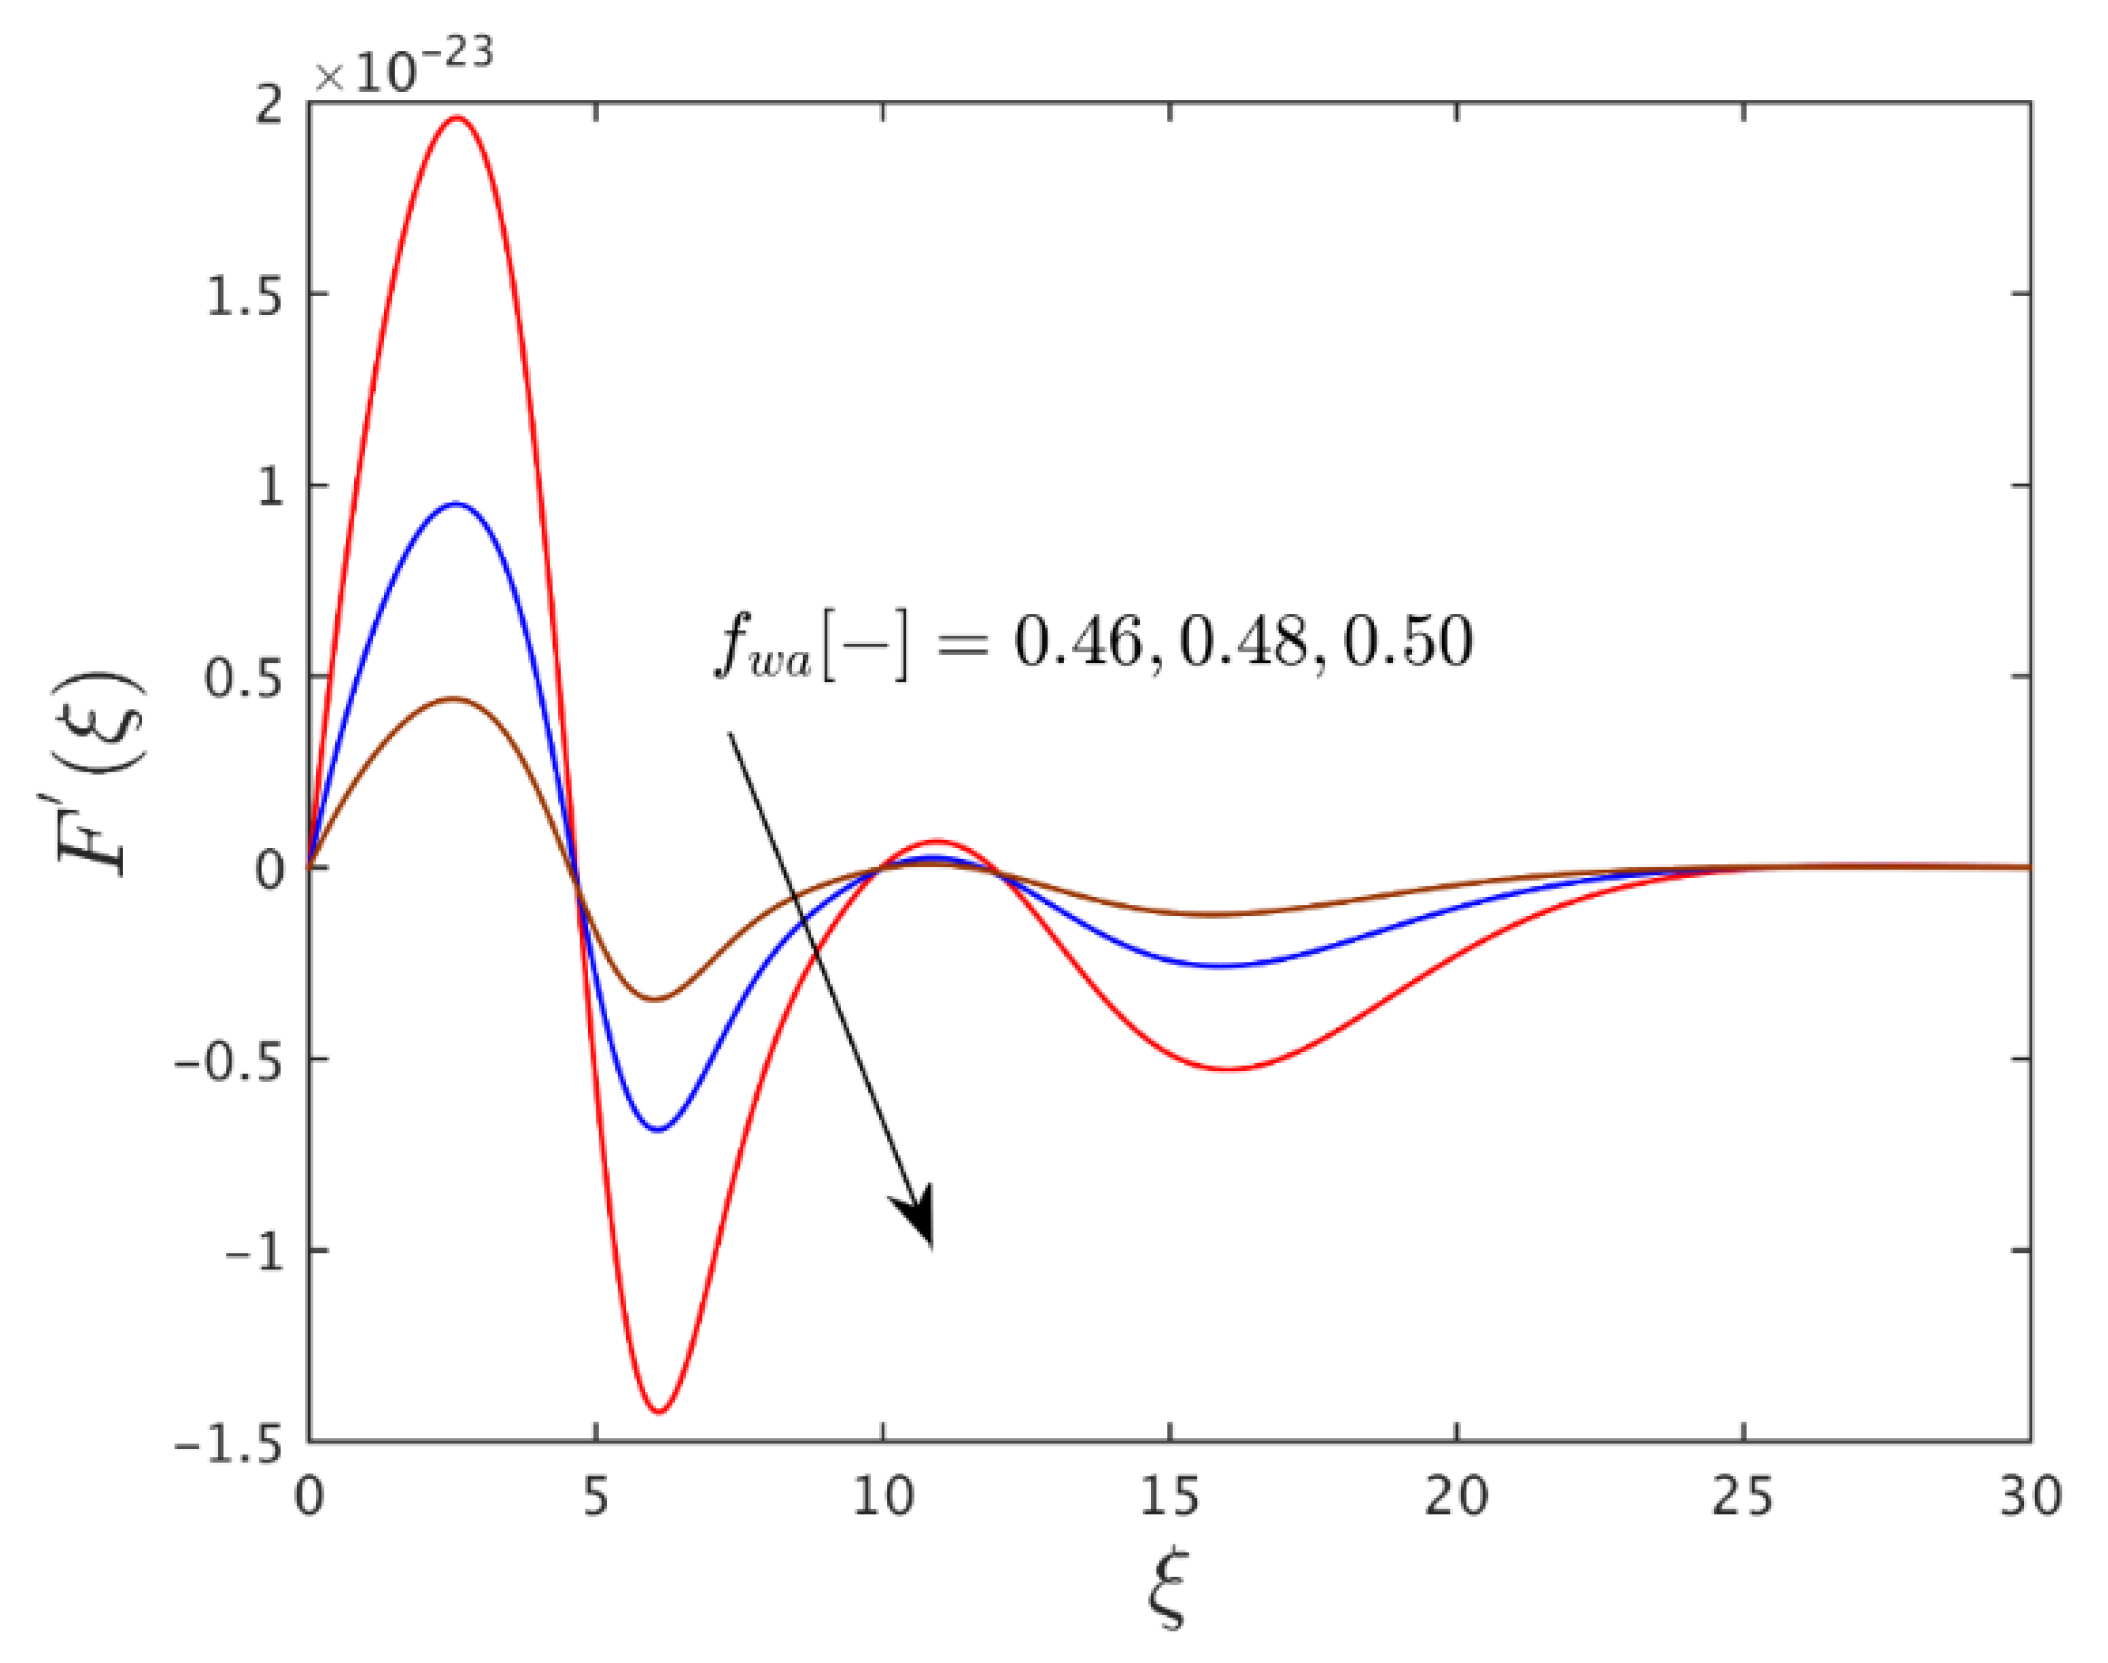
4.2. Graphical Interpretation of the Velocity Profiles
4.3. Interpretation of the Temperature Profiles
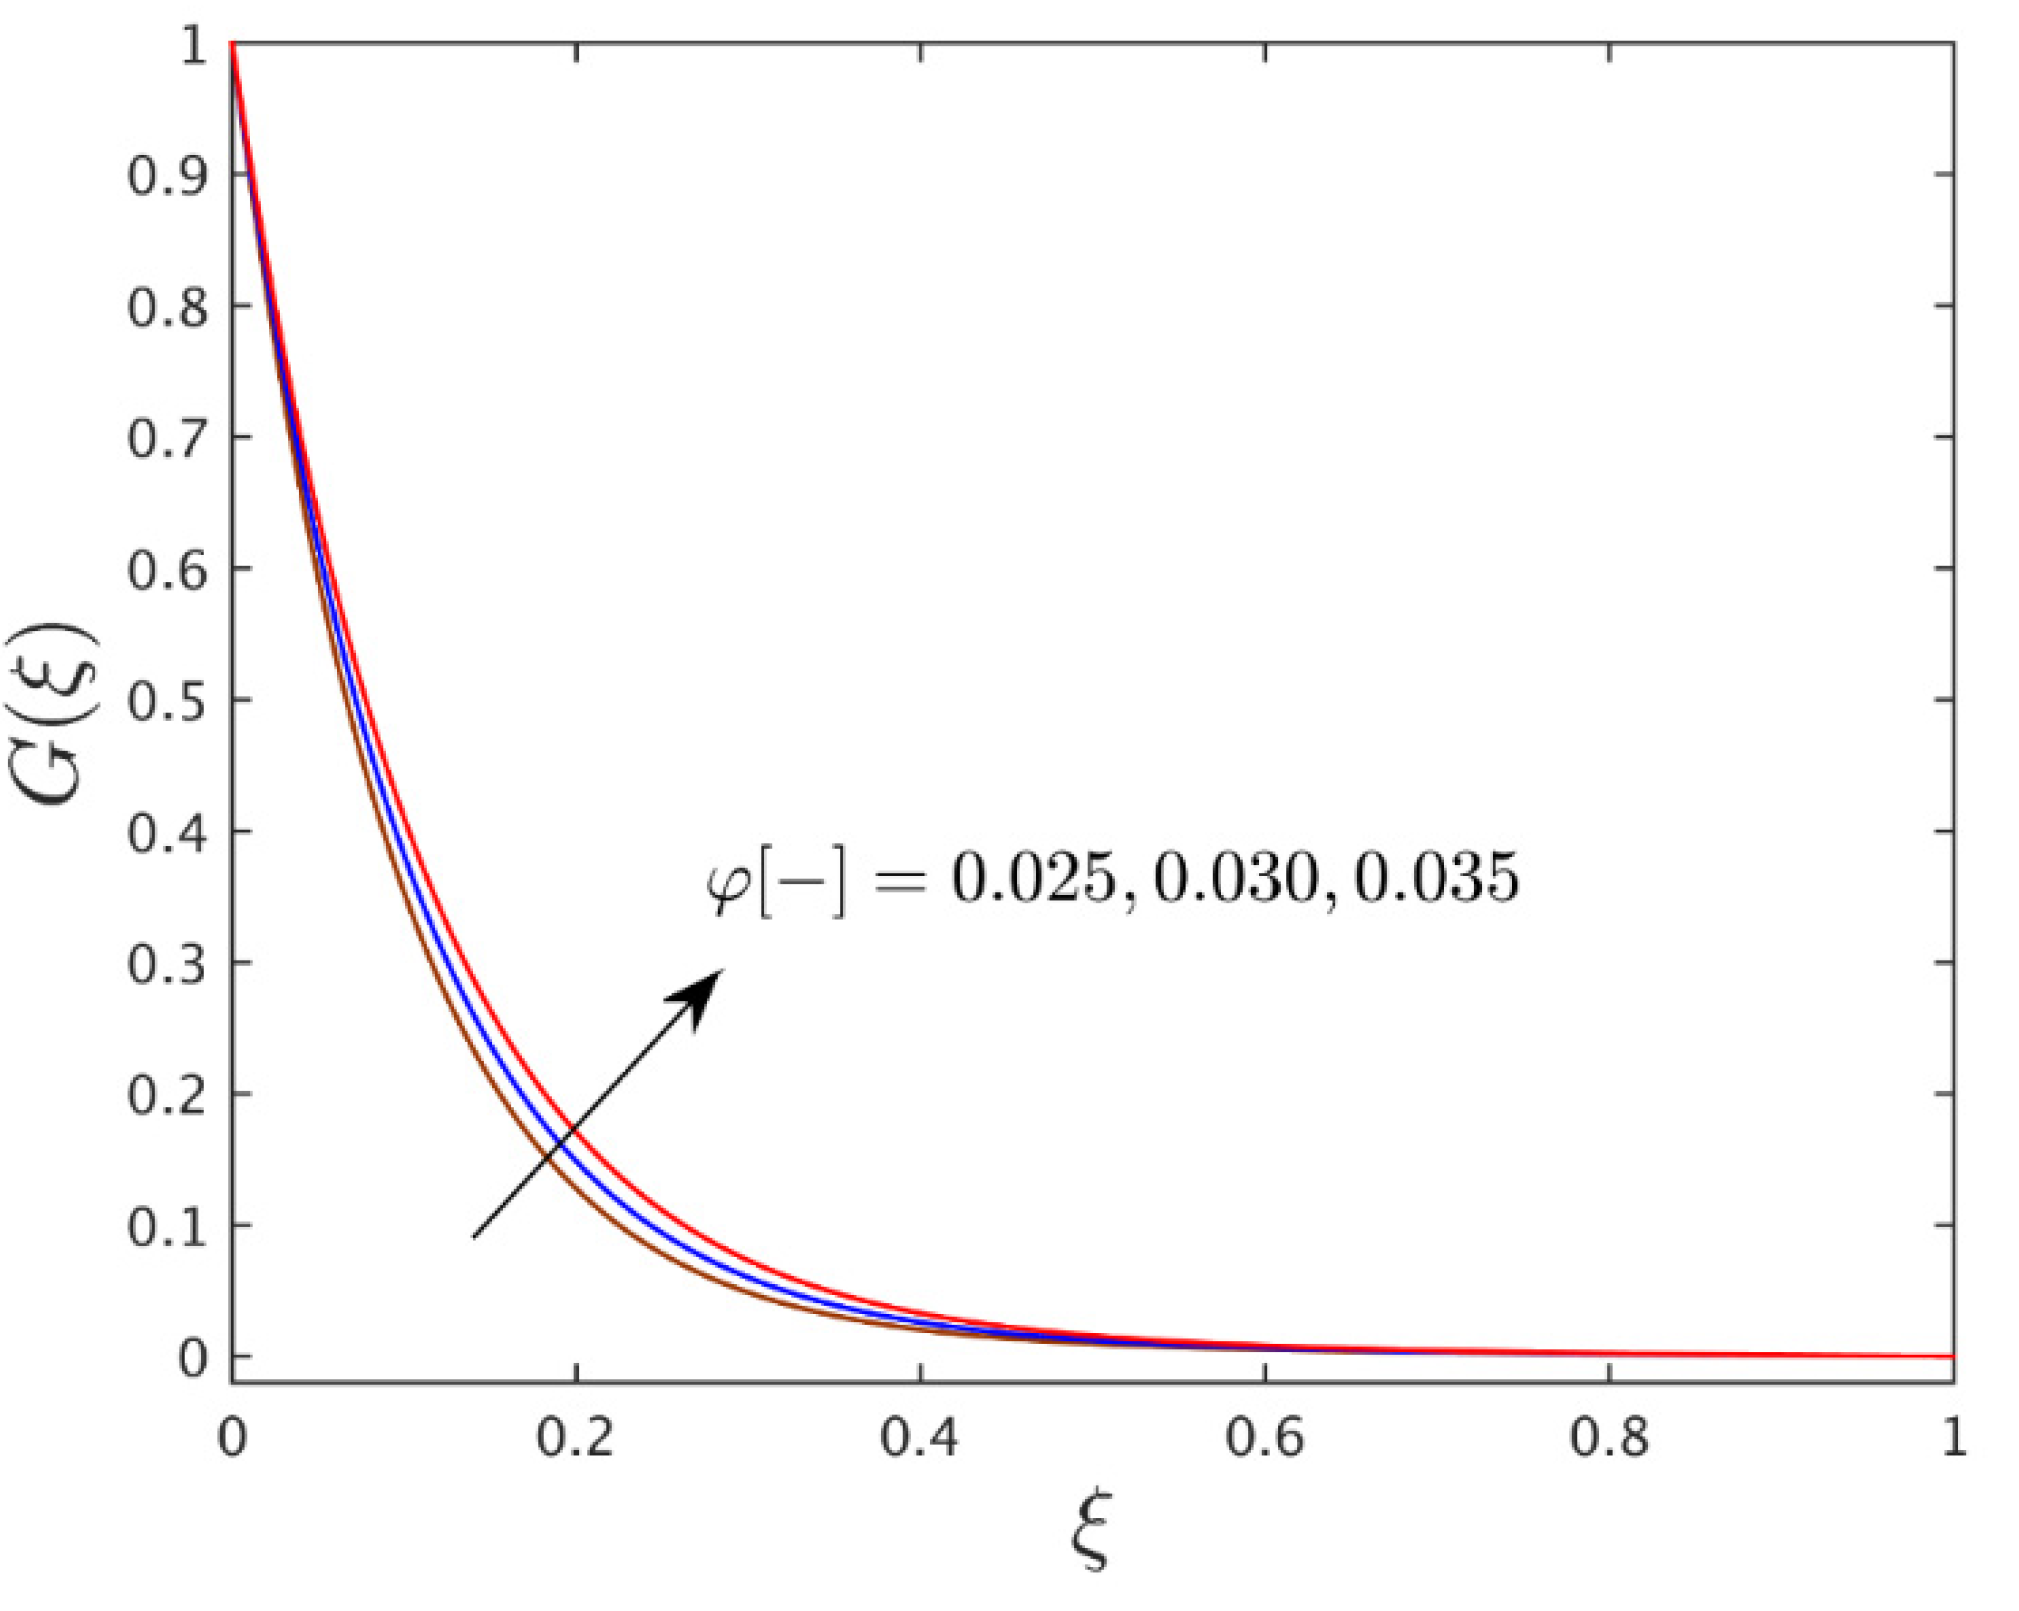
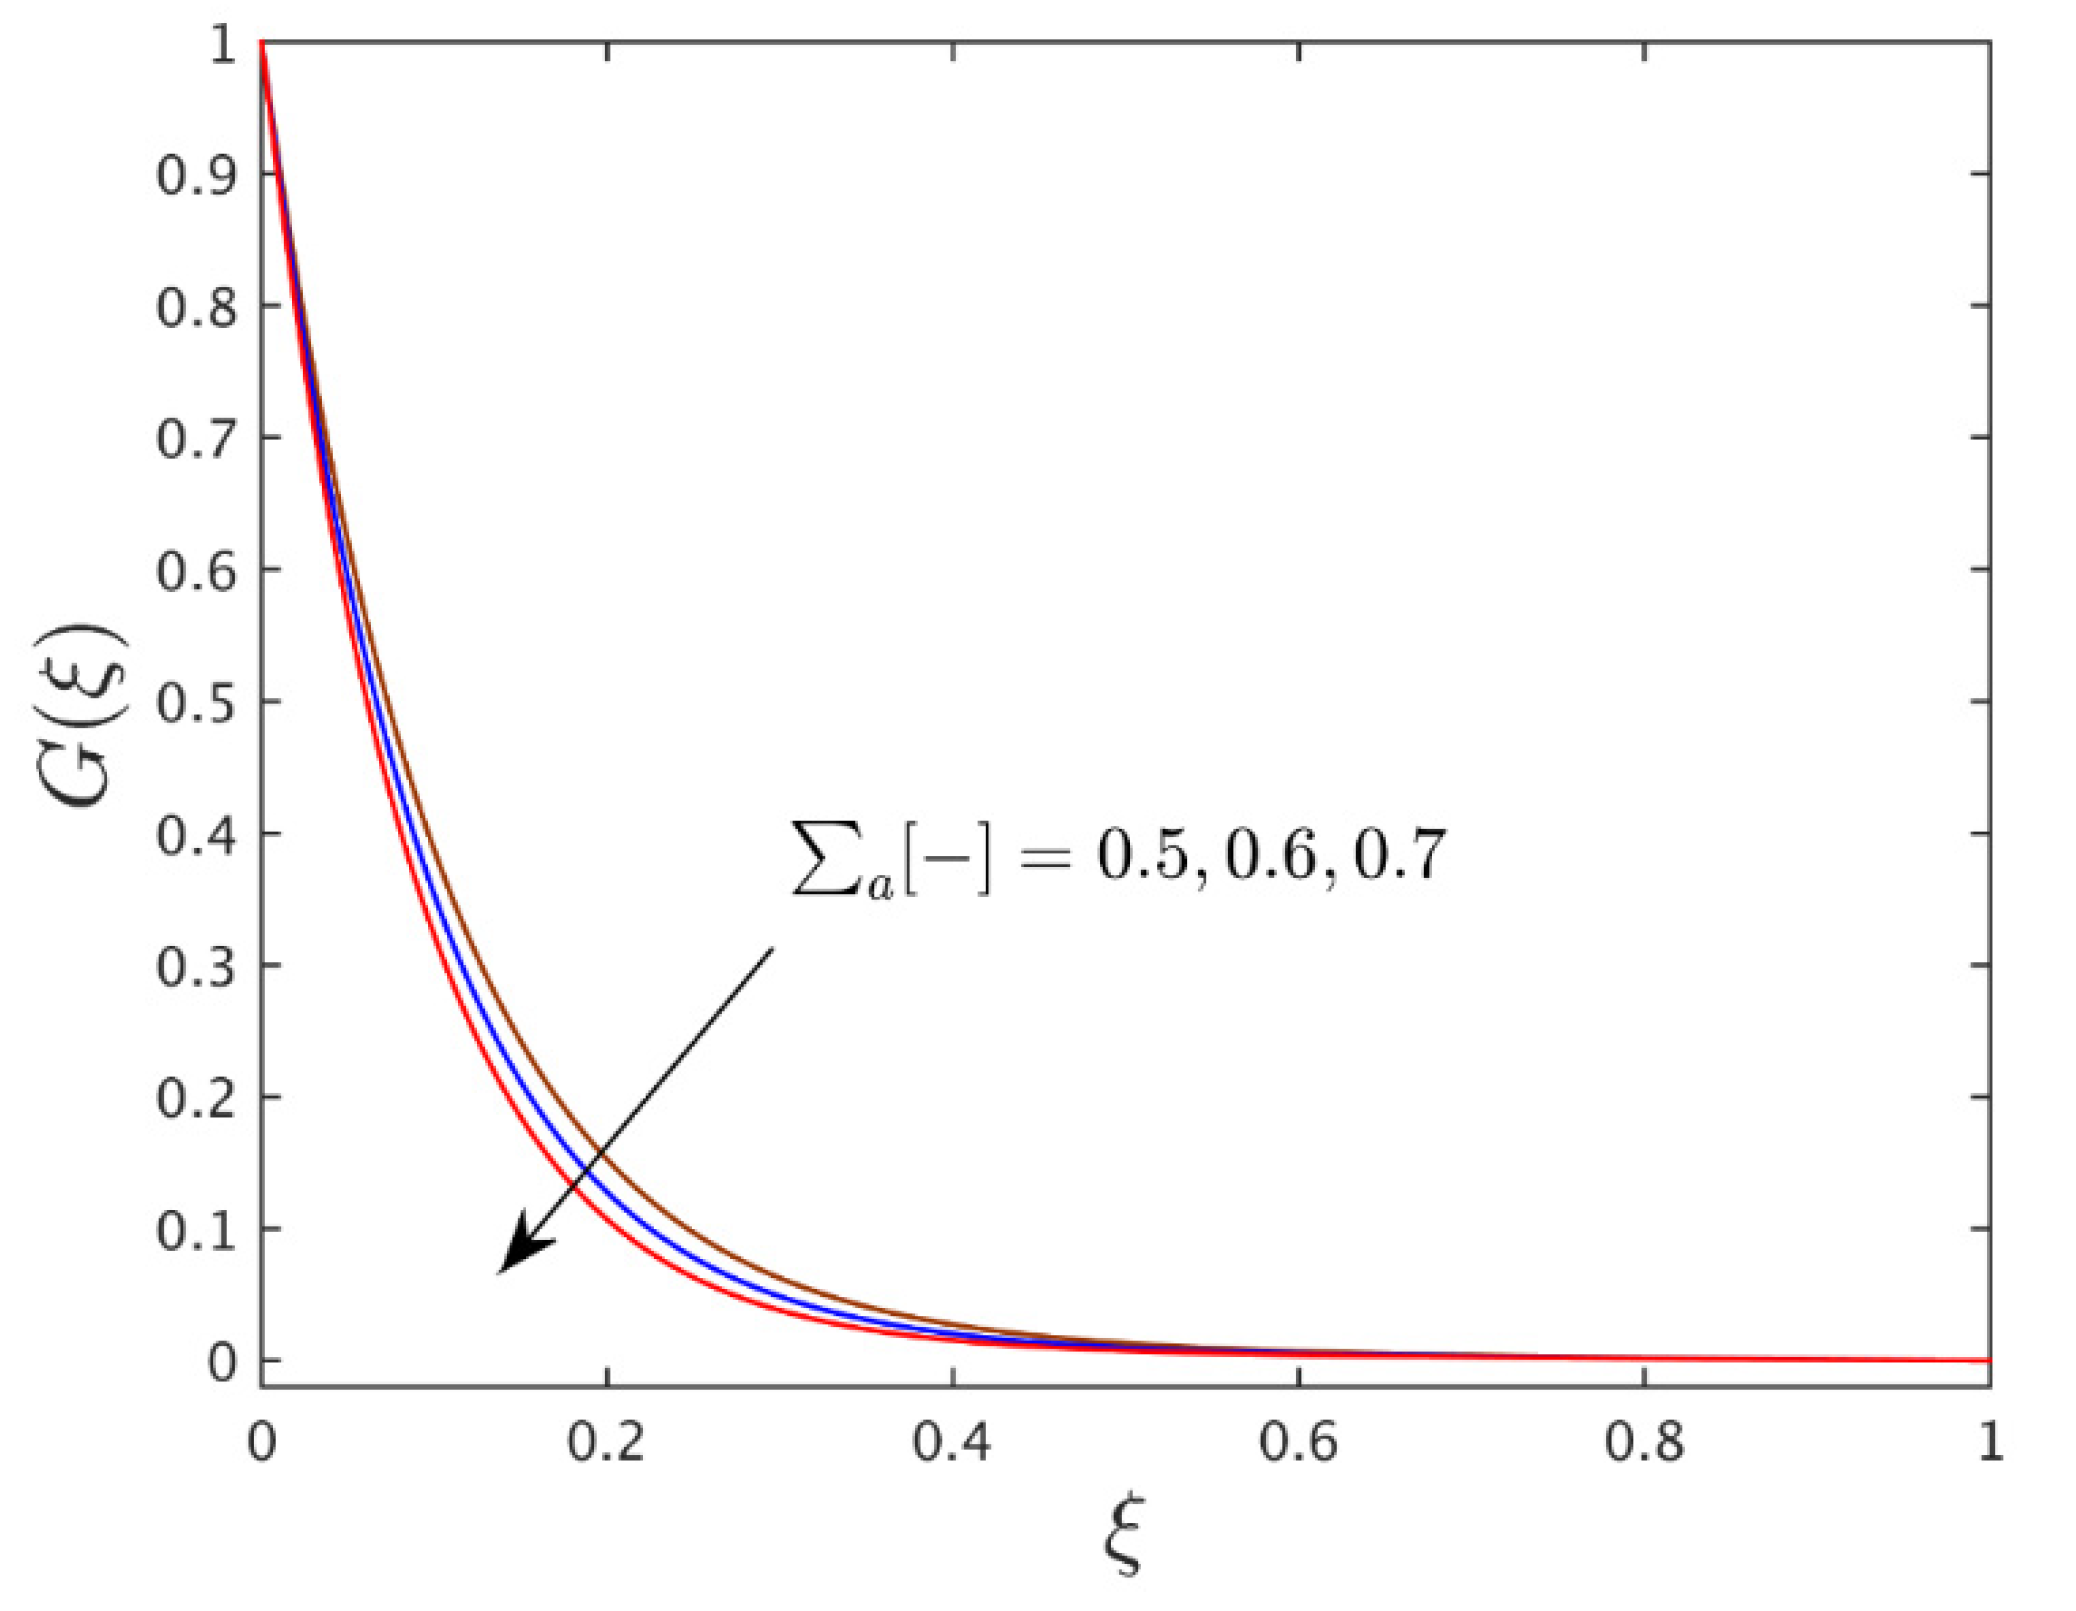
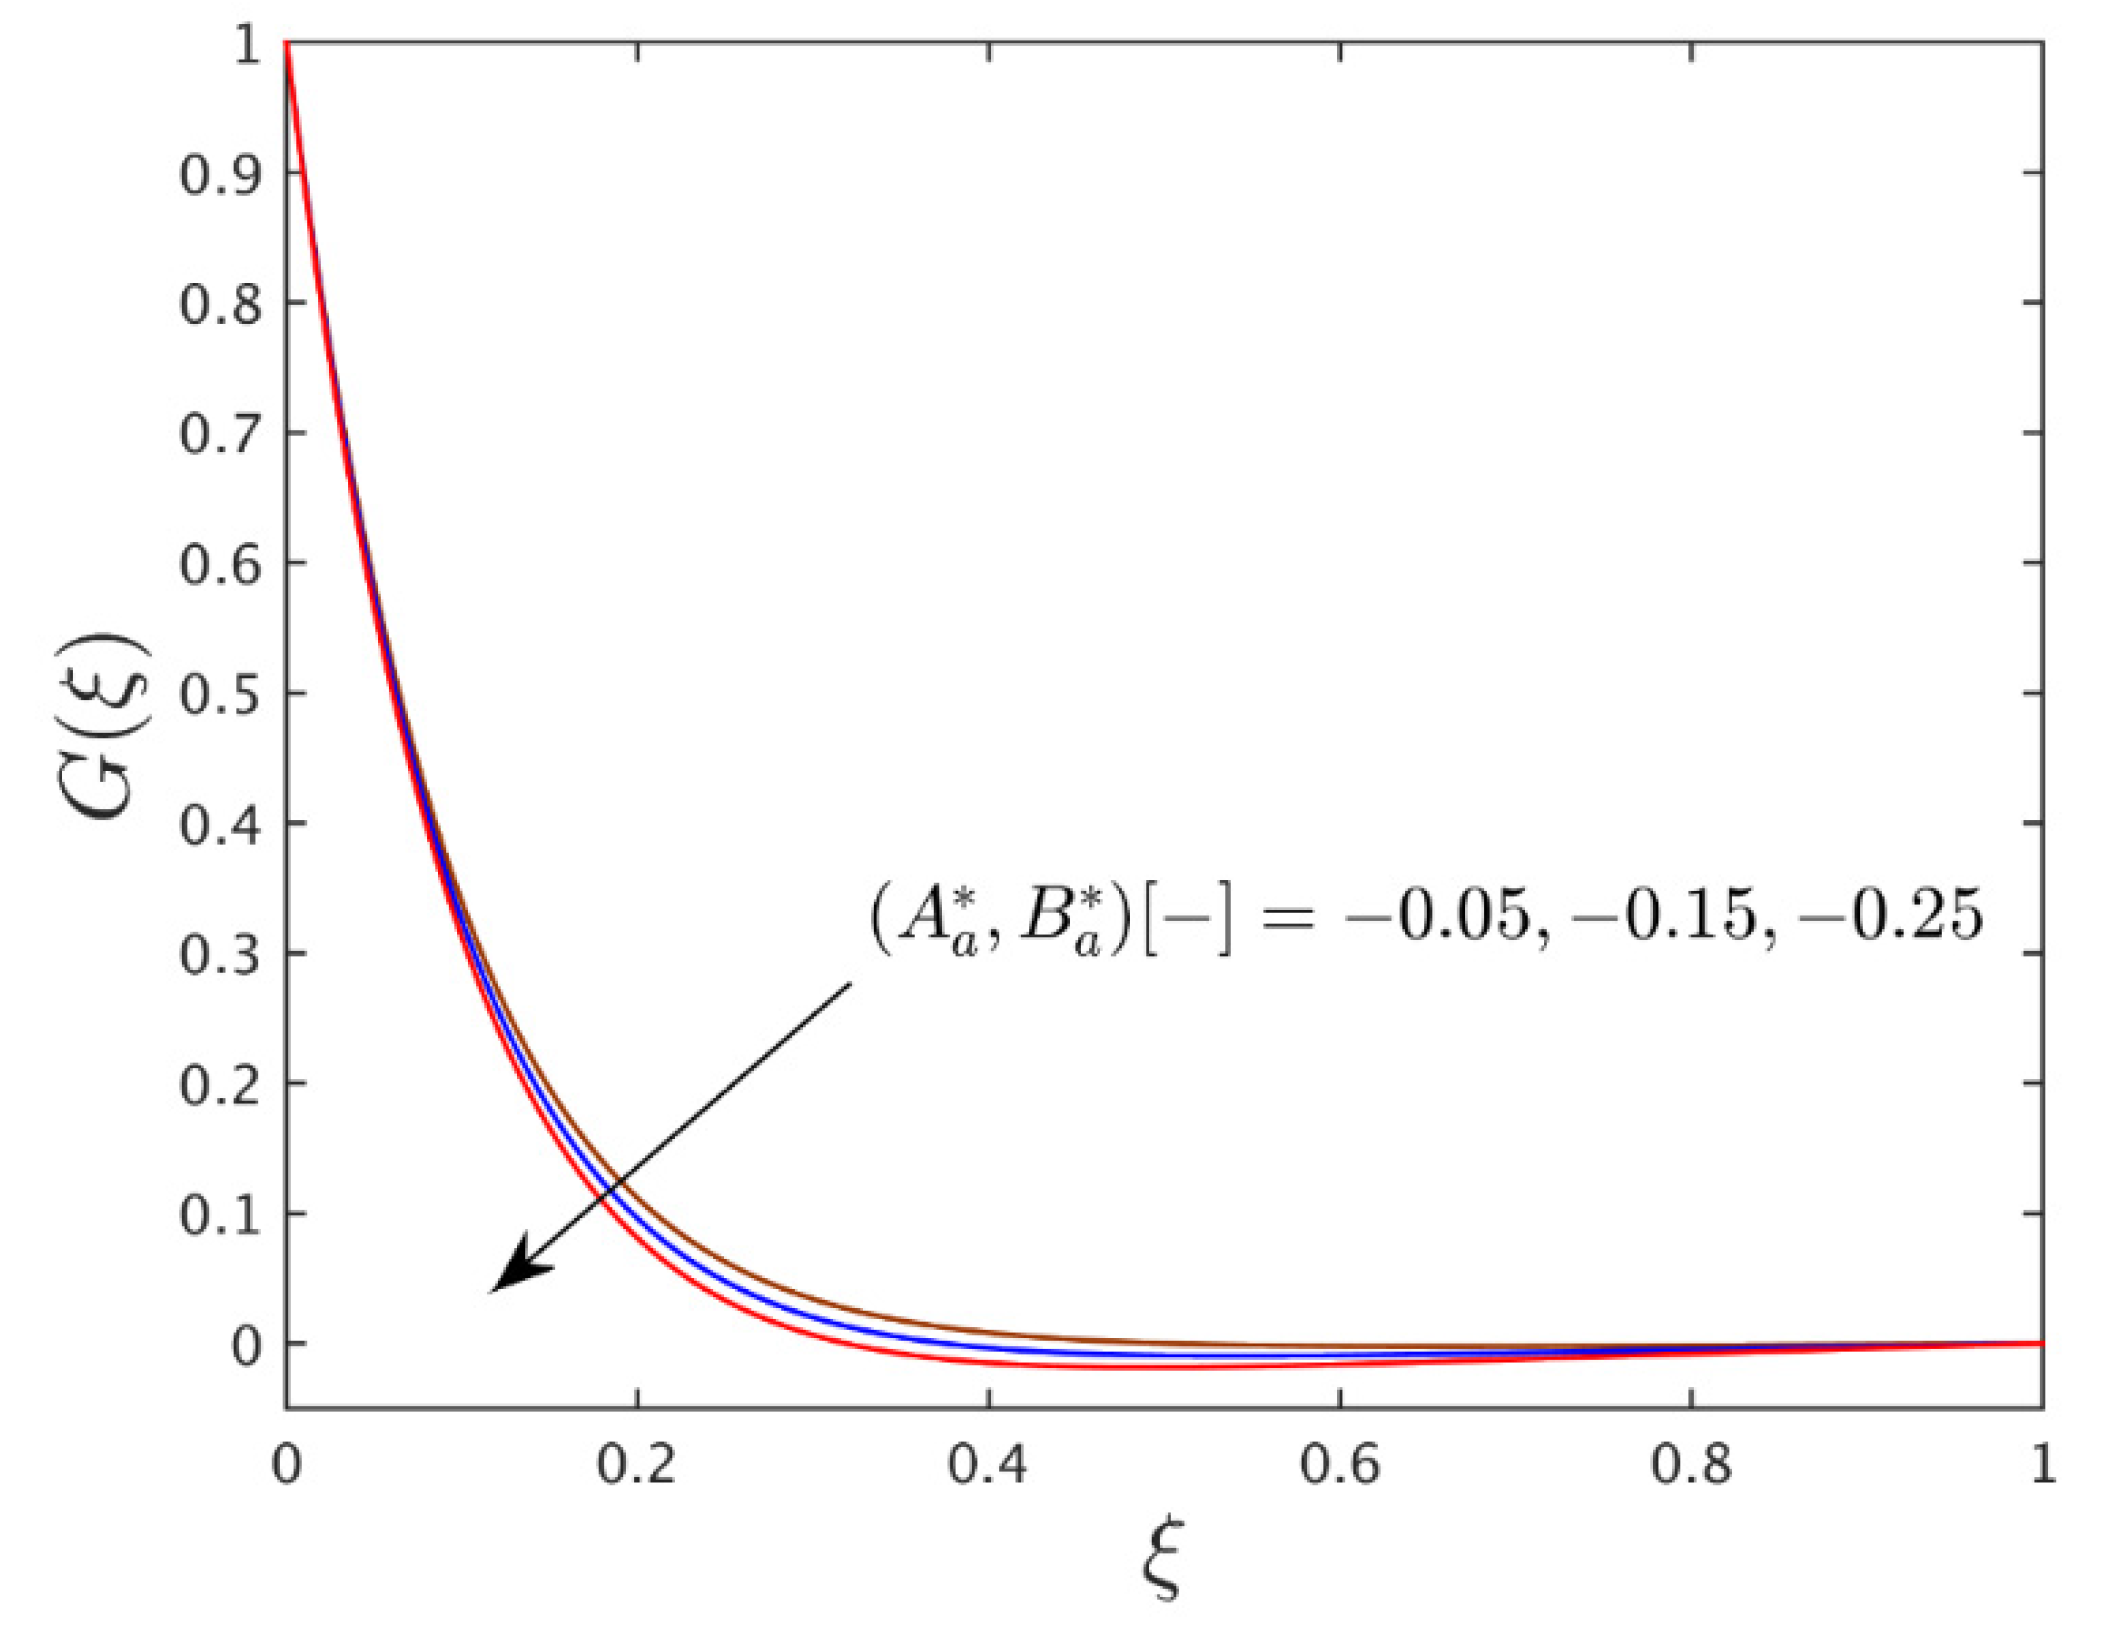
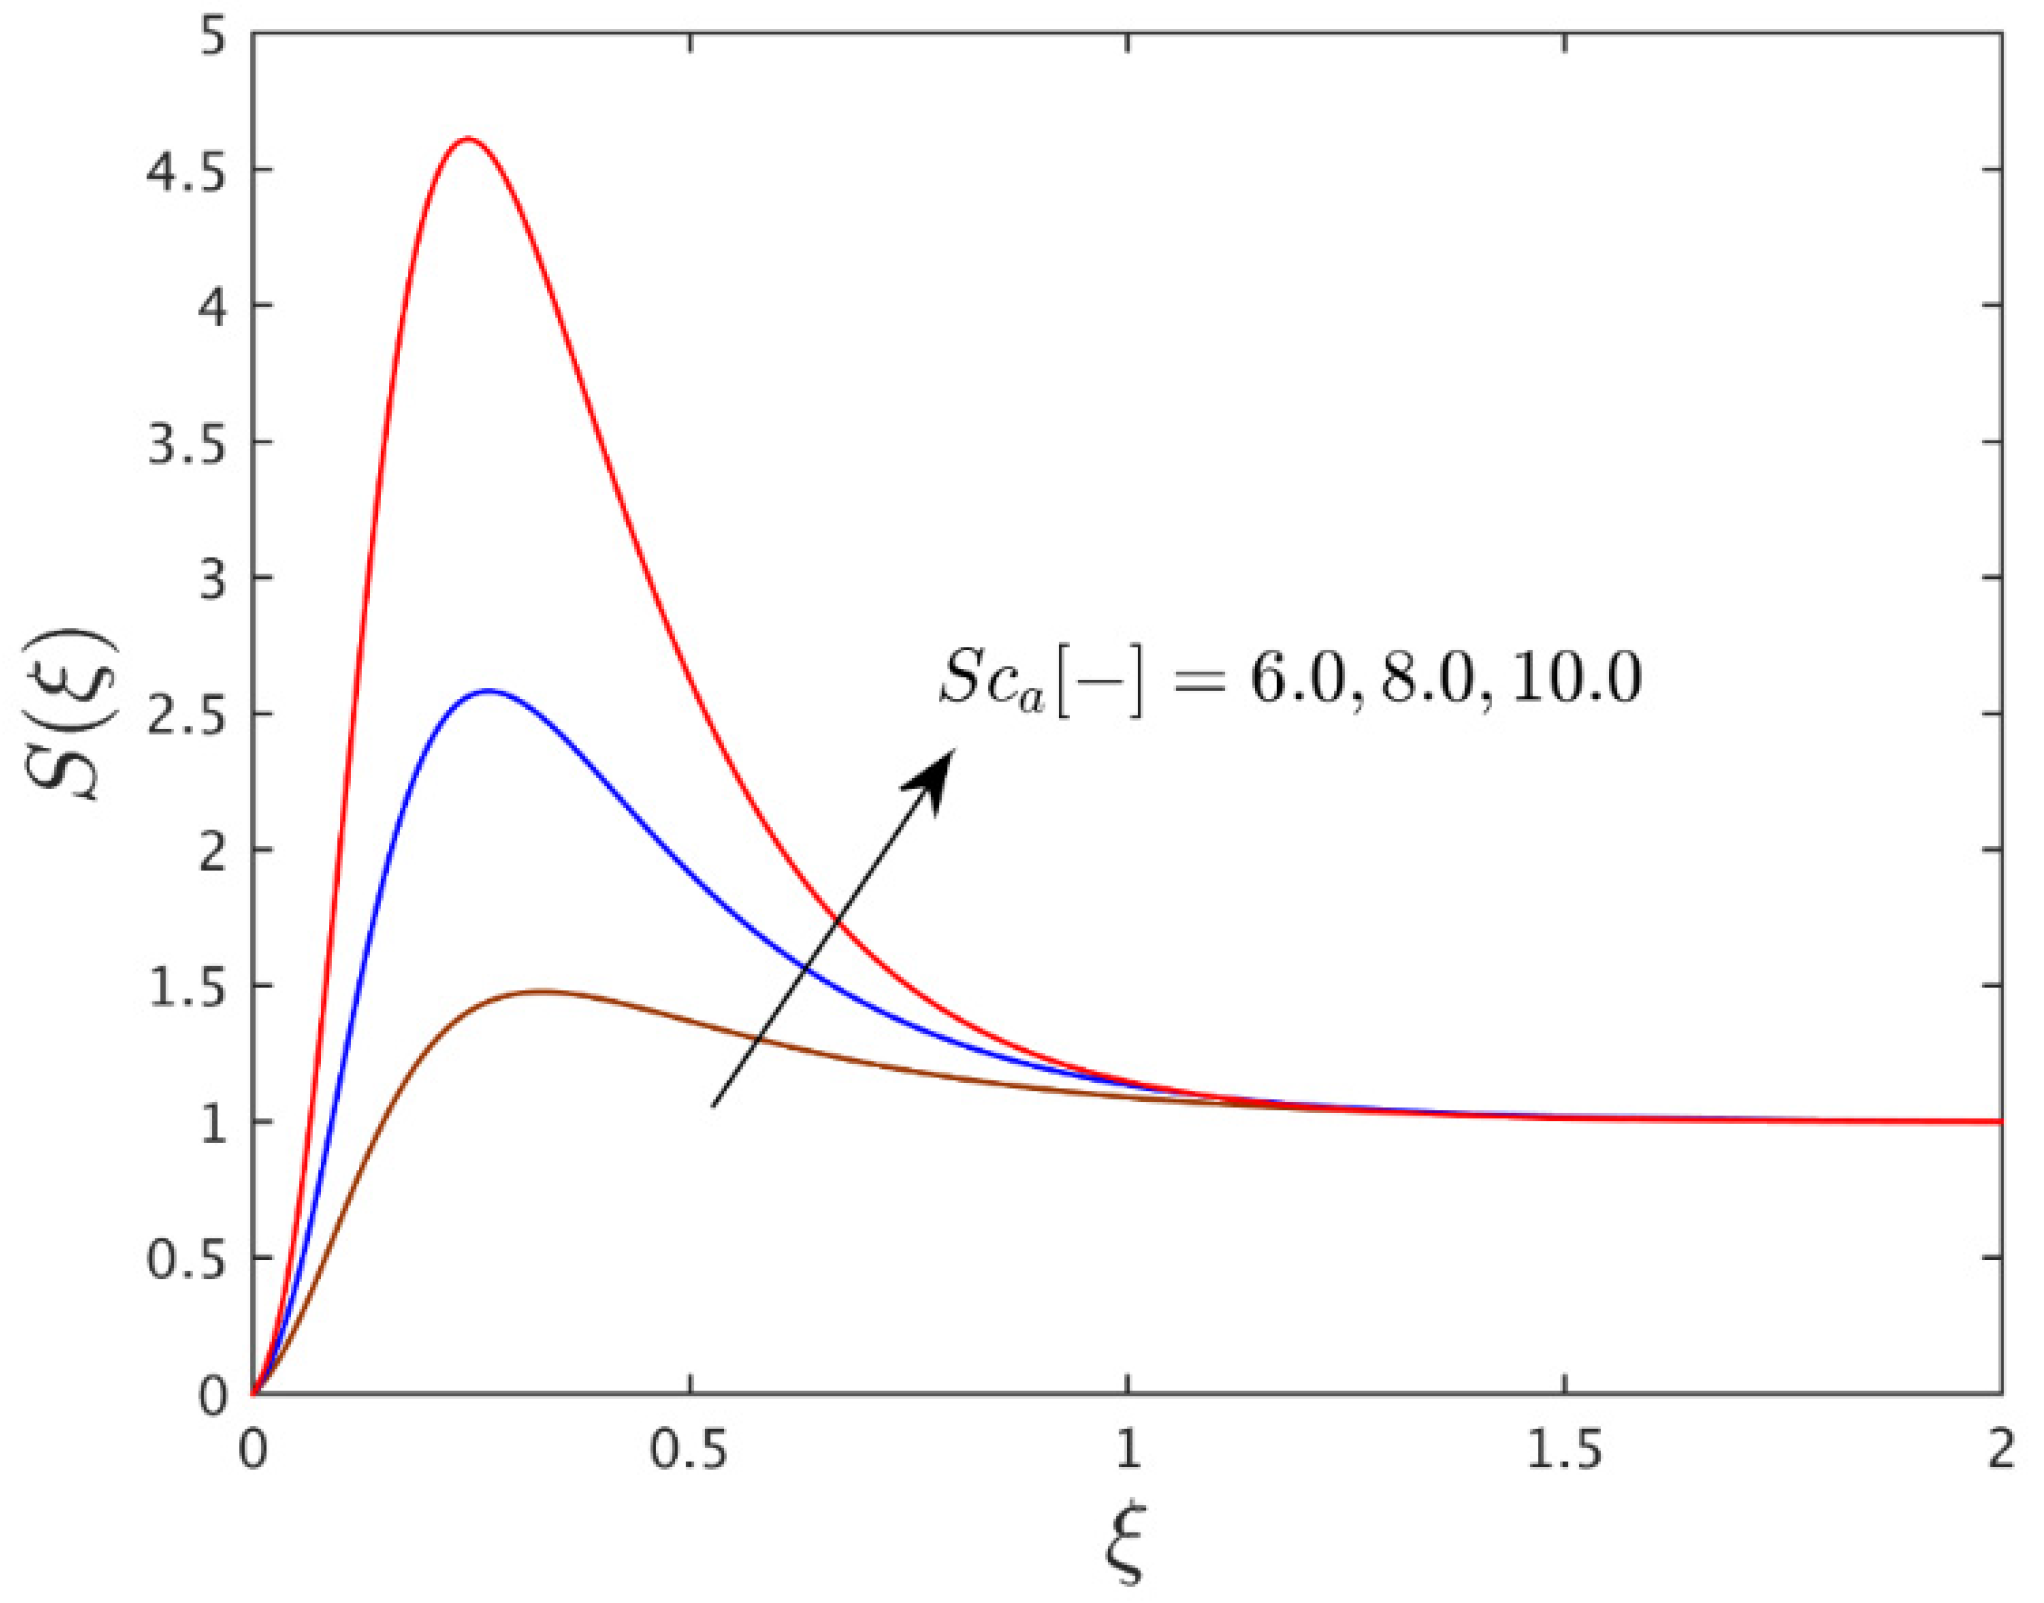
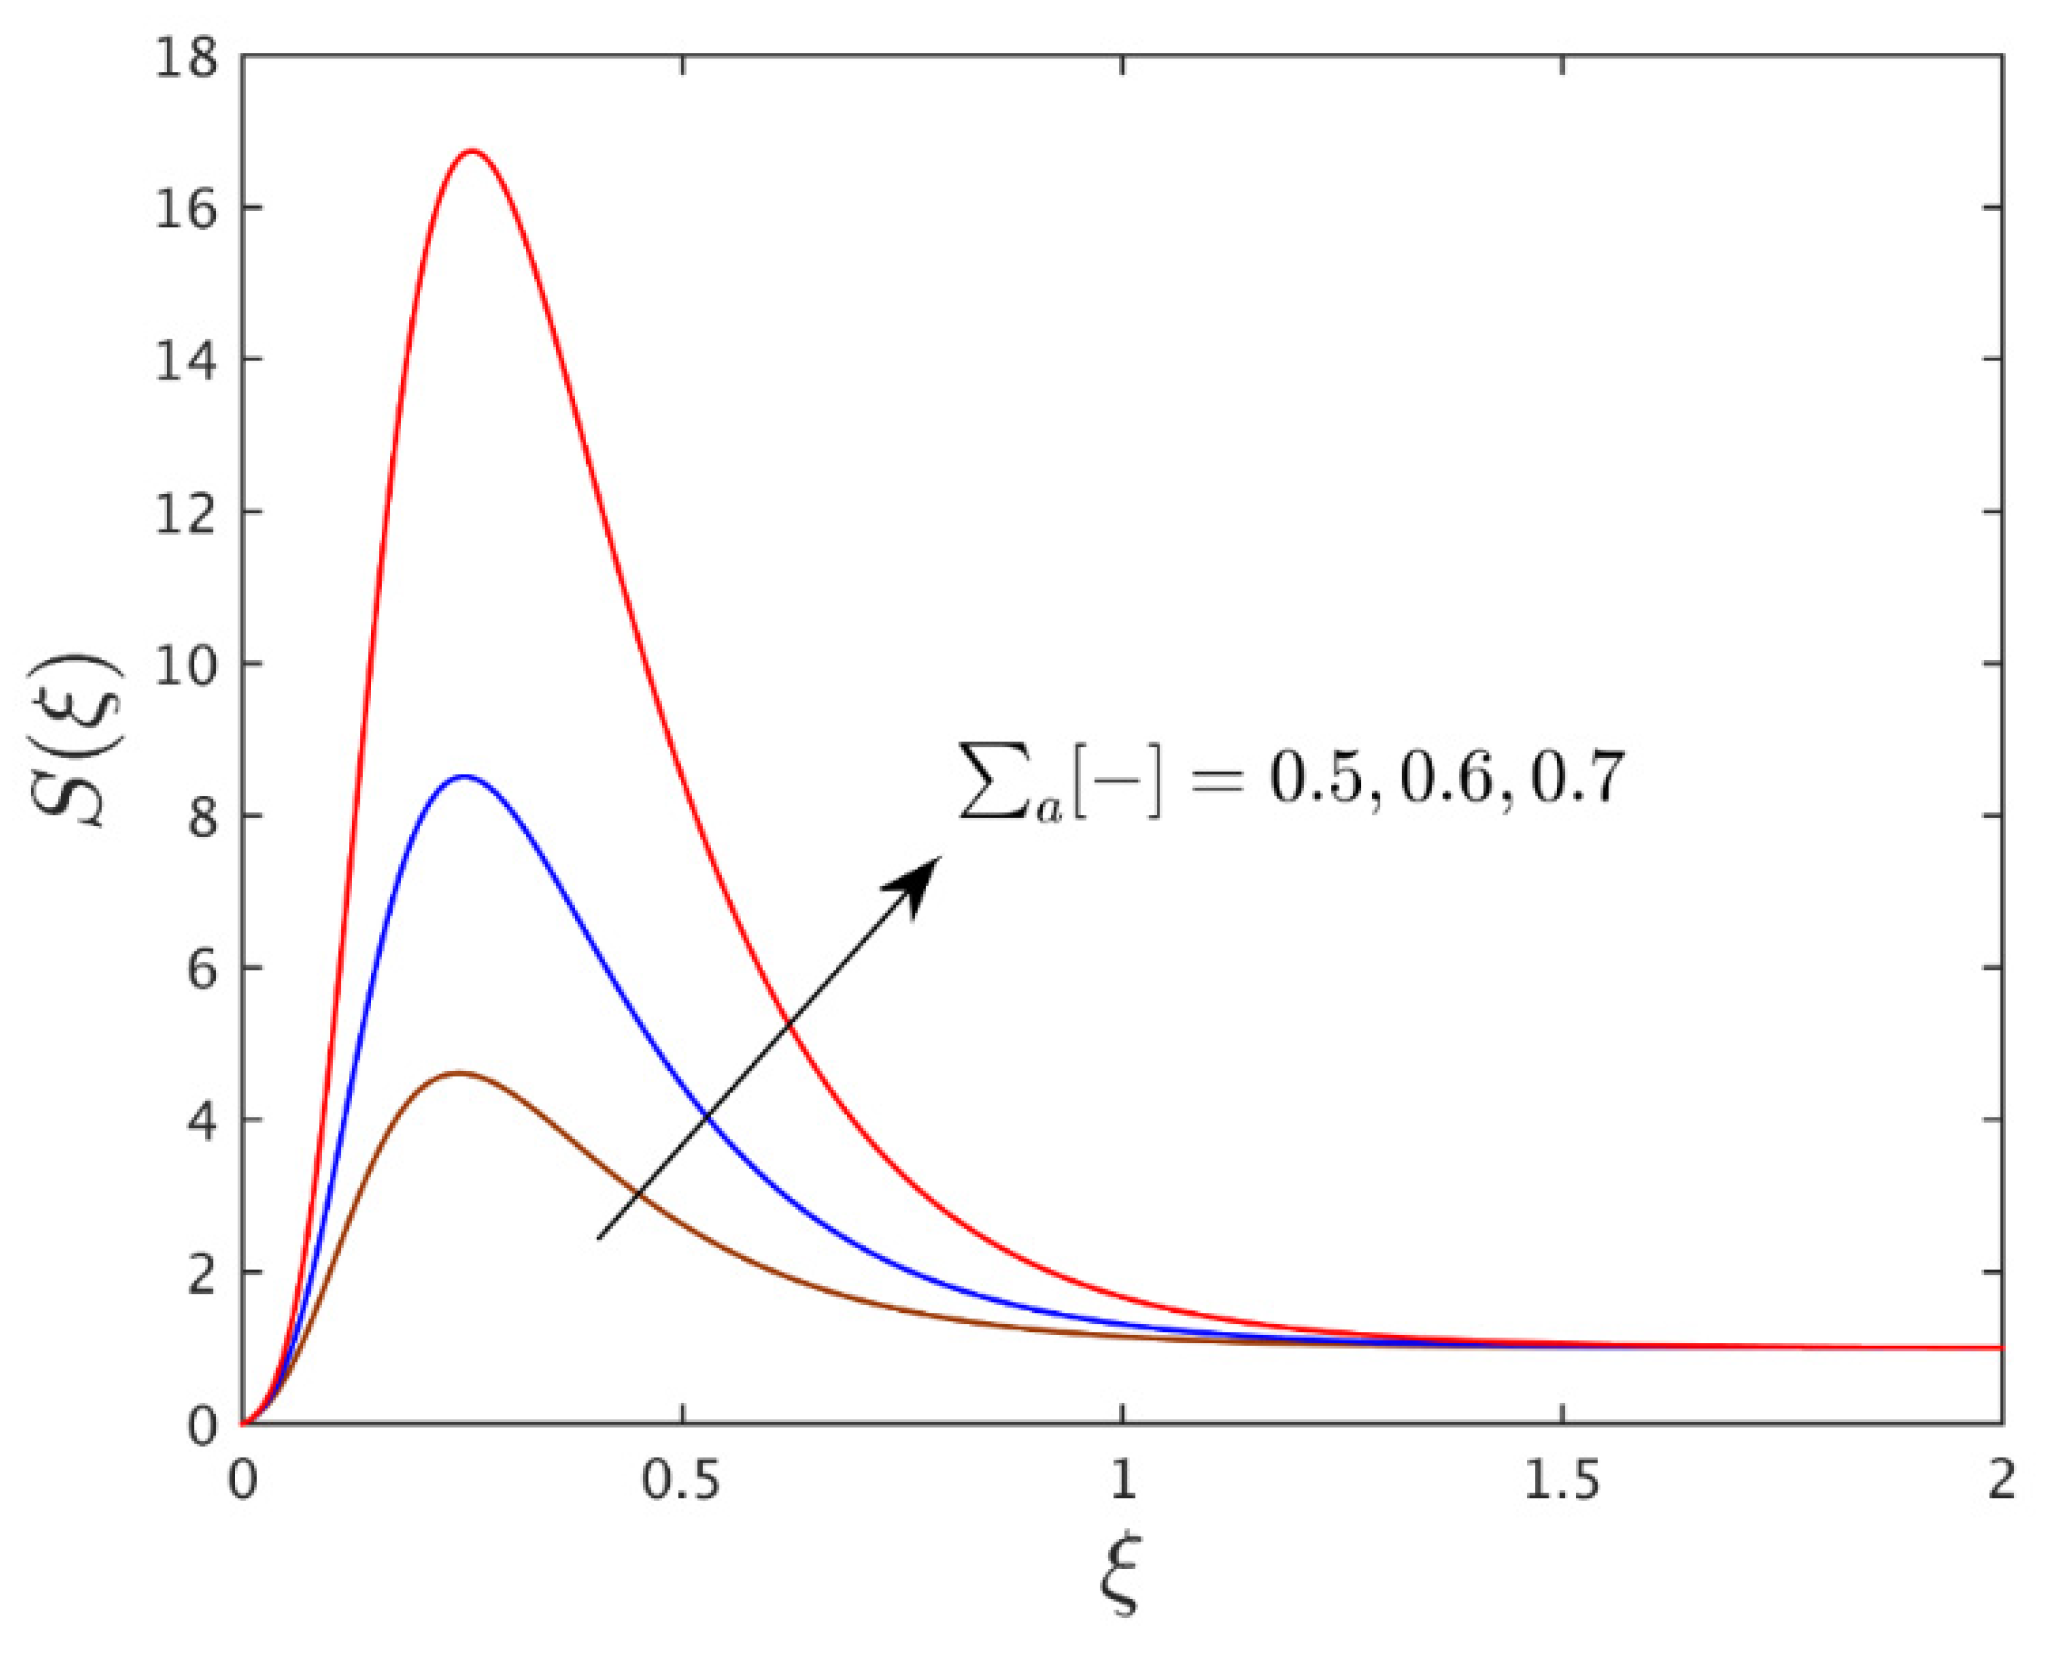
4.4. Interpretation of the Concentration Profiles
5. Conclusions
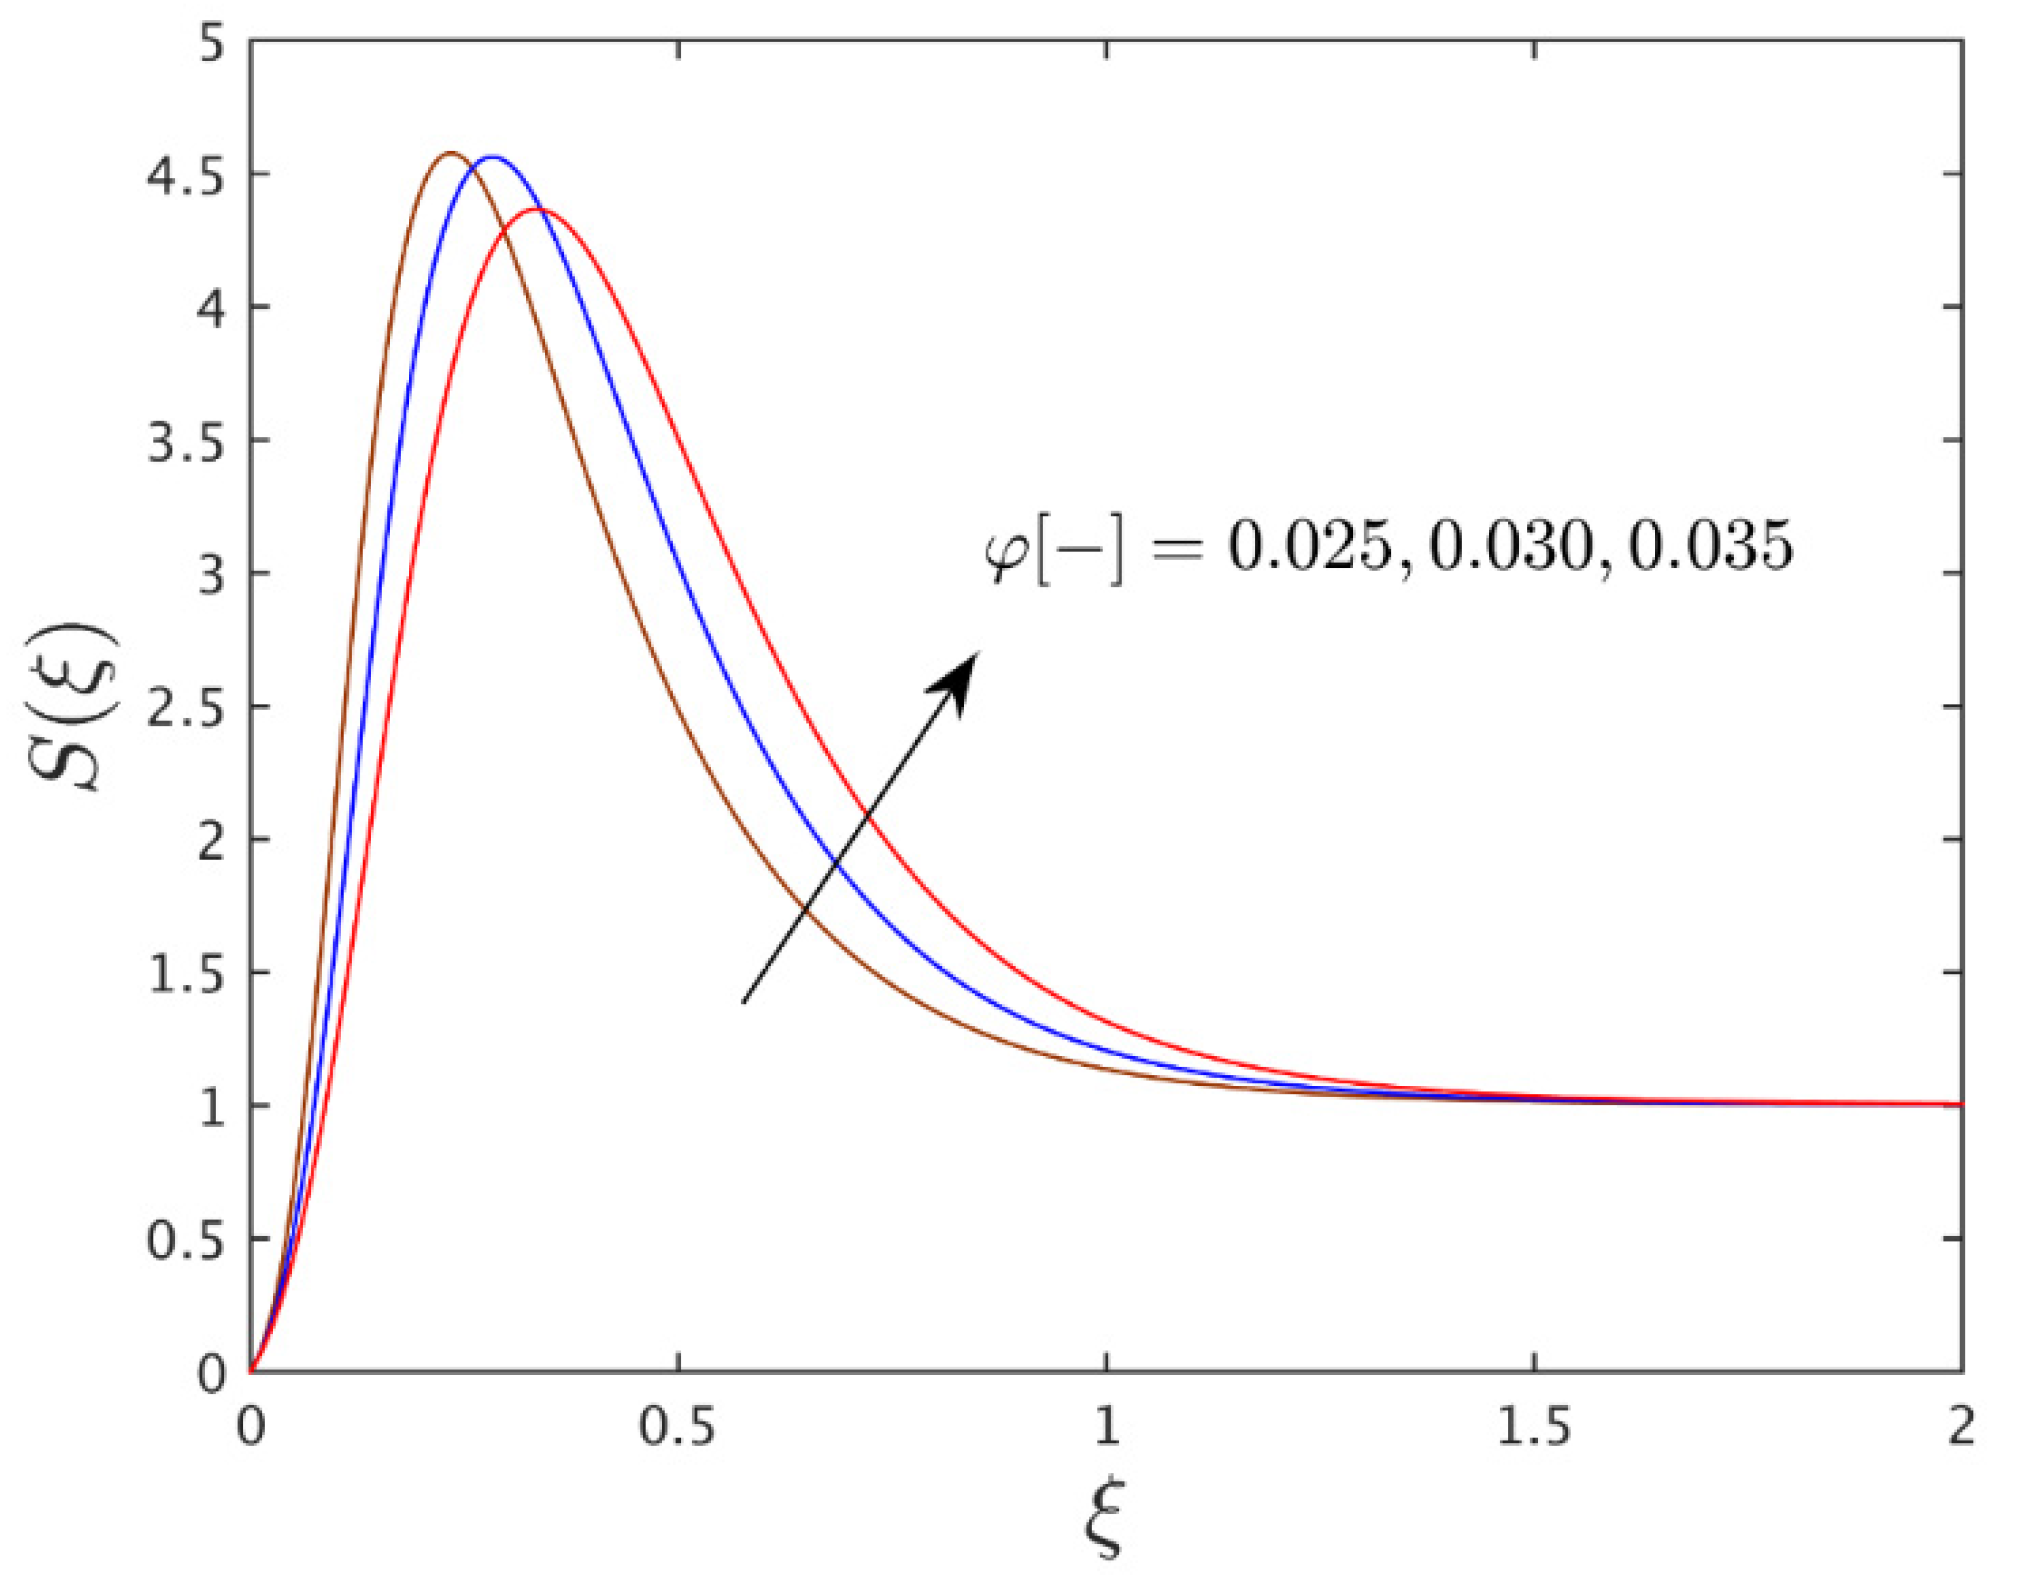
- With the larger value of the solid nanoparticle volume fractions, the velocity of the wall jet flow profile is moderate, while the temperature and concentration profile curves are augmented due to the higher number of nanoparticles, consequences which generate greater heat and significantly improved the thermal conductivity.
- For the advanced value of the thermophoretic parameter, the temperature profile shrinks but the profile of the concentration is boosted which might enhance the thermophoretic coefficient.
- The internal heat source factor escalates the temperature profile distribution but decelerates the concentration profiles while the influence of the internal heat sink factor is the opposite. By adding more heat to the wall jet flow system the heat source ultimately boosts the fluid temperature, whereas the heat sink factor that captivates heat from the temperature boundary layer causes the temperature profile to drop.
- Initially, the velocity profile enriches and then declines with the advanced value of the mass suction parameter.
- The shear stress progresses with the larger value of the magnetic parameter due to the Lorentz forces while it reduces magnitude-wise with the mass injection parameter.
- The solid nanoparticle volume fractions escalate the heat transfer while reducing the rate of mass transfer.
- The shear stress increases up to 12.3%, the Nusselt number increases up to 0.119%, and the Sherwood number increases up to 0.006% due to the presence of nanofluid.
- The Nusselt number decreases up to 1.328% in the case of suction and increases up to 1.188% due to injection.
- The Sherwood number decreases up to 0.182%, 0.021%, and 0.022% due to , , and , respectively.
Author Contributions
Funding
Data Availability Statement
Acknowledgments
Conflicts of Interest
Nomenclature
| , | Heat source/sink parameters |
| Constant magnetic field strength (Tesla) | |
| Concentration | |
| Wall concentration | |
| Ambient concentration | |
| Mass diffusion coefficient | |
| Activation energy | |
| Mass suction/injection | |
| Irregular heat source/sink | |
| Variable chemical reaction rate | |
| Thermophoretic coefficient | |
| Thermophoretic parameter | |
| Reference temperature | |
| Wall temperature (K) | |
| Ambient temperature (K) | |
| Temperature (K) | |
| Temperature index parameter | |
| Magnetic parameter | |
| Prandtl number | |
| Nusselt number | |
| Skin friction coefficient | |
| Reynolds number | |
| Schmidt number | |
| Sherwood number | |
| Dimensionless temperature | |
| Dimensionless concentration | |
| Thermal conductivity (W/ (m·K)) | |
| Thermophoretic particle deposition | |
| Components of velocity along the - and - axes (m/s) | |
| Reference velocity | |
| Cylindrical coordinates (m) | |
| Specific heat at constant pressure (J/ Kg·K) | |
| Greek symbols | |
| Chemical reaction rate | |
| Temperature difference parameter | |
| Kinematic viscosity (m2/s) | |
| Electrical conductivity () | |
| Dynamic viscosity (N·s/m2) | |
| Pseudo-similarity variable | |
| Density (kg/m3) | |
| Stream function | |
| Solid nanoparticle volume fraction | |
| Acronyms | |
| MHD | Magnetohydrodynamics |
| GO | Graphene oxide |
| 2D | Two-dimensional |
| BCs | Boundary conditions |
| BLT | Boundary layer thickness |
| BLF | Boundary layer flow |
| NIG | Non-isothermal gas |
| Subscripts | |
| Nanofluid | |
| Regular base fluid | |
| Wall boundary condition | |
| Far-field condition | |
| Superscript | |
| ′ | Derivative with respect to |
References
- Balazs, A.C.; Emrick, T.; Russell, T.P. Nanoparticle Polymer Composites: Where Two Small Worlds Meet. Science 2006, 314, 1107–1110. [Google Scholar] [CrossRef] [PubMed]
- Yu, C.; Kim, Y.S.; Kim, D.; Grunlan, J.C. Thermoelectric Behavior of Segregated-Network Polymer Nanocomposites. Nano Lett. 2008, 8, 4428–4432. [Google Scholar] [CrossRef] [PubMed]
- Bakunin, V.; Suslov, A.; Kuzmina, G.; Parenago, O.; Topchiev, A. Synthesis and Application of Inorganic Nanoparticles as Lubricant Components—A Review. J. Nanopart. Res. 2004, 6, 273–284. [Google Scholar] [CrossRef]
- Li, W.; Zheng, S.H.; Cao, B.Q.; Ma, S. Friction and wear properties of ZrO2/SiO2 composite nanoparticles. J. Nanopart. Res. 2010, 13, 2129–2137. [Google Scholar] [CrossRef]
- Wu, Z.-S.; Ren, W.; Wen, L.; Gao, L.; Zhao, J.; Chen, Z.; Zhou, G.; Li, F.; Cheng, H.-M. Graphene Anchored with Co3O4 Nanoparticles as Anode of Lithium Ion Batteries with Enhanced Reversible Capacity and Cyclic Performance. ACS Nano 2010, 4, 3187–3194. [Google Scholar] [CrossRef]
- Pumera, M. Graphene-based nanomaterials for energy storage. Energy Environ. Sci. 2010, 4, 668–674. [Google Scholar] [CrossRef]
- Ahmad, I.; McCarthy, J.E.; Baranoy, A.; Gun’ko, Y.K. Development of graphene nanoplate based counter electrodes for solar cells. Materials 2015, 8, 5953–5973. [Google Scholar] [CrossRef]
- Khan, N.S.; Gul, T.; Islam, S.; Khan, I.; Alqahtani, A.M.; Alshomrani, A.S. Magnetohydrodynamic Nanoliquid Thin Film Sprayed on a Stretching Cylinder with Heat Transfer. J. Appl. Sci. 2017, 7, 271. [Google Scholar] [CrossRef]
- Zuhra, S.; Khan, N.S.; Khan, M.A.; Islam, S.; Khan, W.; Bonyah, E. Flow and heat transfer in water based liquid film fluids dispensed with graphene nanoparticles. Results Phys. 2018, 8, 1143–1157. [Google Scholar] [CrossRef]
- Khan, U.; Zaib, A.; Ishak, A.; Waini, I.; Pop, I. Mixed Convection Flow of Water Conveying Graphene Oxide Nanoparticles over a Vertical Plate Experiencing the Impacts of Thermal Radiation. Mathematics 2022, 10, 2833. [Google Scholar] [CrossRef]
- Alam, M.; Rahman, M.; Sattar, M. Effects of variable suction and thermophoresis on steady MHD combined free-forced con-vective heat and mass transfer flow over a semi-infinite permeable inclined plate in the presence of thermal radiation. Int. J. Therm. Sci. 2008, 47, 758–765. [Google Scholar] [CrossRef]
- Damseh, R.A.; Tahat, M.S.; Benim, D.-I.H.A.C. Nonsimilar solutions of magnetohydrodynamic and thermophoresis particle deposition on mixed convection problem in porous media along a vertical surface with variable wall temperature. Prog. Comput. Fluid Dyn. Int. J. 2009, 9, 58. [Google Scholar] [CrossRef]
- Rahman, M.M. Thermophoretic deposition of nanoparticles due to a permeable rotating disk: Effects of partial slip, magnetic field, thermal radiation, thermal diffusion, and diffusion thermo. Int. J. Math. Comput. Phys. Electr. Comput. Eng. 2013, 7, 899–911. [Google Scholar]
- Doh, D.-H.; Muthtamilselvan, M.; Swathene, B.; Ramya, E. Homogeneous and heterogeneous reactions in a nanofluid flow due to a rotating disk of variable thickness using HAM. Math. Comput. Simul. 2020, 168, 90–110. [Google Scholar] [CrossRef]
- Gowda, R.P.; Kumar, R.N.; Aldalbahi, A.; Issakhov, A.; Prasannakumara, B.; Rahimi-Gorji, M.; Rahaman, M. Thermophoretic particle deposition in time-dependent flow of hybrid nanofluid over rotating and vertically upward/ downward moving disk. Surf. Interfaces 2021, 22, 100864. [Google Scholar] [CrossRef]
- Waini, I.; Khan, U.; Zaib, A.; Ishak, A.; Pop, I. Thermophoresis particle deposition of CoFe2O4-TiO2 hybrid nanoparticles on micropolar flow through a moving flat plate with viscous dissipation effects. Int. J. Numer. Methods Heat Fluid Flow 2022, 32, 3259–3282. [Google Scholar] [CrossRef]
- Bashir, M.N.; Rauf, A.; Shehzad, S.A.; Ali, M.; Mushtaq, T. Thermophoresis phenomenon in radiative flow about vertical movement of a rotating disk in porous region. Adv. Mech. Eng. 2022, 14, 16878132221115019. [Google Scholar] [CrossRef]
- Bashir, S.; Ramzan, M.; Ghazwani, H.A.S.; Nisar, K.S.; Saleel, C.A.; Abdelrahman, A. Magnetic Dipole and Thermophoretic Particle Deposition Impact on Bioconvective Oldroyd-B Fluid Flow over a Stretching Surface with Cattaneo–Christov Heat Flux. Nanomaterials 2022, 12, 2181. [Google Scholar] [CrossRef]
- Shafique, Z.; Mustafa, M.; Mushtaq, A. Boundary layer flow of Maxwell fluid in rotating frame with binary chemical reaction and activation energy. Results Phys. 2016, 6, 627–633. [Google Scholar] [CrossRef]
- Khan, W.A.; Sultan, F.; Ali, M.; Shahzad, M.; Khan, M.; Irfan, M. Consequences of activation energy and binary chemical reaction for 3D flow of Cross-nanofluid with radiative heat transfer. J. Braz. Soc. Mech. Sci. Eng. 2019, 41, 4. [Google Scholar] [CrossRef]
- Khan, M.I.; Alzahrani, F. Binary chemical reaction with activation energy in dissipative flow of non-Newtonian nanomaterial. J. Theor. Comput. Chem. 2020, 19, 2040006. [Google Scholar] [CrossRef]
- Najafabadi, M.F.; Rostami, H.T.; Hosseinzadeh, K.; Ganji, D.D. Thermal analysis of a moving fin using the radial basis function approximation. Heat Transf. 2021, 50, 7553–7567. [Google Scholar] [CrossRef]
- Rana, B.; Arifuzzaman, S.; Islam, S.; Reza-E-Rabbi, S.; Al-Mamun, A.; Mazumder, M.; Roy, K.C.; Khan, S. Swimming of microbes in blood flow of nano-bioconvective Williamson fluid. Therm. Sci. Eng. Prog. 2021, 25, 101018. [Google Scholar] [CrossRef]
- Reza-E-Rabbi, S.; Ahmmed, S.F.; Islam, S.; Arifuzzaman, S.M.; Rana, B.M.J.; Ali, Y.; Al-Mamun, A.; Khan, S. Characterization of fluid flow and heat transfer of a periodic magnetohydrodynamics nano non-Newtonian liquid with Arrhenius activation energy and nonlinear radiation. Heat Transf. 2022. [Google Scholar] [CrossRef]
- Goren, S.L. Thermophoresis of aerosol particles in the laminar boundary layer on a flat plate. J. Colloid Interface Sci. 1977, 61, 77–85. [Google Scholar] [CrossRef]
- Talbot, L.; Cheng, R.K.; Schefer, R.W.; Willis, D.R. Thermophoresis of particles in a heated boundary layer. J. Fluid Mech. 1980, 101, 737–758. [Google Scholar] [CrossRef]
- Mills, A.; Xu, H.; Ayazi, F. The effect of wall suction and thermophoresis on aerosol particle deposition from a laminar boundary layer on a flat plate. Int. J. Heat Mass Transf. 1984, 27, 1110–1113. [Google Scholar] [CrossRef]
- Batchelor, G.; Shen, C. Thermophoretic deposition of particles in gas flowing over cold surfaces. J. Colloid Interface Sci. 1985, 107, 21–37. [Google Scholar] [CrossRef]
- Tsai, R. A simple approach for evaluating the effect of wall suction and thermophoresis on aerosol particle deposition from a laminar flow over a flat plate. Int. Commun. Heat Mass Transf. 1999, 26, 249–257. [Google Scholar] [CrossRef]
- Chamkha, A.J.; Issa, C. Effects of heat generation/absorption and thermophoresis on hydromagnetic flow with heat and mass transfer over a flat surface. Int. J. Numer. Methods Heat Fluid Flow 2000, 10, 432–449. [Google Scholar] [CrossRef]
- Chamkha, A.J.; Pop, I. Effect of thermophoresis particle deposition in free convection boundary layer from a vertical flat plate embedded in a porous medium. Int. Commun. Heat Mass Transf. 2004, 31, 421–430. [Google Scholar] [CrossRef]
- Alam, M.; Rahman, M.; Sattar, M. On the effectiveness of viscous dissipation and Joule heating on steady Magnetohydrodynamic heat and mass transfer flow over an inclined radiate isothermal permeable surface in the presence of thermophoresis. Commun. Nonlinear Sci. Numer. Simul. 2009, 14, 2132–2143. [Google Scholar] [CrossRef]
- Das, K.; Jana, S.; Kundu, P. Thermophoretic MHD slip flow over a permeable surface with variable fluid properties. Alex. Eng. J. 2015, 54, 35–44. [Google Scholar] [CrossRef]
- Sinha, A.; Misra, J.C. Mixed Convection Hydromagnetic Flow with Heat Generation, Thermophoresis and Mass Transfer over an Inclined Nonlinear Porous Shrinking Sheet: A Numerical Approach. J. Mech. 2014, 30, 491–503. [Google Scholar] [CrossRef]
- Zaib, A.; Shafie, S. Slip Effect on an Unsteady MHD Stagnation-Point Flow of a Micropolar Fluid towards a Shrinking Sheet with Thermophoresis Effect. Int. J. Comput. Methods Eng. Sci. Mech. 2015, 16, 285–291. [Google Scholar] [CrossRef]
- Jyothi, A.M.; Kumar, R.S.V.; Madhukesh, J.K.; Prasannakumara, B.C.; Ramesh, G.K. Squeezing flow of Casson hybrid nanofluid between parallel plates with a heat source or sink and thermophoretic particle deposition. Heat Transf. 2021, 50, 7139–7156. [Google Scholar] [CrossRef]
- Shah, N.A.; Yook, S.-J.; Tosin, O. Analytic simulation of thermophoretic second grade fluid flow past a vertical surface with variable fluid characteristics and convective heating. Sci. Rep. 2022, 12, 5445. [Google Scholar] [CrossRef] [PubMed]
- Tetervin, N. Laminar Flow of a Slightly Viscous Incompressible Fluid that Issues from a Slit and Passes over a Flat Plate; No. 1644; NACA TN: Washington, DC, USA, 1948; p. 40. [Google Scholar]
- Glauert, M.B. The wall jet. J. Fluid Mech. 1965, 1, 625–643. [Google Scholar] [CrossRef]
- Riley, N. Effects of compressibility on a laminar wall jet. J. Fluid Mech. 1958, 4, 615–628. [Google Scholar] [CrossRef]
- Schwarz, W.H.; Caswell, B. Some heat transfer characteristics of the two-dimensional laminar incompressible wall jet. Chem. Eng. Sci. 1961, 16, 338–351. [Google Scholar] [CrossRef]
- Gorla, R.S.R. Unsteady heat transfer characteristics of a two dimensional laminar wall jet. Int. J. Eng. Sci. 1973, 11, 841–851. [Google Scholar] [CrossRef]
- Aly, E.H.; Pop, I. Merkin and Needham wall jet problem for hybrid nanofluids with thermal energy. Eur. J. Mech.—B Fluids 2020, 83, 195–204. [Google Scholar] [CrossRef]
- Chiam, T.C. Hydromagnetic flow over a surface with a power law velocity. Int. J. Eng. Sci. 1995, 33, 429–435. [Google Scholar] [CrossRef]
- Sheikholeslami, M.; Gorji-Bandpay, M.; Ganji, D.D.G.-D. Magnetic field effects on natural convection around a horizontal circular cylinder inside a square enclosure filled with nanofluid. Int. Commun. Heat Mass Transf. 2012, 39, 978–986. [Google Scholar] [CrossRef]
- Khan, U.; Zaib, A.; Ishak, A.; Sherif, E.-S.M.; Waini, I.; Chu, Y.-M.; Pop, I. Radiative mixed convective flow induced by hybrid nanofluid over a porous vertical cylinder in a porous media with irregular heat sink/source. Case Stud. Therm. Eng. 2022, 30, 101711. [Google Scholar] [CrossRef]
- Raees, A.; Xu, H.; Raees-Ul-Haq, M. Explicit solutions of wall jet flow subject to a convective boundary condition. Bound. Value Probl. 2014, 2014, 163. [Google Scholar] [CrossRef]
- Hossain, R.; Azad, A.; Hasan, J.; Rahman, M. Thermophysical properties of Kerosene oil-based CNT nanofluid on unsteady mixed convection with MHD and radiative heat flux. Eng. Sci. Technol. Int. J. 2022, 35, 101095. [Google Scholar] [CrossRef]
- Waini, I.; Ishak, A.; Pop, I. MHD Glauert Flow of a Hybrid Nanofluid with Heat Transfer. J. Adv. Res. Fluid Mech. Therm. Sci. 2021, 86, 91–100. [Google Scholar] [CrossRef]


| Properties | Pr | ||||
|---|---|---|---|---|---|
| Kerosene Oil | 783 | 2090 | 0.145 | 21 × 10−6 | 23.004 |
| GO | 1800 | 717 | 5000 | 6.3 × 10⁷ | --- |
| Glauert [39] | Waini et al. [49] | Present | |
|---|---|---|---|
| 0.000 | 2/9 ≈ 0.2222 | 0.2222 | 0.2222 |
| 0.035 | - | - | 0.3178 |
| 0.037 | - | - | 0.3656 |
| 0.039 | - | - | 0.4132 |
| Present | |||
|---|---|---|---|
| 0.025 | 0.050 | 0.50 | 2.6936103 × 10⁻²⁴ |
| 0.030 | - | - | 3.0249424 × 10⁻²⁴ |
| 0.035 | - | - | 3.5679915 × 10⁻²⁴ |
| 0.025 | 0.010 | 0.50 | 6.1248582 × 10⁻²⁵ |
| - | 0.030 | - | 2.6936103 × 10⁻²⁴ |
| - | 0.060 | - | 1.4926103 × 10⁻²³ |
| 0.025 | 0.050 | 0.44 | 2.0048851 × 10⁻²⁰ |
| - | - | 0.48 | 4.2566067 × 10⁻²³ |
| - | - | 0.52 | 5.6122940 × 10⁻²⁶ |
| 0.025 | 0.050 | −0.05 | −2.2398001 × 10⁻⁸ |
| - | - | −0.10 | −1.8971081 × 10⁻⁸ |
| - | - | −0.15 | −1.5216356 × 10⁻⁸ |
| Present | |||
|---|---|---|---|
| 0.025 | 1.00 | 0.05 | 11.270130 |
| 0.030 | - | - | 11.283560 |
| 0.035 | - | - | 11.297009 |
| 0.025 | 0.00 | 0.05 | 11.270130 |
| - | 1.00 | - | 11.270130 |
| - | 2.00 | - | 11.270130 |
| 0.025 | 1.00 | 0.10 | 11.150721 |
| - | - | 0.15 | 11.002607 |
| - | - | 0.20 | 10.852631 |
| 0.025 | 1.00 | -0.10 | 11.725252 |
| - | - | -0.15 | 11.864568 |
| - | - | -0.20 | 12.002222 |
| Present | |||||
|---|---|---|---|---|---|
| 0.025 | 0.50 | 10 | 0.50 | 0.50 | 4.9769350 |
| 0.030 | - | - | - | - | 4.9766304 |
| 0.035 | - | - | - | - | 4.9763215 |
| 0.025 | 0.50 | 10 | 0.50 | 0.50 | 4.9769350 |
| - | 0.60 | - | - | - | 4.9678700 |
| - | 0.70 | - | - | - | 4.9531125 |
| 0.025 | 0.50 | 6.00 | 0.50 | 0.50 | 2.9741238 |
| - | - | 8.00 | - | - | 3.9749540 |
| - | - | 10.0 | - | - | 4.9769350 |
| 0.025 | 0.50 | 10.0 | 0.50 | 0.50 | 4.9769350 |
| - | - | - | 1.00 | - | 4.9758414 |
| - | - | - | 1.50 | - | 4.9733595 |
| 0.025 | 0.50 | 10 | 0.50 | 0.50 | 4.9769350 |
| - | - | - | - | 1.00 | 4.9758137 |
| - | - | - | - | 1.50 | 4.9746928 |
Publisher’s Note: MDPI stays neutral with regard to jurisdictional claims in published maps and institutional affiliations. |
© 2022 by the authors. Licensee MDPI, Basel, Switzerland. This article is an open access article distributed under the terms and conditions of the Creative Commons Attribution (CC BY) license (https://creativecommons.org/licenses/by/4.0/).
Share and Cite
Khan, U.; Zaib, A.; Ishak, A.; Waini, I.; Raizah, Z.; Boonsatit, N.; Jirawattanapanit, A.; Galal, A.M. Significance of Thermophoretic Particle Deposition, Arrhenius Activation Energy and Chemical Reaction on the Dynamics of Wall Jet Nanofluid Flow Subject to Lorentz Forces. Lubricants 2022, 10, 228. https://doi.org/10.3390/lubricants10100228
Khan U, Zaib A, Ishak A, Waini I, Raizah Z, Boonsatit N, Jirawattanapanit A, Galal AM. Significance of Thermophoretic Particle Deposition, Arrhenius Activation Energy and Chemical Reaction on the Dynamics of Wall Jet Nanofluid Flow Subject to Lorentz Forces. Lubricants. 2022; 10(10):228. https://doi.org/10.3390/lubricants10100228
Chicago/Turabian StyleKhan, Umair, Aurang Zaib, Anuar Ishak, Iskandar Waini, Zehba Raizah, Nattakan Boonsatit, Anuwat Jirawattanapanit, and Ahmed M. Galal. 2022. "Significance of Thermophoretic Particle Deposition, Arrhenius Activation Energy and Chemical Reaction on the Dynamics of Wall Jet Nanofluid Flow Subject to Lorentz Forces" Lubricants 10, no. 10: 228. https://doi.org/10.3390/lubricants10100228
APA StyleKhan, U., Zaib, A., Ishak, A., Waini, I., Raizah, Z., Boonsatit, N., Jirawattanapanit, A., & Galal, A. M. (2022). Significance of Thermophoretic Particle Deposition, Arrhenius Activation Energy and Chemical Reaction on the Dynamics of Wall Jet Nanofluid Flow Subject to Lorentz Forces. Lubricants, 10(10), 228. https://doi.org/10.3390/lubricants10100228