Asteroseismic Analysis of δ Scuti Components of Binary Systems: The Case of KIC 8504570


Abstract
1. Introduction
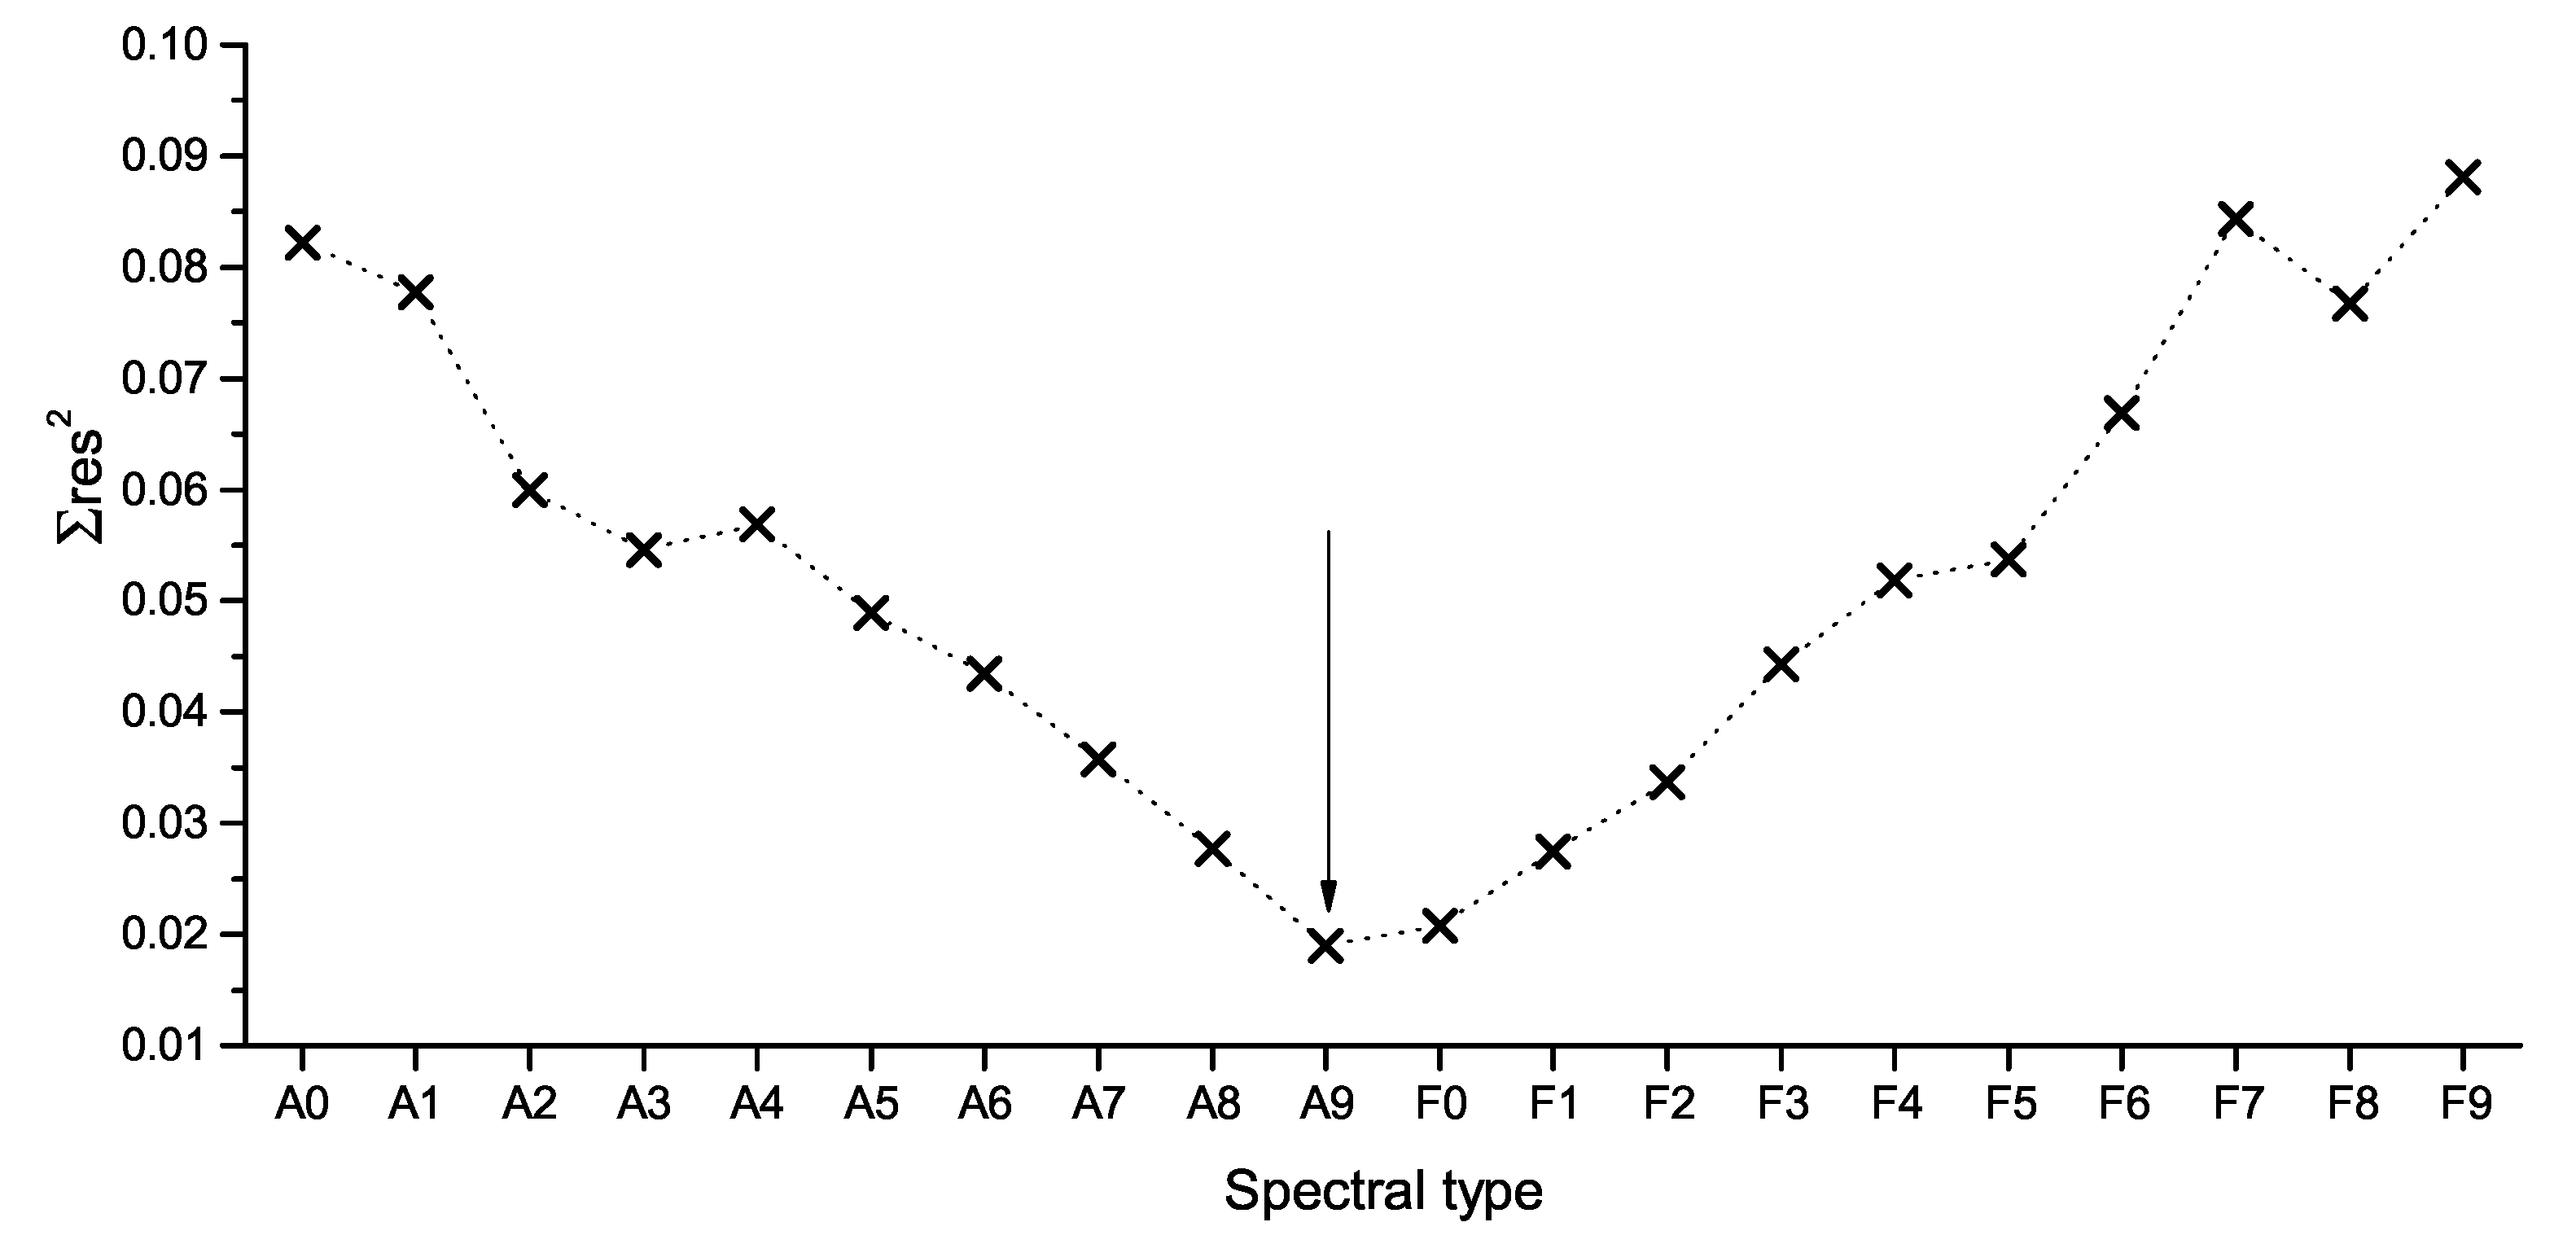
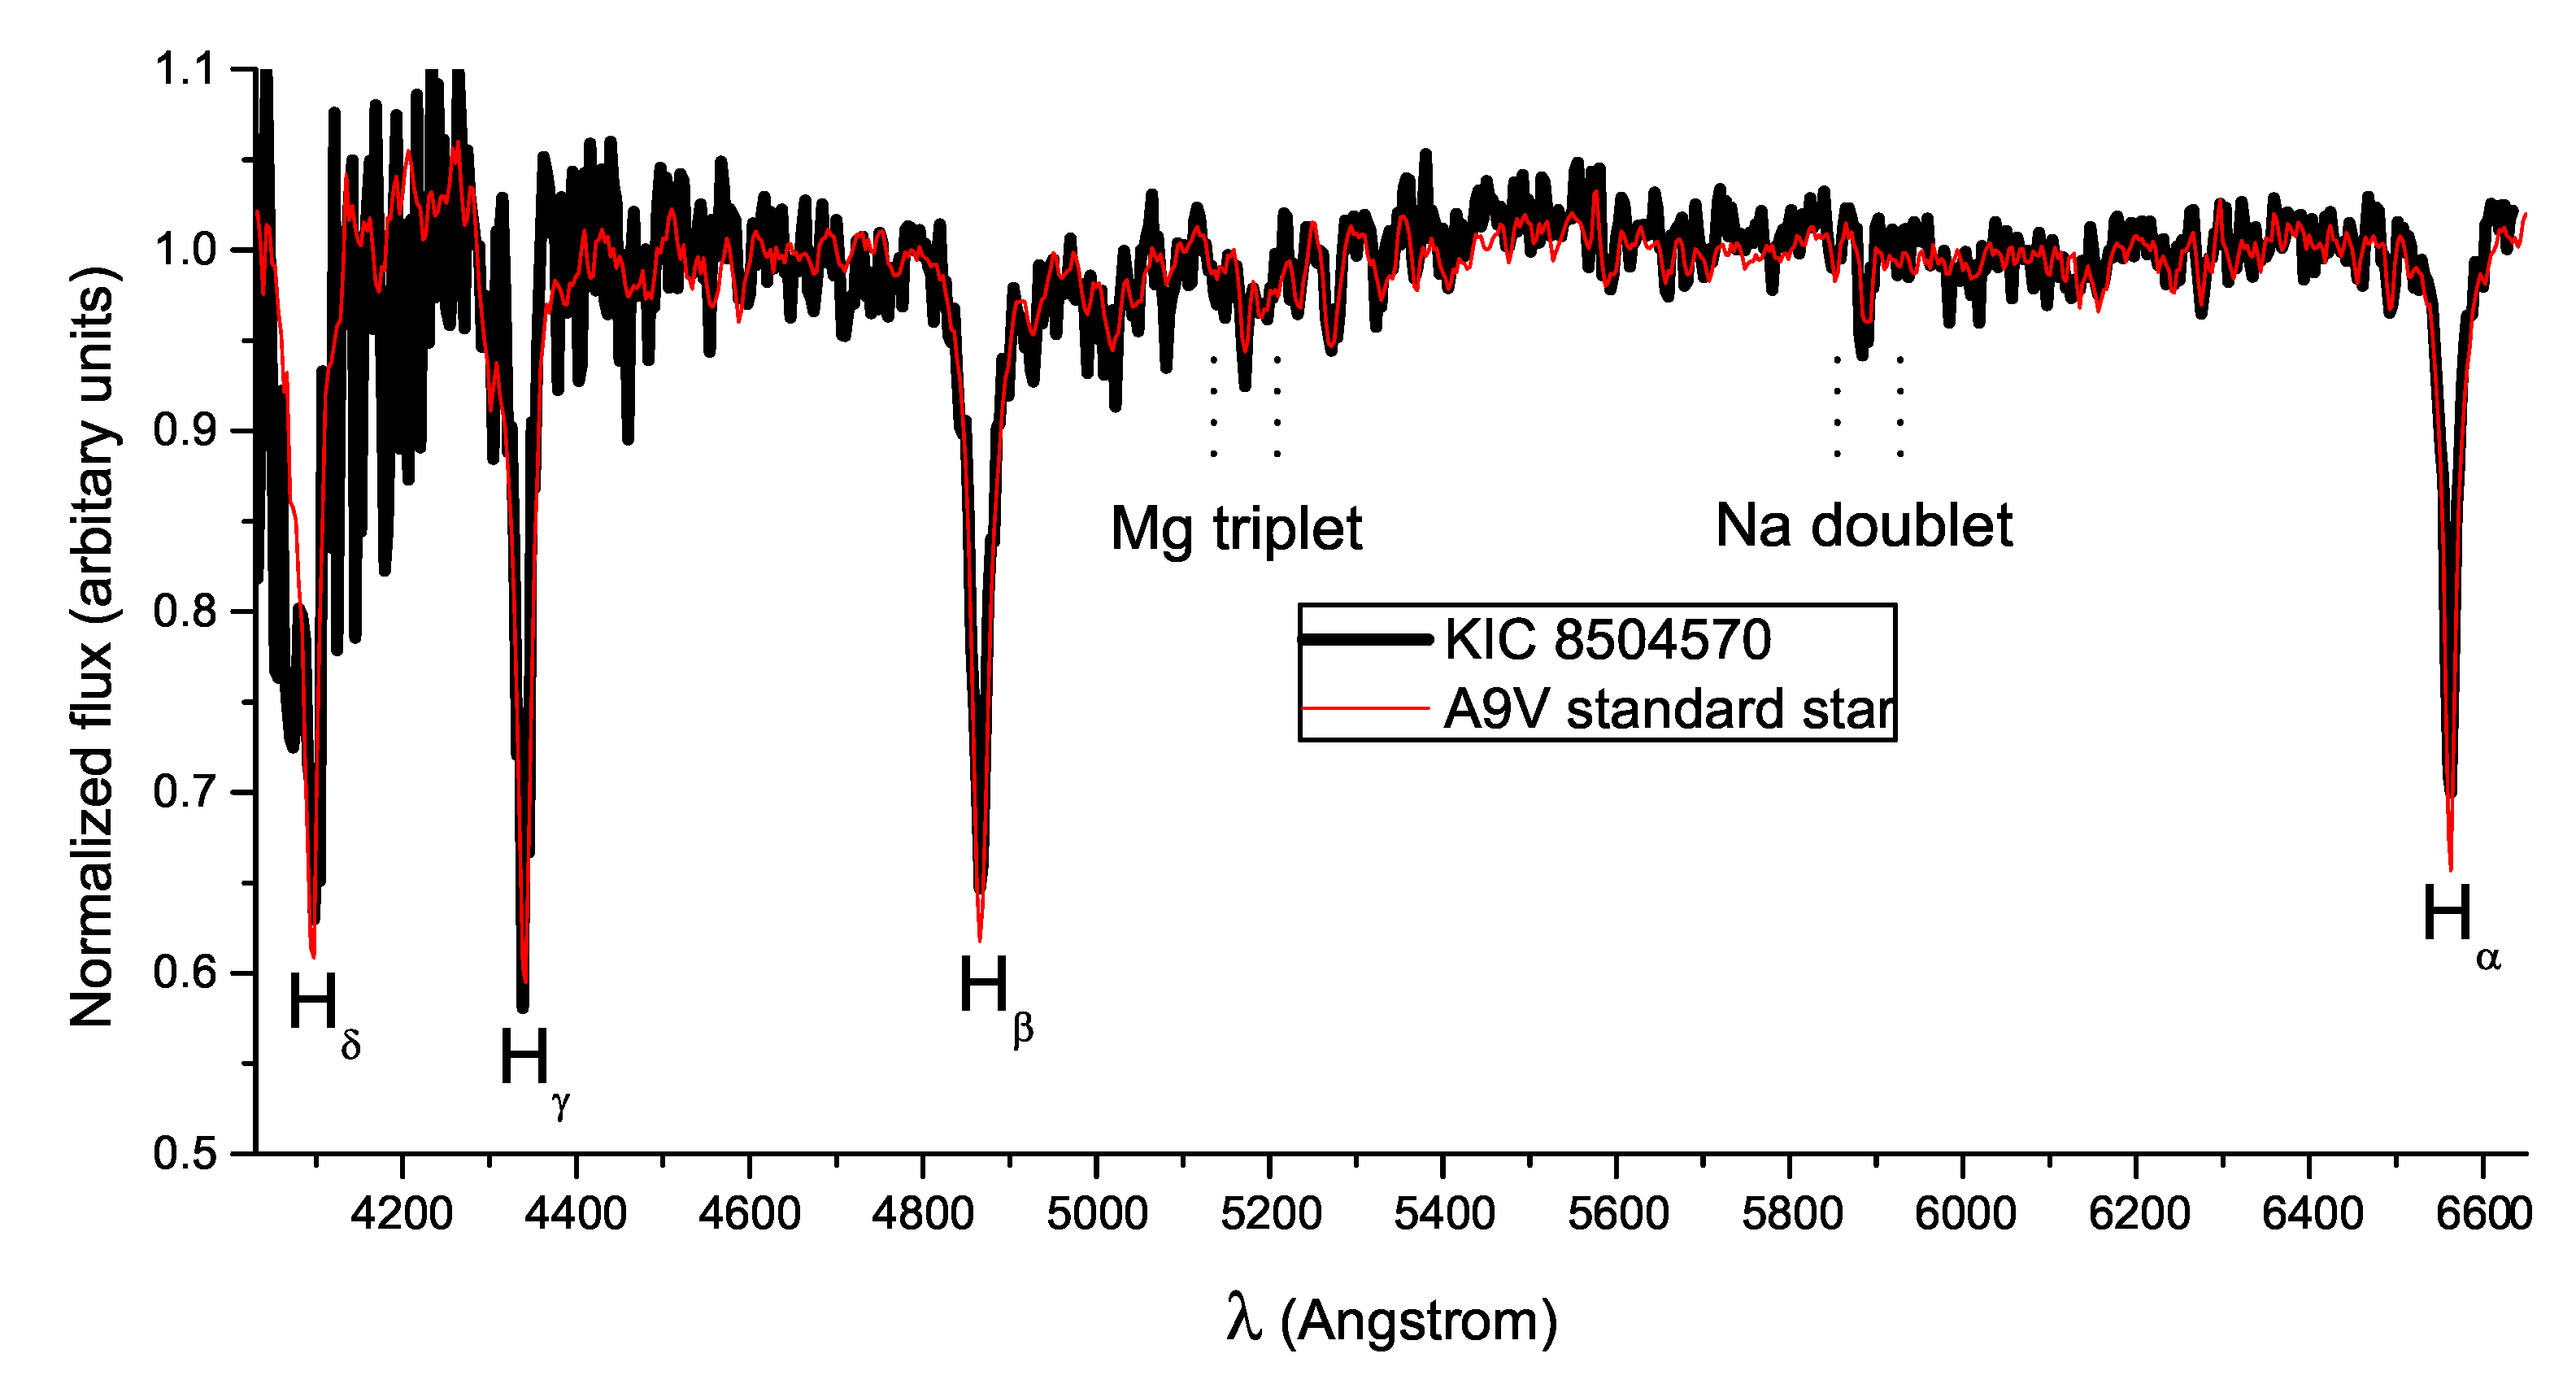
2. Spectroscopy
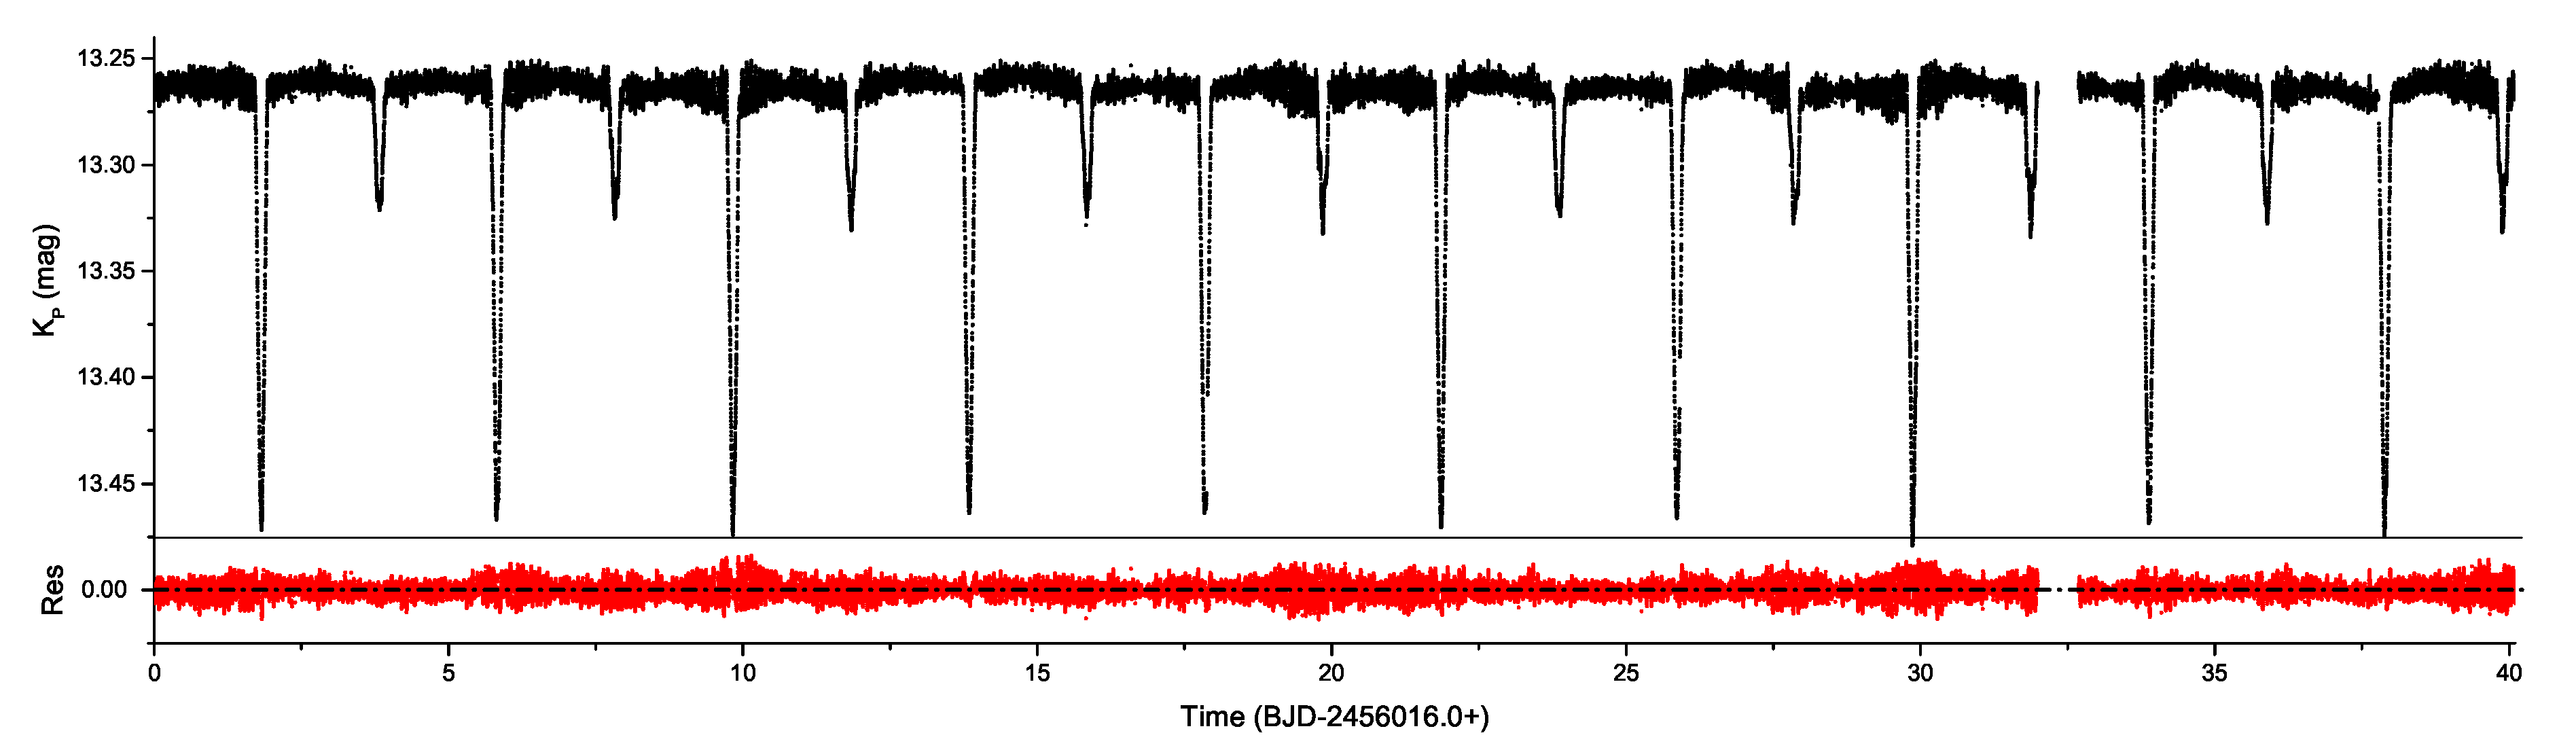
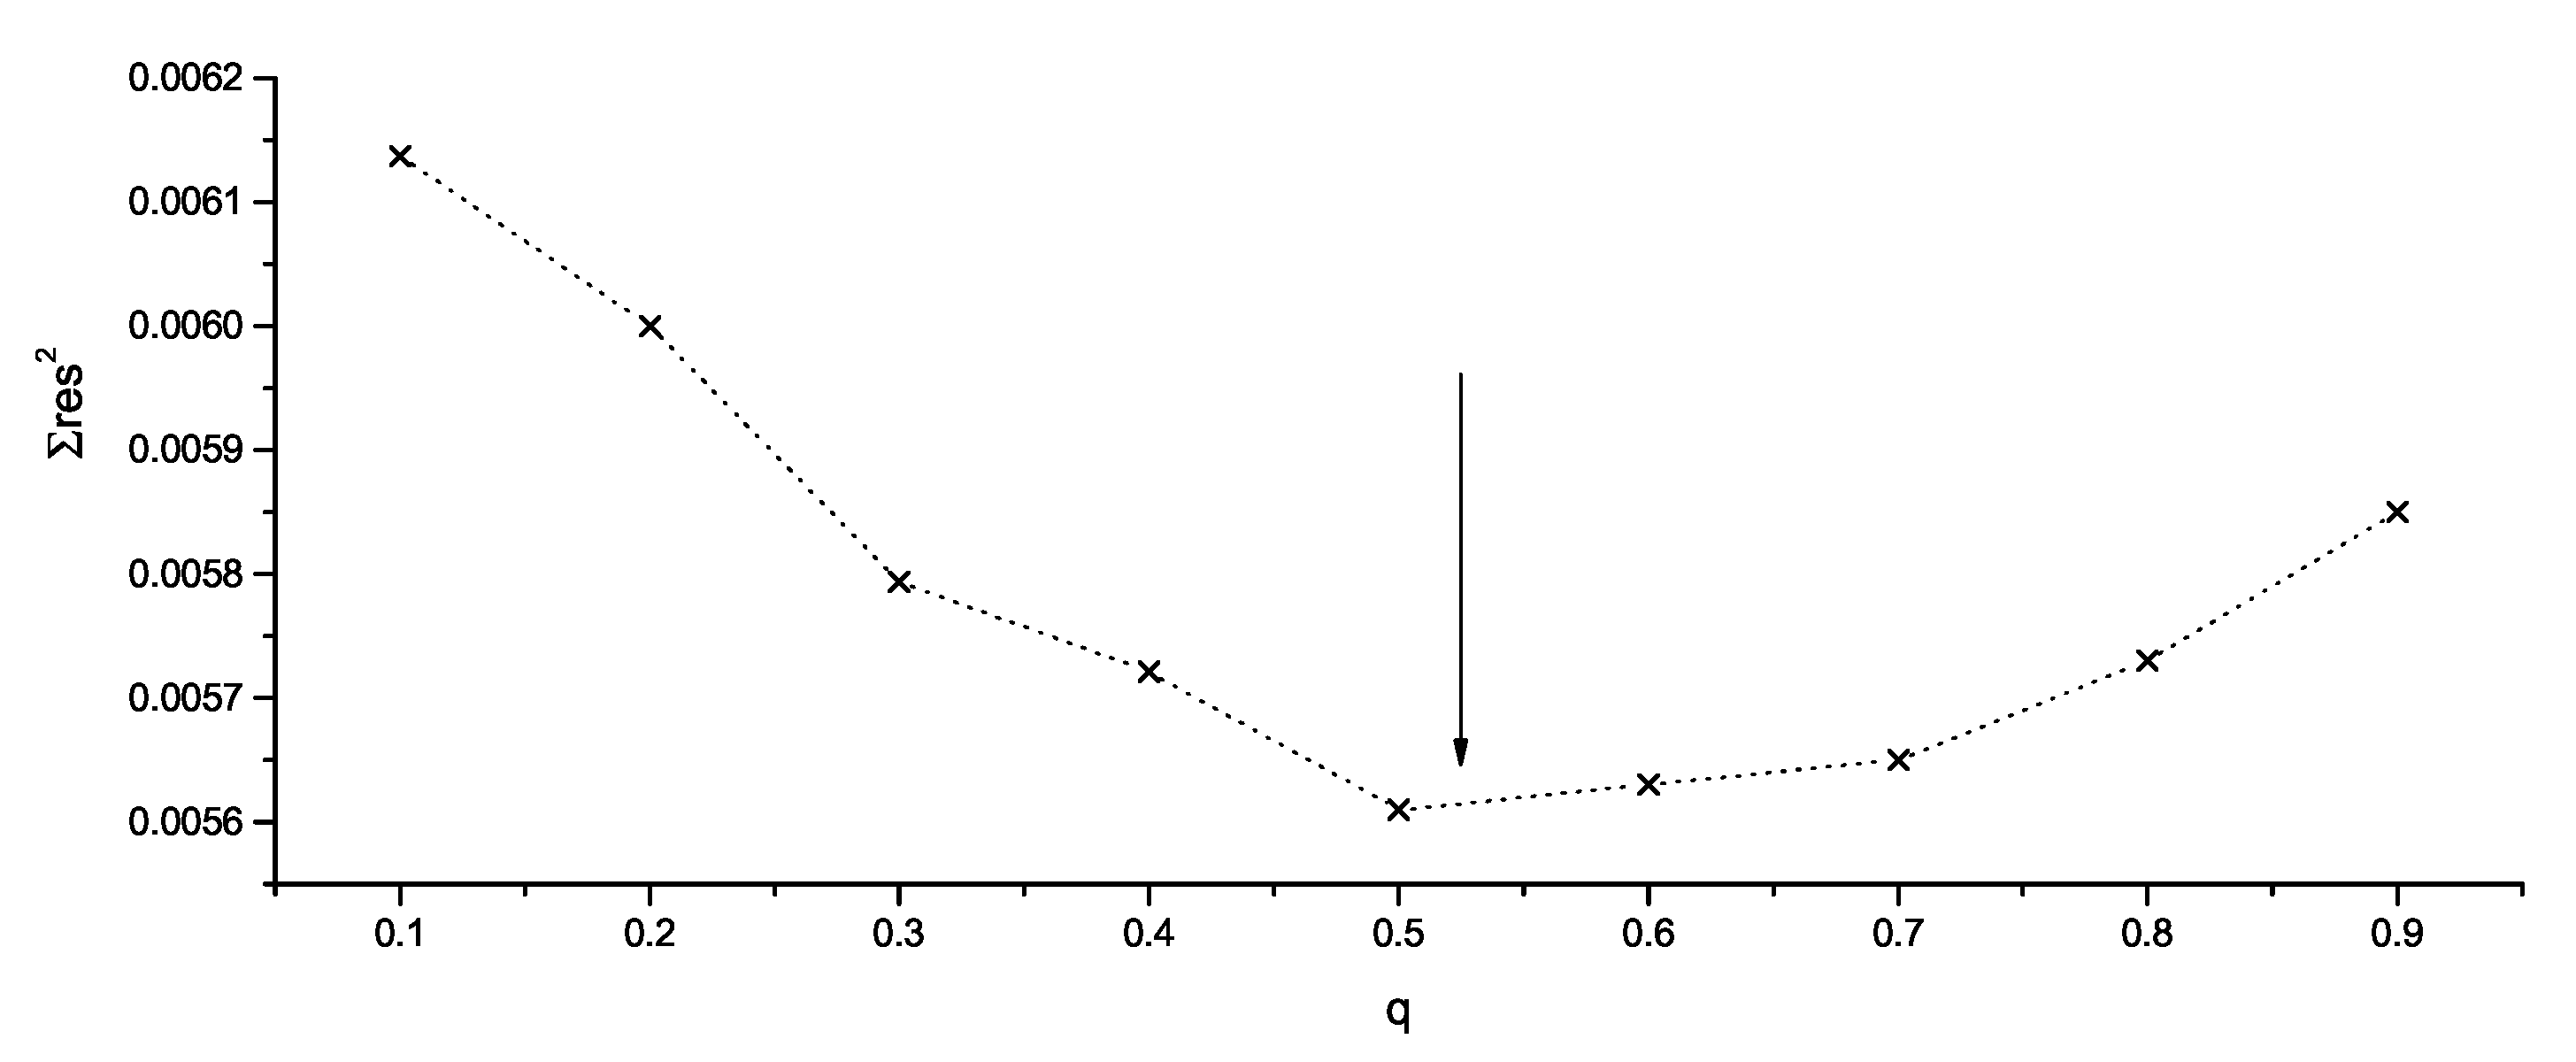
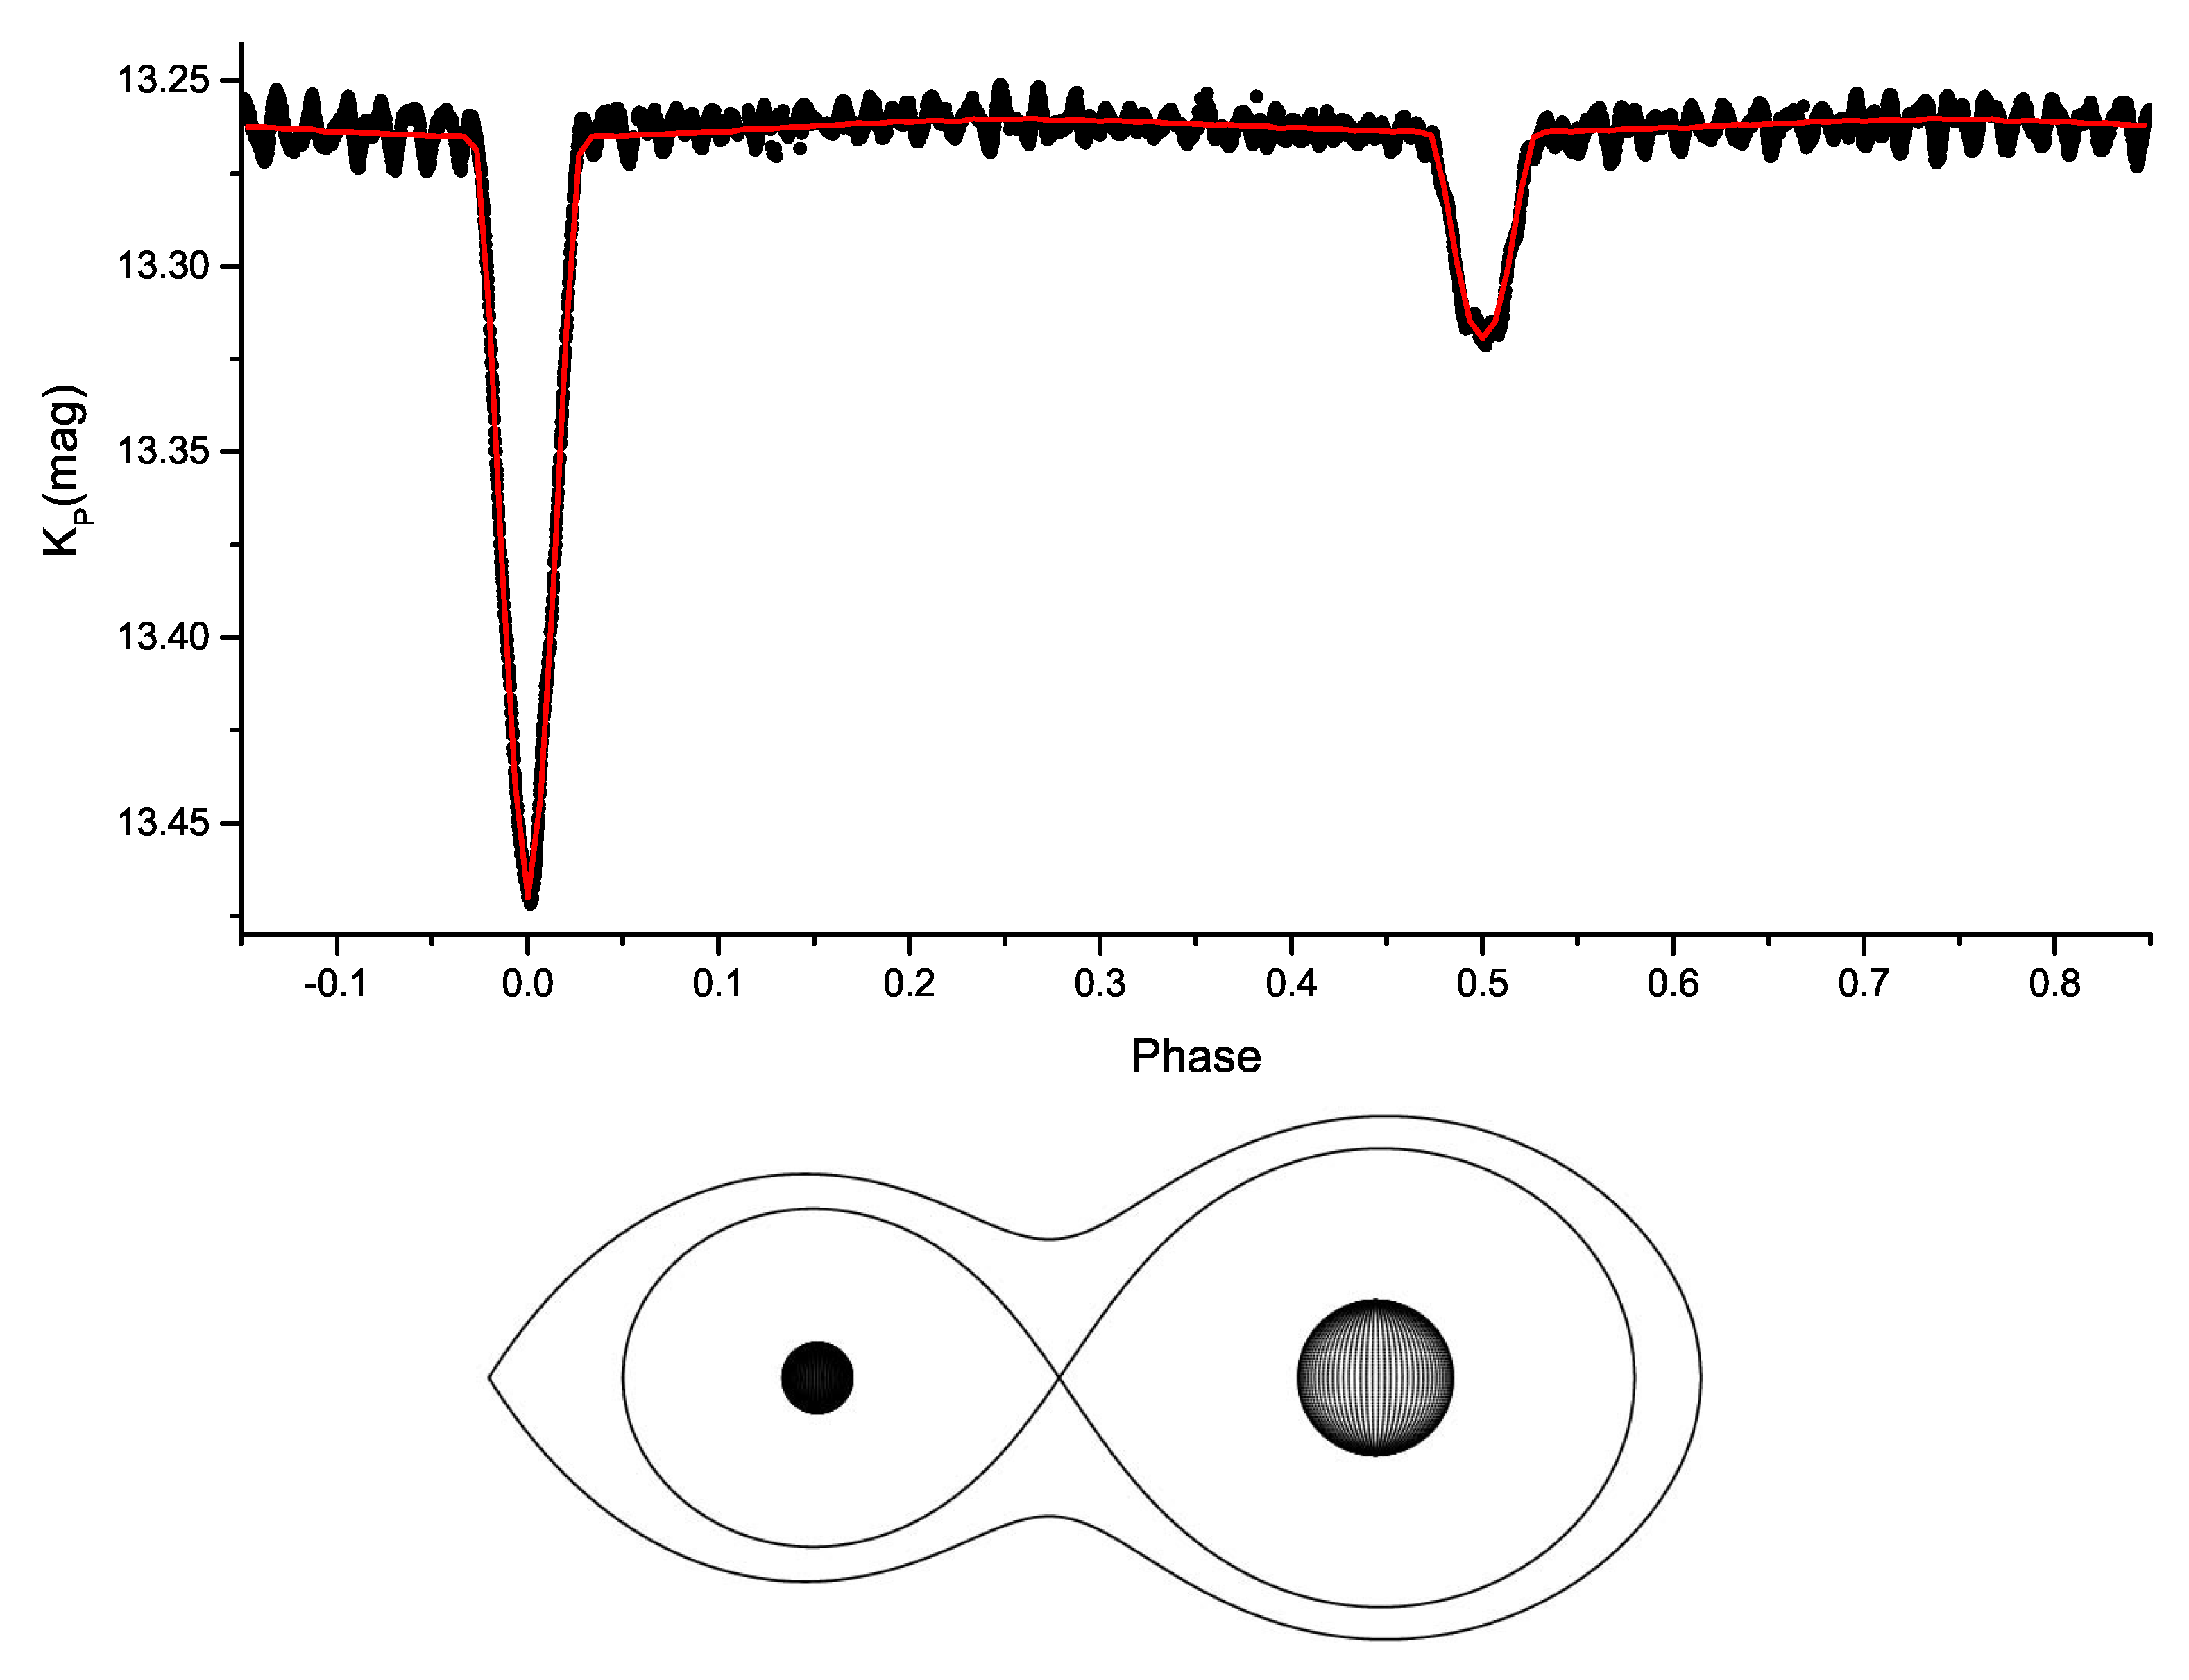
3. Light Curve Modelling and Absolute Parameter Calculations
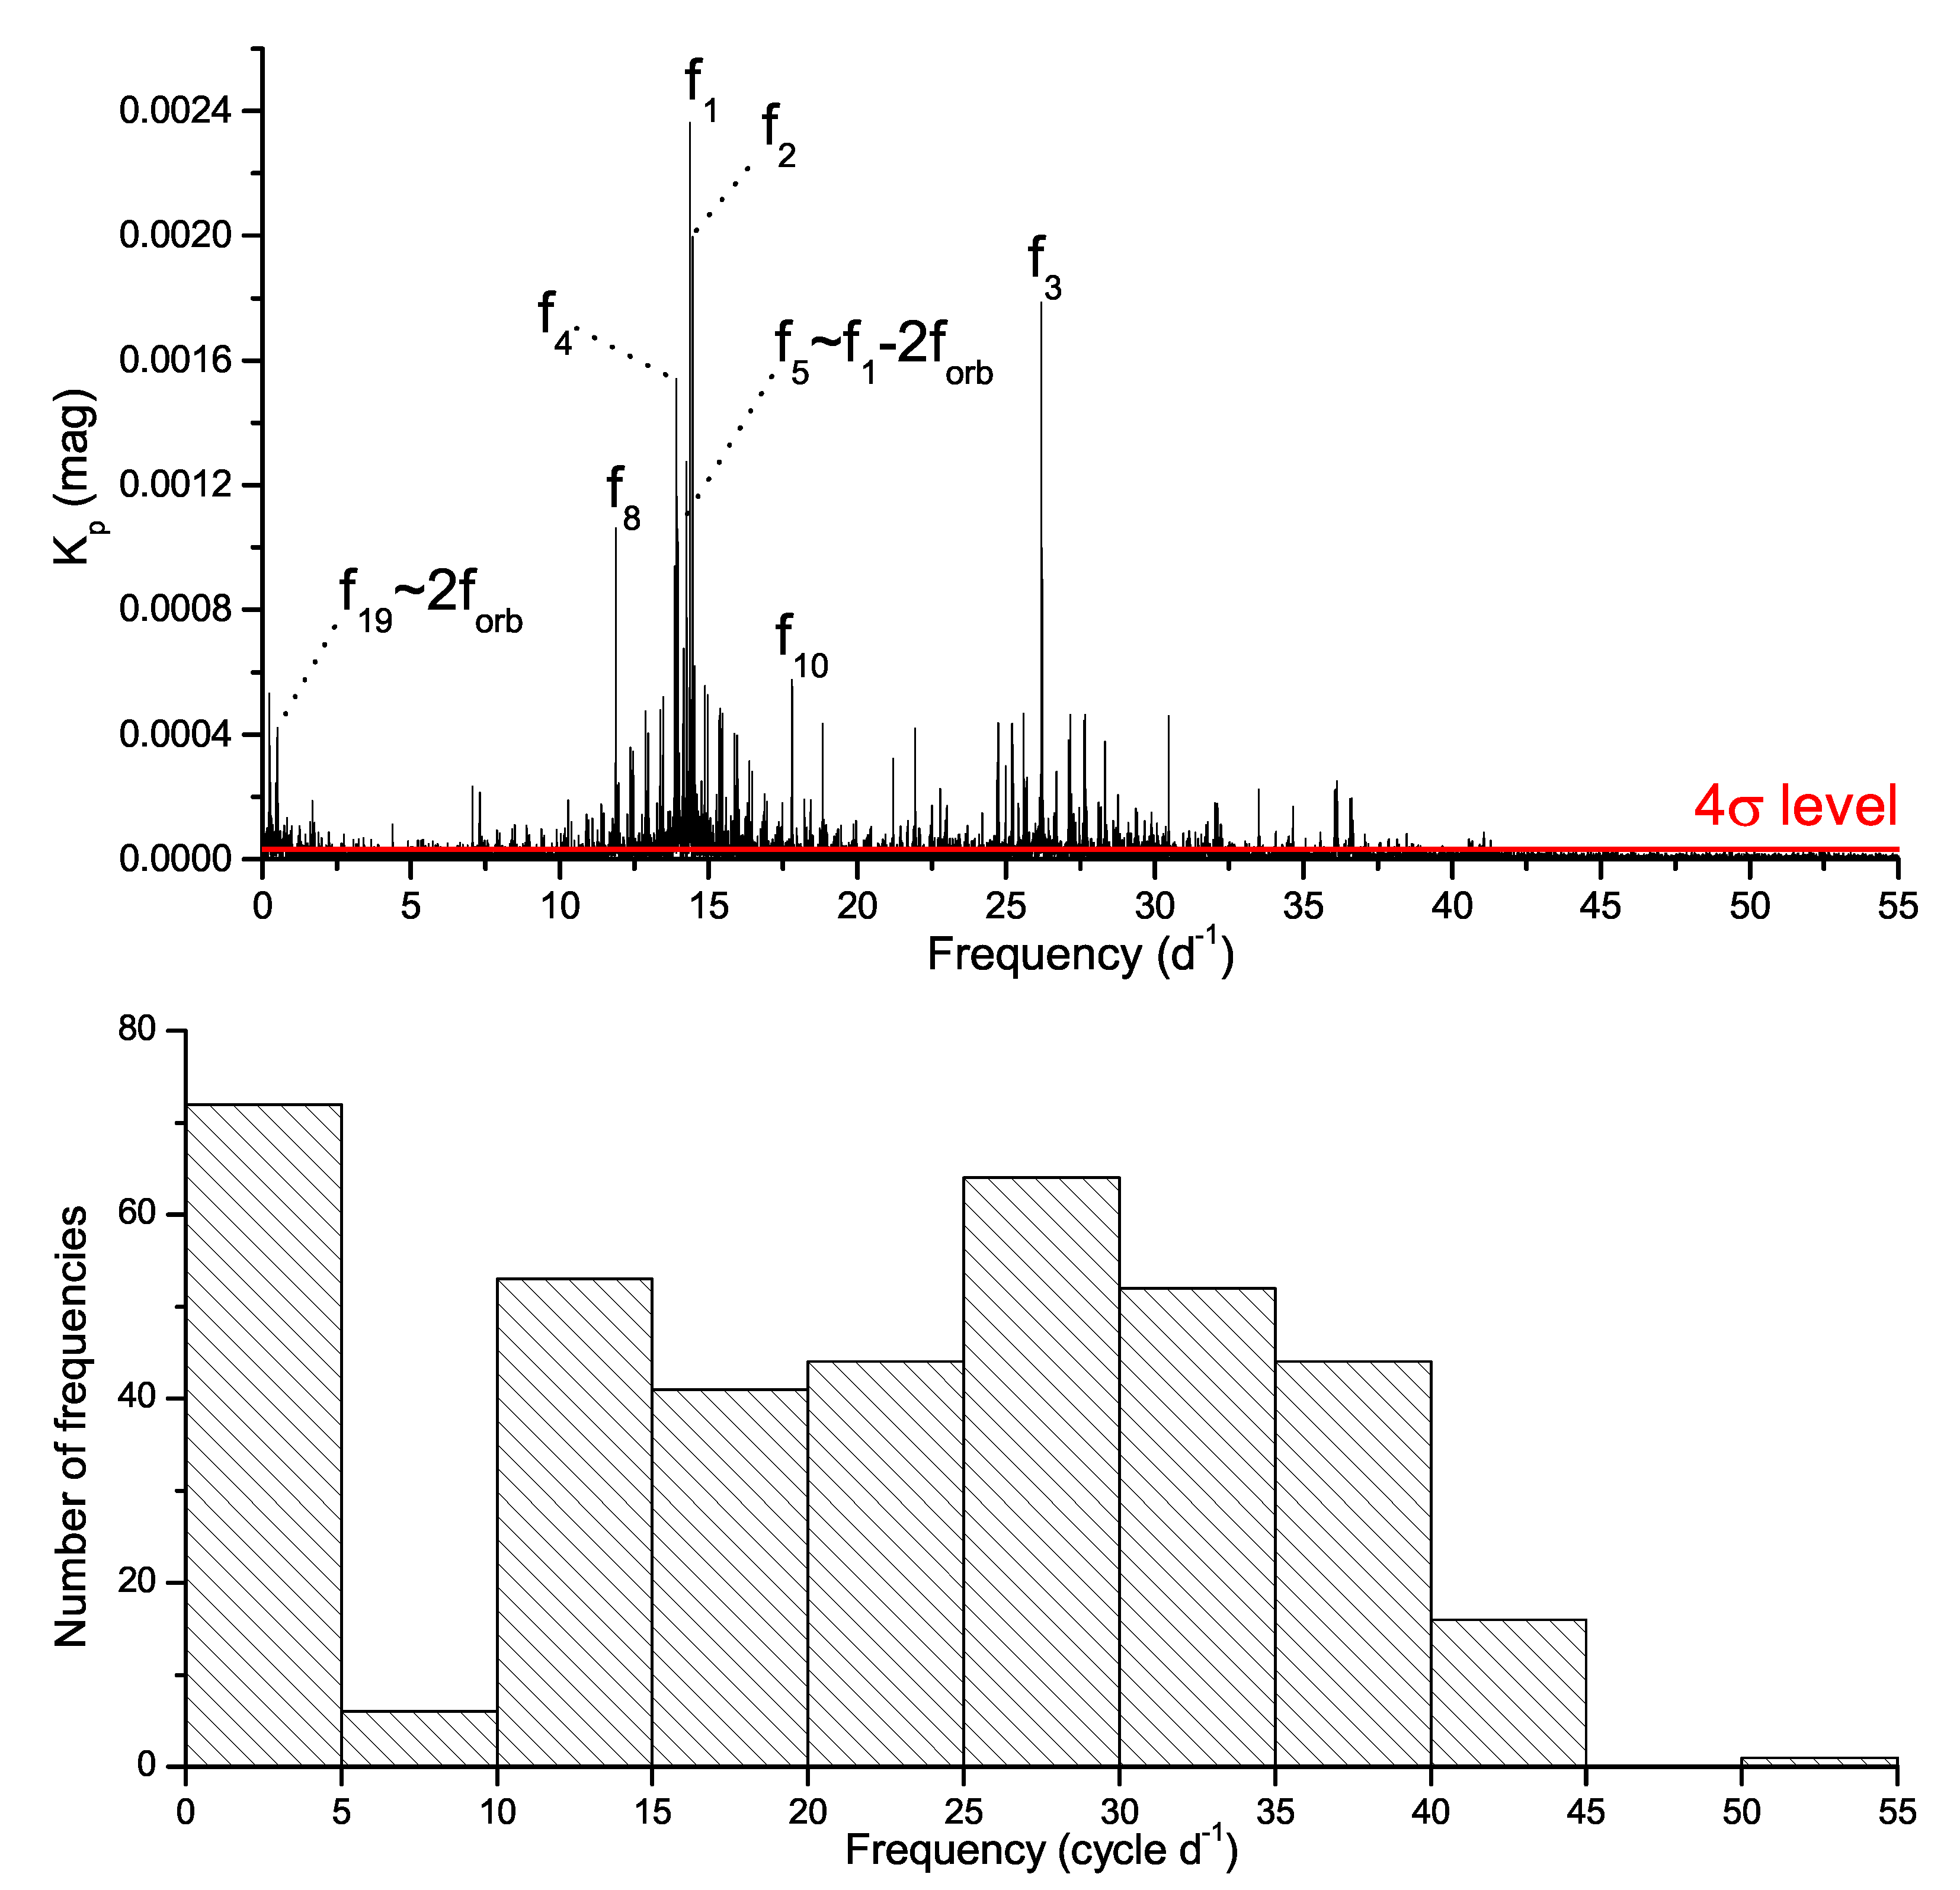
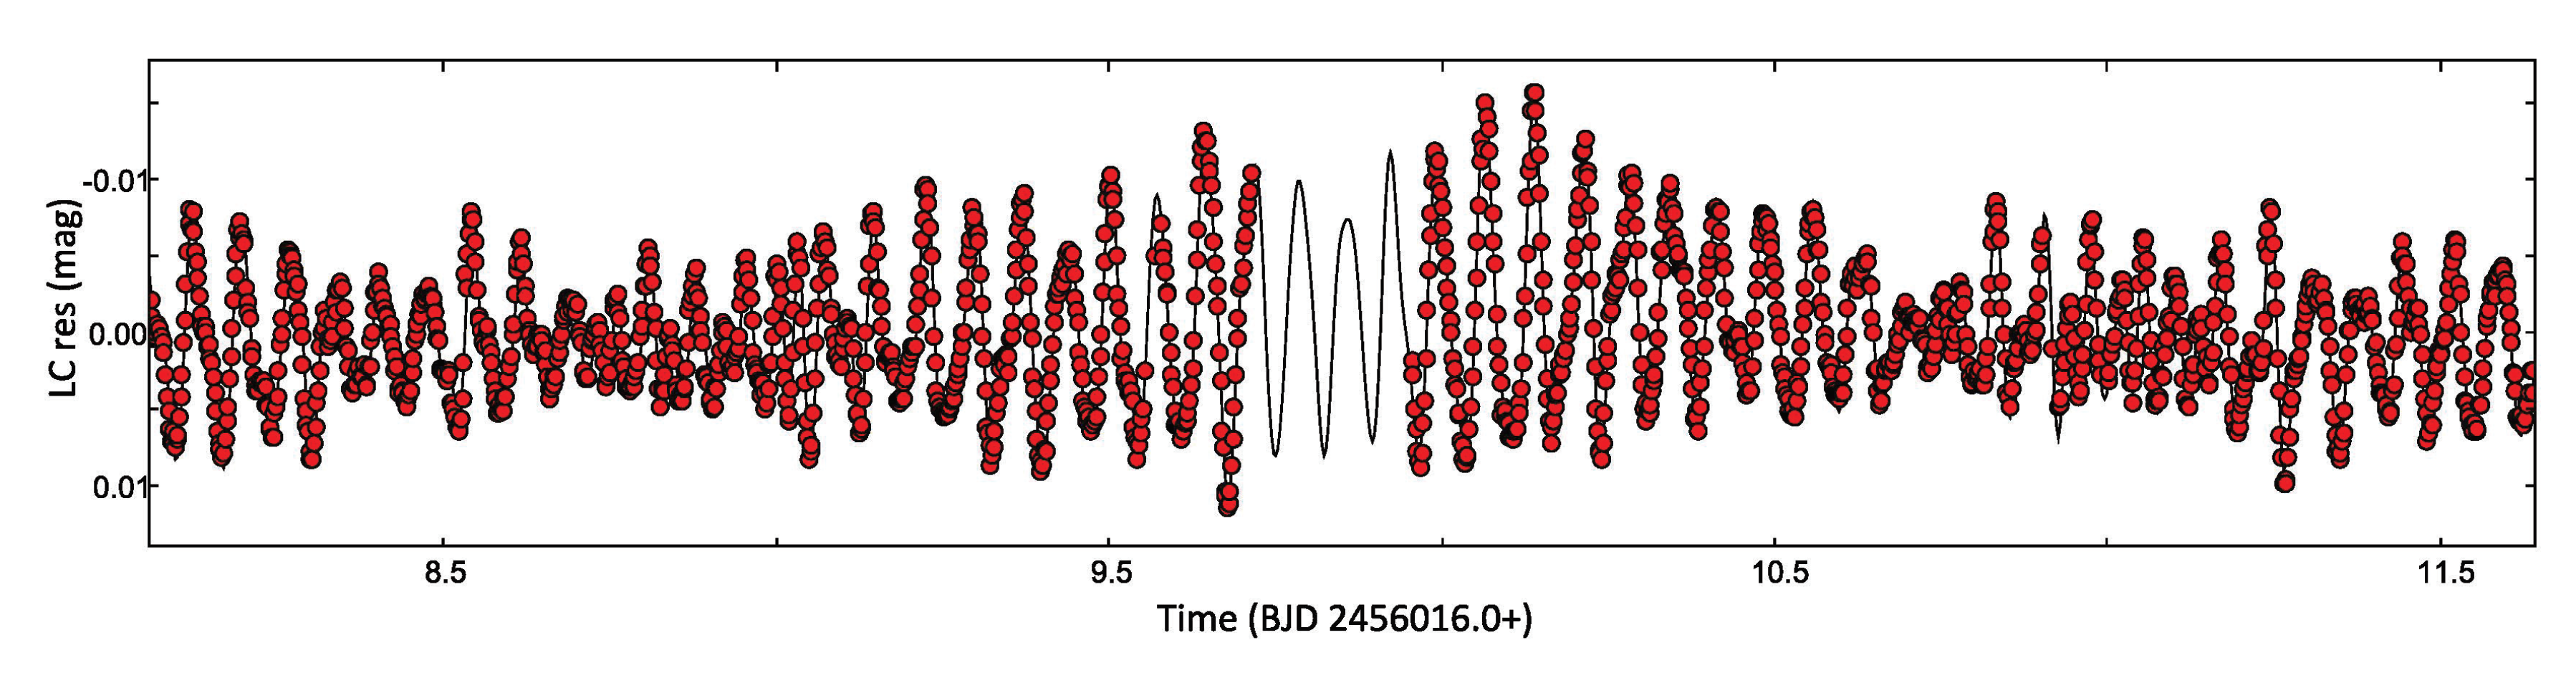
4. Pulsation Modelling
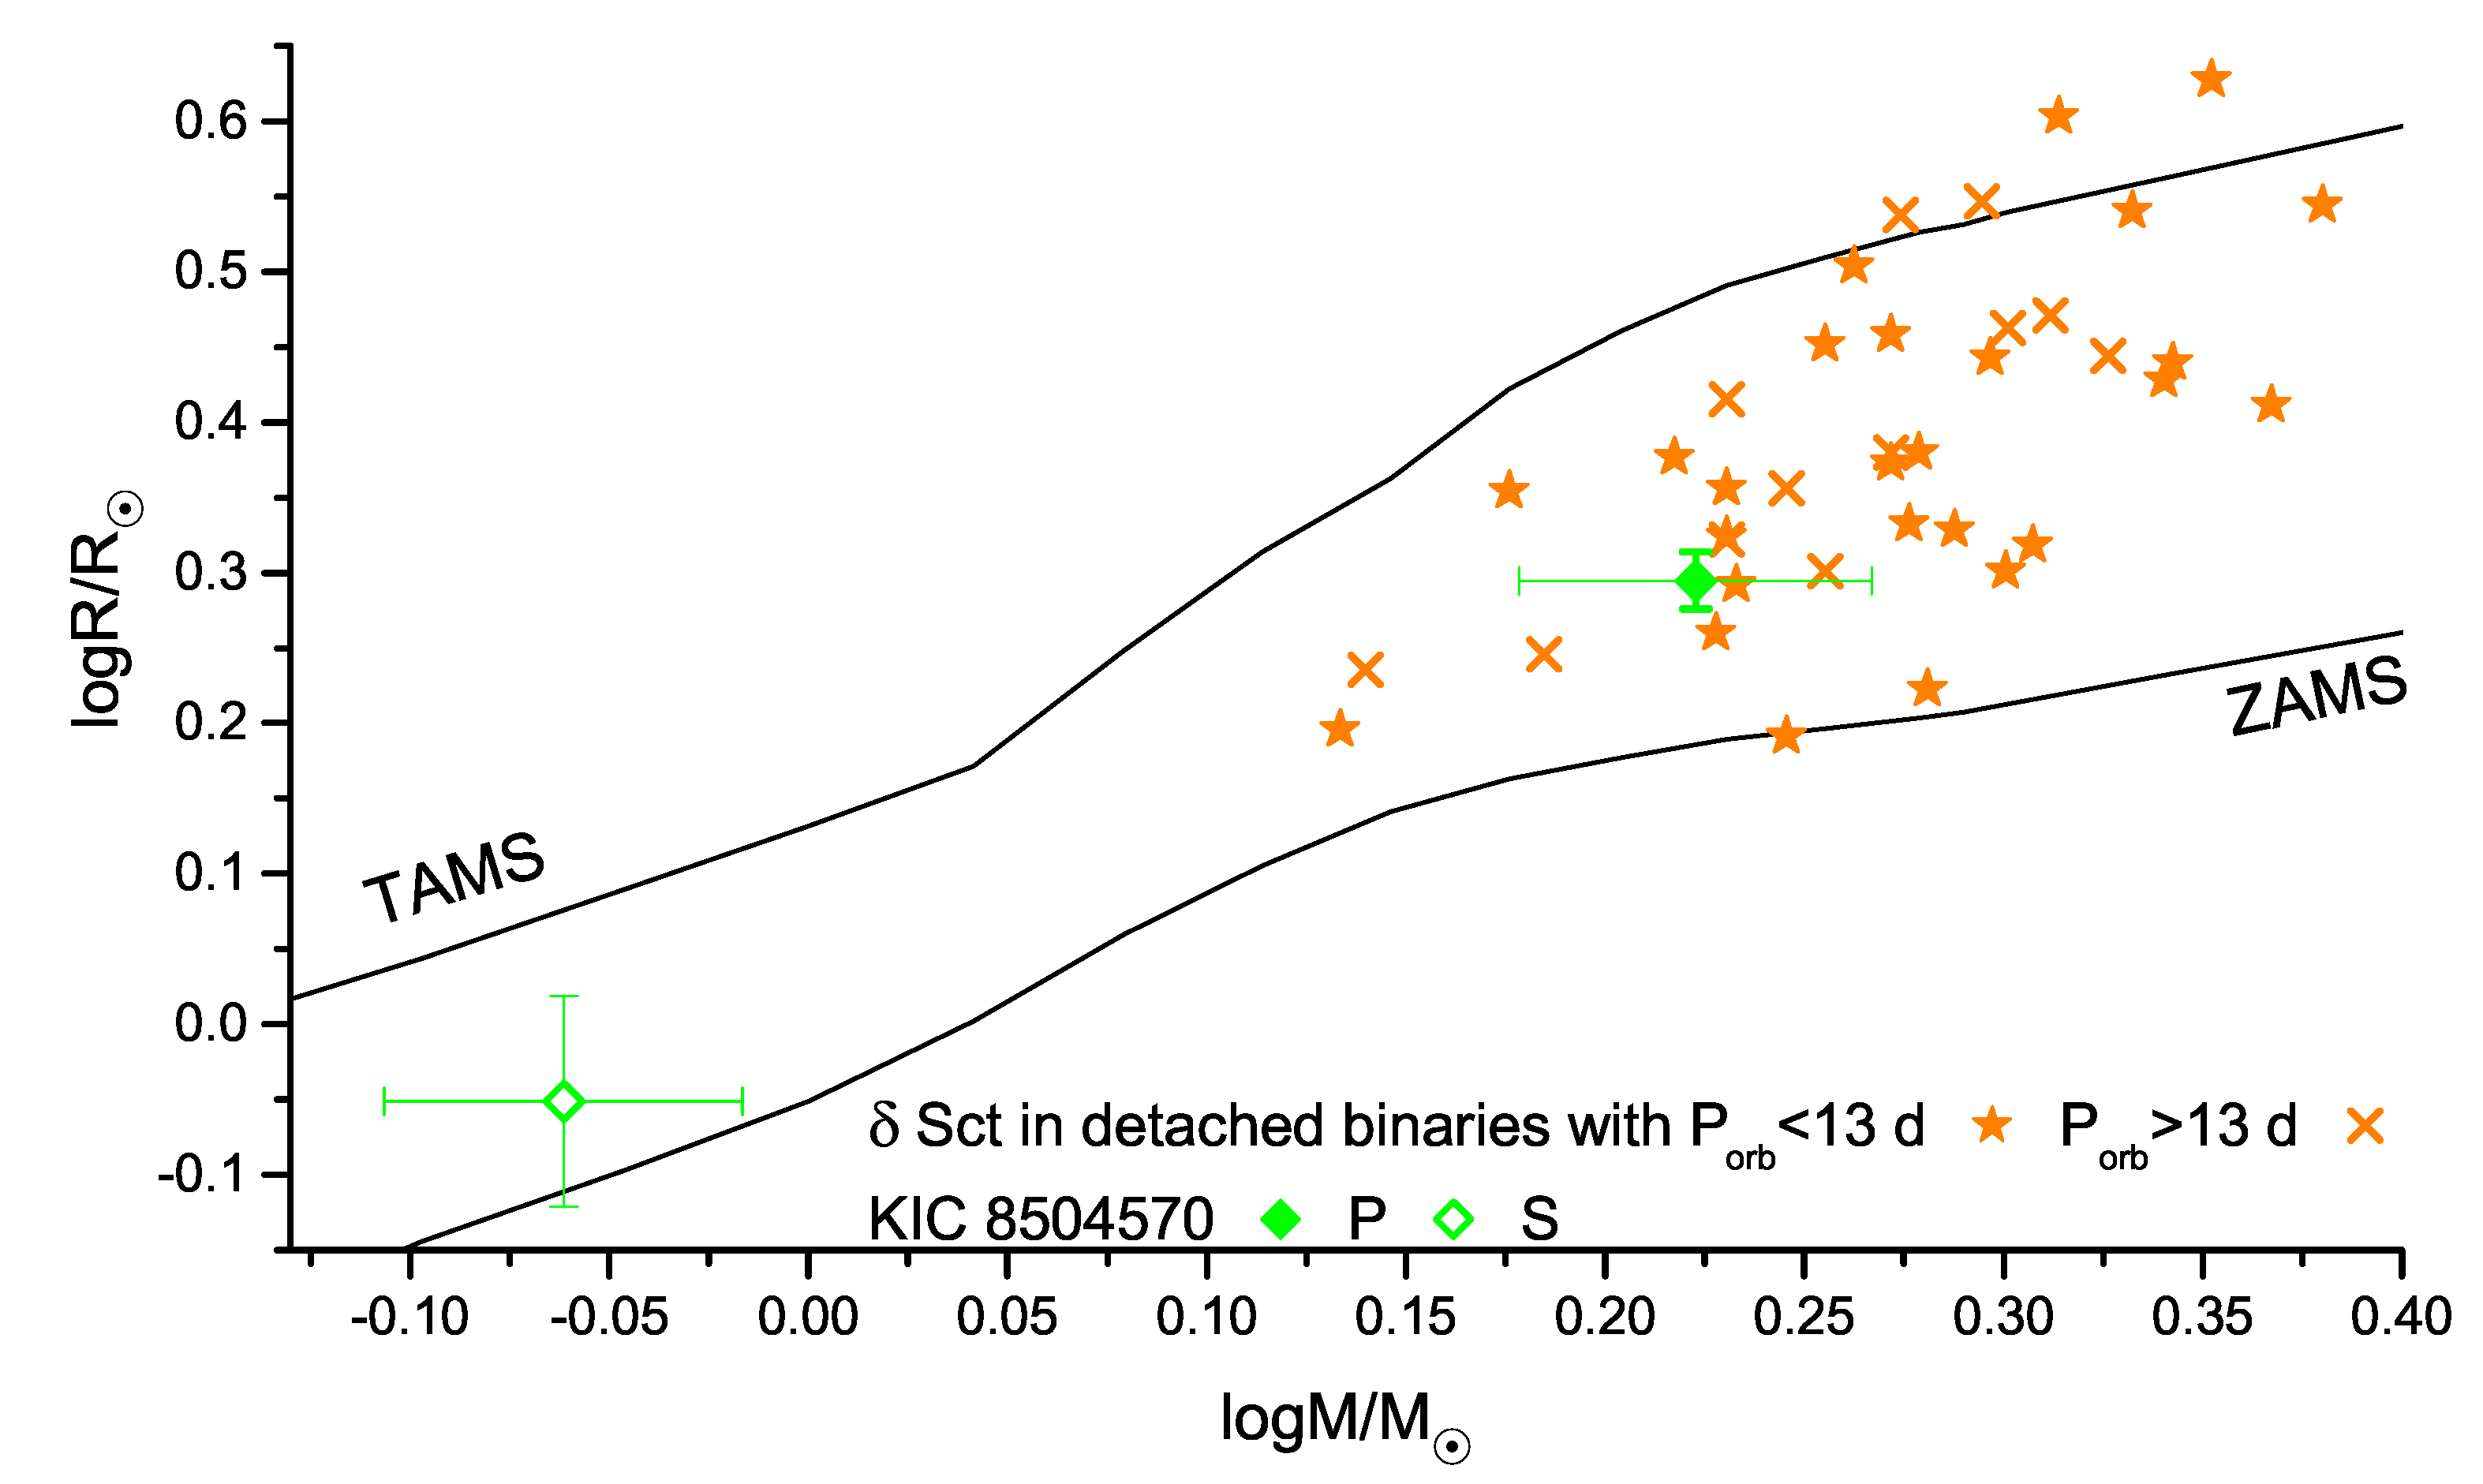
5. Summary, Discussion and Conclusions
Author Contributions
Funding
Acknowledgments
Conflicts of Interest
Abbreviations
| BJD | Barycentric Julian date |
| EB | Eclipsing binary system |
| ETV | Eclipse timing variations |
| KEBC | Kepler Eelipsing binary catalogue |
| KIC | Kepler input catalogue |
| LC | Light curve |
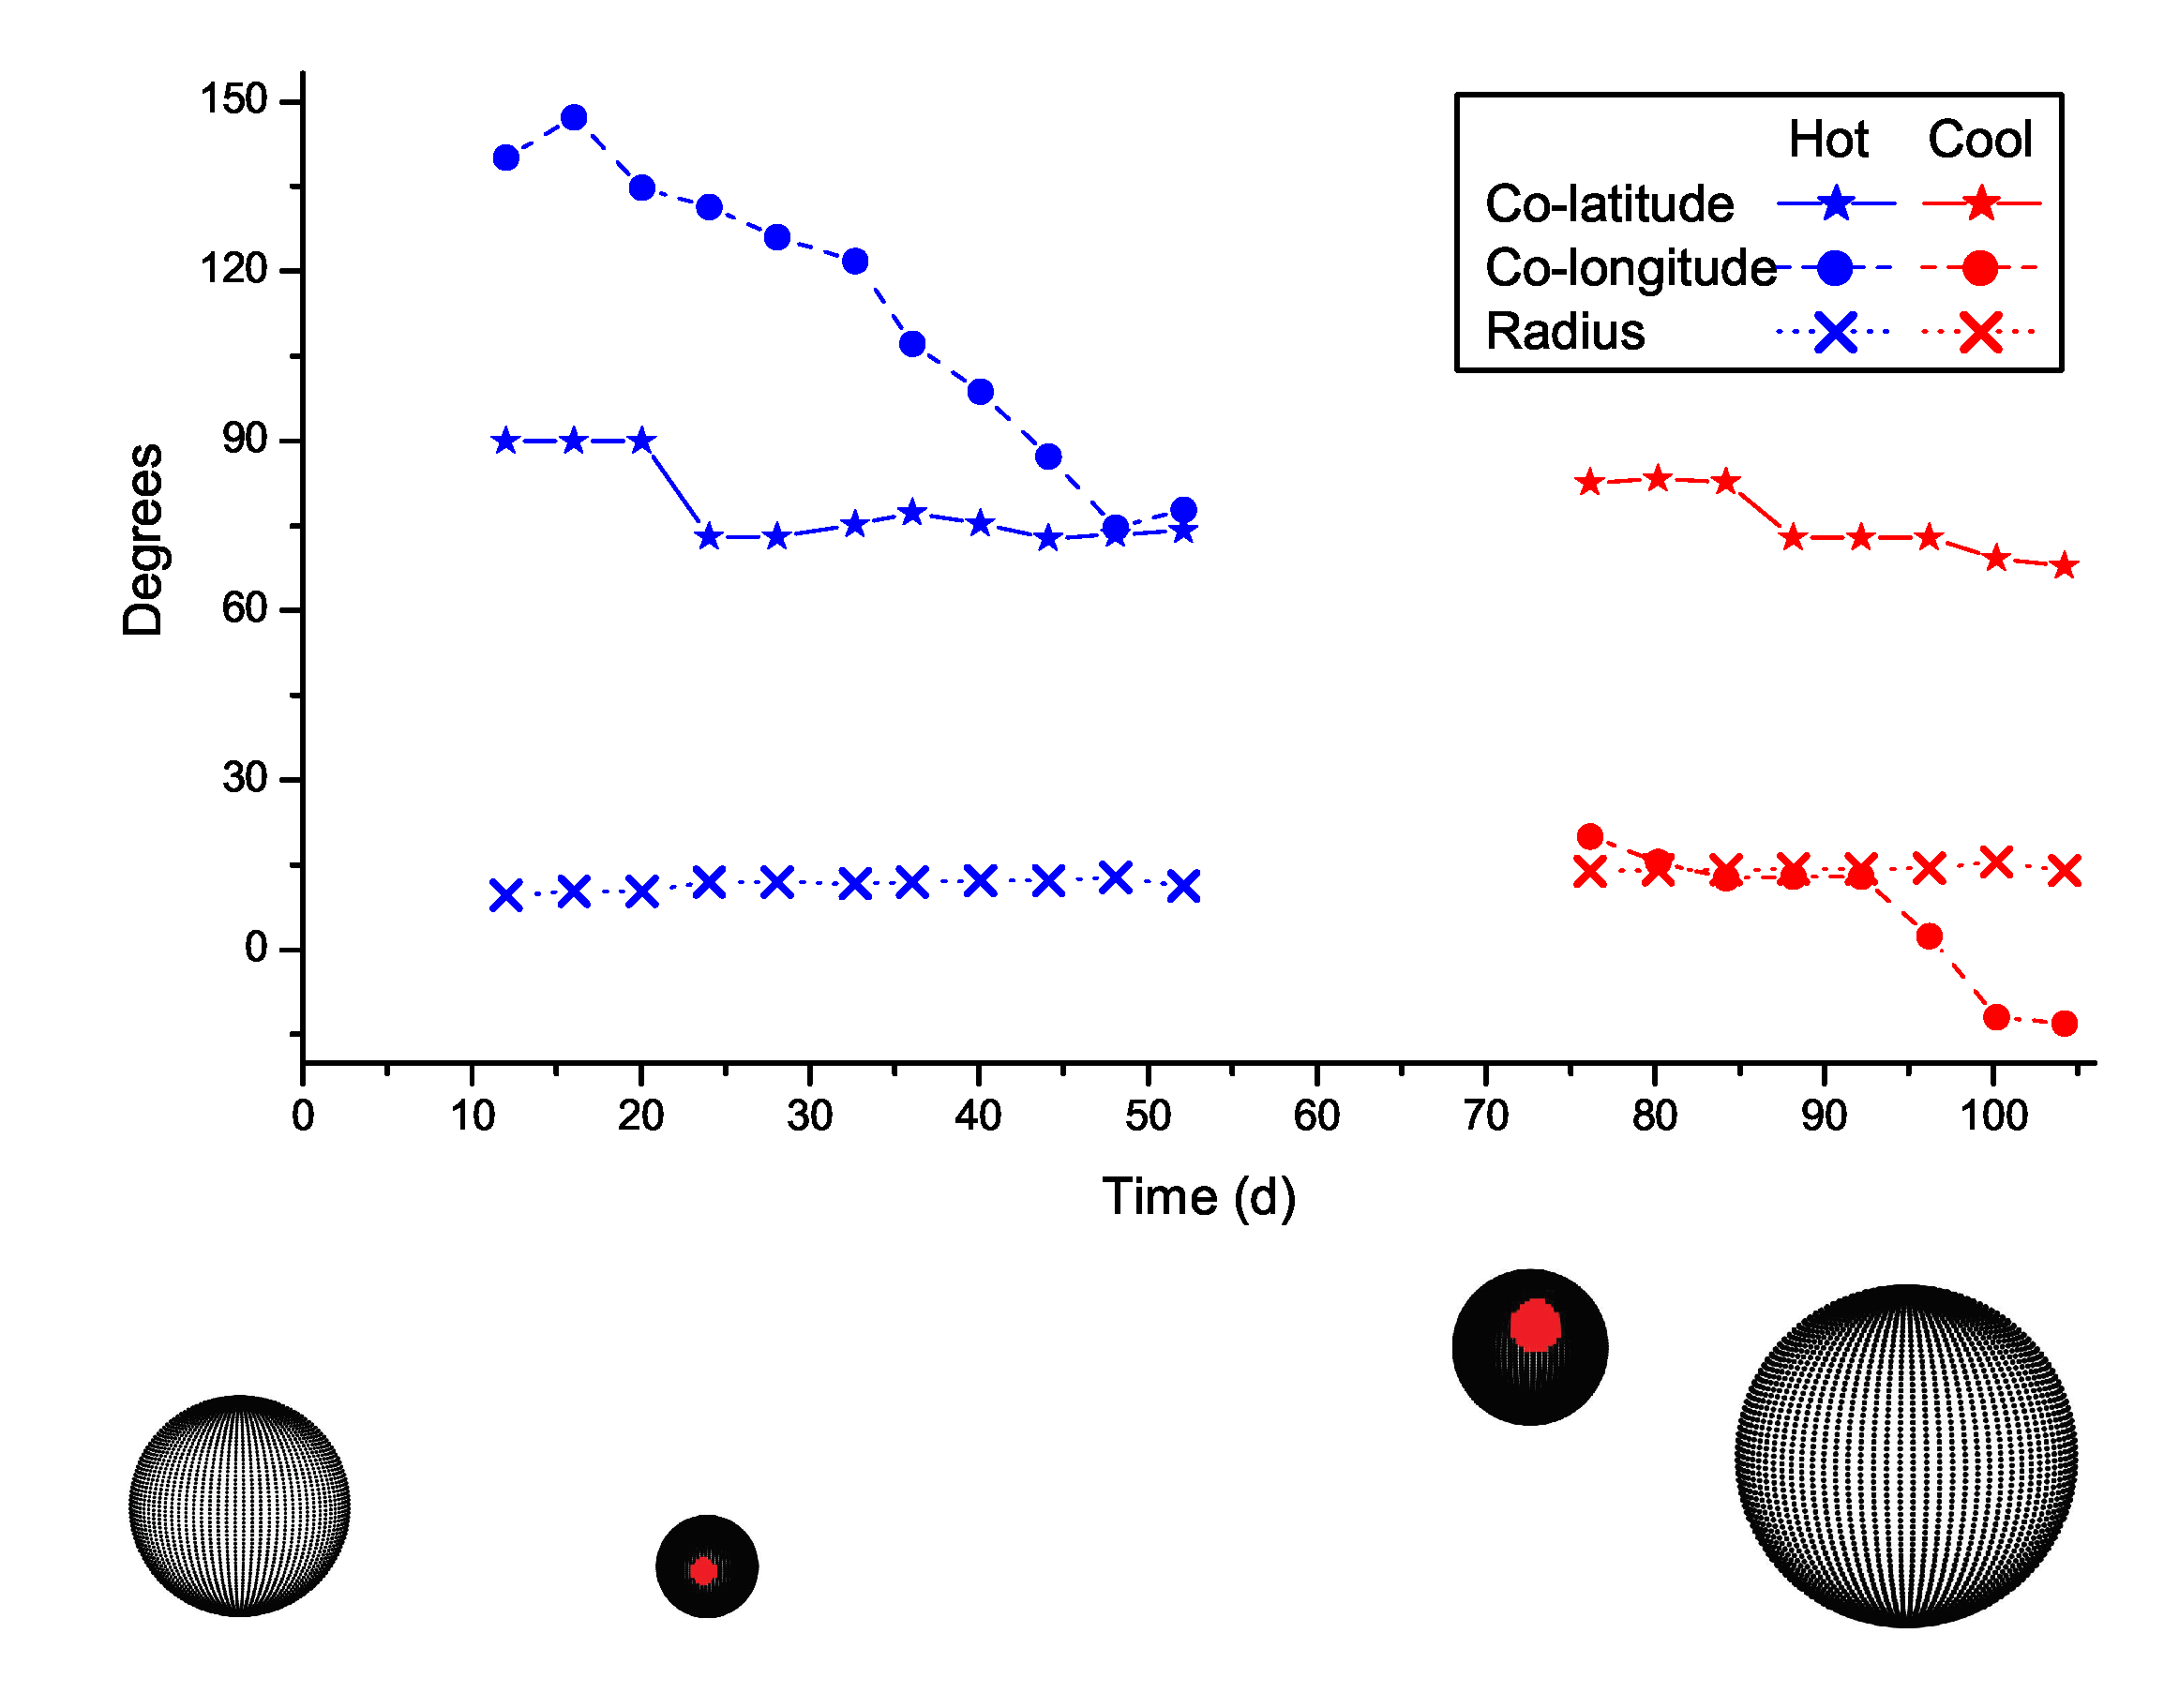
Appendix A. Spot Migration

| Time | Colat. | long. | Radius | Tf () | Time | Colat. | long. | Radius | Tf () |
|---|---|---|---|---|---|---|---|---|---|
| (BJD 2456016.0+) | () | () | () | (BJD 2456016.0+) | () | () | () | ||
| 12.04 | 90(6) | 140(6) | 10(2) | 1.18(5) | 52.12 | 74(6) | 78(6) | 11(2) | 1.09(4) |
| 16.05 | 90(5) | 147(5) | 10(1) | 1.25(2) | 76.16 | 83(2) | 20(4) | 14(1) | 0.81(6) |
| 20.05 | 90(6) | 135(6) | 10(2) | 1.25(4) | 80.17 | 83(2) | 16(1) | 14(1) | 0.72(12) |
| 24.06 | 73(5) | 131(5) | 12(1) | 1.24(2) | 84.18 | 83(1) | 13(2) | 14(1) | 0.69(16) |
| 28.07 | 73(5) | 126(5) | 12(1) | 1.24(3) | 88.19 | 73(2) | 13(2) | 14(1) | 0.65(11) |
| 32.69 | 75(3) | 122(2) | 12(1) | 1.27(4) | 92.19 | 73(1) | 13(2) | 14(1) | 0.64(11) |
| 36.08 | 77(1) | 107(3) | 12(1) | 1.25(4) | 96.20 | 73(4) | 2(4) | 14(4) | 0.57(8) |
| 40.09 | 75(2) | 99(3) | 12(1) | 1.22(5) | 100.21 | 69(3) | −12(2) | 15(3) | 0.77(5) |
| 44.10 | 73(9) | 87(5) | 12(1) | 1.17(4) | 104.22 | 68(5) | −13(5) | 14(5) | 0.76(11) |
| 48.11 | 73(8) | 75(7) | 13(1) | 1.17(2) |

Appendix B. Combination Frequencies
| i | A | S/N | Combination | i | A | S/N | Combination | ||||
|---|---|---|---|---|---|---|---|---|---|---|---|
| (d) | (mmag) | () | (d) | (mmag) | () | ||||||
| 5 | 13.96772(2) | 1.462(5) | 25.8(2) | 194.5 | 44 | 15.81073(12) | 0.195(5) | 172.1(1.3) | 26 | + | |
| 6 | 14.26173(2) | 1.197(5) | 127.1(2) | 159.2 | + | 45 | 0.46827(12) | 0.193(5) | 315.2(1.4) | 25.7 | |
| 7 | 13.87519(2) | 1.187(5) | 304.5(2) | 158 | + | 46 | 14.30447(12) | 0.191(5) | 262.1(1.4) | 25.4 | |
| 9 | 14.15746(4) | 0.620(5) | 84.7(4) | 82.6 | + | 47 | 18.43246(13) | 0.190(5) | 331.8(1.4) | 25.3 | + |
| 11 | 14.52475(4) | 0.556(5) | 315.2(5) | 74 | + | 48 | 18.21829(13) | 0.188(5) | 159.1(1.4) | 25 | |
| 12 | 0.23719(4) | 0.539(5) | 127.8(5) | 71.7 | 49 | 10.27324(13) | 0.184(5) | 131.9(1.4) | 24.5 | ||
| 13 | 25.59738(5) | 0.467(5) | 196.9(6) | 62.1 | + | 50 | 25.41796(13) | 0.180(5) | 185.4(1.5) | 23.9 | + |
| 14 | 27.16046(5) | 0.469(5) | 134.7(6) | 62.3 | 51 | 13.41866(14) | 0.176(5) | 265.4(1.5) | 23.4 | ||
| 15 | 30.46276(5) | 0.464(5) | 153.0(6) | 61.7 | + | 52 | 0.28509(14) | 0.175(5) | 333.8(1.5) | 23.3 | |
| 16 | 27.61182(5) | 0.517(5) | 4.5(5) | 68.9 | + | 53 | 32.03430(14) | 0.173(5) | 177.3(1.5) | 23 | + |
| 17 | 27.11303(5) | 0.462(5) | 323.8(6) | 61.5 | + | 54 | 1.67956(14) | 0.169(5) | 153.5(1.6) | 22.5 | + |
| 18 | 18.83497(5) | 0.441(5) | 315.3(6) | 58.7 | + | 55 | 36.13223(14) | 0.166(5) | 97.7(1.6) | 22.1 | ∼ |
| 19 | 0.49692(6) | 0.388(5) | 245.8(7) | 51.6 | 56 | 34.65322(14) | 0.166(5) | 239.4(1.6) | 22.2 | + | |
| 20 | 21.93578(6) | 0.411(5) | 94.0(6) | 54.7 | 57 | 32.10851(14) | 0.167(5) | 152.4(1.6) | 22.2 | + | |
| 21 | 24.73787(6) | 0.409(5) | 44.4(6) | 54.4 | + | 58 | 22.50879(14) | 0.166(5) | 266.8(1.6) | 22.1 | |
| 22 | 25.20896(6) | 0.402(5) | 29.2(7) | 53.5 | + | 59 | 36.09231(15) | 0.163(5) | 251.8(1.6) | 21.7 | + |
| 23 | 27.65926(6) | 0.386(5) | 351.2(7) | 51.4 | + | 60 | 12.96918(15) | 0.162(5) | 42.6(1.6) | 21.5 | |
| 24 | 28.33090(6) | 0.370(5) | 248.9(7) | 49.2 | + | 61 | 27.46012(15) | 0.162(5) | 65.2(1.6) | 21.5 | + |
| 25 | 13.44778(7) | 0.354(5) | 305.5(7) | 47.1 | 62 | 15.58199(15) | 0.161(5) | 230.0(1.6) | 21.4 | ||
| 26 | 24.70969(7) | 0.347(5) | 0.6(8) | 46.1 | 63 | 29.89821(15) | 0.160(5) | 223.4(1.7) | 21.2 | + | |
| 27 | 13.99402(7) | 0.341(5) | 100.8(8) | 45.3 | + | 64 | 13.69577(15) | 0.157(5) | 334.2(1.7) | 20.9 | |
| 28 | 21.19886(8) | 0.306(5) | 75.1(9) | 40.7 | + | 65 | 29.36747(15) | 0.155(5) | 212.2(1.7) | 20.7 | + |
| 29 | 24.98915(8) | 0.284(5) | 211.7(9) | 37.8 | + | 66 | 0.26866(16) | 0.152(5) | 22.9(1.7) | 20.3 | ∼ |
| 30 | 17.78666(9) | 0.276(5) | 127.0(1.0) | 36.7 | + | 67 | 36.62210(16) | 0.152(5) | 336.5(1.7) | 20.3 | + |
| 31 | 36.12330(10) | 0.240(5) | 139.7(1.1) | 32 | + | 68 | 25.23620(16) | 0.148(5) | 271.9(1.8) | 19.7 | + |
| 32 | 36.06506(10) | 0.232(5) | 18.6(1.1) | 30.8 | + | 69 | 1.75471(17) | 0.143(5) | 195.6(1.8) | 19 | |
| 33 | 7.06065(10) | 0.231(5) | 274.2(1.1) | 30.7 | + | 70 | 23.00711(17) | 0.138(5) | 131.6(1.9) | 18.4 | + |
| 34 | 22.78777(10) | 0.229(5) | 349.1(1.1) | 30.5 | + | 71 | 14.60554(17) | 0.137(5) | 235.0(1.9) | 18.2 | |
| 35 | 36.56292(10) | 0.228(5) | 75.9(1.2) | 30.3 | + | 72 | 0.24564(18) | 0.135(5) | 61.3(1.9) | 18 | ∼ |
| 36 | 0.48424(11) | 0.227(5) | 125.2(1.2) | 30.2 | ∼ | 73 | 14.41579(18) | 0.135(5) | 140.8(1.9) | 18 | + |
| 37 | 33.50439(11) | 0.223(5) | 66.3(1.2) | 29.7 | + | 74 | 30.07058(18) | 0.135(5) | 341.8(2.0) | 17.9 | + |
| 38 | 28.75971(11) | 0.219(5) | 74.6(1.2) | 29.1 | 75 | 36.59298(18) | 0.132(5) | 243.6(2.0) | 17.5 | + | |
| 39 | 15.27483(11) | 0.212(5) | 334.8(1.2) | 28.2 | 76 | 36.14820(18) | 0.133(5) | 101.8(2.0) | 17.7 | ||
| 40 | 14.49281(12) | 0.206(5) | 320.2(1.3) | 27.4 | + | 77 | 1.61146(19) | 0.129(5) | 94.4(2.0) | 17.1 | |
| 41 | 7.30582(12) | 0.202(5) | 98.9(1.3) | 26.9 | 78 | 11.09517(18) | 0.130(5) | 327.0(2.0) | 17.3 | ||
| 42 | 17.46822(12) | 0.199(5) | 106.4(1.3) | 26.5 | + | 79 | 29.86627(19) | 0.129(5) | 249.8(2.0) | 17.1 | + |
| 43 | 0.25832(12) | 0.199(5) | 80.8(1.3) | 26.4 | 80 | 29.39894(19) | 0.128(5) | 19.2(2.1) | 17 | ||
| 81 | 29.65398(19) | 0.128(5) | 5.7(2.1) | 17 | + | 118 | 1.88387(27) | 0.088(5) | 75.6(3.0) | 11.7 | |
| 82 | 0.50819(19) | 0.127(5) | 319.2(2.1) | 16.9 | ∼ | 119 | 23.64493(27) | 0.088(5) | 357.2(3.0) | 11.7 | |
| 83 | 13.62955(19) | 0.125(5) | 139.7(2.1) | 16.6 | 120 | 23.41808(27) | 0.087(5) | 79.5(3.0) | 11.6 | ||
| 84 | 31.77175(20) | 0.122(5) | 241.8(2.2) | 16.2 | + | 121 | 0.59273(27) | 0.087(5) | 226.5(3.0) | 11.5 | |
| 85 | 26.41931(20) | 0.121(5) | 35.6(2.2) | 16.1 | + | 122 | 0.45887(27) | 0.088(5) | 318.0(3.0) | 11.7 | ∼ |
| 86 | 16.23344(20) | 0.119(5) | 170.1(2.2) | 15.8 | + | 123 | 0.21840(27) | 0.088(5) | 216.5(3.0) | 11.7 | |
| 87 | 0.82146(20) | 0.117(5) | 183.8(2.2) | 15.6 | 124 | 27.10128(28) | 0.086(5) | 248.2(3.1) | 11.5 | ∼ | |
| 88 | 13.94799(20) | 0.117(5) | 250.4(2.3) | 15.6 | 125 | 0.03147(28) | 0.086(5) | 239.7(3.1) | 11.4 | ||
| 89 | 27.26003(20) | 0.117(5) | 220.8(2.3) | 15.6 | 126 | 0.14043(28) | 0.087(5) | 63.0(3.0) | 11.5 | ||
| 90 | 16.75243(21) | 0.116(5) | 61.5(2.3) | 15.4 | 127 | 34.64194(28) | 0.086(5) | 264.6(3.1) | 11.4 | ∼ | |
| 91 | 15.05783(21) | 0.113(5) | 108.8(2.3) | 15.1 | + | 128 | 0.94076(28) | 0.084(5) | 79.9(3.1) | 11.2 | |
| 92 | 0.52933(21) | 0.113(5) | 141.6(2.3) | 15.1 | 129 | 36.05708(28) | 0.084(5) | 156.5(3.1) | 11.2 | ∼ | |
| 93 | 0.34709(21) | 0.112(5) | 44.7(2.3) | 15 | 130 | 10.15488(29) | 0.083(5) | 350.0(3.2) | 11.1 | ||
| 94 | 18.74761(21) | 0.111(5) | 155.5(2.4) | 14.8 | 131 | 18.94535(29) | 0.083(5) | 120.1(3.2) | 11.1 | + | |
| 95 | 36.63478(22) | 0.108(5) | 271.3(2.4) | 14.4 | ∼ | 132 | 31.73511(29) | 0.083(5) | 308.6(3.2) | 11 | + |
| 96 | 12.27641(22) | 0.109(5) | 16.7(2.4) | 14.4 | 133 | 0.73974(29) | 0.082(5) | 202.6(3.2) | 11 | ||
| 97 | 22.96202(22) | 0.106(5) | 296.7(2.5) | 14.1 | 134 | 16.30624(30) | 0.080(5) | 50.4(3.3) | 10.7 | ||
| 98 | 22.46229(22) | 0.109(5) | 292.1(2.4) | 14.5 | 135 | 16.02725(30) | 0.080(5) | 134.9(3.3) | 10.7 | ||
| 99 | 21.69765(23) | 0.105(5) | 288.0(2.5) | 13.9 | 136 | 31.16305(30) | 0.080(5) | 85.4(3.3) | 10.6 | ||
| 100 | 4.37269(23) | 0.103(5) | 131.4(2.5) | 13.8 | 137 | 12.97670(30) | 0.080(5) | 177.2(3.3) | 10.6 | ∼ | |
| 101 | 21.88975(24) | 0.101(5) | 143.3(2.6) | 13.4 | 138 | 0.99431(30) | 0.080(5) | 127.4(3.3) | 10.6 | ||
| 102 | 13.65820(24) | 0.100(5) | 55.8(2.6) | 13.3 | 139 | 27.62122(30) | 0.079(5) | 208.7(3.3) | 10.6 | ∼ | |
| 103 | 36.64746(24) | 0.099(5) | 305.0(2.7) | 13.2 | ∼ | 140 | 10.03276(30) | 0.079(5) | 321.0(3.3) | 10.5 | |
| 104 | 27.34082(24) | 0.099(5) | 147.9(2.7) | 13.1 | + | 141 | 38.46793(31) | 0.078(5) | 45.6(3.4) | 10.3 | + |
| 105 | 26.63865(24) | 0.099(5) | 96.3(2.6) | 13.2 | + | 142 | 36.07352(31) | 0.078(5) | 157.9(3.4) | 10.3 | ∼ |
| 106 | 32.23532(25) | 0.097(5) | 127.1(2.7) | 12.9 | + | 143 | 21.94752(31) | 0.078(5) | 0.3(3.4) | 10.3 | ∼ |
| 107 | 36.11673(25) | 0.097(5) | 107.4(2.7) | 12.9 | ∼ | 144 | 26.66871(31) | 0.077(5) | 44.1(3.4) | 10.3 | + |
| 108 | 36.57325(25) | 0.096(5) | 208.1(2.7) | 12.8 | ∼ | 145 | 18.99466(31) | 0.076(5) | 169.6(3.5) | 10.1 | + |
| 109 | 32.22593(25) | 0.095(5) | 65.5(2.8) | 12.6 | ∼ | 146 | 13.85546(31) | 0.076(5) | 39.8(3.5) | 10.1 | |
| 110 | 12.35531(25) | 0.095(5) | 281.4(2.8) | 12.6 | + | 147 | 14.35473(31) | 0.078(5) | 76.3(3.4) | 10.4 | |
| 111 | 0.47672(25) | 0.094(5) | 33.8(2.8) | 12.5 | ∼ | 148 | 21.47033(32) | 0.075(5) | 150.6(3.5) | 10 | + |
| 112 | 11.69260(26) | 0.092(5) | 19.3(2.9) | 12.2 | 149 | 26.14173(32) | 0.076(5) | 14.0(3.5) | 10.1 | + | |
| 113 | 21.44966(26) | 0.092(5) | 127.2(2.9) | 12.2 | + | 150 | 25.03236(32) | 0.075(5) | 283.6(3.5) | 9.9 | + |
| 114 | 36.55494(26) | 0.091(5) | 211.4(2.9) | 12.1 | ∼ | 151 | 28.36237(32) | 0.074(5) | 211.9(3.5) | 9.9 | + |
| 115 | 22.08279(26) | 0.090(5) | 140.7(2.9) | 12 | 152 | 21.67229(32) | 0.074(5) | 20.0(3.6) | 9.9 | + | |
| 116 | 29.08191(27) | 0.089(5) | 203.6(2.9) | 11.9 | + | 153 | 10.95004(32) | 0.074(5) | 127.8(3.6) | 9.8 | |
| 117 | 30.36789(27) | 0.089(5) | 120.1(2.9) | 11.9 | + | 154 | 31.12219(33) | 0.072(5) | 30.7(3.6) | 9.6 | + |
| 155 | 0.72753(33) | 0.072(5) | 11.2(3.6) | 9.6 | ∼ | 192 | 40.56879(40) | 0.060(5) | 122.9(4.4) | 7.9 | + |
| 156 | 17.96654(33) | 0.072(5) | 292.0(3.7) | 9.6 | 193 | 23.34011(40) | 0.059(5) | 104.6(4.4) | 7.9 | ||
| 157 | 31.72666(33) | 0.072(5) | 225.9(3.7) | 9.5 | ∼ | 194 | 24.53309(40) | 0.059(5) | 54.8(4.5) | 7.8 | + |
| 158 | 31.36642(33) | 0.072(5) | 21.3(3.7) | 9.6 | + | 195 | 0.74773(41) | 0.059(5) | 131.1(4.5) | 7.8 | ∼ |
| 159 | 26.18870(34) | 0.071(5) | 52.9(3.7) | 9.4 | ∼ | 196 | 1.98861(41) | 0.058(5) | 212.3(4.5) | 7.7 | |
| 160 | 41.07370(34) | 0.070(5) | 250.4(3.8) | 9.3 | + | 197 | 14.38056(41) | 0.058(5) | 183.0(4.5) | 7.7 | ∼ |
| 161 | 16.77450(34) | 0.069(5) | 135.3(3.8) | 9.2 | 198 | 41.29397(41) | 0.058(5) | 78.0(4.6) | 7.7 | + | |
| 162 | 33.51284(35) | 0.069(5) | 163.5(3.8) | 9.2 | ∼ | 199 | 0.06059(42) | 0.057(5) | 1.5(4.6) | 7.6 | |
| 163 | 37.86299(35) | 0.069(5) | 171.6(3.8) | 9.1 | + | 200 | 13.73006(42) | 0.057(5) | 265.5(4.7) | 7.5 | |
| 164 | 36.10311(35) | 0.068(5) | 194.3(3.9) | 9.1 | ∼ | 201 | 25.09952(42) | 0.056(5) | 142.7(4.7) | 7.5 | |
| 165 | 37.85124(35) | 0.068(5) | 324.1(3.9) | 9 | ∼ | 202 | 27.83304(42) | 0.057(5) | 192.4(4.7) | 7.5 | |
| 166 | 36.03547(36) | 0.067(5) | 275.4(3.9) | 8.9 | + | 203 | 0.21229(43) | 0.056(5) | 71.7(4.7) | 7.4 | ∼ |
| 167 | 36.53427(34) | 0.070(5) | 313.3(3.8) | 9.3 | + | 204 | 13.37545(44) | 0.055(5) | 311.6(4.8) | 7.3 | |
| 168 | 27.15624(36) | 0.067(5) | 43.3(3.9) | 8.9 | ∼ | 205 | 27.87061(44) | 0.055(5) | 247.7(4.8) | 7.3 | + |
| 169 | 27.71186(36) | 0.066(5) | 241.6(4.0) | 8.8 | 206 | 36.62821(44) | 0.055(5) | 312.0(4.8) | 7.3 | ∼ | |
| 170 | 27.60008(36) | 0.066(5) | 276.2(4.0) | 8.8 | ∼ | 207 | 40.66602(44) | 0.054(5) | 243.5(4.9) | 7.2 | + |
| 171 | 18.39489(36) | 0.066(5) | 195.7(4.0) | 8.8 | + | 208 | 32.08314(44) | 0.054(5) | 324.2(4.9) | 7.2 | + |
| 172 | 0.12212(36) | 0.066(5) | 320.6(4.0) | 8.8 | 209 | 34.06565(43) | 0.055(5) | 166.9(4.8) | 7.3 | + | |
| 173 | 26.16757(37) | 0.065(5) | 250.0(4.0) | 8.7 | + | 210 | 0.53590(44) | 0.054(5) | 260.0(4.9) | 7.1 | ∼ |
| 174 | 0.16955(37) | 0.065(5) | 161.0(4.1) | 8.6 | 211 | 13.27118(45) | 0.054(5) | 98.1(4.9) | 7.1 | ||
| 175 | 1.45412(37) | 0.064(5) | 238.5(4.1) | 8.6 | 212 | 36.65545(45) | 0.053(5) | 295.0(4.9) | 7.1 | ∼ | |
| 176 | 34.00412(37) | 0.064(5) | 68.4(4.1) | 8.5 | + | 213 | 19.21306(45) | 0.053(5) | 121.4(4.9) | 7.1 | |
| 177 | 14.17625(38) | 0.063(5) | 215.8(4.2) | 8.4 | 214 | 17.64669(45) | 0.053(5) | 359.8(5.0) | 7.0 | ||
| 178 | 31.61018(38) | 0.063(5) | 119.0(4.2) | 8.4 | 215 | 24.26679(45) | 0.053(5) | 326.2(5.2) | 7.0 | ||
| 179 | 31.57402(37) | 0.064(5) | 155.1(4.1) | 8.6 | 216 | 0.90554(46) | 0.052(5) | 216.3(5.1) | 6.9 | ||
| 180 | 0.20196(38) | 0.063(5) | 242.0(4.2) | 8.4 | 217 | 18.97682(46) | 0.052(5) | 3.4(5.1) | 6.9 | ||
| 181 | 0.29824(34) | 0.070(5) | 324.0(3.8) | 9.3 | ∼ | 218 | 25.70775(46) | 0.052(5) | 220.8(5.1) | 6.9 | |
| 182 | 18.49634(38) | 0.062(5) | 290.9(4.2) | 8.3 | 219 | 41.04270(46) | 0.052(5) | 92.9(5.1) | 6.9 | + | |
| 183 | 25.20520(38) | 0.062(5) | 94.1(4.2) | 8.3 | ∼ | 220 | 0.08877(46) | 0.052(5) | 110.0(5.1) | 6.9 | |
| 184 | 28.10451(39) | 0.062(5) | 305.5(4.3) | 8.2 | + | 221 | 3.05619(46) | 0.052(5) | 32.8(5.1) | 6.9 | |
| 185 | 30.26831(39) | 0.062(5) | 199.9(4.3) | 8.2 | + | 222 | 14.02595(46) | 0.051(5) | 47.5(5.1) | 6.8 | |
| 186 | 16.08924(39) | 0.062(5) | 146.7(4.3) | 8.2 | 223 | 10.47896(47) | 0.051(5) | 73.4(5.2) | 6.8 | ||
| 187 | 3.65737(39) | 0.061(5) | 46.8(4.3) | 8.2 | 224 | 30.62339(47) | 0.051(5) | 314.4(5.2) | 6.8 | + | |
| 188 | 3.40985(38) | 0.062(5) | 305.7(4.3) | 8.2 | 225 | 22.68914(47) | 0.051(5) | 177.7(5.2) | 6.8 | ||
| 189 | 17.81296(39) | 0.061(5) | 136.4(4.3) | 8.2 | ∼ | 226 | 7.57260(47) | 0.051(5) | 39.1(5.2) | 6.7 | |
| 190 | 28.39102(40) | 0.060(5) | 214.7(4.4) | 8 | + | 227 | 38.64171(47) | 0.050(5) | 98.2(5.2) | 6.7 | + |
| 191 | 34.45924(40) | 0.060(5) | 2.7(4.4) | 7.9 | + | 228 | 38.14057(42) | 0.057(5) | 102.1(4.7) | 7.5 | + |
| 229 | 1.59878(48) | 0.050(5) | 8.5(5.3) | 6.7 | ∼ | 266 | 23.07991(50) | 0.043(4) | 337.3(5.5) | 5.7 | |
| 230 | 27.08297(48) | 0.050(5) | 107.0(5.3) | 6.6 | 267 | 32.05825(50) | 0.042(4) | 235.4(5.6) | 5.6 | ||
| 231 | 0.70827(48) | 0.049(5) | 220.6(5.3) | 6.6 | 268 | 38.92399(50) | 0.042(4) | 157.0(5.6) | 5.6 | ||
| 232 | 34.62597(49) | 0.048(5) | 111.9(5.4) | 6.5 | + | 269 | 13.99214(50) | 0.042(4) | 310.0(5.6) | 5.6 | |
| 233 | 0.38842(49) | 0.048(5) | 314.4(5.4) | 6.4 | 270 | 31.07569(51) | 0.042(4) | 107.8(5.6) | 5.6 | ||
| 234 | 15.59984(49) | 0.048(5) | 73.3(5.5) | 6.4 | 271 | 31.39131(50) | 0.042(4) | 171.7(5.6) | 5.6 | ||
| 235 | 40.92481(50) | 0.048(5) | 116.2(5.5) | 6.4 | + | 272 | 0.12822(51) | 0.042(4) | 86.1(5.6) | 5.6 | |
| 236 | 24.74257(50) | 0.048(5) | 157.2(5.5) | 6.4 | ∼ | 273 | 18.60718(51) | 0.042(4) | 318.8(5.6) | 5.6 | |
| 237 | 0.19398(50) | 0.047(5) | 117.9(5.6) | 6.3 | ∼ | 274 | 18.47614(50) | 0.042(4) | 353.0(5.6) | 5.6 | |
| 238 | 26.20326(50) | 0.047(5) | 297.0(5.6) | 6.3 | ∼ | 275 | 40.52840(51) | 0.042(4) | 229.9(5.6) | 5.6 | |
| 239 | 0.83696(51) | 0.047(5) | 323.3(5.6) | 6.3 | 276 | 18.33665(51) | 0.042(4) | 287.7(5.7) | 5.5 | ||
| 240 | 0.86374(49) | 0.049(5) | 336.6(5.4) | 6.5 | 277 | 11.47702(51) | 0.042(4) | 147.2(5.7) | 5.5 | ||
| 241 | 28.33935(51) | 0.047(5) | 186.2(5.6) | 6.3 | ∼ | 278 | 26.46018(51) | 0.041(4) | 1.4(5.7) | 5.5 | |
| 242 | 30.09078(51) | 0.047(5) | 216.2(5.6) | 6.2 | 279 | 21.75167(52) | 0.041(4) | 3.4(5.7) | 5.5 | ||
| 243 | 36.37364(51) | 0.047(5) | 196.1(5.6) | 6.2 | + | 280 | 14.12834(52) | 0.041(4) | 1.5(5.7) | 5.5 | |
| 244 | 27.16892(51) | 0.047(5) | 218.8(5.6) | 6.2 | ∼ | 281 | 27.27976(52) | 0.041(4) | 6.7(5.7) | 5.5 | |
| 245 | 22.59802(51) | 0.047(5) | 183.6(5.6) | 6.2 | 282 | 52.44645(52) | 0.041(4) | 116.8(5.8) | 5.4 | ||
| 246 | 41.05115(51) | 0.046(5) | 38.3(5.7) | 6.2 | ∼ | 283 | 18.66448(53) | 0.040(4) | 330.3(5.8) | 5.4 | |
| 247 | 0.01738(52) | 0.046(5) | 358.1(5.7) | 6.1 | 284 | 32.63830(53) | 0.040(4) | 272.2(5.8) | 5.4 | ||
| 248 | 18.44796(52) | 0.046(5) | 233.8(5.7) | 6.1 | + | 285 | 32.26773(53) | 0.040(4) | 144.4(5.8) | 5.4 | |
| 249 | 28.88230(53) | 0.045(5) | 324.7(5.8) | 6 | + | 286 | 32.13246(53) | 0.040(4) | 58.5(5.8) | 5.4 | |
| 250 | 11.91476(53) | 0.045(5) | 207.0(5.8) | 6 | + | 287 | 27.88330(53) | 0.040(4) | 75.1(5.9) | 5.3 | |
| 251 | 1.22304(53) | 0.045(5) | 218.1(5.9) | 5.9 | 288 | 38.65768(53) | 0.040(4) | 300.7(5.9) | 5.3 | ||
| 252 | 25.08167(54) | 0.044(5) | 194.0(5.9) | 5.9 | 289 | 17.62462(53) | 0.040(4) | 300.3(5.9) | 5.3 | ||
| 253 | 18.41978(54) | 0.044(5) | 313.2(6.0) | 5.8 | ∼ | 290 | 34.28546(54) | 0.040(4) | 70.5(5.9) | 5.3 | |
| 254 | 0.41942(55) | 0.044(5) | 215.3(6.0) | 5.8 | 291 | 0.57676(54) | 0.040(4) | 267.5(5.9) | 5.3 | ||
| 255 | 38.19834(55) | 0.044(5) | 200.8(6.1) | 5.8 | + | 292 | 3.91476(53) | 0.040(4) | 24.5(5.9) | 5.3 | |
| 256 | 37.87661(49) | 0.044(4) | 247.1(5.4) | 5.8 | 293 | 0.18176(53) | 0.040(4) | 152.7(5.9) | 5.3 | ||
| 257 | 31.67828(49) | 0.043(4) | 206.9(5.4) | 5.8 | 294 | 40.69514(54) | 0.040(4) | 323.4(5.9) | 5.3 | ||
| 258 | 40.59838(49) | 0.043(4) | 304.0(5.5) | 5.7 | 295 | 29.56990(54) | 0.039(4) | 136.9(6.0) | 5.2 | ||
| 259 | 21.17303(50) | 0.043(4) | 3.0(5.5) | 5.7 | 296 | 30.29039(54) | 0.039(4) | 163.6(6.0) | 5.3 | ||
| 260 | 0.78389(50) | 0.043(4) | 350.5(5.5) | 5.7 | 297 | 27.21213(54) | 0.039(4) | 178.6(6.0) | 5.2 | ||
| 261 | 2.67105(50) | 0.043(4) | 252.9(5.5) | 5.7 | 298 | 0.98303(54) | 0.039(4) | 338.9(6.0) | 5.2 | ||
| 262 | 5.59244(50) | 0.043(4) | 217.8(5.5) | 5.7 | 299 | 36.43047(55) | 0.039(4) | 346.3(6.0) | 5.2 | ||
| 263 | 14.36553(50) | 0.043(4) | 343.9(5.5) | 5.7 | 300 | 36.04909(54) | 0.039(4) | 220.3(6.0) | 5.2 | ||
| 264 | 26.13140(50) | 0.042(4) | 308.0(5.5) | 5.6 | 301 | 0.49504(55) | 0.039(4) | 284.1(6.1) | 5.1 | ||
| 265 | 22.87795(50) | 0.042(4) | 136.7(5.6) | 5.6 | 302 | 22.02925(55) | 0.039(4) | 249.9(6.1) | 5.1 | ||
| 303 | 22.84977(56) | 0.038(4) | 22.1(6.1) | 5.1 | 340 | 2.33640(61) | 0.035(4) | 201.6(6.8) | 4.6 | ||
| 304 | 38.82301(56) | 0.038(4) | 84.4(6.2) | 5.1 | 341 | 5.79546(61) | 0.035(4) | 323.3(6.8) | 4.6 | ||
| 305 | 36.08432(56) | 0.038(4) | 328.8(6.2) | 5 | 342 | 8.99316(61) | 0.035(4) | 94.4(6.8) | 4.6 | ||
| 306 | 17.28880(56) | 0.038(4) | 138.2(6.2) | 5 | 343 | 40.57713(62) | 0.035(4) | 49.3(6.8) | 4.6 | ||
| 307 | 32.83745(56) | 0.038(4) | 283.2(6.2) | 5 | 344 | 23.28876(62) | 0.034(4) | 153.6(6.8) | 4.6 | ||
| 308 | 0.44478(57) | 0.038(4) | 112.8(6.3) | 5 | 345 | 32.32647(62) | 0.034(4) | 311.9(6.8) | 4.6 | ||
| 309 | 0.40909(56) | 0.038(4) | 131.4(6.2) | 5 | 346 | 38.62485(62) | 0.034(4) | 117.6(6.9) | 4.5 | ||
| 310 | 20.29755(57) | 0.038(4) | 256.7(6.3) | 5 | 347 | 43.33923(62) | 0.034(4) | 325.0(6.9) | 4.5 | ||
| 311 | 25.51472(57) | 0.037(4) | 349.6(6.3) | 5 | 348 | 26.17857(62) | 0.034(4) | 65.6(6.9) | 4.5 | ||
| 312 | 34.44515(57) | 0.037(4) | 134.3(6.3) | 5 | 349 | 24.85296(63) | 0.034(4) | 62.6(6.9) | 4.5 | ||
| 313 | 31.94882(55) | 0.038(4) | 28.5(6.1) | 5.1 | 350 | 1.30086(63) | 0.034(4) | 146.9(6.9) | 4.5 | ||
| 314 | 34.08021(57) | 0.038(4) | 81.9(6.3) | 5 | 351 | 12.47697(63) | 0.034(4) | 175.2(7.0) | 4.5 | ||
| 315 | 22.79623(57) | 0.037(4) | 283.8(6.3) | 5 | 352 | 22.24233(63) | 0.034(4) | 97.3(7.0) | 4.5 | ||
| 316 | 13.47549(57) | 0.037(4) | 269.2(6.3) | 4.9 | 353 | 13.96989(63) | 0.034(4) | 350.7(7.0) | 4.5 | ||
| 317 | 15.35138(57) | 0.037(4) | 198.7(6.3) | 4.9 | 354 | 0.11682(63) | 0.034(4) | 172.3(7.0) | 4.5 | ||
| 318 | 26.50339(58) | 0.037(4) | 159.5(6.4) | 4.9 | 355 | 38.84400(63) | 0.034(4) | 299.6(7.0) | 4.5 | ||
| 319 | 14.42471(58) | 0.037(4) | 356.5(6.4) | 4.9 | 356 | 36.01940(63) | 0.034(4) | 304.2(7.0) | 4.5 | ||
| 320 | 18.24741(58) | 0.037(4) | 328.3(6.4) | 4.9 | 357 | 0.37396(63) | 0.034(4) | 180.4(7.0) | 4.5 | ||
| 321 | 17.79464(58) | 0.037(4) | 332.9(6.4) | 4.9 | 358 | 41.03200(63) | 0.034(4) | 135.0(7.0) | 4.5 | ||
| 322 | 40.93702(58) | 0.037(4) | 93.1(6.4) | 4.9 | 359 | 26.21200(64) | 0.033(4) | 43.0(7.1) | 4.4 | ||
| 323 | 33.49546(58) | 0.037(4) | 10.4(6.4) | 4.9 | 360 | 28.15600(64) | 0.033(4) | 352.1(7.1) | 4.4 | ||
| 324 | 13.92591(58) | 0.037(4) | 272.1(6.4) | 4.9 | 361 | 32.02800(64) | 0.033(4) | 214.8(7.1) | 4.4 | ||
| 325 | 13.95691(56) | 0.038(4) | 4.9(6.2) | 5.1 | 362 | 23.12800(64) | 0.033(4) | 277.8(7.1) | 4.4 | ||
| 326 | 12.96200(57) | 0.038(4) | 205.9(6.2) | 5 | 363 | 23.19200(63) | 0.034(4) | 310.8(7.0) | 4.5 | ||
| 327 | 3.99150(58) | 0.036(4) | 29.1(6.5) | 4.8 | 364 | 1.20800(64) | 0.033(4) | 27.0(7.1) | 4.4 | ||
| 328 | 25.99003(59) | 0.036(4) | 39.2(6.5) | 4.8 | 365 | 0.80800(64) | 0.033(4) | 326.9(7.1) | 4.4 | ||
| 329 | 32.17410(58) | 0.036(4) | 314.5(6.5) | 4.8 | 366 | 15.02400(64) | 0.033(4) | 183.1(7.1) | 4.4 | ||
| 330 | 0.65755(59) | 0.036(4) | 164.6(6.5) | 4.8 | 367 | 23.75200(65) | 0.033(4) | 63.5(7.1) | 4.4 | ||
| 331 | 37.96485(59) | 0.036(4) | 288.9(6.5) | 4.8 | 368 | 30.63200(65) | 0.033(4) | 44.7(7.2) | 4.4 | ||
| 332 | 40.99194(60) | 0.036(4) | 219.8(6.6) | 4.8 | 369 | 22.22400(66) | 0.032(4) | 57.2(7.3) | 4.3 | ||
| 333 | 16.60626(60) | 0.035(4) | 150.4(6.6) | 4.7 | 370 | 0.16000(66) | 0.032(4) | 22.5(7.3) | 4.3 | ||
| 334 | 18.21105(61) | 0.035(4) | 45.2(6.7) | 4.7 | 371 | 25.36400(67) | 0.032(4) | 286.6(7.4) | 4.2 | ||
| 335 | 36.66564(61) | 0.035(4) | 256.7(6.7) | 4.6 | 372 | 32.10000(67) | 0.032(4) | 114.0(7.4) | 4.2 | ||
| 336 | 38.35755(61) | 0.035(4) | 267.6(6.7) | 4.6 | 373 | 0.07200(67) | 0.032(4) | 258.4(7.4) | 4.2 | ||
| 337 | 32.37003(60) | 0.036(4) | 13.3(6.6) | 4.7 | 374 | 30.66400(67) | 0.032(4) | 223.7(7.5) | 4.2 | ||
| 338 | 36.54486(61) | 0.035(4) | 273.7(6.7) | 4.6 | 375 | 30.15200(67) | 0.032(4) | 227.3(7.4) | 4.2 | ||
| 339 | 38.19024(61) | 0.035(4) | 288.6(6.8) | 4.6 | 376 | 36.58400(68) | 0.031(4) | 146.9(7.5) | 4.2 | ||
| 377 | 21.98800(68) | 0.031(4) | 337.6(7.5) | 4.2 | 386 | 27.12000(69) | 0.031(4) | 155.5(7.7) | 4.1 | ||
| 378 | 0.60400(68) | 0.031(4) | 199.3(7.6) | 4.1 | 387 | 26.86800(68) | 0.031(4) | 150.9(7.6) | 4.1 | ||
| 379 | 24.72800(68) | 0.031(4) | 174.4(7.6) | 4.1 | 388 | 26.76000(68) | 0.031(4) | 31.3(7.5) | 4.2 | ||
| 380 | 11.54800(69) | 0.031(4) | 139.7(7.6) | 4.1 | 389 | 40.55200(70) | 0.030(4) | 165.7(7.8) | 4.0 | ||
| 381 | 12.04400(68) | 0.031(4) | 251.3(7.5) | 4.2 | 390 | 33.04000(70) | 0.030(4) | 245.9(7.7) | 4.0 | ||
| 382 | 31.75600(68) | 0.031(4) | 5.6(7.6) | 4.1 | 391 | 26.03200(70) | 0.030(4) | 307.6(7.8) | 4.0 | ||
| 383 | 22.86000(69) | 0.031(4) | 263.6(7.6) | 4.1 | 392 | 30.45600(71) | 0.030(4) | 253.3(7.8) | 4.0 | ||
| 384 | 24.38800(69) | 0.031(4) | 210.8(7.6) | 4.1 | 393 | 27.76000(71) | 0.030(4) | 47.3(7.8) | 4.0 | ||
| 385 | 38.91200(69) | 0.031(4) | 195.7(7.7) | 4.1 |
References
- Aerts, C.; Christensen-Dalsgaard, J.; Kurtz, D.W. Asteroseismology; Springer: Dordrecht, The Netherlands, 2010. [Google Scholar] [CrossRef]
- Balona, L.A.; Daszyńska-Daszkiewicz, J.; Pamyatnykh, A.A. Pulsation frequency distribution in δ Scuti stars. Mon. Not. R. Astron. Soc. 2015, 452, 3073–3084. [Google Scholar] [CrossRef]
- Antoci, V.; Cunha, M.; Houdek, G.; Kjeldsen, H.; Trampedach, R.; Handler, G.; Lüftinger, T.; Arentoft, T.; Murphy, S. The Role of Turbulent Pressure as a Coherent Pulsational Driving Mechanism: The Case of the δ Scuti Star HD 187547. Astrophys. J. 2014, 796, 118. [Google Scholar] [CrossRef]
- Grassitelli, L.; Fossati, L.; Langer, N.; Miglio, A.; Istrate, A.G.; Sanyal, D. Relating turbulent pressure and macroturbulence across the HR diagram with a possible link to γ Doradus stars. Astron. Astrophys. 2015, 584, L2. [Google Scholar] [CrossRef]
- Borucki, W.J.; Koch, D.; Basri, G.; Batalha, N.; Brown, T.; Caldwell, D.; Caldwell, J.; Christensen-Dalsgaard, J.; Cochran, W.D.; DeVore, E.; et al. Kepler Planet-Detection Mission: Introduction and First Results. Science 2010, 327, 977–980. [Google Scholar] [CrossRef] [PubMed]
- Koch, D.G.; Borucki, W.J.; Basri, G.; Batalha, N.M.; Brown, T.M.; Caldwell, D.; Christensen-Dalsgaard, J.; Cochran, W.D.; DeVore, E.; Dunham, E.W.; et al. Kepler Mission Design, Realized Photometric Performance, and Early Science. Astrophys. J. 2010, 713, L79–L86. [Google Scholar] [CrossRef]
- Howell, S.B.; Sobeck, C.; Haas, M.; Still, M.; Barclay, T.; Mullally, F.; Troeltzsch, J.; Aigrain, S.; Bryson, S.T.; Caldwell, D.; et al. The K2 Mission: Characterization and Early Results. Publ. Astron. Soc. Pac. 2014, 126, 398. [Google Scholar] [CrossRef]
- Gaia Collaboration; Prusti, T.; de Bruijne, J.H.J.; Brown, A.G.A.; Vallenari, A.; Babusiaux, C.; Bailer-Jones, C.A.L.; Bastian, U.; Biermann, M.; Evans, D.W.; et al. The Gaia mission. Astron. Astrophys. 2016, 595, A1. [Google Scholar] [CrossRef]
- Ricker, G.R.; Latham, D.W.; Vanderspek, R.K.; Ennico, K.A.; Bakos, G.; Brown, T.M.; Burgasser, A.J.; Charbonneau, D.; Deming, L.D.; Doty, J.P.; et al. The Transiting Exoplanet Survey Satellite (TESS); American Astronomical Society Meeting Abstracts, American Astronomical Society Meeting #213; American Astronomical Society: Long Beach, CA, USA, 2009; Volume 214, p. 306.5. [Google Scholar]
- Ricker, G.R.; Winn, J.N.; Vanderspek, R.; Latham, D.W.; Bakos, G.Á.; Bean, J.L.; Berta-Thompson, Z.K.; Brown, T.M.; Buchhave, L.; Butler, N.R.; et al. Transiting Exoplanet Survey Satellite (TESS). J. Astron. Telesc. Instrum. Syst. 2015, 1, 014003. [Google Scholar] [CrossRef]
- Shappee, B.; Prieto, J.; Stanek, K.Z.; Kochanek, C.S.; Holoien, T.; Jencson, J.; Basu, U.; Beacom, J.F.; Szczygiel, D.; Pojmanski, G.; et al. All Sky Automated Survey for SuperNovae (ASAS-SN or “Assassin”); American Astronomical Society Meeting Abstracts, American Astronomical Society Meeting #223; American Astronomical Society: Washington, DC, USA, 2014; Volume 223, p. 236.03. [Google Scholar]
- Bowman, D.M.; Kurtz, D.W. Characterizing the observational properties of δ Sct stars in the era of space photometry from the Kepler mission. Mon. Not. R. Astron. Soc. 2018, 476, 3169–3184. [Google Scholar] [CrossRef]
- Murphy, S.J.; Hey, D.; Van Reeth, T.; Bedding, T.R. Gaia-derived luminosities of Kepler A/F stars and the pulsator fraction across the δ Scuti instability strip. Mon. Not. R. Astron. Soc. 2019, 485, 2380–2400. [Google Scholar] [CrossRef]
- Ziaali, E.; Bedding, T.R.; Murphy, S.J.; Van Reeth, T.; Hey, D.R. The period-luminosity relation for δ Scuti stars using Gaia DR2 parallaxes. Mon. Not. R. Astron. Soc. 2019, 486, 4348–4353. [Google Scholar] [CrossRef]
- Bedding, T.R.; Murphy, S.J.; Hey, D.R.; Huber, D.; Li, T.; Smalley, B.; Stello, D.; White, T.R.; Ball, W.H.; Chaplin, W.J.; et al. Very regular high-frequency pulsation modes in young intermediate-mass stars. Nature 2020, 581, 147–151. [Google Scholar] [CrossRef] [PubMed]
- Jayasinghe, T.; Stanek, K.Z.; Kochanek, C.S.; Vallely, P.J.; Shappee, B.J.; Holoien, T.W.S.; Thompson, T.A.; Prieto, J.L.; Pejcha, O.; Fausnaugh, M.; et al. The ASAS-SN catalogue of variable stars VI: An all-sky sample of δ Scuti stars. Mon. Not. R. Astron. Soc. 2020, 493, 4186–4208. [Google Scholar] [CrossRef]
- Budding, E.; Demircan, O. Introduction to Astronomical Photometry; Cambridge University Press: New York, NY, USA, 2007. [Google Scholar] [CrossRef]
- Borkovits, T.; Hajdu, T.; Sztakovics, J.; Rappaport, S.; Levine, A.; Bíró, I.B.; Klagyivik, P. A comprehensive study of the Kepler triples via eclipse timing. Mon. Not. R. Astron. Soc. 2016, 455, 4136–4165. [Google Scholar] [CrossRef]
- Mkrtichian, D.E.; Kusakin, A.V.; Gamarova, A.Y.; Nazarenko, V. Pulsating Components of Eclipsing Binaries: New Asteroseismic Methods of Studies and Prospects. In International Astronomical Union Colloquium 185: Radial and Nonradial Pulsationsn as Probes of Stellar Physics Leuven, Belgium, 26–31 July 2002; Aerts, C., Bedding, T.R., Christensen-Dalsgaard, J., Eds.; Astronomical Society of the Pacific Conference Series; Astronomical Society of the Pacific: San Francisco, CA, USA, 2002; Volume 259, p. 96. [Google Scholar]
- Soydugan, E.; İbanoǧlu, C.; Soydugan, F.; Akan, M.C.; Demircan, O. The connection between the pulsational and orbital periods for eclipsing binary systems. Mon. Not. R. Astron. Soc. 2006, 366, 1289–1294. [Google Scholar] [CrossRef]
- Liakos, A.; Niarchos, P.; Soydugan, E.; Zasche, P. Survey for δ Sct components in eclipsing binaries and new correlations between pulsation frequency and fundamental stellar characteristics. Mon. Not. R. Astron. Soc. 2012, 422, 1250–1262. [Google Scholar] [CrossRef]
- Zhang, X.B.; Luo, C.Q.; Fu, J.N. On the Pulsational-Orbital-period Relation of Eclipsing Binaries with δ-Sct Components. Astrophys. J. 2013, 777, 77. [Google Scholar] [CrossRef]
- Liakos, A.; Niarchos, P. Binaries with a δ Scuti Component: Results from a Long-Term Observational Survey, Updated Catalog, and Future Prospects. In Living Together: Planets, Host Stars and Binaries, Litomyšl, Czech Republic, 8–12 September 2014; Torres, G., Zejda, M., Eds.; Astronomical Society of the Pacific Conference Series; Astronomical Society of the Pacific: San Francisco, CA, USA, 2015; Volume 496, p. 195. [Google Scholar]
- Liakos, A.; Niarchos, P. Poetry in Motion: Asteroseismology of Delta Scuti Stars in Binaries using Kepler Data. In Proceedings of the 12th Hellenic Astronomical Conference, Thessaloniki, Greece, 28 June–2 July 2015. [Google Scholar]
- Kahraman Aliçavuş, F.; Soydugan, E.; Smalley, B.; Kubát, J. Eclipsing binary stars with a δ Scuti component. Mon. Not. R. Astron. Soc. 2017, 470, 915–931. [Google Scholar] [CrossRef]
- Liakos, A.; Niarchos, P. Catalogue and properties of δ Scuti stars in binaries. Mon. Not. R. Astron. Soc. 2017, 465, 1181–1200. [Google Scholar] [CrossRef]
- Murphy, S.J. Pulsating stars in binary systems: A review. arXiv 2018, arXiv:1811.12659. [Google Scholar]
- Murphy, S.J.; Moe, M.; Kurtz, D.W.; Bedding, T.R.; Shibahashi, H.; Boffin, H.M.J. Finding binaries from phase modulation of pulsating stars with Kepler: V. Orbital parameters, with eccentricity and mass-ratio distributions of 341 new binaries. Mon. Not. R. Astron. Soc. 2018, 474, 4322–4346. [Google Scholar] [CrossRef]
- Shibahashi, H.; Kurtz, D.W. FM stars: A Fourier view of pulsating binary stars, a new technique for measuring radial velocities photometrically. Mon. Not. R. Astron. Soc. 2012, 422, 738–752. [Google Scholar] [CrossRef]
- Shibahashi, H.; Kurtz, D.W.; Murphy, S.J. FM stars II: A Fourier view of pulsating binary stars—Determining binary orbital parameters photometrically for highly eccentric cases. Mon. Not. R. Astron. Soc. 2015, 450, 3999–4015. [Google Scholar] [CrossRef]
- Murphy, S.J.; Shibahashi, H. Deriving the orbital properties of pulsators in binary systems through their light arrival time delays. Mon. Not. R. Astron. Soc. 2015, 450, 4475–4485. [Google Scholar] [CrossRef]
- Liakos, A. Asteroseismology of two Kepler detached eclipsing binaries. Astron. Astrophys. 2020, 642, A91. [Google Scholar] [CrossRef]
- Murphy, S.J.; Pigulski, A.; Kurtz, D.W.; Suárez, J.C.; Handler, G.; Balona, L.A.; Smalley, B.; Uytterhoeven, K.; Szabó, R.; Thygesen, A.O.; et al. Asteroseismology of KIC 11754974: A high-amplitude SX Phe pulsator in a 343-d binary system. Mon. Not. R. Astron. Soc. 2013, 432, 2284–2297. [Google Scholar] [CrossRef]
- Breger, M. δ Scuti stars (Review). In Delta Scuti and Related Stars, Vienna, Austria, 4–7 August 1999; Breger, M., Montgomery, M., Eds.; Astronomical Society of the Pacific Conference Series; Astronomical Society of the Pacific: San Francisco, CA, USA, 2000; Volume 210, p. 3. [Google Scholar]
- Prša, A.; Batalha, N.; Slawson, R.W.; Doyle, L.R.; Welsh, W.F.; Orosz, J.A.; Seager, S.; Rucker, M.; Mjaseth, K.; Engle, S.G.; et al. Kepler Eclipsing Binary Stars. I. Catalog and Principal Characterization of 1879 Eclipsing Binaries in the First Data Release. Astron. J. 2011, 141, 83. [Google Scholar] [CrossRef]
- Liakos, A.; Niarchos, P. Observations of candidate oscillating eclipsing binaries and two newly discovered pulsating variables. Commun. Asteroseismol. 2009, 160, 2. [Google Scholar] [CrossRef]
- Liakos, A.; Niarchos, P. The oEA stars QY Aql, BW Del, TZ Dra, BO Her and RR Lep: Photometric analysis, frequency search and evolutionary status. Astrophys. Space Sci. 2013, 343, 123–133. [Google Scholar] [CrossRef]
- Liakos, A.; Cagaš, P. First frequency analysis for three new members of the group of eclipsing binaries with a pulsating component. Astrophys. Space Sci. 2014, 353, 559–566. [Google Scholar] [CrossRef]
- Liakos, A. Asteroseismology of Kepler Algol-type oscillating eclipsing binaries. Astron. Astrophys. 2017, 607, A85. [Google Scholar] [CrossRef]
- Liakos, A. KIC 8553788: A pulsating Algol with an extreme mass ratio. Astron. Astrophys. 2018, 616, A130. [Google Scholar] [CrossRef]
- Slawson, R.W.; Prša, A.; Welsh, W.F.; Orosz, J.A.; Rucker, M.; Batalha, N.; Doyle, L.R.; Engle, S.G.; Conroy, K.; Coughlin, J.; et al. Kepler Eclipsing Binary Stars. II. 2165 Eclipsing Binaries in the Second Data Release. Astron. J. 2011, 142, 160. [Google Scholar] [CrossRef]
- Pinsonneault, M.H.; An, D.; Molenda-Żakowicz, J.; Chaplin, W.J.; Metcalfe, T.S.; Bruntt, H. A Revised Effective Temperature Scale for the Kepler Input Catalog. Astrophys. J. Suppl. Ser. 2012, 199, 30. [Google Scholar] [CrossRef]
- Armstrong, D.J.; Gómez Maqueo Chew, Y.; Faedi, F.; Pollacco, D. A catalogue of temperatures for Kepler eclipsing binary stars. Mon. Not. R. Astron. Soc. 2014, 437, 3473–3481. [Google Scholar] [CrossRef]
- Huber, D.; Silva Aguirre, V.; Matthews, J.M.; Pinsonneault, M.H.; Gaidos, E.; García, R.A.; Hekker, S.; Mathur, S.; Mosser, B.; Torres, G.; et al. Revised Stellar Properties of Kepler Targets for the Quarter 1-16 Transit Detection Run. Astrophys. J. Suppl. Ser. 2014, 211, 2. [Google Scholar] [CrossRef]
- Frasca, A.; Molenda-Żakowicz, J.; De Cat, P.; Catanzaro, G.; Fu, J.N.; Ren, A.B.; Luo, A.L.; Shi, J.R.; Wu, Y.; Zhang, H.T. Activity indicators and stellar parameters of the Kepler targets. An application of the ROTFIT pipeline to LAMOST-Kepler stellar spectra. Astron. Astrophys. 2016, 594, A39. [Google Scholar] [CrossRef]
- Qian, S.B.; Li, L.J.; He, J.J.; Zhang, J.; Zhu, L.Y.; Han, Z.T. LAMOST views δ Scuti pulsating stars. Mon. Not. R. Astron. Soc. 2018, 475, 478–491. [Google Scholar] [CrossRef]
- Berger, T.A.; Huber, D.; Gaidos, E.; van Saders, J.L. Revised Radii of Kepler Stars and Planets Using Gaia Data Release 2. Astrophys. J. 2018, 866, 99. [Google Scholar] [CrossRef]
- Bai, Y.; Liu, J.; Bai, Z.; Wang, S.; Fan, D. Machine-learning Regression of Stellar Effective Temperatures in the Second Gaia Data Release. Astronom. J. 2019, 158, 93. [Google Scholar] [CrossRef]
- Davenport, J.R.A. The Kepler Catalog of Stellar Flares. Astrophys. J. 2016, 829, 23. [Google Scholar] [CrossRef]
- Boumis, P.; Meaburn, J.; Goudis, C.D. ARISTARCHOS Instrumentation: Manchester Echelle Spectrometer (MES) and Aristarchos Transient Spectrometer (ATS/PatMan). In Proceedings of the Hellenic Astronomical Society Sixth Astronomical Conference, Athens, Greece, 15–17 September 2003; p. 313. [Google Scholar]
- Nelson, B. RaVeRe (Radial Velocity Reductions). 2009. Available online: https://www.variablestarssouth.org/software-by-bob-nelson/ (accessed on 15 August 2020).
- Joshi, S.; Semenko, E.; Moiseeva, A.; Sharma, K.; Joshi, Y.C.; Sachkov, M.; Singh, H.P.; Yerra, B.K. High-resolution Spectroscopy and Spectropolarimetry of Selected δ-Sct Pulsating Variables. Mon. Not. R. Astron. Soc. 2017, 467, 633–645. [Google Scholar] [CrossRef]
- Cox, A.N. Allen’s Astrophysical Quantities; Springer: New York, NY, USA, 2000. [Google Scholar]
- Prša, A.; Zwitter, T. A Computational Guide to Physics of Eclipsing Binaries. I. Demonstrations and Perspectives. Astrophys. J. 2005, 628, 426–438. [Google Scholar] [CrossRef]
- Wilson, R.E.; Devinney, E.J. Realization of Accurate Close-Binary Light Curves: Application to MR Cygni. Astrophys. J. 1971, 166, 605. [Google Scholar] [CrossRef]
- Wilson, R.E. Eccentric orbit generalization and simultaneous solution of binary star light and velocity curves. Astrophys. J. 1979, 234, 1054–1066. [Google Scholar] [CrossRef]
- Wilson, R.E. Accuracy and efficiency in the binary star reflection effect. Astrophys. J. 1990, 356, 613–622. [Google Scholar] [CrossRef]
- Ruciński, S.M. The Proximity Effects in Close Binary Systems. II. The Bolometric Reflection Effect for Stars with Deep Convective Envelopes. Acta Astron. 1969, 19, 245. [Google Scholar]
- von Zeipel, H. The radiative equilibrium of a rotating system of gaseous masses. Mon. Not. R. Astron. Soc. 1924, 84, 665–683. [Google Scholar] [CrossRef]
- Lucy, L.B. Gravity-Darkening for Stars with Convective Envelopes. Z. Astrophys. 1967, 65, 89. [Google Scholar]
- van Hamme, W. New limb-darkening coefficients for modeling binary star light curves. Astron. J. 1993, 106, 2096–2117. [Google Scholar] [CrossRef]
- Lurie, J.C.; Vyhmeister, K.; Hawley, S.L.; Adilia, J.; Chen, A.; Davenport, J.R.A.; Jurić, M.; Puig-Holzman, M.; Weisenburger, K.L. Tidal Synchronization and Differential Rotation of Kepler Eclipsing Binaries. Astron. J. 2017, 154, 250. [Google Scholar] [CrossRef]
- Liakos, A.; Niarchos, P. A photometric study of the neglected eclipsing binaries: V405 Cep, V948 Her, KR Mon and UZ Sge. New Astron. 2012, 17, 634–639. [Google Scholar] [CrossRef]
- Liakos, A. AbsParEB and InPeVEB: Software for the Calculation of Absolute and Orbital Period Changes Parameters of Eclipsing Binaries. In Living Together: Planets, Host Stars and Binaries, Litomyšl, Czech Republic, 8–12 September 2014; Rucinski, S.M., Torres, G., Zejda, M., Eds.; Astronomical Society of the Pacific Conference Series; Astronomical Society of the Pacific: San Francisco, CA, USA, 2015; Volume 496, p. 286. [Google Scholar]
- Lenz, P.; Breger, M. Period04 User Guide. Commun. Asteroseismol. 2005, 146, 53–136. [Google Scholar] [CrossRef]
- Schwarzenberg-Czerny, A. An astronomer’s guide to period searching. In Interplay of Periodic, Cyclic and Stochastic Variability in Selected Areas of the H-R Diagram, Brussels, Belgium, 22–24 July 2002; Sterken, C., Ed.; Astronomical Society of the Pacific Conference Series; Astronomical Society of the Pacific: San Francisco, CA, USA, 2003; Volume 292, p. 383. [Google Scholar]
- Montalbán, J.; Dupret, M.A. Effect of convective outer layers modeling on non-adiabatic seismic observables of δ Scuti stars. Astron. Astrophys. 2007, 470, 991–1002. [Google Scholar] [CrossRef]
- Zima, W. FAMIAS—A userfriendly new software tool for the mode identification of photometric and spectroscopic times series. Commun. Asteroseismol. 2008, 157, 387. [Google Scholar]
- Girardi, L.; Bressan, A.; Bertelli, G.; Chiosi, C. Evolutionary tracks and isochrones for low- and intermediate-mass stars: From 0.15 to 7 Msun, and from Z = 0.0004 to 0.03. Astron. Astrophys. Suppl. Ser. 2000, 141, 371–383. [Google Scholar] [CrossRef]
- Soydugan, E.; Soydugan, F.; Demircan, O.; İbanoǧlu, C. A catalogue of close binaries located in the δ Scuti region of the Cepheid instability strip. Mon. Not. R. Astron. Soc. 2006, 370, 2013–2024. [Google Scholar] [CrossRef]
- Zacharias, N.; Monet, D.G.; Levine, S.E.; Urban, S.E.; Gaume, R.; Wycoff, G.L. The Naval Observatory Merged Astrometric Dataset (NOMAD), San Diego, CA, USA, 9–13 January 2005; American Astronomical Society Meeting Abstracts; American Astronomical Society: Washington, DC, USA, 2004; Volume 205, p. 48.15. [Google Scholar]
- Bailer-Jones, C.A.L.; Rybizki, J.; Fouesneau, M.; Mantelet, G.; Andrae, R. Estimating Distance from Parallaxes. IV. Distances to 1.33 Billion Stars in Gaia Data Release 2. Astronom. J. 2018, 156, 58. [Google Scholar] [CrossRef]
- Queiroz, A.B.A.; Anders, F.; Chiappini, C.; Khalatyan, A.; Santiago, B.X.; Steinmetz, M.; Valentini, M.; Miglio, A.; Bossini, D.; Barbuy, B.; et al. From the bulge to the outer disc: StarHorse stellar parameters, distances, and extinctions for stars in APOGEE DR16 and other spectroscopic surveys. Astron. Astrophys. 2020, 638, A76. [Google Scholar] [CrossRef]
| 1. | |
| 2. | |
| 3. | |
| 4. |


| Components Parameters | Absolute Parameters | ||||
|---|---|---|---|---|---|
| Primary | Secondary | Primary | Secondary | ||
| (K) | 7450(150) | 5300(113) | () | 1.67(17) | 0.87(9) |
| 7.76(4) | 9.57(4) | () | 1.97(9) | 0.89(14) | |
| A | 1 | 0.5 | () | 11(1) | 0.6(2) |
| g | 1 | 0.32 | (cm s) | 4.07(5) | 4.48(15) |
| x | 0.455 | 0.583 | a () | 5.07(8) | 9.75(4) |
| L/ | 0.945(1) | 0.055(2) | (mag) | 2.17(6) | 5.4(2) |
| 0.133(1) | 0.060(1) | System Parameters | |||
| 0.134(1) | 0.060(1) | q (/) | 0.52(1) | ||
| 0.133(1) | 0.060(1) | i (deg) | 84.6(1) | ||
| 0.133(1) | 0.060(1) | ||||
| i | A | S/N | Q | / | l-Degree | Pulsation Mode | ||
|---|---|---|---|---|---|---|---|---|
| (d) | (mmag) | () | (d) | |||||
| 1 | 14.37417(1) | 2.550(5) | 1.8(1) | 339.3 | 0.032(2) | 0.017 | 3 or 1 | NR p |
| 2 | 14.46668(1) | 2.215(5) | 59.2(1) | 294.7 | 0.032(2) | 0.017 | 1 or 3 | NR p |
| 3 | 26.19524(1) | 1.779(5) | 32.1(1) | 236.7 | 0.018(1) | 0.010 | 2 | NR p |
| 4 | 13.91847(2) | 1.560(5) | 236.5(2) | 207.6 | 0.033(2) | 0.018 | 2 or 3 | NR p |
| 8 | 11.89034(2) | 1.070(5) | 57.1(2) | 142.4 | 0.039(2) | 0.021 | 3 | NR p |
| 10 | 17.80685(4) | 0.565(5) | 264.1(5) | 75.2 | 0.026(2) | 0.014 | 1 | NR p |
Publisher’s Note: MDPI stays neutral with regard to jurisdictional claims in published maps and institutional affiliations. |
© 2020 by the authors. Licensee MDPI, Basel, Switzerland. This article is an open access article distributed under the terms and conditions of the Creative Commons Attribution (CC BY) license (http://creativecommons.org/licenses/by/4.0/).
Share and Cite
Liakos, A.; Niarchos, P. Asteroseismic Analysis of δ Scuti Components of Binary Systems: The Case of KIC 8504570. Galaxies 2020, 8, 75. https://doi.org/10.3390/galaxies8040075
Liakos A, Niarchos P. Asteroseismic Analysis of δ Scuti Components of Binary Systems: The Case of KIC 8504570. Galaxies. 2020; 8(4):75. https://doi.org/10.3390/galaxies8040075
Chicago/Turabian StyleLiakos, Alexios, and Panagiotis Niarchos. 2020. "Asteroseismic Analysis of δ Scuti Components of Binary Systems: The Case of KIC 8504570" Galaxies 8, no. 4: 75. https://doi.org/10.3390/galaxies8040075
APA StyleLiakos, A., & Niarchos, P. (2020). Asteroseismic Analysis of δ Scuti Components of Binary Systems: The Case of KIC 8504570. Galaxies, 8(4), 75. https://doi.org/10.3390/galaxies8040075