Article

Long-Term Stability of Chemical Spots and Reasons for the Period Variations in Ap Star CU Vir

1
Institute of Astronomy of Russian Academy of Sciences, Pyatnitskaya Str., 48, 119017 Moscow, Russia
2
Institute of Solar-Terrestrial Physics, Siberian Branch of Russian Academy of Sciences, Lermontov Str. 126A, 664033 Irkutsk, Russia
*
Author to whom correspondence should be addressed.
Galaxies 2025, 13(4), 90; https://doi.org/10.3390/galaxies13040090
Submission received: 16 June 2025 / Revised: 29 July 2025 / Accepted: 4 August 2025 / Published: 12 August 2025
(This article belongs to the Special Issue Stellar Spectroscopy, Molecular Astronomy and Atomic Astronomy)

Abstract

We present the results of Doppler Imaging of the Ap star CU Vir in the silicon lines over the 1985–2011 time span, as well as multi-element imaging in the 2009/2011 epoch. The surface distribution of silicon in CU Vir exhibits stability over the approximately 26 years studied: the number, shape, and mutual distribution of the overabundance spots have remained unchanged. The modelling of the light curve based on the surface elemental distribution obtained with DI did not reveal any significant changes in the shape of the light curve that could explain the photometric phase shift observed in CU Vir. Consequently, the phase shifts and changes in the photometric period of CU Vir are caused by the rigid longitudinal drift of the surface-abundance structures. We performed simulations of the Tayler instability of the background magnetic field of CU Vir, and discuss the possibility of explaining the period variations by the drift of surface instability modes.

1. Introduction

The star CU Vir (=HD124224) is one of the most extensively studied magnetic Ap/Bp stars. In key properties, it is a typical representative of its class; however, a number of unique features attract attention to this object.
CU Vir exhibits a peculiar A0p spectrum, typical of Ap/Bp stars, with a weakened intensity of helium and an enhanced intensity of silicon lines varying in antiphase with the period of axial rotation [1]. The star also hosts a global, large-scale magnetic field with a dominant dipole component, B p 4 kG in strength [2]. Surface imaging of CU Vir revealed the inhomogeneous (spotty) surface distribution of Si, He, Fe, Cr, and Mg with abundance gradients up to +2 dex in logarithmic scale relative to the Sun [2,3,4,5,6]. Axial rotation of the spotted stellar surface leads to a modulation of the light variations of CU Vir, with an amplitude of about Δ V 0.1 mag, in accordance with the so-called “oblique rotator model” [3,7,8].
Meanwhile, CU Vir has one of the shortest rotational periods, P 0.52 d, among known Ap/Bp stars1 and demonstrates extraordinary changes. A comparison between observations obtained at different epochs allowed the detection of significant phase shifts on the decadal timescale, both in line intensity and photometric variations [11], which can be indicative of apparent rotational period changes. Employing the distribution of the surface magnetic field recovered by Zeeman–Doppler Imaging [2], MacDonald et al. [12] showed that magnetic braking due to radiatively driven wind can lead to a spin-down time consistent with the observed increase in the CU Vir period in ∼1960–2010. However, this model does not resolve two contradictions. First, as Mikulášek et al. [13] noted, this spin-down timescale is ∼2 orders of magnitude less than the age of the star. Second, braking by the magnetised wind results in a period increase only, whereas observations show a more complex behavior. Apparently, another mechanism is responsible for both the decreases and increases in the CU Vir period.
Currently, published observations of CU Vir cover the interval from 1955 to 2017 and show unambiguous evidence of such an effect. It is noteworthy that CU Vir has also been detected as a variable radio source at 1.4 GHz [14,15,16]. Its radio emission also exhibits period variations resembling so-called “glitches” in pulsars. Period changes in CU Vir can be interpreted within the framework of two different data models. First, based on O-C analysis of critically selected observations, a model with three discrete (discontinuous) period changes in 1985, 1992, and 2012 was proposed [11,17,18,19]. Within the interval between successive glitches, the model suggests a constant period. The first two abrupt period changes correspond to a deceleration in the apparent stellar rotation, and the last one corresponds to an acceleration. Although these period changes do not exceed three seconds in magnitude, given the rapid rotation of the star, such changes lead to significant phase shifts. In turn, Mikulášek et al. [13] proposed, and later updated [20], a model of continuous period variations. The data were fitted by a cosine function as well as by a 5th-order polynomial, which yielded a cycle of ∼65 years. According to this model, a slowdown of rotation was observed from 1958 to 2005. After the local maximum of the period in 2005, the acceleration of rotation began.
It has now been established that CU Vir is not a unique object, but belongs to a small subgroup of Ap stars with variable periods, although its behavior is the most complex (e.g., [18,19]). The reasons for the period variations in CU Vir and other Ap stars are currently unclear. It was pointed out that the observed rates of period changes and their character are difficult to explain through evolutionary changes in angular momentum [13,21]. In non-magnetic peculiar HgMn stars, annual changes in spot structure have been recorded [22,23,24], which also lead to changes in their very low-amplitude photometric variability [25]. In Ap stars, the spot patterns are expected to be much more stable due to the stabilising role of the magnetic field. However, the fields themselves are affected by MHD instabilities, which can lead to internal changes or rigid longitudinal drift of magnetic and associated chemical structures [26,27,28,29]. In such cases, variations in surface distribution and abundance scale of elements like silicon, which grossly affect the emergent flux, may lead to variations in the photometric period. In the context of this idea, several models have been proposed to explain period variations in CU Vir and other Ap stars by Alfvén waves [27,28] or the Tayler instability [29]. On the other hand, an independent mechanism of the free-body precession of the magnetically distorted star, which affects the visibility of the spots, was proposed even earlier [30]. In the latter case, the phase shifts arise due to small variations in the shape of the light curve with a period of several decades. Indeed, changes in the shape of the CU Vir light curve between the 1993–94 and 1997–98 seasons have been suspected [19].
A direct method to discriminate between these two scenarios is to reconstruct the surface distributions of elements contributing to the light variability on a reliable timescale. CU Vir has been frequently targeted for Doppler Imaging (DI) [2,4,5,6]. Kochukhov et al. [2] compared their surface maps recovered from 2009–2011 data with the previous maps by Kuschnig et al. [6] based on 1995 observations and pointed out the fundamental similarity of the reconstructed surface structures. The remaining minor differences could be due to differences in the imaging techniques, adopted stellar parameters, and spectral line lists. Therefore, it is of interest to compare the spot structures in CU Vir reconstructed in a uniform way over an extended time interval over which noticeable changes in the photometric period occurred and to check its impact on the light curve. These are the aims of the present study.

2. Observational Data

2.1. Spectroscopy

We collected archival as well as previously unpublished original phase-resolved spectroscopic time series of CU Vir over the interval of 1985–2011. Namely, we collected the following:
(1) Observations in the Si ii 6347 Å line obtained by A. Hatzes in February–March 1985 with the 3-m Shane telescope at Lick Obsevatory equipped with a Coudé-spectrograph and 800 × 800 px Texas Instruments CCD detector. The wavelength coverage of each spectrogram was 6332–6362 Å with a resolving power R ≈ 50,000. In total, 12 spectrograms were obtained with a uniform distribution over rotational phases. Surface silicon maps of CU Vir were published based on these data [4,5].
(2) Observations in the Si ii 6347 Å line were made in April 1994 and February–June 1996 by V. Malanushenko at the Crimean Astrophysical Observatory using a Coudé-spectrograph and CCD detector attached to the 2.6-m Shajn telescope. The wavelength coverage of the observations was 6329–6358 Å with 0.2 Å resolution corresponding to R ≈ 32,000. In total, 39 spectrograms were obtained. We used 16 of them, covering rotational period of CU Vir with a step of Δ φ 0.1 in phase.
(3) Observations in the Si II 4128/4130 Å doublet, obtained in March 1995 with the 1.93-m telescope of Haute-Provence Observatory, equipped with the AURELLIE spectrograph. A total of 19 spectrograms with good phase coverage were obtained in the wavelength range 4060–4260 Å with a nominal resolution R 20 , 000 . The multi-element DI of CU Vir was published using these data [6].
(4) Echelle spectra of CU Vir observed with the 2m Bernard Lyot Telescope at Pic du Midi Observatory were retrieved from the PolarBase archive [31]. Observations were made in spectropolarimetric mode with the NARVAL spectrograph during several observational runs between 2009 and 2011. The wavelength coverage was 3700–10,500 Å with a resolving power R 65,000. This material was used by Kochukhov et al. [2] to perform Zeeman–Doppler Imaging of CU Vir. In our study, we used 12 intensity spectra with a signal-to-noise ratio S/N ≈ 200–300.
The complete observational log is provided in Table 1. All spectra except those obtained with NARVAL were at our disposal in the already processed form and cover only short spectral region around Si ii 6347 Å and 4128/4130 Å lines. Post-processing of these data involved only corrections of the continuum level. NARVAL spectra were retrieved in ASCII format automatically processed with the Libre-ESpRIT software package [32]. Data handling consisted of combining the individual exposures, merging the echelle orders, and normalising the continuum in the spectral intervals of interest using low-order spline fitting. Water-vapour telluric lines were removed from the target spectra using an appropriately scaled spectrum of the featureless, rapidly rotating star HR 1948 observed with NARVAL in similar instrumental setting. The heliocentric correction was applied to the wavelength scale, and the spectra were also corrected for a radial velocity of R V = 3.7 km s 1 estimated from the phase-averaged spectrum.

2.2. Calculation of Rotational Phases

To calculate the rotational phases corresponding to the moments of spectroscopic observations, we explored both existing models of period changes in CU Vir: a model with discrete period glitches [18] and a model with continuous period variations [13,20]. In the framework of the former model, the star is assumed to experience three period changes: in 1985, 1993, and 2012, respectively. The following constant periods were adopted: (1) P 1 = 0.5206775 d for the interval 1958–1983; (2) P 2 = 0.5206961 d for the interval 1979–1992; (3) P 3 = 0.5207140 d for the interval 1993–2011; (4) P 4 = 0.5206987 d for the interval 2012–2017. As an alternative, we examined the cosine model of continuous period changes [20]. A more detailed discussion of these models will be presented in the forthcoming paper [33]. Here, we note that at the moments of spectroscopic observations, both models predict very close phases (as can be seen from Table 1), with a difference not exceeding Δ ϕ 0.06 .
In our study, we adopt the model Pyper and Adelman [18] for calculating the rotational phases, owing to the convenience of handling spectroscopic data obtained at different epochs. It should be noted that due to the temporal remoteness of the ephemeris zero point T 0 = 2435256.755, corresponding to the light minimum from the discussed epochs, the determination of rotational phases requires a recalculation of T 0 to the beginning of a new epoch after each period glitch.
The spectroscopic observations analysed in the present study were obtained at epochs (2) and (3). As demonstrated by our analysis of the line profiles and the Doppler maps reconstructed from them, the 1995, 1996, and 2009–2011 observations are coherently phased with the P 3 period, while the 1985 observations required the use of the P 2 period. Since the period is assumed to be constant within epoch (3), the addition of selected 1994 observations to the 1996 dataset, for better phase coverage, is justified. The same is true for the NARVAL data distributed over 2009–2011.

3. Doppler Imaging

3.1. Technique

The surface-abundance distribution in CU Vir was inversed using the Doppler Imaging technique implemented in the INVERS11 code [34], which is a non-magnetic version of the INVERS10 code. The idea of the method is to solve the inverse problem of reconstructing the surface distribution of element(s) based on a phase-resolved sequence of spectral line(s) profiles containing Doppler details arising from an inhomogeneous surface chemical composition and modulated by axial rotation [35,36]. The problem is solved by fitting the observed line profiles by theoretical spectrum. The stellar surface is divided into a grid where local line profiles are calculated by solving the non-magnetic radiative transfer equation. The elemental abundance is a free parameter determined by minimising discrepancies between the synthetic line profile integrated over the disc of the rotating star and the observations. The uniqueness of the solution of the inverse problem is achieved by using the Tikhonov regularisation method. As input parameters, the DI procedure requires (1) a series of observed line profiles with reliable coverage of the stellar rotation period; (2) a model of stellar atmosphere, an initial assumption about chemical composition, and atomic data for the examined spectroscopic transitions; and (3) stellar rotation parameters: v sin i and inclination angle i. The parameters that control the solution, i.e., the surface-abundance maps, are the grid density, which have to be matched to the achievable spatial resolution, and the regularisation parameter Λ .
As input parameters for the DI of CU Vir, we adopted the stellar atmosphere parameters from Kochukhov et al. [2]: an effective temperature T eff = 12,750 K, and a surface gravity log g = 4.3. The phase-averaged abundances of He, Si, Fe, Cr, and Mg were adopted from Kochukhov et al. [2], Kuschnig et al. [6]. Using these parameters and abundances, the LTE model of the CU Vir atmosphere was computed with the LLmodel code [37], accounting for opacity distribution due to the specific chemical composition. This model was subsequently employed in the Doppler inversion. The atomic data for the lines used in DI were critically selected from the VALD3 database [38] and are listed in Table A1. The wavelengths and oscillator strengths of the transitions were verified and corrected, where necessary, using the high-resolution spectrum of the slowly rotating normal star π Cet as a benchmark.
Given the rapid axial rotation of CU Vir with v sin i = 145 km/s, the potentially achievable resolution of DI can be estimated as Δ l 2.9 9 at the equator, i.e., 36–120 elements, depending on the spectral resolution of the observations. We employed two surface grids to compute local profiles: with a total number of 1436 cells matching the moderate resolution of historical spectroscopic time series in 1985–2011 and another with 3764 cells to fully utilise the resolution of NARVAL data for multi-element imaging. The inclination angle of the rotation axis to the line of sight was adopted as i = 47 [2].

3.2. Silicon Spots in 1985–2011

Silicon surface maps of CU Vir at four observational seasons within the 1985–2011 time span are presented in Figure 1. The distribution of silicon over the stellar surface is strongly inhomogeneous. At phase ϕ = 0.0 , an extended region with near-solar Si abundance dominates. The areas of enhanced Si abundance are grouped in three patches. A highly contrast spot with an excess [Si/H] = log ( N S i / N t o t ) log ( N S i / N t o t ) + 2 dex is located south of the equator and is visible on the limb at phase ϕ = 0.25 . At phase ϕ = 0.75 , a butterfly-like structure consisting of two Si spots with abundance [Si/H] ≈ +1.5 dex is situated on the visible disc of the star, symmetrically relative to the equator. The difference in abundance scale among the 1985, 1996, and 2009/11 maps, which were inversed using Si ii 6347 Å line, does not exceed 0.1 dex and is likely due to differences in data processing, primarily uncertainties in the continuum level of the original observational data. The Doppler map derived from the 1995 observations using the Si ii 4128/4130 Å doublet shows a larger abundance contrast; its maximum value exceeds those obtained from the Si ii 6347 Å line by 0.7 dex. Uncertainties in continuum placement (the silicon line is located in the wing of H δ ) and NLTE effects are possible reasons for this discrepancy. Nevertheless, the silicon spot pattern remains consistent across different seasons and aligns with previous DI results [2,6].
A comparison of the maps in Figure 1 reveals a clear stability of the spot pattern from season to season. The number of spots and their mutual position remained unchanged. The geometry of the main regions and the abundance scale (considering the higher contrast in the 1995 map due to employment of the Si ii 4128/4130 Å doublet) are also preserved, even in the fine details. A characteristic example is the low-contrast “bridge” from the north pole to the spot at longitude l 100 , passing through the region of near-solar silicon abundance, which is clearly visible in the figure at phase ϕ = 0.25 in all seasons. The maps also did not reveal any significant latitudinal changes in spot positions, which would be expected in the case of precession of the stellar rotational axis. Thus, the DI results demonstrate the stability of the silicon spot structure in CU Vir over the 1985–2011 interval, including at least one abrupt period change in 1992. The consistency between the maps derived from the 1985 dataset and those from subsequent years indicates that the period increase of about + 3.15 s detected from photometry between 1983 and 1993 was caused by a rigid longitudinal shift of the spot pattern.

3.3. Light Curves in 1985–2011

To investigate whether the possible changes in the light curve shape reported by Pyper and Adelman [19] were caused by seasonal variations in the surface distribution of silicon, we calculated synthetic light curves based on the obtained Doppler images. The methodology and technique of these calculations are described in detail in Pakhomov et al. [39] and in a forthcoming paper by Pakhomov and et al. [33]. In general, the process involves computing local radiation intensities across the stellar surface, taking into account opacity due to the specific abundance distributions revealed by DI. This is followed by disc integration of the local intensities, taking into account the limb darkening, for all rotational phases. Convolution of the emergent flux with the passbands of the photometric filters yields synthetic light curves suitable for comparison with observations.
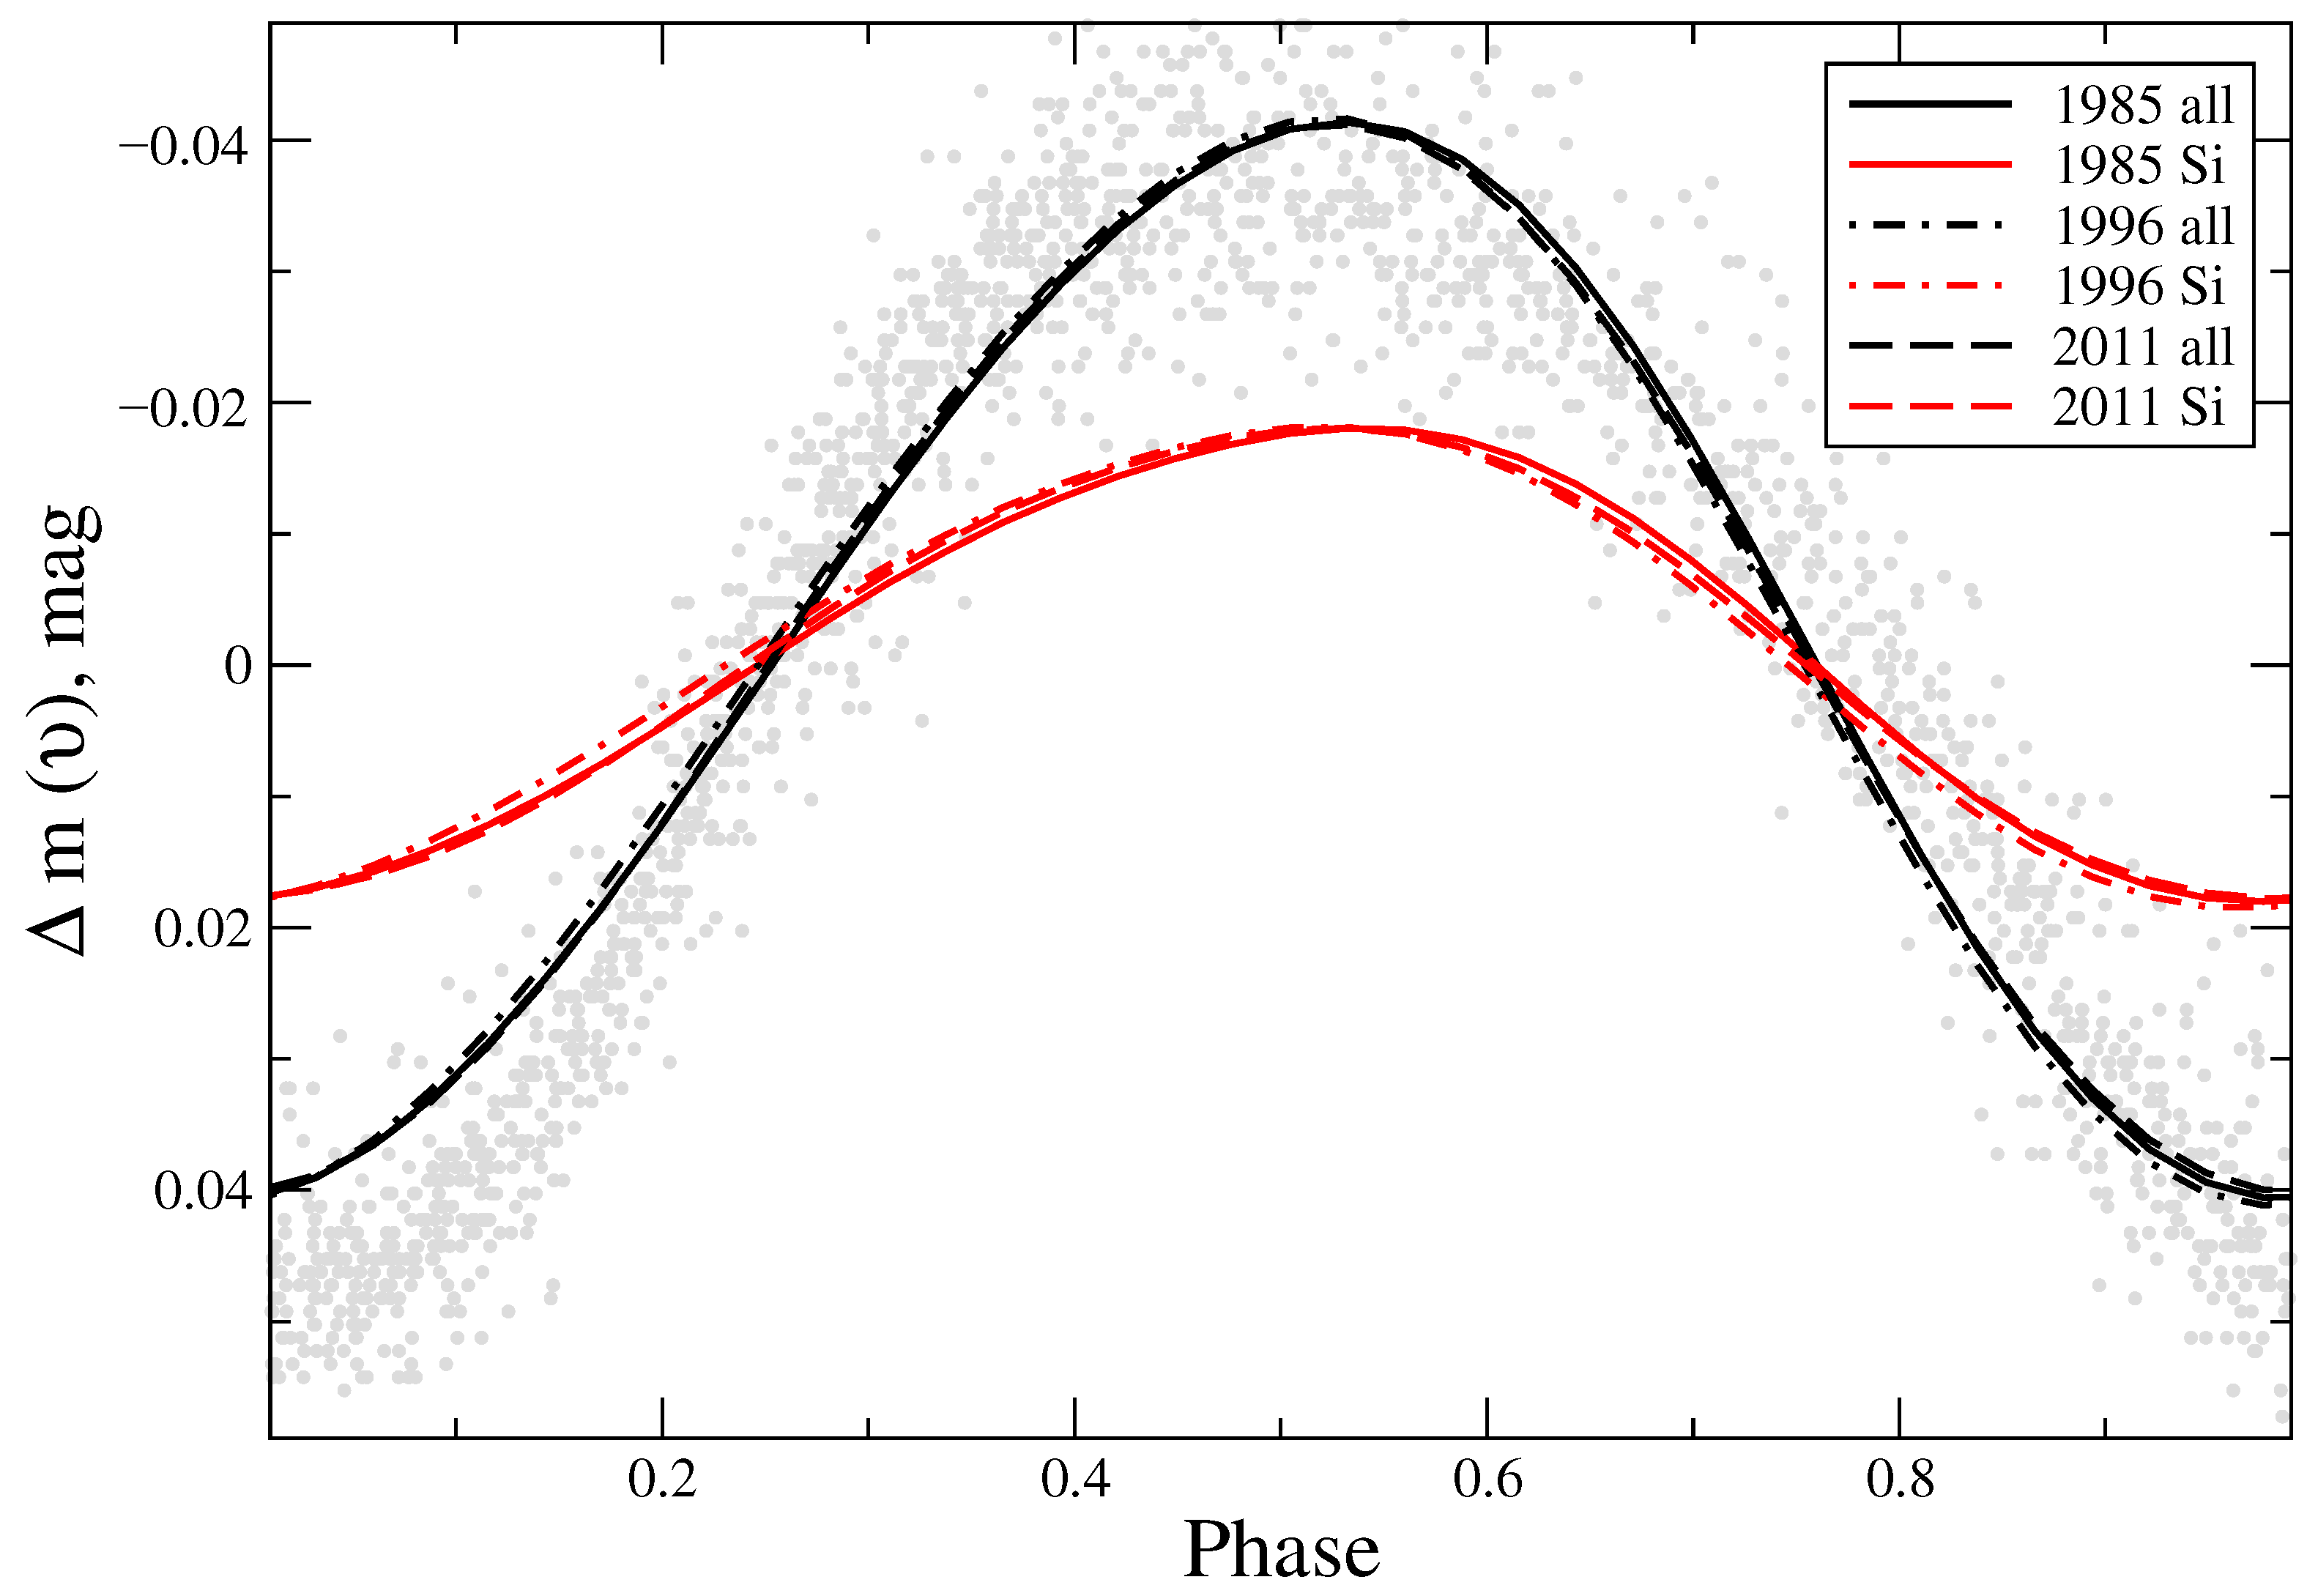
To calculate the synthetic light curves of CU Vir, we employed surface silicon distributions for the 1985, 1996, and 2009/11 seasons (the 1995 map was omitted because it was obtained from a different Si ii 4128/4130 Å doublet). The distributions of helium, iron, and chromium, elements that also contribute to the emergent flux, were taken from multi-element imaging based on 2009/11 data. The results are shown in Figure 2 in comparison with the observational light curve in Strömgren v filter [17]. One can see that the shape of the light curves, acounting for the contribution of silicon alone, is reproduced perfectly from season to season, remaining well within the scatter in the observational data. The synthetic curves, which incorporate the silicon distribution as well as that of other considered elements, reproduce well both the amplitude and shape of the observed light curve. A more detailed discussion on the modelling of the light curves of CU Vir will be presented in a related paper [33].

3.4. Multi-Element DI

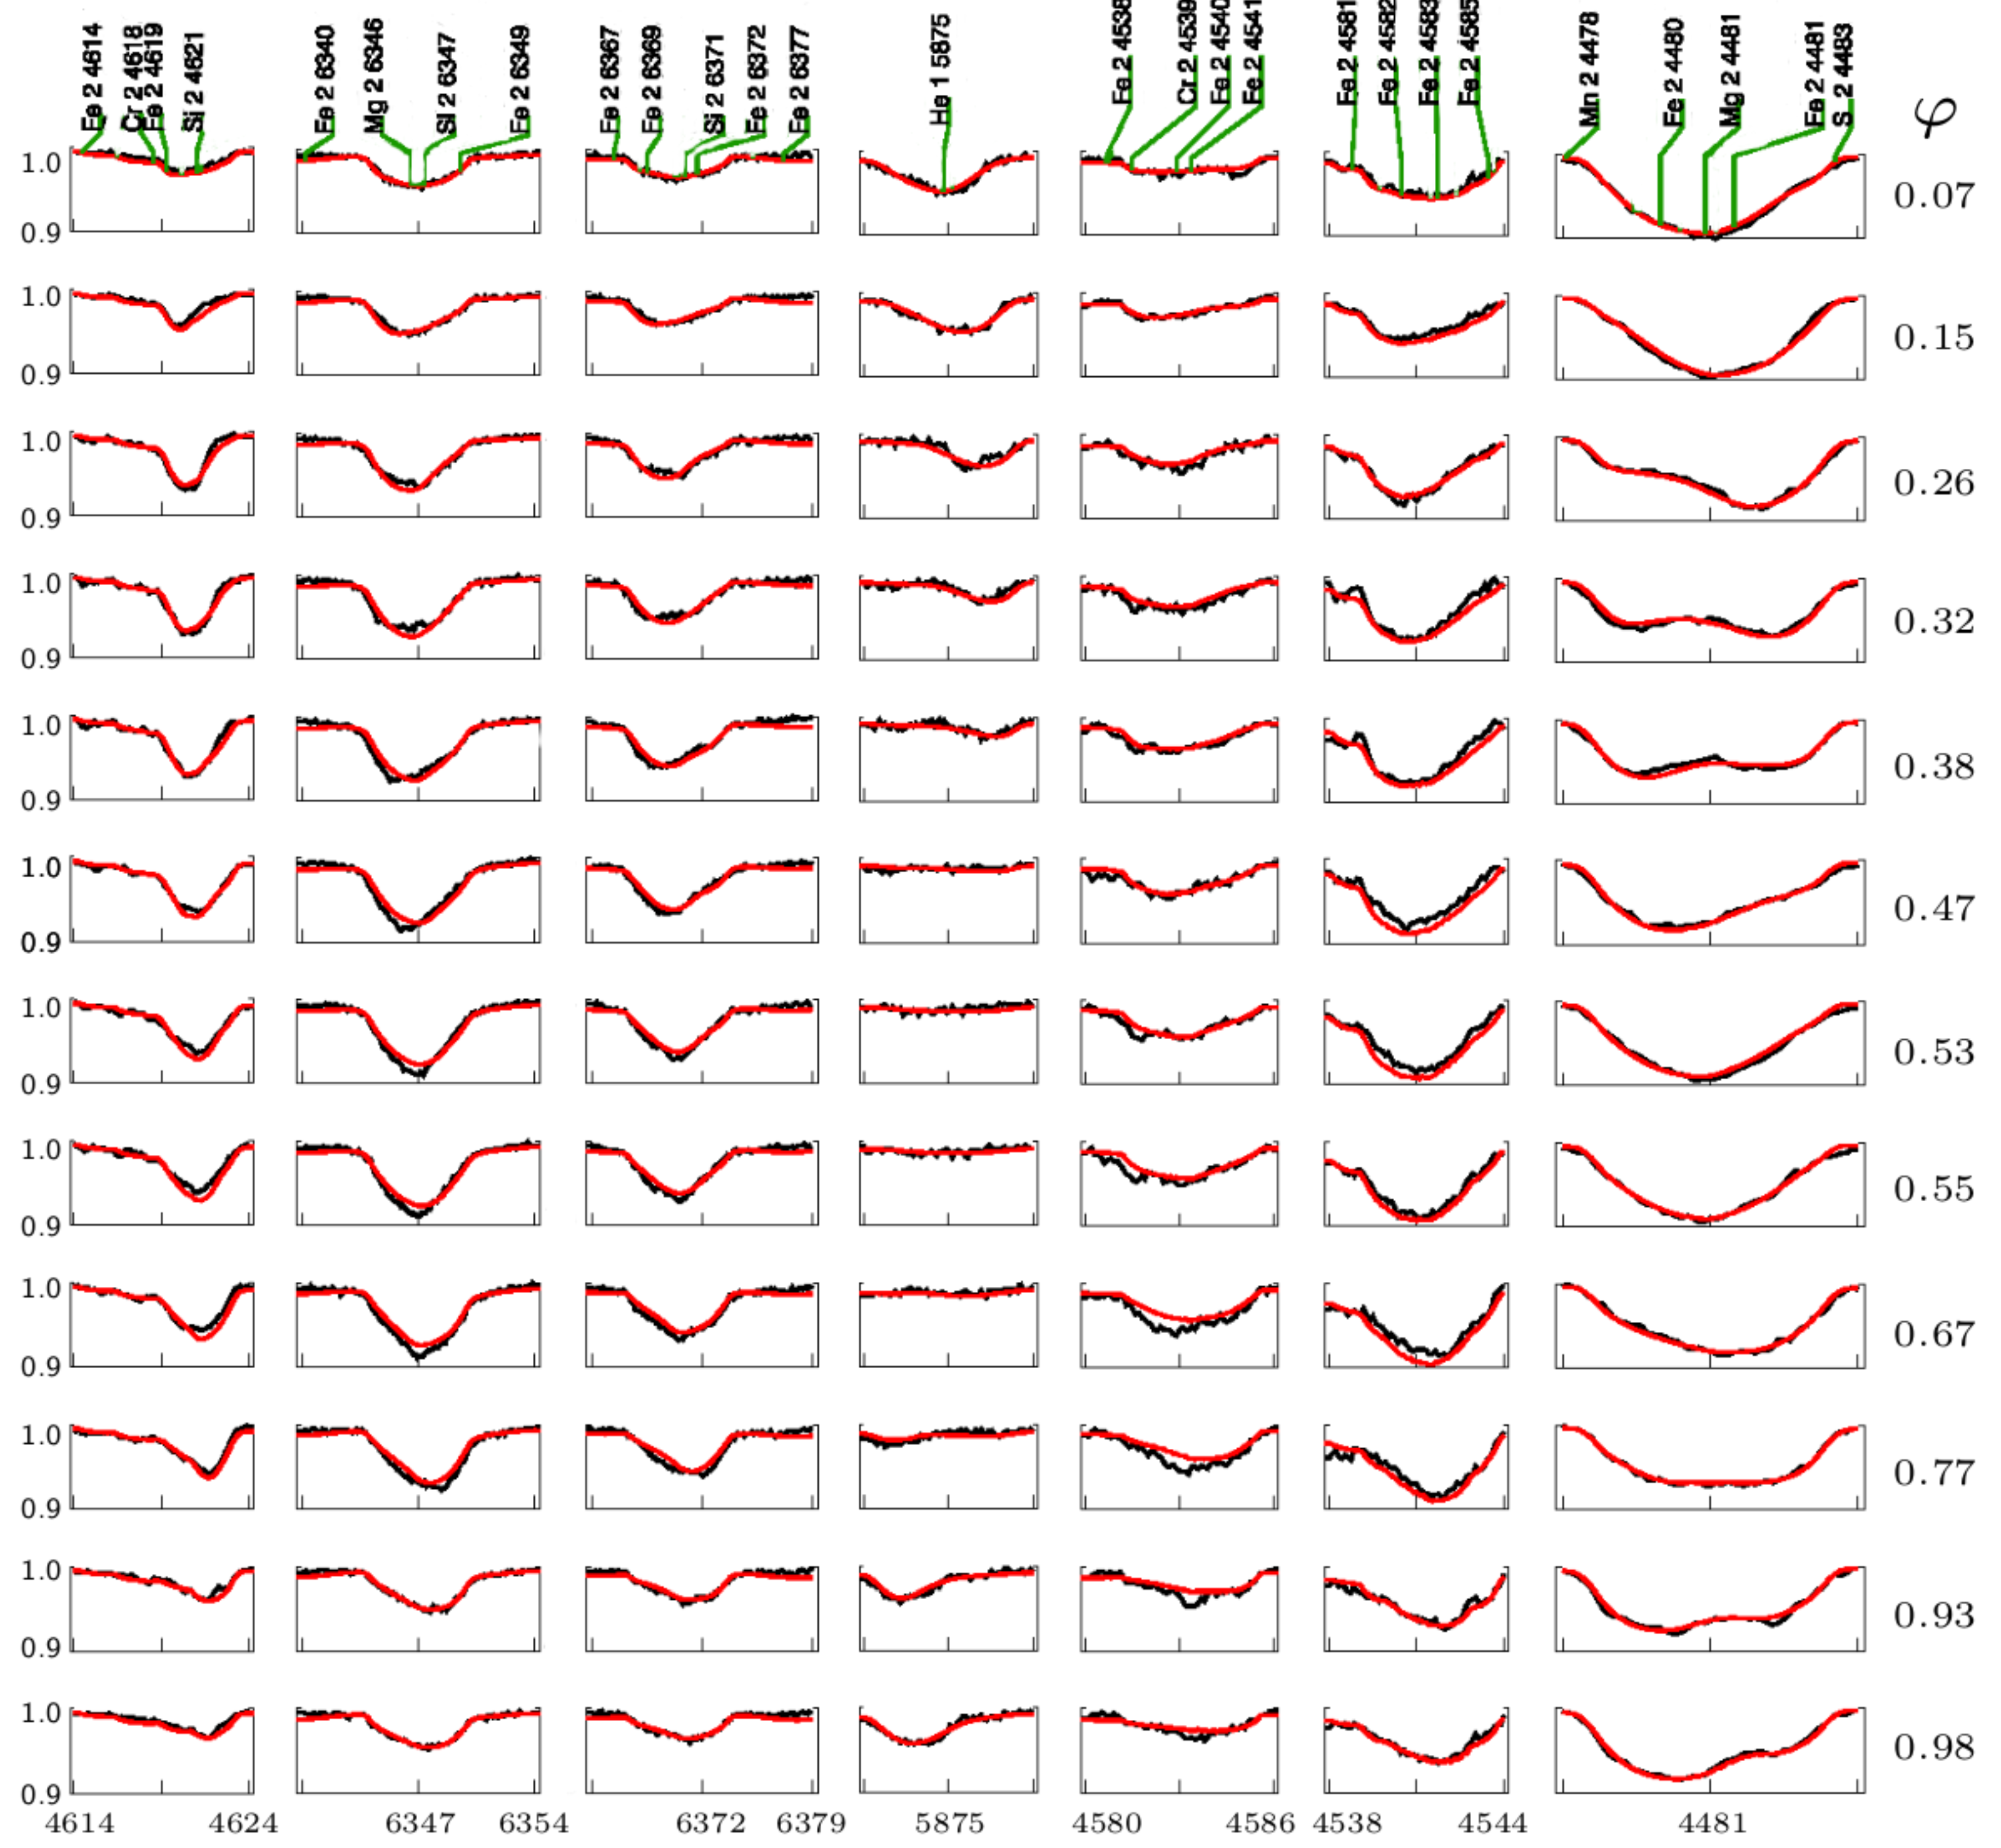
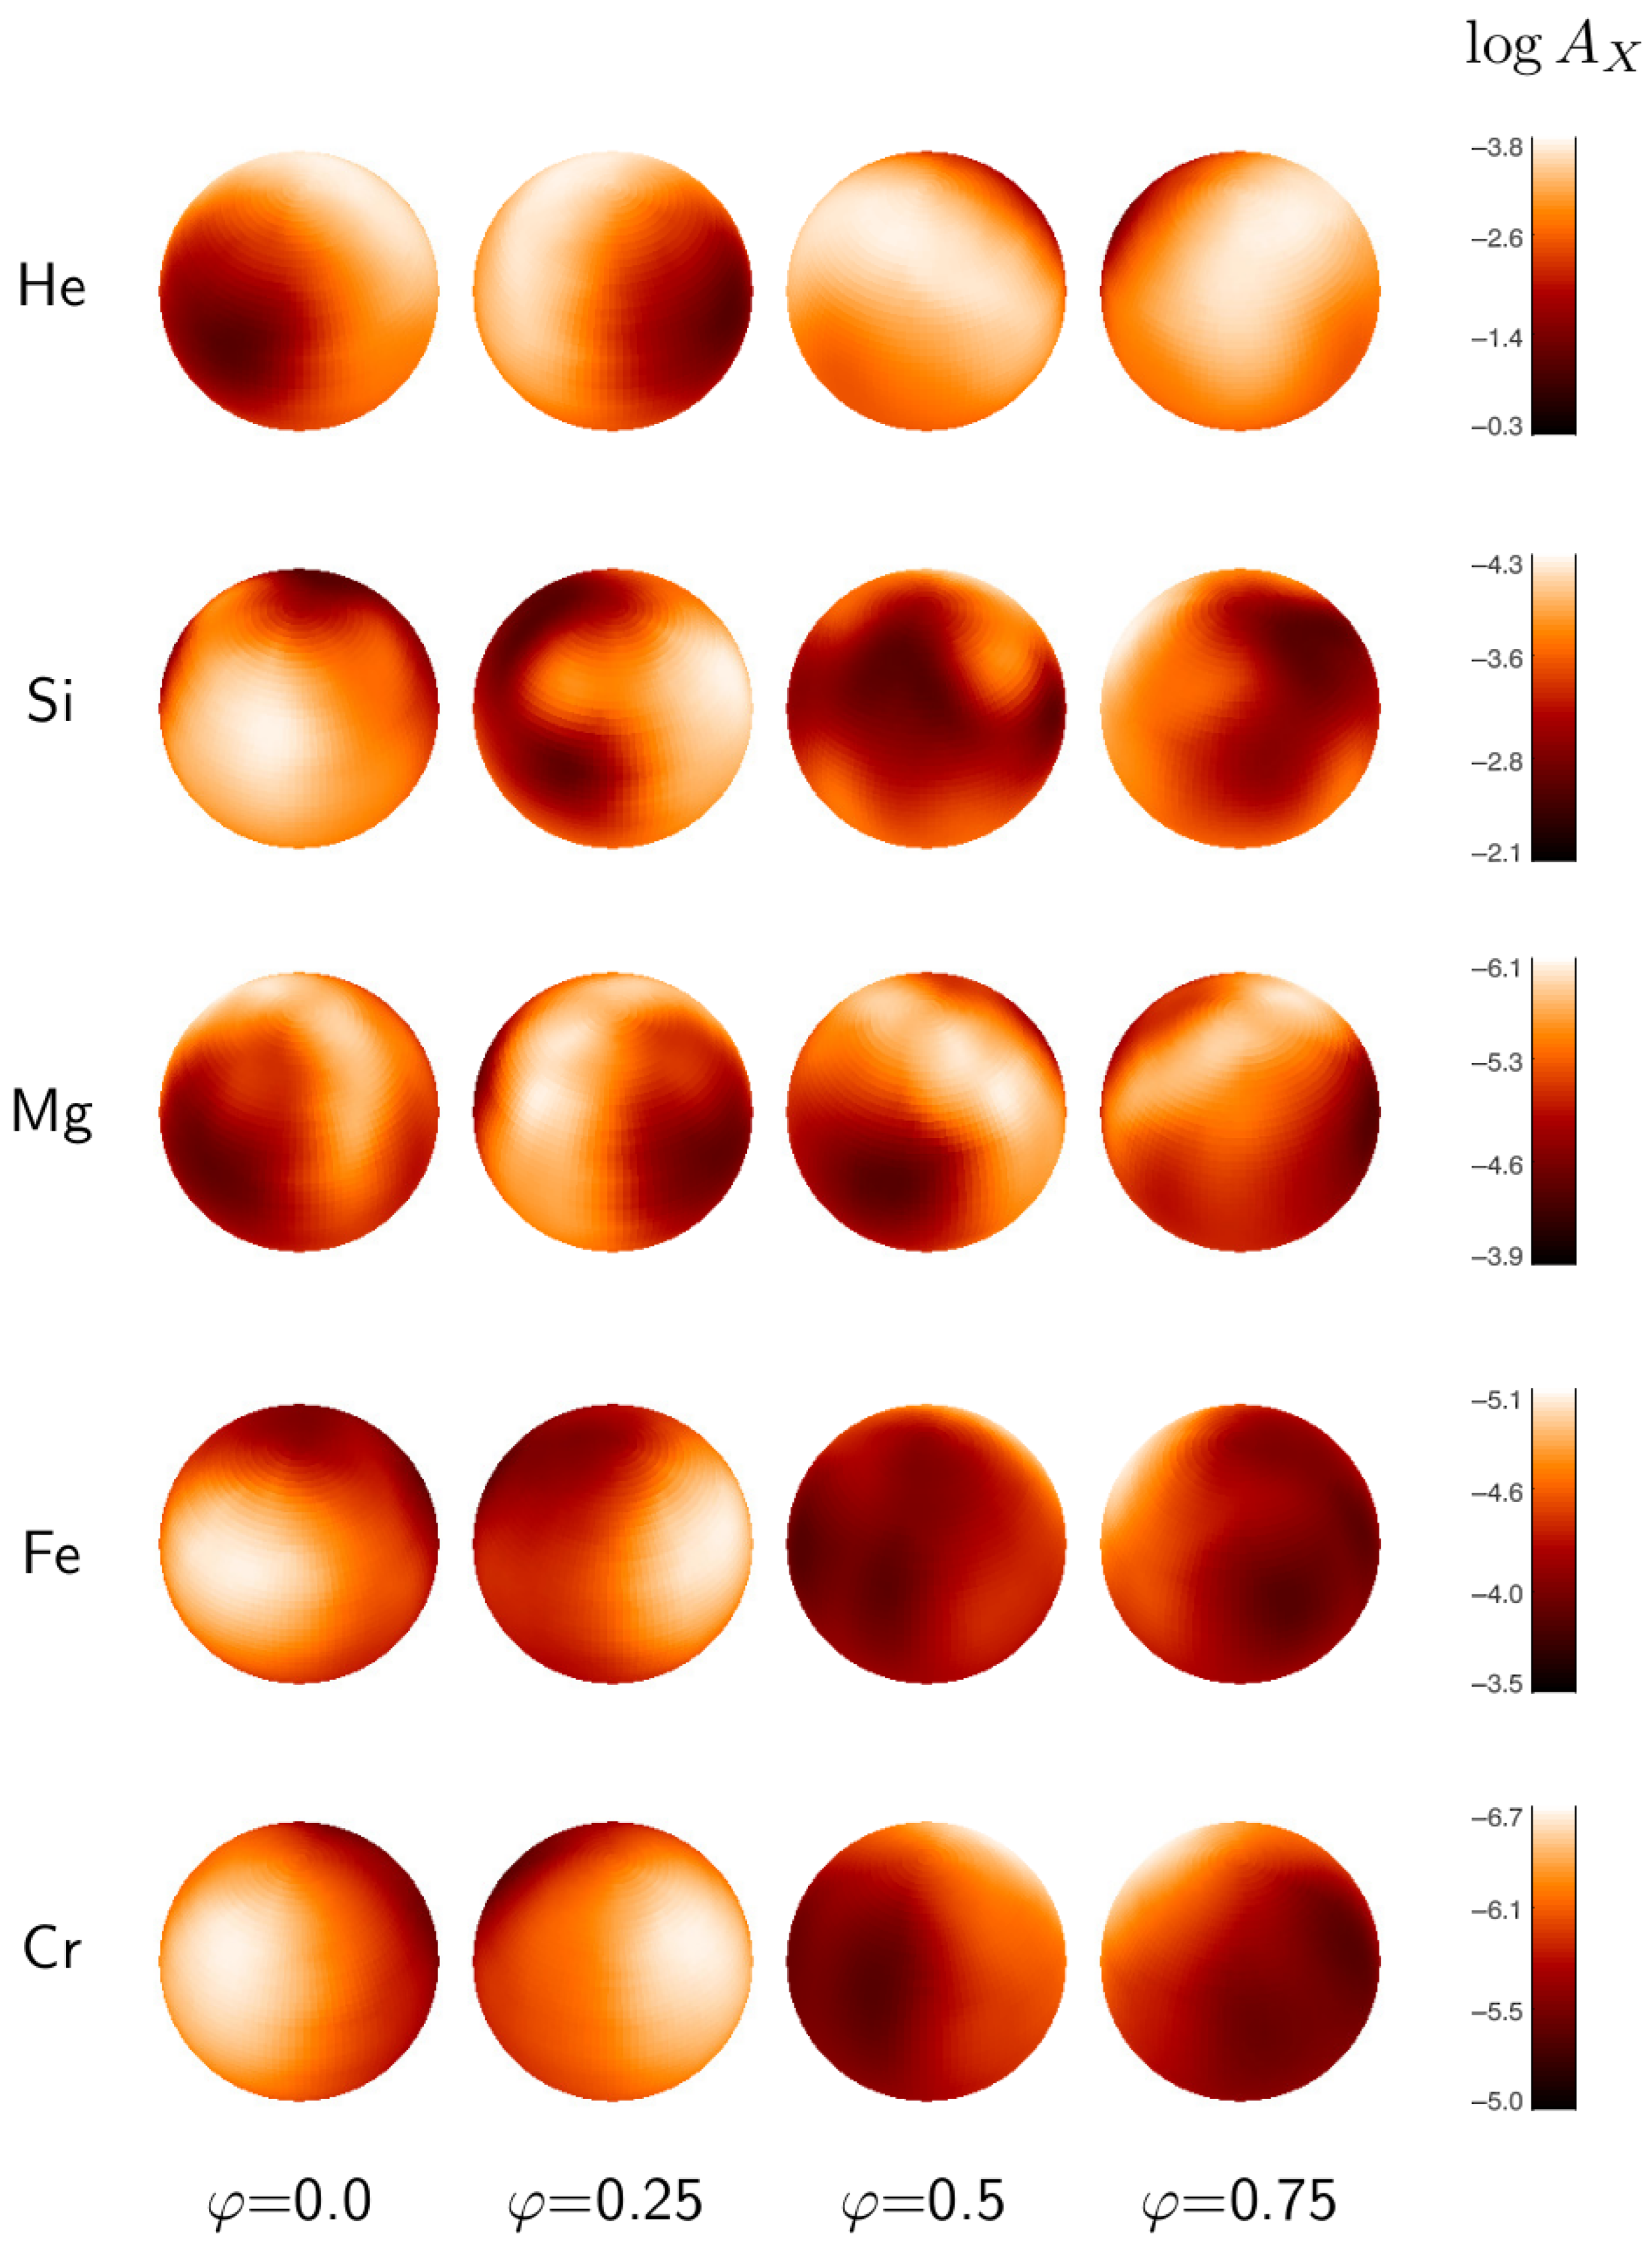
Taking advantage of the wavelength coverage and high resolution of NARVAL spectra, we performed multi-element DI with the aim of further light-curve modelling over a broad wavelength range. Since the lines in the spectrum of CU Vir are significantly broadened by rotation, the challenge was to select moderately blended lines suitable for imaging. We performed the selection procedure using the spectrum of the slowly rotating, chemically normal star π Cet as a reference, and the results are presented in Table A1. In general, the set of elements for which DI is feasible in CU Vir: He, Mg, Si, Fe, Cr is the same as used by Kochukhov et al. [2], Kuschnig et al. [6]. Since the lines of these elements were most often blended with iron lines, we made a special effort to select appropriate Fe lines. In subsequent Doppler inversion, we also added one or two reliable iron lines to the input dataset and performed simultaneous imaging of the element of interest and iron. The contribution of the variable iron blend was controlled by comparing the multi-element maps with those obtained using Fe lines only. The results of fitting the observed line profiles with theoretical ones are presented in Figure 3. The multi-element Doppler images are shown in Figure 4.

3.4.1. Helium

To reconstruct the surface helium distribution, we used two He i lines at 4471 and 5876 Å each consisting of several components. The phase-variable contribution of Fe and Ti to the He i blend at 4471 Å was taken into account. The final abundance map is shown in Figure 4. The average helium abundance over the surface of CU Vir appears to be depleted by ∼ 1 1.5 dex with respect to the Sun. The region of lowest He abundance (up to [He/H] ≈−2 dex) forms a ring contribution 30 wide, inclined at ∼ 25 to the equator. At phase ϕ 0 a single spot with relatively enhanced helium abundance dominates between latitudes 0 30 . It should be noted that this spot exhibits an internal abundance gradient featuring a compact high-contrast centre and a more extended “penumbra”. The artificial origin of this effect is doubtful, as the regularisation parameter was properly chosen. On average, the He abundance within the spot is near-solar.

3.4.2. Magnesium

We traced the surface distribution of magnesium in CU Vir using the single strong Mg ii 4481 Å line which exhibits prominent variability. The surface map revealed an abundance gradient [Mg/H] ranged from +0.6 to −1.7 dex. The region of depleted Mg abundance also forms a ring resembling that observed in the helium distribution. Two spots with slightly oversolar abundance are visible at phases ϕ 0 and 0.5.

3.4.3. Silicon

The surface distribution of silicon was reconstructed using a set of Si ii 4621, 5041, 5056, 6347, 6371 Å, lines which are formed at different depths in atmosphere and affected differently by non-LTE effects. Generally, the spot pattern obtained using these lines is similar to that described in Section 3.2. The surface distribution of silicon is remarkably anticorrelated with that of helium. However, the use of different silicon lines and their combinations for DI results in different abundance scales. All lines yield a minimum abundance of [Si/H] ≈ +0.4, slightly above the solar value. At the same time, DI using the set of Si ii 4621, 5041, 5056 Å lines with energies E l o w = 10 12 eV yields maximum abundances in the silicon spots that are ∼0.5 dex higher than those derived from the pair of Si ii 6347, 6371 Å lines with energies E l o w = 8.2 eV. NLTE calculations at the given effective temperature suggest negative corrections for these latter lines [40]. Roughly simulating this effect by applying a correction to the oscillator strengths Δ g f = 0.3 we were able to converge the abundance scales and obtain a resonable good profiles fit to the profiles of various silicon lines. Previously, the line-to-line scatter and even changes in the shape of the lines’ profiles with different excitation energies at the same phases were noted by Kochukhov et al. [2] and attributed to the effects of vertical element stratification in the atmosphere of CU Vir. We also admit this possibility and note a contrast difference between the two spots at phases φ = 0.25–0.5: from the full set of Si ii lines, the northern spot appears more contrasted, whereas from only the Si ii 6347, 6371 Å the southern spot shows greater contrast. This may either be an artificial effect or tentative indication for the different vertical stratification profiles across the different regions of the star.

3.4.4. Iron

For the inversion of the iron distribution, we fitted spectral regions 4512–4524, 4538–4544, and 4580–4586 Å dominated by iron blends with reliable atomic parameters available in VALD3 database. The surface distribution of Fe is characterised by an extended region at phase φ = 0 depleted by 0.6 dex relative to the Sun, and two distinctly separated compact spots at φ = 0.6 , located between the equator and + 30 latitude. The Fe overabundance in these spots is of the order of + 1 dex. Although not exactly identical, the distribution of iron resembles that of silicon.

3.4.5. Chromium

The isolation of unblended chromium lines amidst such rotational broadening of profiles is a challenging task. We used blends containing the strongest chromium lines Cr ii 4539, 4554, 4558 Å and fitted them simultaneously with the iron lines. The resulting chromium distribution is identical to that of iron, as expected due to the very similar energy configurations and term structures of these elements. We found 0.4 dex depletion of chromiun in a large region at phase φ = 0 and an overabundance reaching up to +1.5 dex in a double spot near phase φ = 0.6 .

4. Tayler Instability of Magnetic Field in CU Vir

Previously, we proposed an explanation for the observed linear increase in the rotation period of another Ap star, 56 Ari, in terms of the Tayler instability of its magnetic field [29]. Here, we explore the possibility of applying this explanation to period changes in CU Vir.
The dominant component of the magnetic field in radiative stellar interiors is believed to be an axisymmetric toroidal field [41], which may currently be understood within a paradigm of a relic origin [42,43] and shaped by differential rotation, or as the product of stellar merging [44,45]. As demonstrated by Tayler [46] and Pitts and Tayler [47], such a field can be unstable to non-axisymmetric disturbances, producing longitude-dependent instability modes. These modes can shape the surface magnetic fields of Ap/Bp stars [48,49]. An important feature of these modes, relevant to the observed change in photometric periods, is their rigid longitudinal drift [50,51]. The magnetic field drags ions in surface chemical spots, causing them to drift, which results in an apparent change in the photometric period.
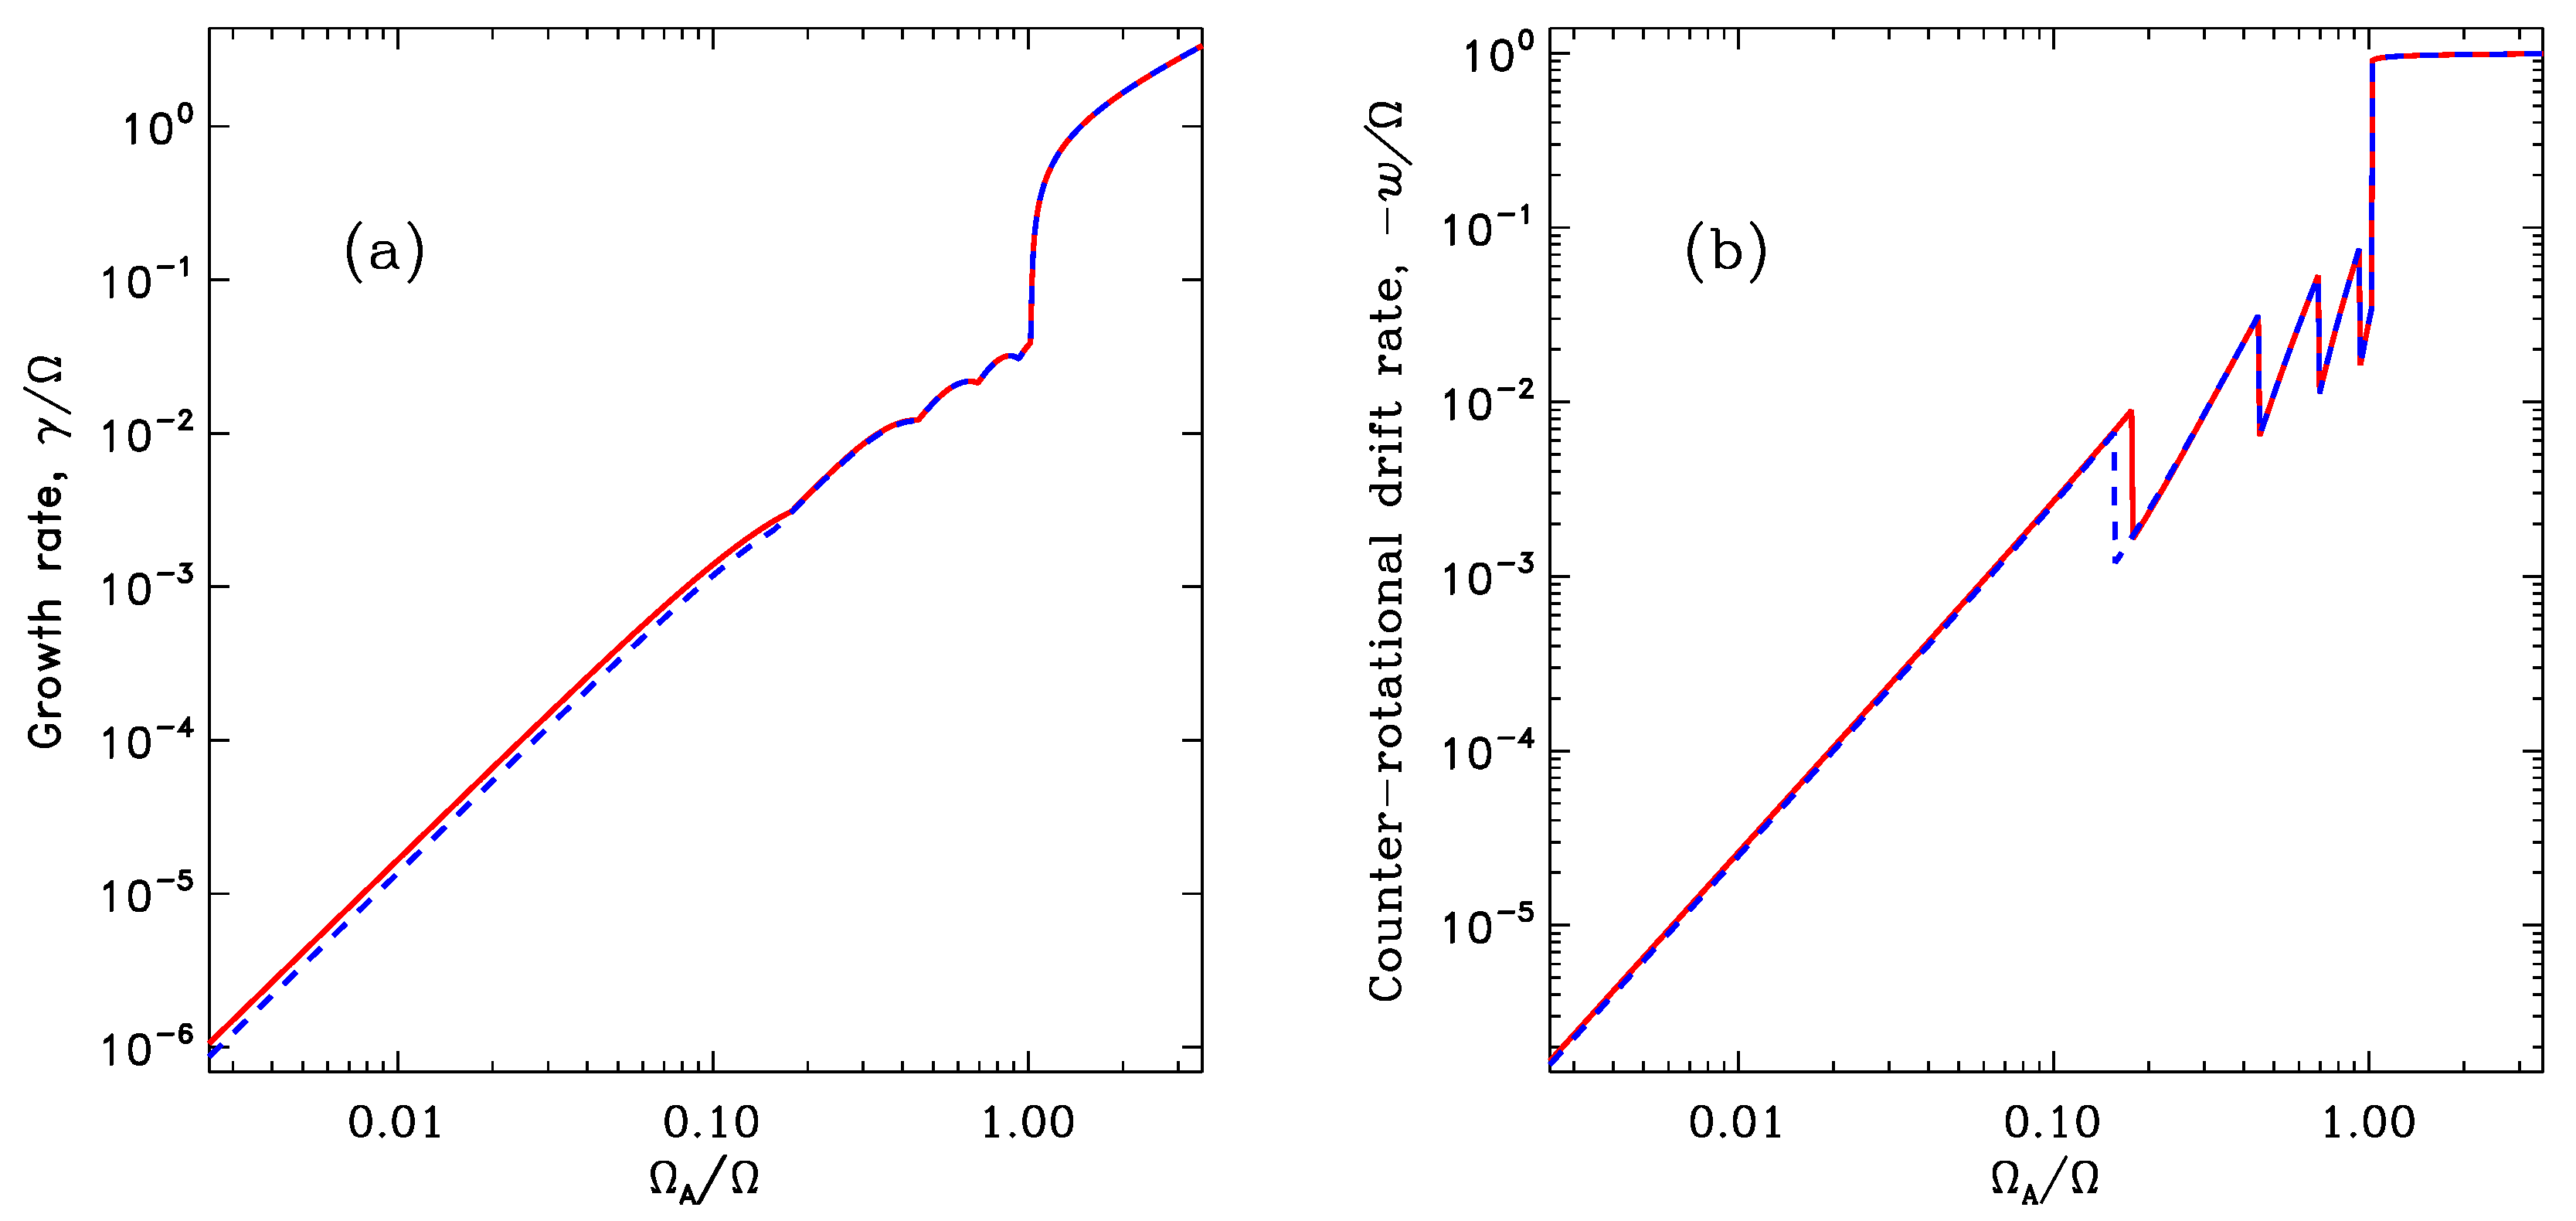
We performed computations of the Tayler instability of the CU Vir internal magnetic field using the model by Kitchatinov and Rüdiger [52] and Kitchatinov [53]. The basic equations and a discussion of application of the model to an Ap star with a variable period can be found in Potravnov and Kitchatinov [29]. We generally assume a simple toroidal axisymmetric configuration of the internal magnetic field, B = 4 π ρ sin ϑ r Ω A , where r is the radius, ϑ is the co-latitude of the standard spherical coordinates, and Ω A is the angular Alfvén frequency. We solve numerically the eigenvalue problem of the field stability to define the instability patterns and the corresponding eigenvalues in dependence on the background field strength. The dominant mode of the instability has an azimuthal wave number of m = 1 [54]. The dependence of the mode on the longitude ϕ can be combined with its exponential time-dependence, exp ( i ϕ i ω t ) . The complex eigenvalue, ω = i γ + w , includes the (real) growth rate γ and the frequency w. Any constant value of phase, ϕ w t = c o n s t , of an eigenmode drifts in longitude at a rate of ϕ ˙ = w . The frequency, w, is therefore the rate at which the eigenmode pattern drifts azimuthally. In the co-rotating reference frame, all drift rates are negative [51], meaning counter-rotational migration of the instability patterns.
Tayler instability can develop fine spatial structure in latitude [55]. Our model employs series expansion in the (associated) Legendre polynomials P l m ( cos ϑ ) for latitudinal dependence of the eigenmodes. The expansion with maximum l = 100 ensured sufficient numerical resolution for sometimes emerging small-scale latitudinal structure.
The key parameter of the model is the background (internal) field strength normalized to the energy equipartition value, Ω A / Ω . Ω A / Ω < 1 means a relatively weak (sub-equipartition) field, where the magnetic energy density is smaller than the rotational kinetic energy; Ω is the angular velocity of the star. A reversed inequality, Ω A / Ω > 1 , indicates a strong (superequipartition) field. Another governing parameter is the normalized radial wavelength, λ ^ = N / Ω k r , where N is the Brunt–Väisälä frequency and k is the radial wave number. The model also accounts for finite diffusion. A stellar structure model is needed to specify these parameters. For this purpose, we used the M E S A evolutionary model of stellar internal structure [56]. For a star with M = 3.06 M and metallicity Z = 0.015 at the age of 1.64 × 10 7 y, M E S A yields a radius R = 1.974 R and an effective temperature T eff = 12,747 K close to the observed parameters of CU Vir. This model of internal structure is therefore was used in the computations for CU Vir.
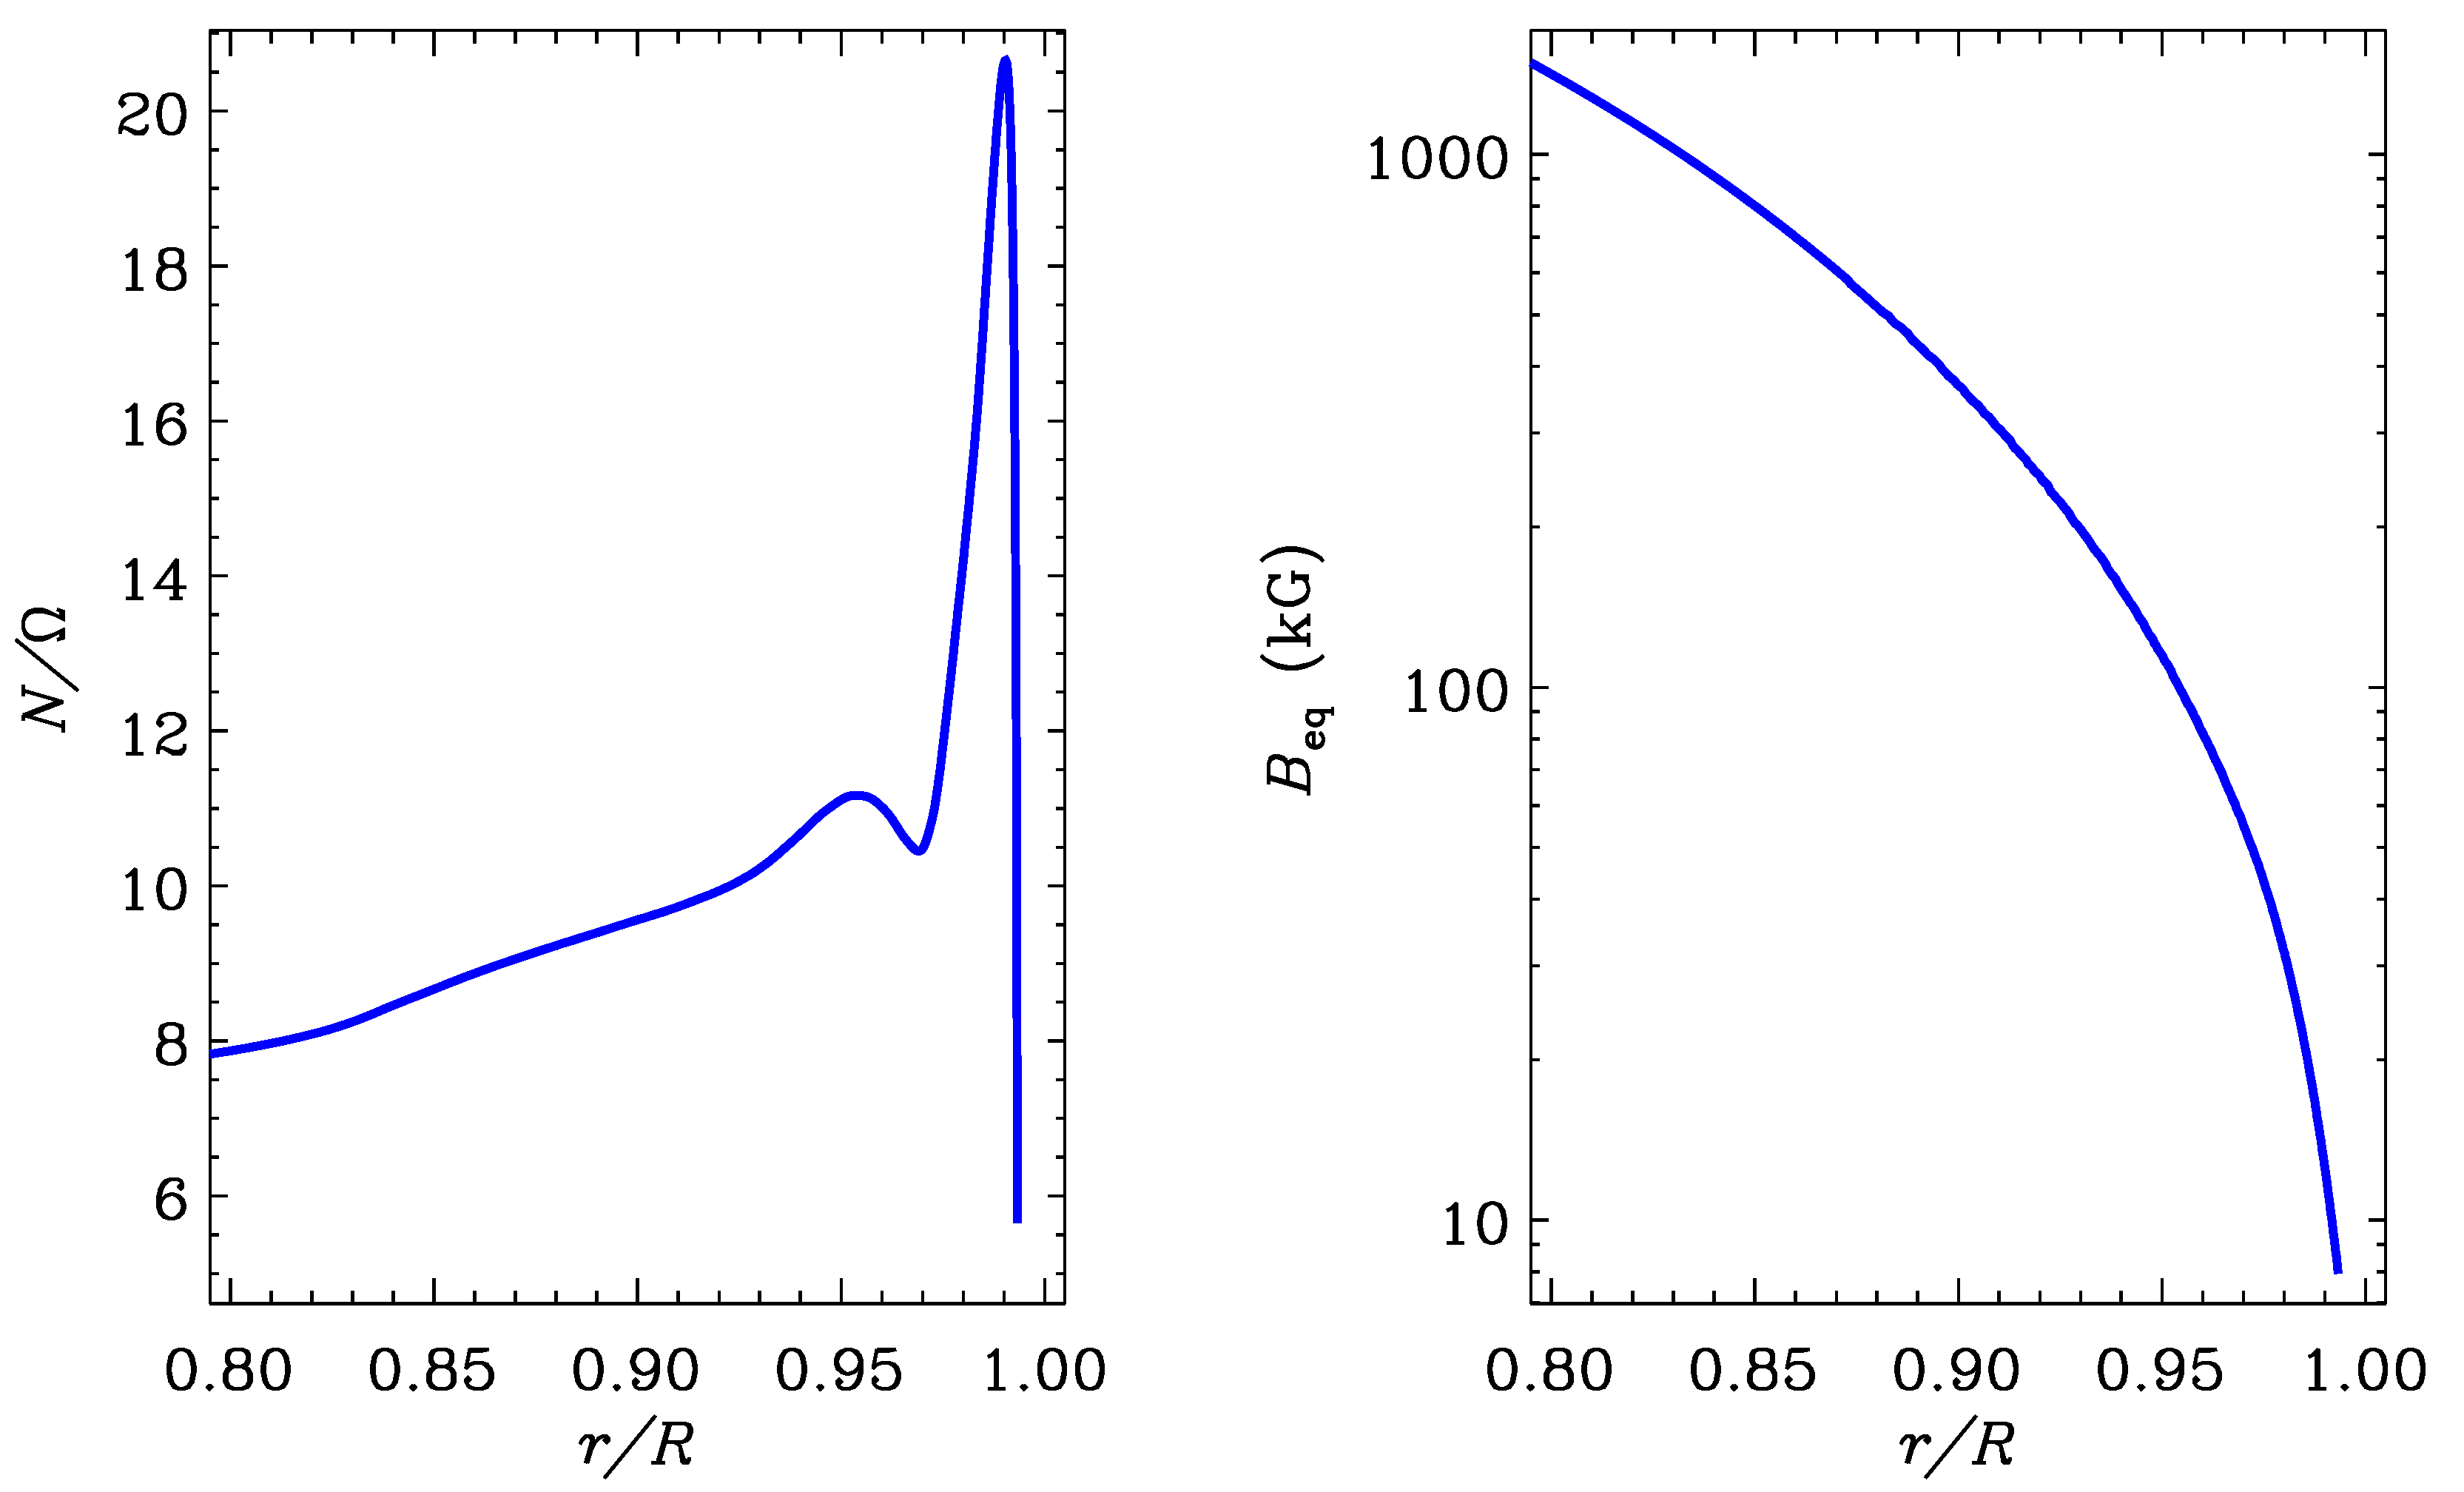
Given the similarity of the 56 Ari and CU Vir parameters, we expectedly obtained quite similar results. Figure 5 shows the radial profiles of the N / Ω ratio and equipartition field strength B e q = π ρ r Ω . Since the largest growth rate of the Tayler instability corresponds to λ ^ 0.1 [52], we took the stellar parameters at r / R = 0.93 , which is approximately one radial wavelength below the surface. The computed growth and drift rates are shown in Figure 6 as a function of the background field strength.
Our instability model is global in horizontal dimensions. It allows for two types of solution: symmetric and antisymmetric about the equator. The symmetric modes have somewhat larger growth rates, as can be seen in Figure 6a. The following discussion refers to this type of symmetry. The family of equator-symmetric modes also consists of a set of modes with different growth rates and spatial structures. The growth and drift rates of Figure 6 belong to the so-called dominant modes, which grow most rapidly. However, which particular mode is dominant depends on the background field strength. This is why the plot of Figure 6a for Ω A > 0.1 Ω is wavy. The kinks in the plot occur at field strengths where the maximum growth rate changes between eigenmodes of different shapes (cf. Figure 7). The growth rates depend continuously on the field strength. However, the drift rates differ between the modes that are dominant at different strengths of the background field. This explains the saw-like section of the plot of the Figure 6b.
Since oscillations in growth and drift rates are associated with changes in dominant (fastest growing) modes of instability, an important consequence is also a change in the spatial structure of the surface magnetic field. Figure 7 shows the patterns of the different dominant modes for several strengths of the background field. For Ω A / Ω 0.7 the equatorial dipole with obliquity β 90 dominates, which is consistent with observed in CU Vir β = 76 [2]. As the field strength increases, new structures appear at high latitudes and, for Ω A / Ω > 1 , the dominant mode shifts to the poles.
A comparison of Figure 5 with the observed strength of the surface magnetic field of CU Vir suggests that Ω A / Ω 10 2 . This indicates that CU Vir lies in the sub-equipartition region, where w Ω A 2 in the plot of Figure 6b. Variations in the strength of the background field will produce smooth changes in drift velocity (and photometric period), like in the case of 56 Ari. However, a much stronger background field ( Ω A / Ω 0.1 1 ) is required for a transition to a regime in which abrupt changes in the drift velocity of the dominant instability mode occur.

5. Discussion

5.1. Surface-Abundance Distributions in CU Vir and Their Stability

With the DI technique we reconstructed the surface distribution of elements in the chemically peculiar star CU Vir. We obtained surface-abundance maps for five elements: Si, He, Fe, Cr, and Mg using the 2009/11 observations. For the first time, we reconstructed the silicon distribution in a uniform manner across four observing seasons spanning from 1985 to 2011, when the star exhibited notable changes in its photometric period.
Comparison of our DI results with previous studies allows us to validate abundance maps of CU Vir obtained using slightly different approaches and updated atomic data. In terms of spot geometry, the results show very good agreement with earlier imaging [2,5,6]. The abundance scales may differ to some extent depending on the line lists and the atomic data employed. A comparison of the maps (Figure 4) reveals very similar distribution patterns for silicon, iron, and chromium featuring a double spot near the negative magnetic pole (as inferred from the magnetic curve in Figure 6 by Kochukhov et al. [2]) and an extended region of decreased abundance near the positive pole. On the contrary, helium and magnesium in this latter region exhibit large overabundant spots, while areas of elemental deficiency form rings tilted relative to the equator of rotation.
A comparison of the surface distribution of silicon in 1985, 1995, 1996, and 2009/11 revealed them to be exactly identical. Over ≈26 years, within the accuracy of our maps, neither the shape nor the mutual location and the abundance scale of silicon spots has changed. Previously, we obtained the same result based on ∼30 years observations of another Ap star with a variable period-56 Ari [57]. In contrast to 56 Ari, which is observed equator-on, CU Vir is viewed at an intermediate inclination angle. This means that the DI solution is not affected by the mirror degeneration, and the latitudinal distribution of spots can be reconstructed reliably. Nevertheless, as in the case of 56 Ari, we could not detect latitudinal variations in spots distribution in CU Vir over the examined time span that might indicate a precession of its rotation axis. Synthetic light curves computed from our Doppler maps for different seasons did not show variations exceeding the dispersion of photometric observations. Thus, there are no decadal variations in the surface distribution of silicon, and these do not account for the previously reported changes in light-curve shape between different seasons. Since we traced the secular behavior of silicon only, it is possible that light-curve changes could be caused by variations in the surface distribution of other elements. Indeed, the model of atomic diffusion in Ap/Bp stars in the presence of electric currents [26] predicts the possibility of slow variations in the relative surface abundances of different elements. Therefore, it is of interest to obtain follow-up spectroscopic observations of CU Vir and to perform multi-element DI for comparison with the 2009/11 images.
However, the conventional treatment of selective atomic diffusion suggests a similar character for silicon and iron-peak elements. This is supported by our multi-element DI results for CU Vir using the 2009/11 observations. Therefore, based on the currently available data, we conclude that the spot pattern in CU Vir remained stable between 1985 and 2011. At the same time, variations in the photometric period of the star imply a rigid longitudinal drift of this pattern. Below, we discuss one of the possible explanations for such a drift.

5.2. Period Changes and Longitudinal Drift of Magnetic and Abundance Structures

We modelled the Tayler instability of the background magnetic field of CU Vir, which results in a longitudinal drift of surface magnetic patterns. We also propose that such a drift could be responsible for the observed change in the star’s rotation period. A comparison between the global magnetic field strength (measured at the stellar surface) and our calculations shows that the instability operates in the sub-Alfvénic regime, leading to only a linear change in drift velocity. However, this is inconsistent with observations. A much stronger magnetic field is required for the instability to switch to the dominant mode, which leads oscillating changes in drift velocity.
Regarding this issue, we have two remarks. Firstly, the background field is the star’s internal magnetic field, which can be much stronger than the field observed at the surface. Secondly, in our model, we normalise the field strength to B e q . In turn, the equipartition field strength B e q depends on depth and decreases towards the stellar surface. Therefore, an increase in the normalised field can occur when the magnetic field rises without a change in the strength of the magnetic structure under consideration.
Let us suppose that we have overcome the difficulties associated with the amplitude of the background magnetic field and deal with Tayler instability in a regime of changing dominant modes. Is it possible to explain the observed change in CU Vir rotation period with such a mechanism? The necessary changes in drift velocity also require temporal variations in the background field strengths. Moreover, the character of these changes depends on the interpretation of the observational data. Recall that two models—one with abrupt period changes [11,17,18,19] and another with quasi-sinusoidal variations [13,20]—have been considered for CU Vir. Within the framework of our model, it can be assumed that the abrupt changes in drift velocity are caused by a change of the instability mode when the normalised background field strength is Ω A / Ω 0.4 0.5 . In this case, to reconcile with the observed direction of period change, it is necessary to assume a decrease in the normalised field over a historical period of CU Vir observations. Then, at the start of observations in 1950s, the star would be located somewhere on the second or third wave of the plot for drift velocity (Figure 6a), moving leftward. A step-like change in drift velocity corresponds to an increase in period (deceleration of the star) between 1983 and 2012, and a subsequent gradual acceleration after 2012 would return the background field value (and drift velocity) close to those at the beginning of the previous cycle.
The model with continuous period change permits a smaller field strength Ω A / Ω 0.1 0.2 , but implies an increase in the field strength. Period changes occur near the first switching of the instability mode. Initially, an increase in the drift velocity took place, corresponding to a slowing of the apparent rotation until 2005; subsequently, the drift rate decreased, corresponding to an acceleration of the rotation. We can estimate the value of the period change Δ P predicted by the model as Δ P = P · ( Δ w / Ω ) . From the figure Figure 6a Δ w / Ω 0.007 near Ω A / Ω 0.2 (the first change in the dominant instability mode). This corresponds to a period increase by Δ P 300 s, while the observed increase in the CU Vir period from 1958 to 2012 was much smaller, about Δ P o b s 3 s. The reason for this discrepancy may lie in the utilisation of a simplified magnetic field structure within our linear instability model. Additionally, the quasi-sinusoidal model of period change implies smooth variations over decadal timescales, whereas our model predicts abrupt changes in the dominant mode of the Tayler instability within a few ( 10 20 ) rotational cycles.
Can the different directions of field changes, decrease and increase, have a physical interpretation? If we assume that the field consists of small-scale flux tubes undergoing double-diffusive rise [58,59], then both increases and decreases in the background field can be observed. It depends on where the field changes are monitored. If we are tracking an uplifting tube, then its normalised field strength decreases as B / B e q ρ . However, if we observe the field strength at a fixed location, then both scenarios are possible. If at this location the field was weak or simply absent, then the arrival of a flux tube can increase the local field. Conversely, flux tubes with weaker fields can also rise.
To summarise, explaining the period changes in CU Vir via the Tayler instability of its magnetic field requires extensive speculation arising from the simplifying assumptions of our model and the lack of direct information on the structure and dynamics of the internal magnetic field. Currently, our model offers no clear advantages over other models that propose the effect of standing Alfvén waves on the azimuthal distribution of the magnetic field and chemical spots [27,28]. While the aforementioned models, with prescribed parameters for the radial field distribution, can reproduce quasi-sinusoidal oscillations of CU Vir period with a timescale of ∼65 yr, our model is more consistent with the abrupt period changes. While recent observations seem to support the gradual period variations, a definitive way to distinguish between these models will only become possible through further photometric monitoring of the star [33].
Our model has the potential for independent observational verification to justify its further development. Note that the change in the dominant mode is associated with a change in the spatial structure of the instability pattern and the emergence of high-latitude magnetic structures. This does not contradict observations, since results from ZDI [2] revealed deviations of the CU Vir magnetic field from a simple dipole structure (a combination of dipole plus quadrupole also does not fully describe the observed Stokes profiles). In our model, changes in the high-latitude structures occur rapidly, while the equatorial dipole remains the dominant structure, with its longitudinal drift responsible for the period changes. Therefore, ZDI monitoring of CU Vir may serve as a valuable test to search for rapid changes in the magnetic field structure associated with a shift in the dominant mode of Tayler instability.

6. Conclusions

We have analysed a unique series of spectroscopic observations of the Ap star CU Vir, spanning between 1985 and 2011, which includes both archival and original data. Over these 26 years, noticeable changes in the photometric period were observed, raising the question of whether these period variations were caused by changes in surface-abundance spots. Using DI technique, we reconstructed the surface distribution of silicon in CU Vir, which is one of the major contributors to photometric variability, at four epochs more or less evenly distributed across this timeframe. A comparison of silicon distribution in different seasons revealed the stability of the spot pattern: both the geometry and abundance scale remained unchanged from season to season, like in case of another recently studied Ap star with a variable period—56 Ari. Hence, the period changes in these stars may originate from the rigid longitudinal drift of the spot pattern. Such drift of surface inhomogeneous modes is a specific feature of Tayler instability of magnetic field.
To explore the relation of Tayler instability to period changes in CU Vir, we performed simulations of the instability of internal magnetic field of CU Vir. Our modelling indicates that the drift of surface azimuthally inhomogeneous instability modes can influence the photometric period on observable timescales. However, the observed surface magnetic field strength of CU Vir appears to be insufficient for the instability regime that would produce oscillating period variations. While there are possibilities to address this issue, they remain highly speculative, given the limitations of our simplified representation of the internal magnetic field and the lack of direct observational data on its characteristics. Currently, the proposed model does not offer clear advantages over other models discussed in the literature for explaining period variations of CU Vir, but it holds potential for further development. One of its predictions—rapid changes in surface magnetic field structure caused by a shift in the dominant instability mode—could be directly tested through spectropolarimetric monitoring.

Author Contributions

Conceptualisation, I.P. and T.R.; methodology, I.P., T.R., Y.P., L.K.; software, Y.P., L.K.; formal analysis, I.P., Y.P.; investigation, I.P., T.R., Y.P., L.K.; resources, T.R., Y.P.; data curation, T.R.; writing—original draft preparation, I.P.; writing—review and editing, I.P., T.R., Y.P. and L.K.; visualisation, Y.P., I.P.; supervision, I.P.; project administration, I.P., T.R. All authors have read and agreed to the published version of the manuscript.

Funding

This research was funded by the Ministry of Science and High Education of Russian Federation.

Data Availability Statement

Spectra of CU Vir and complete linelists are available upon reasonable request from the authors. NARVAL data are publicly available in the Polarbase.

Conflicts of Interest

The authors declare no conflicts of interest.

Abbreviations

The following abbreviations are used in this manuscript:
DIDoppler Imaging
ZDIZeeman–Doppler Imaging
LTELocal Thermodynamic Equilibrum

Appendix A. List of Elements and Lines Used for DI

Table A1. Spectral lines and their parameters used for DI.
ElementLine, Å  E low , eV log gf log Γ 4 Comment
Si ii4621.418212.525−0.540−3.860bl. Fe ii, Cr ii
4621.696012.525−1.680−3.860
4621.721612.525−0.380−3.860
5041.024010.06640.150−5.170bl. Fe ii, Ni ii
5055.984110.07390.512−5.170bl. Fe ii, Ni ii, atm. H 2 O
5056.316510.0739−0.679−5.170
6347.10878.12100.000−5.680bl. Fe ii, Mg ii, g f : −0.17 dex
6347.132913.9351−1.721−2.810 g f : −0.3 dex
6347.197313.9351−1.567−2.810 g f : −0.3 dex
6371.37148.1210−0.320−5.680bl. Fe ii, g f : −0.3 dex
He i4471.469020.9641−2.198−3.690bl. Fe ii, Ti ii
4471.473020.9641−1.028−3.690
4471.473020.9641−0.278−3.690
4471.485020.9641−1.028−3.690
4471.488020.9641−0.548−3.690
4471.682020.9642−0.898−3.690
5875.599020.9641−1.511−4.720w.bl.atm. H 2 O
5875.614020.9641−0.341−4.720
5875.615020.96410.409−4.720
5875.625020.9641−0.341−4.720
5875.640020.96410.139−4.720
5875.966020.9642−0.211−4.720
Fe ii4515.33302.8441−2.537−6.530bl. Ca ii
4520.21802.8067−2.600−6.530bl. Mn ii
4522.62762.8441−2.189−6.530bl. S ii
4541.51562.8555−2.927−6.530
4582.82962.8441−3.130−6.530
4583.82922.8067−1.940−6.530
4583.99122.7043−3.840−6.540
Cr ii4554.98804.0712−1.282−6.540bl. Fe ii, Ba ii
4558.65004.0734−0.449−6.540bl. Fe ii
4558.78304.0735−2.530−6.540
4588.19904.0712−0.826−6.560
4589.90104.0722−2.660−6.560
Mg ii4481.12608.86370.740−4.70bl. Fe ii, Mn ii, Al iii
4481.15008.8637−0.560−4.70
4481.32508.86370.590−4.70

Note

1
A couple of faster rotators among Ap/Bp stars were recently reported in Mikulášek et al. [9], Semenko et al. [10].

References

  1. Deutsch, A.J. A New Spectrum Variable of Short Period, HD 124224. Astrophys. J. 1952, 116, 536. [Google Scholar] [CrossRef]
  2. Kochukhov, O.; Lüftinger, T.; Neiner, C.; Alecian, E.; MiMeS Collaboration. Magnetic field topology of the unique chemically peculiar star CU Virginis. Astron. Astrophys. 2014, 565, A83. [Google Scholar] [CrossRef]
  3. Krivoseina, A.A.; Ryabchikova, T.A.; Khokhlova, V.L. Distribution of SI on the Surface of the Silicon Ap-Star Cu-Virginis and Interpretation of the Lightcurves in the Vby Bands. Nauchnye Informatsii 1980, 43, 70. [Google Scholar]
  4. Hatzes, A.P. Mapping the Surface Distribution of Elements on Ap-Stars Using the Maximum Entropy Method. In Proceedings of the IAU Colloq. 138: Peculiar versus Normal Phenomena in A-type and Related Stars, Trieste, Italy, 6–10 July 1993. [Google Scholar]
  5. Hatzes, A.P. Doppler imaging of the silicon distribution on CUVir: Evidence for a decentred magnetic dipole? Mon. Not. R. Astron. Soc. 1997, 288, 153–160. [Google Scholar] [CrossRef]
  6. Kuschnig, R.; Ryabchikova, T.A.; Piskunov, N.E.; Weiss, W.W.; Gelbmann, M.J. Multi element Doppler imaging of AP stars. I. He, Mg, Si, CR and Fe surface distribution for CU Virginis. Astron. Astrophys. 1999, 348, 924–932. [Google Scholar]
  7. Krtička, J.; Mikulášek, Z.; Lüftinger, T.; Shulyak, D.; Zverko, J.; Žižňovský, J.; Sokolov, N.A. Modelling of the ultraviolet and visual SED variability in the hot magnetic Ap star CU Virginis. Astron. Astrophys. 2012, 537, A14. [Google Scholar] [CrossRef]
  8. Krtička, J.; Mikulášek, Z.; Henry, G.W.; Janík, J.; Kochukhov, O.; Pigulski, A.; Leto, P.; Trigilio, C.; Krtičková, I.; Lüftinger, T.; et al. HST/STIS analysis of the first main sequence pulsar CU Virginis. Astron. Astrophys. 2019, 625, A34. [Google Scholar] [CrossRef]
  9. Mikulášek, Z.; Semenko, E.; Paunzen, E.; Hümmerich, S.; North, P.L.; Bernhard, K.; Krtička, J.; Janík, J. HD 60431, the CP2 star with the shortest rotational period. Physical parameters and period analysis. Astron. Astrophys. 2022, 668, A159. [Google Scholar] [CrossRef]
  10. Semenko, E.; Romanyuk, I.; Yakunin, I.; Kudryavtsev, D.; Moiseeva, A. Spectropolarimetry of magnetic Chemically Peculiar stars in the Orion OB1 association. Mon. Not. R. Astron. Soc. 2022, 515, 998–1011. [Google Scholar] [CrossRef]
  11. Pyper, D.M.; Ryabchikova, T.; Malanushenko, V.; Kuschnig, R.; Plachinda, S.; Savanov, I. An abrupt decrease in the rotational period of the chemically peculiar magnetic star CU Virginis. Astron. Astrophys. 1998, 339, 822–830. [Google Scholar]
  12. MacDonald, J.; Natan, T.; Petit, V.; Kochukhov, O.; Shultz, M.E. Using ZDI maps to determine magnetic forces and torques at the photospheres of early-type stars. Mon. Not. R. Astron. Soc. 2024, 530, 2840–2851. [Google Scholar] [CrossRef]
  13. Mikulášek, Z.; Krtička, J.; Henry, G.W.; Janík, J.; Zverko, J.; Žižňovský, J.; Zejda, M.; Liška, J.; Zvěřina, P.; Kudrjavtsev, D.O.; et al. Surprising variations in the rotation of the chemically peculiar stars CU Virginis and V901 Orionis. Astron. Astrophys. 2011, 534, L5. [Google Scholar] [CrossRef]
  14. Trigilio, C.; Leto, P.; Umana, G.; Leone, F.; Buemi, C.S. A three-dimensional model for the radio emission of magnetic chemically peculiar stars. Astron. Astrophys. 2004, 418, 593–605. [Google Scholar] [CrossRef]
  15. Trigilio, C.; Leto, P.; Umana, G.; Buemi, C.S.; Leone, F. The radio lighthouse CU Virginis: The spin-down of a single main-sequence star. Mon. Not. R. Astron. Soc. 2008, 384, 1437–1443. [Google Scholar] [CrossRef]
  16. Das, B.; Chandra, P. Ultra-wideband, Multiepoch Radio Study of the First Discovered “Main-sequence Radio Pulse Emitter” CU Vir. Astrophys. J. 2021, 921, 9. [Google Scholar] [CrossRef]
  17. Pyper, D.M.; Stevens, I.R.; Adelman, S.J. An update on the rotational period of the magnetic chemically peculiar star CU Virginis. Mon. Not. R. Astron. Soc. 2013, 431, 2106–2110. [Google Scholar] [CrossRef]
  18. Pyper, D.M.; Adelman, S.J. Newly Discovered Period Changes in Two mCP Stars and Updates for Previously Published Stars. Publ. Astron. Soc. Pac. 2020, 132, 024201. [Google Scholar] [CrossRef]
  19. Pyper, D.M.; Adelman, S.J. Light Curve Changes and Possible Precession in mCP Stars. Publ. Astron. Soc. Pac. 2021, 133, 084203. [Google Scholar] [CrossRef]
  20. Mikulášek, Z.; Krtička, J.; Henry, G.W.; Janík, J.; Pigulski, A. Towards Comprehension of the Variability of the mCP Star CU Virginis. Phys. Magn. Stars 2019, 518, 125. [Google Scholar] [CrossRef]
  21. Stȩpień, K. On a mechanism of an abrupt change of period of CU Virginis. Astron. Astrophys. 1998, 337, 754–756. [Google Scholar]
  22. Kochukhov, O.; Adelman, S.J.; Gulliver, A.F.; Piskunov, N. Weather in stellar atmosphere revealed by the dynamics of mercury clouds in α Andromedae. Nat. Phys. 2007, 3, 526–529. [Google Scholar] [CrossRef]
  23. Hubrig, S.; Savanov, I.; Ilyin, I.; González, J.F.; Korhonen, H.; Lehmann, H.; Schöller, M.; Granzer, T.; Weber, M.; Strassmeier, K.G.; et al. The magnetic field and the evolution of element spots on the surface of the HgMn eclipsing binary ARAur. Mon. Not. R. Astron. Soc. 2010, 408, L61–L65. [Google Scholar] [CrossRef]
  24. Korhonen, H.; González, J.F.; Briquet, M.; Flores Soriano, M.; Hubrig, S.; Savanov, I.; Hackman, T.; Ilyin, I.V.; Eulaers, E.; Pessemier, W. Chemical surface inhomogeneities in late B-type stars with Hg and Mn peculiarity. I. Spot evolution in HD 11753 on short and long time scales. Astron. Astrophys. 2013, 553, A27. [Google Scholar] [CrossRef]
  25. Prvák, M.; Krtička, J.; Korhonen, H. The nature of the photometric variability of HgMn stars: A test of simulated light curves of φ Phe against the TESS data. Mon. Not. R. Astron. Soc. 2020, 492, 1834–1840. [Google Scholar] [CrossRef]
  26. Urpin, V. Chemical spots and oscillatory diffusion modes in magnetic stars. Astron. Nachrichten 2016, 337, 633. [Google Scholar] [CrossRef]
  27. Krtička, J.; Mikulášek, Z.; Henry, G.W.; Kurfürst, P.; Karlický, M. Torsional oscillations and observed rotational period variations in early-type stars. Mon. Not. R. Astron. Soc. 2017, 464, 933–939. [Google Scholar] [CrossRef]
  28. Takahashi, K.; Langer, N. Standing torsional Alfvén waves as the source of the rotational period variation in magnetic early-type stars. Astron. Astrophys. 2025, 696, A129. [Google Scholar] [CrossRef]
  29. Potravnov, I.S.; Kitchatinov, L.L. Tayler instability of magnetic field as the possible reason for the period changes in Ap star 56 Ari. Astron. Rep. 2025, 69, 500. [Google Scholar] [CrossRef]
  30. Shore, S.N.; Adelman, S.J. Magnetic fields and diffusion processes in peculiar A stars. II. Precession and the oblique rotator model. Astrophys. J. 1976, 209, 816–820. [Google Scholar] [CrossRef]
  31. Petit, P.; Louge, T.; Théado, S.; Paletou, F.; Manset, N.; Morin, J.; Marsden, S.C.; Jeffers, S.V. PolarBase: A Database of High-Resolution Spectropolarimetric Stellar Observations. Publ. Astron. Soc. Pac. 2014, 126, 469. [Google Scholar] [CrossRef]
  32. Donati, J.F.; Semel, M.; Carter, B.D.; Rees, D.E.; Collier Cameron, A. Spectropolarimetric observations of active stars. Mon. Not. R. Astron. Soc. 1997, 291, 658–682. [Google Scholar] [CrossRef]
  33. Pakhomov, Y.; Potravnov, I.; Ryabchikova, T. Light variability from UV to near-infrared in Ap star CU Vir induced by chemical spots. Galaxies 2025. in preparation. [Google Scholar]
  34. Piskunov, N.; Kochukhov, O. Doppler Imaging of stellar magnetic fields. I. Techniques. Astron. Astrophys. 2002, 381, 736–756. [Google Scholar] [CrossRef]
  35. Piskunov, N.E.; Rice, J.B. Techniques for Surface Imaging of Stars. Publ. Astron. Soc. Pac. 1993, 105, 1415. [Google Scholar] [CrossRef]
  36. Piskunov, N. Doppler imaging. Phys. Scr. Vol. T 2008, 133, 014017. [Google Scholar] [CrossRef]
  37. Shulyak, D.; Tsymbal, V.; Ryabchikova, T.; Stütz, C.; Weiss, W.W. Line-by-line opacity stellar model atmospheres. Astron. Astrophys. 2004, 428, 993–1000. [Google Scholar] [CrossRef]
  38. Ryabchikova, T.; Piskunov, N.; Kurucz, R.L.; Stempels, H.C.; Heiter, U.; Pakhomov, Y.; Barklem, P.S. A major upgrade of the VALD database. Phys. Scr. 2015, 90, 054005. [Google Scholar] [CrossRef]
  39. Pakhomov, Y.; Potravnov, I.; Romanovskaya, A.; Ryabchikova, T. Modeling the TESS Light Curve of Ap Si Star MX TrA. Universe 2024, 10, 341. [Google Scholar] [CrossRef]
  40. Mashonkina, L. Non-local thermodynamic equilibrium line formation for Si I-II-III in A-B stars and the origin of Si II emission lines in ι Her. Mon. Not. R. Astron. Soc. 2020, 493, 6095–6108. [Google Scholar] [CrossRef]
  41. Spruit, H.C. Differential rotation and magnetic fields in stellar interiors. Astron. Astrophys. 1999, 349, 189–202. [Google Scholar] [CrossRef]
  42. Cowling, T.G. On the Sun’s general magnetic field. Mon. Not. R. Astron. Soc. 1945, 105, 166. [Google Scholar] [CrossRef]
  43. Moss, D. Magnetic Fields in the Ap and Bp Stars: A Theoretical Overview. Magn. Fields Across-Hertzsprung-Russell Diagr. 2001, 248, 305. [Google Scholar]
  44. Bogomazov, A.I.; Tutukov, A.V. Merging of components in close binaries: Type Ia supernovae, massive white dwarfs, and Ap stars. Astron. Rep. 2009, 53, 214–222. [Google Scholar] [CrossRef]
  45. Schneider, F.R.N.; Ohlmann, S.T.; Podsiadlowski, P.; Röpke, F.K.; Balbus, S.A.; Pakmor, R.; Springel, V. Stellar mergers as the origin of magnetic massive stars. Nature 2019, 574, 211–214. [Google Scholar] [CrossRef]
  46. Tayler, R.J. The adiabatic stability of stars containing magnetic fields-I.Toroidal fields. Mon. Not. R. Astron. Soc. 1973, 161, 365. [Google Scholar] [CrossRef]
  47. Pitts, E.; Tayler, R.J. The adiabatic stability of stars containing magnetic fields. IV - The influence of rotation. Mon. Not. R. Astron. Soc. 1985, 216, 139–154. [Google Scholar] [CrossRef]
  48. Spruit, H.C. Dynamo action by differential rotation in a stably stratified stellar interior. Astron. Astrophys. 2002, 381, 923–932. [Google Scholar] [CrossRef]
  49. Arlt, R.; Rüdiger, G. Magnetic fields of Ap stars as a result of the Tayler instability. Astron. Nachrichten 2011, 332, 70–76. [Google Scholar] [CrossRef]
  50. Rüdiger, G.; Kitchatinov, L.L. The kink-type instability of toroidal stellar magnetic fields with thermal diffusion. Geophys. Astrophys. Fluid Dyn. 2010, 104, 273–285. [Google Scholar] [CrossRef]
  51. Kitchatinov, L.L.; Potravnov, I.S.; Nepomnyashchikh, A.A. Longitudinal drift of Tayler instability eigenmodes as a possible explanation for super-slowly rotating Ap stars. Astron. Astrophys. 2020, 638, L9. [Google Scholar] [CrossRef]
  52. Kitchatinov, L.; Rüdiger, G. Stability of toroidal magnetic fields in rotating stellar radiation zones. Astron. Astrophys. 2008, 478, 1–8. [Google Scholar] [CrossRef]
  53. Kitchatinov, L.L. Stability of toroidal magnetic fields in the radiation zone of a star. Astron. Rep. 2008, 52, 247–255. [Google Scholar] [CrossRef]
  54. Goossens, M.; Biront, D.; Tayler, R.J. Additional Results for Unstable Stratified Toroidal Magnetic Fields in Stars. Astrophys. Space Sci. 1981, 75, 521–526. [Google Scholar] [CrossRef]
  55. Denissenkov, P.A.; Pinsonneault, M. A Revised Prescription for the Tayler-Spruit Dynamo: Magnetic Angular Momentum Transport in Stars. Astrophys. J. 2007, 655, 1157–1165. [Google Scholar] [CrossRef]
  56. Paxton, B.; Bildsten, L.; Dotter, A.; Herwig, F.; Lesaffre, P.; Timmes, F. Modules for Experiments in Stellar Astrophysics (MESA). Astrophys. J. Suppl. 2011, 192, 3. [Google Scholar] [CrossRef]
  57. Potravnov, I.; Piskunov, N.; Ryabchikova, T. Secular stability of surface abundance structures in the rapidly rotating Ap star 56 Ari. Astron. Astrophys. 2024, 689, A111. [Google Scholar] [CrossRef]
  58. Parker, E.N. The Instability of a Horizontal Magnetic Field in an Atmosphere Stable Against Convection. Astrophys. Space Sci. 1979, 62, 135–142. [Google Scholar] [CrossRef]
  59. Hughes, D.W.; Weiss, N.O. Double-diffusive convection with two stabilizing gradients: Strange consequences of magnetic buoyancy. J. Fluid Mech. 1995, 301, 383–406. [Google Scholar] [CrossRef]
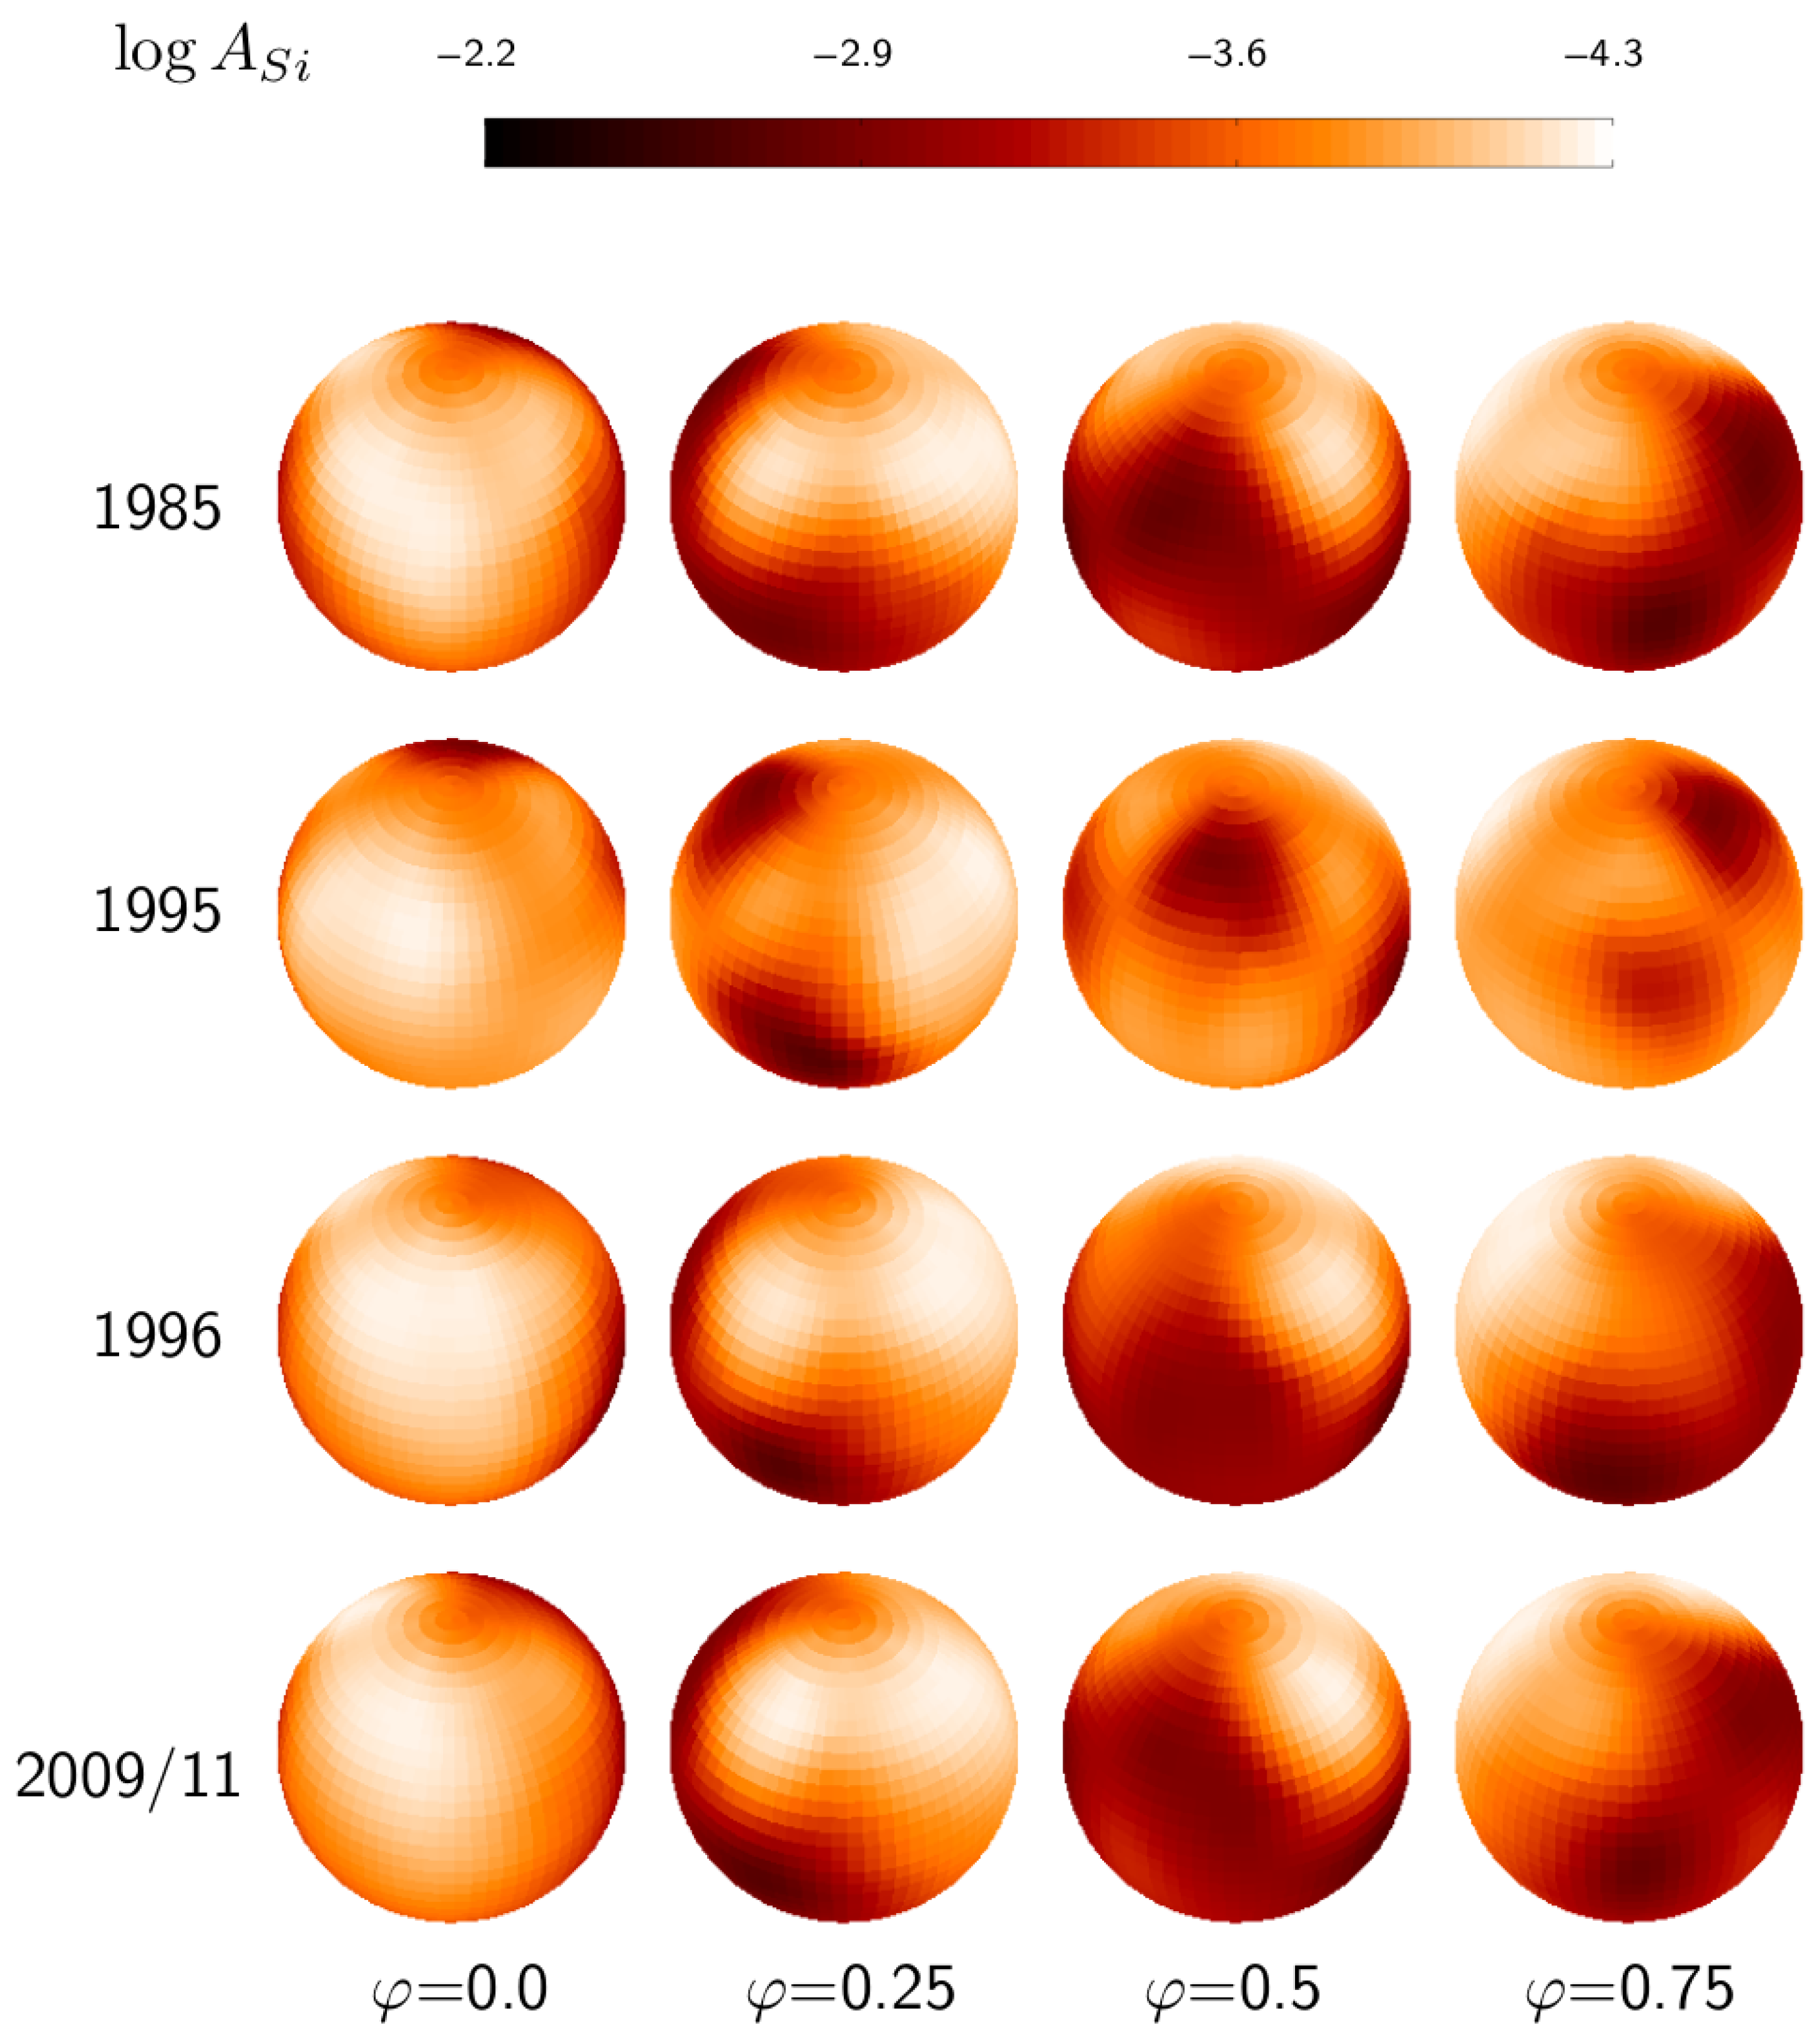
Figure 1. Silicon distribution over the surface of CU Vir during the period 1985–2011. Spherical maps are displayed for four equally spaced rotational phases. The abundance scale is provided at the top of the figure. Darker regions correspond to higher silicon abundances.
Galaxies 13 00090 g001
Figure 2. Synthetic light curves of CU Vir calculated using the surface Si maps for 1985, 1996, and 2009/11. Explanations of the line types are provided in the legend at the upper right. The light curves resulting from the inhomogeneous distribution of silicon alone are shown separately by red curves. Light curves calculated while also taking into account the He, Fe, and Cr are depicted by black lines. The dots represent observations in the Strömgren v band according to Pyper et al. [17]. The vertical scale is graded in magnitudes relative to the average brightness.
Galaxies 13 00090 g002
Figure 3. A comparison of the observed with NARVAL in 2009/11 selected Si ii, He i, Cr ii/Fe ii blend, Fe ii, Mg ii profiles (from left to right, black curves) with the theoretical profiles (red curves) predicted by our DI. The profiles correspond to different rotational phases labelled to the right of the plot. Only the selected transitions contributing to the blends are labelled at top of the plot.
Galaxies 13 00090 g003
Figure 4. Surface-abundance distributions in CU Vir for different elements recovered from the 2009/11 NARVAL dataset. The abundance scales are shown to the right from the corresponding subplots.
Galaxies 13 00090 g004
Figure 5. The frequency ratio N / Ω (left panel) and the equipartition field strength (right panel) as a function of radius.
Galaxies 13 00090 g005
Figure 6. The growth rates (panel (a)) and drift rates (panel (b)) of the instability in the reference frame rotating with the star. The full and dashed lines correspond to modes symmetric and antisymmetric about the equator, respectively.
Galaxies 13 00090 g006
Figure 7. The structure of the magnetic field of the most rapidly growing mode of the instability for different values of Ω A / Ω (labeled at the top of the plot panels). The color scale shows the normalized strength of the radial field. The solid (dashed) lines show the force lines of toroidal-field perturbations with clockwise (counterclockwise) circulation. The color scale is given in arbitrary units.
Galaxies 13 00090 g007
Table 1. Journal of spectroscopic observations of CU Vir used for DI. Rotational phases are given according to the Pyper and Adelman [18] model (P20) and the Mikulášek et al. [20] cosine model (M19).
HJDPhase (P20)Phase (M19)HJDPhase (P20)Phase (M19)
1985 (Lick)1996 (CrAO)
2446101.9050.9130.8742449470.2950.8950.833
2446101.9250.9520.9122449470.3200.9430.881
2446101.9730.0420.0052449496.3440.9200.859
2446102.0160.1260.0872450134.6030.6580.606
2446102.0630.2170.1772450174.4510.1840.132
2446102.9890.9950.9562450191.4180.7690.716
2446132.9000.4390.4002450210.4120.2440.193
2446132.9650.5640.5252450233.3170.2320.181
2446133.0200.6700.6312450233.3580.3110.260
2446133.0690.7640.7252450233.4540.4950.444
2446133.8870.3350.2962450253.3030.6150.563
2446133.9600.4750.4362450253.3630.7300.679
1995 (OHP) 2450254.3110.5510.499
2449798.4890.1720.1152450255.2750.4020.351
2449798.6220.4270.3712450255.2890.4280.377
2449799.4340.9860.9302450255.3050.4590.408
2449799.5750.2570.2012009/11 (PdM)
2449799.6120.3280.2722454902.5170.1510.09
2449800.4100.8610.8052454904.4850.9300.869
2449800.5020.0370.9812454905.5540.9840.922
2449800.5990.2240.1682454906.4870.7740.714
2449801.4120.7850.7292454909.4930.5480.487
2449802.4150.7110.6552454935.4870.4680.407
2449803.4380.6760.6202454935.5230.5370.476
2449804.4440.6010.5522454945.4860.6700.610
2449804.4680.6540.5982455292.5890.2610.203
2449806.4130.3890.3332455596.7180.3220.269
2449806.4350.4310.3752455657.5100.0700.017
2449806.4520.4640.4082455690.4790.3850.333
2449806.4690.4970.441
2449806.4840.5250.469
2449806.5000.5560.500
Disclaimer/Publisher’s Note: The statements, opinions and data contained in all publications are solely those of the individual author(s) and contributor(s) and not of MDPI and/or the editor(s). MDPI and/or the editor(s) disclaim responsibility for any injury to people or property resulting from any ideas, methods, instructions or products referred to in the content.