Review

Dust at the Cosmic Dawn

by
Yuri A. Shchekinov
*,† and
Biman B. Nath
Raman Research Institute, Sadashivanagar, Bengaluru 560080, Karnataka, India
*
Author to whom correspondence should be addressed.
These authors contributed equally to this work.
Galaxies 2025, 13(3), 64; https://doi.org/10.3390/galaxies13030064
Submission received: 12 March 2025 / Revised: 22 April 2025 / Accepted: 16 May 2025 / Published: 23 May 2025
(This article belongs to the Special Issue The Observation and Detection of Dusty Star-Forming Galaxies)

Abstract

:
Observations provided by the Hubble Space Telescope (HST) and James Webb Space Telescope (JWST) have revealed a surprising abundance of galaxies at the “cosmic dawn” epoch, z > 7 . Some of them are found even in a more distant universe at z ≃ 14–16. Most of these galaxies appear to be intriguing: they are found to be either super-bright in the rest-frame ultraviolet (UV) band or super-dusty with a heavily reddened stellar population. The transition from the super-bright and super-dusty regimes seems to occur in the redshift range from z∼10.5 to z∼9.5 within a time range of ∼50 Myr. If confirmed, then the origin of this transition is far from being clear. In the review, we discuss possible mechanisms that can make z > 10 galaxies free of dust and also explain the origin of apparently excessive dust in galaxies at intermediate and lower redshifts z < 10 .

1. Introduction

Studying the origin of the first galaxies has been among the main goals of new instruments on the Hubble Space Telescope (Wide Field Camera 3, HST/WFC3), on the Keck I Telescope (Multi-Object Spectrometer For Infra-Red Exploration, MOSFIRE), Subaru Telescope (Subaru/Suprim-Cam), Spitzer/IRAC, and ALMA during the last decade. These efforts have brought a new understanding of the very early stages of galaxies in the universe in its initial several hundred Myr period (redshifts z∼7–10). The most important aspects of the overall evolutionary trajectory of growing galaxies include their initial assemblage at z 10–16 and further transition to the later stages at z∼7–10. Observational manifestations of this process are determined mostly by the efficiency of stellar nucleosynthesis and its products: light, chemical enrichment, and dust production. These manifestations are encoded in the luminosity function (LF) of evolving galaxies [1,2,3,4,5,6], in the corresponding star formation rate, chemical enrichment, and presence of dust [7,8,9,10,11,12]. More recently, the James Webb Space Telescope (JWST) has immensely extended this knowledge to the redshift range z∼10–12 (time from the Big Bang t∼370 Myr) [13,14,15,16,17,18,19]. Even more distant galaxies upto z∼16.7 has been found within the study of the first JWST NIRCam images from the early release observations [20,21,22,23]. Further analysis that made use of the ALMA Band 7 observations have diminished possible contaminations from lower-z dusty star-forming galaxies for the most distant candidate, S5-z17-1, at z ≃ 16.7 [24].
Perhaps among the most intriguing issues discovered recently is the relationship between the following parameters across cosmic time: star formation, metal production, and dust abundance. In the local universe, the mass fractions of dust and metals are roughly scale as M d Z / Z [25]. Towards the end of the 1980s, it was becoming clear that dust is not only produced due to the activity of slowly evolving intermediate-mass stars M * ∼(2–8) M at their asymptotic giant branch (AGB) stages. It was theoretically predicted [26,27] and then observationally confirmed [28,29] that massive stars M * > 8 M operating on much shorter time scales in the form of supernovae (SN) explosions are more important in contributing dust than the AGB stars. Therefore, observations of a galaxy with active star formation immediately suggest the presence of metal and dust.
The galaxy luminosity function (LF) is known to be an important indicator of star formation activity and chemical enrichment across cosmic time. Early analysis of the luminosity function revealed a mild evolution—an increase in the star formation activity with cosmic time, in the range z∼4–8, and a faster evolution of this activity in the earlier period z∼8–10 [5,30,31,32], as in Figure 1. It is seen from this luminosity function ϕ ( M U V ( z ) ) that the derivative d ϕ ( M U V ( z ) ) / d z considerably increases from z 7–10 to the later evolutionary stages at z < 7 : the derivative d log ϕ ( 20 , z ) / d z 0.55 for M U V = 20 at z = 10 increases to ≃ 0.3 at z 5 . The fast evolution regime in the range from z∼12.5 to z∼7.5 is supported further in the JWST NIRCam in the CANUCS1 survey [33]. With a sample of 158 galaxies at z > 7.5 , they have found a decrease in the UV luminosity density by a factor of 25 between z = 8 and z = 12 . This is four times the decrease2 reported in [34].
An alternative view of a gradual and relatively slow and smooth increase in the cosmic star formation (SF) activity from the earliest epochs between z∼16 to z∼10 has been argued by [14,39,40,41]. It is interesting also to note in this regard that z > 10 galaxies show luminosities comparable or even higher than those at z∼7–9 [42]. The galaxy LF during this period is consistent with a slow and smooth SF evolution from z∼16 to z∼9, as demonstrated in [20,21,36,37,42,43]. Figure 1 presents the results from [38] obtained in the CEERS (Cosmic Evolution Early Release Science) survey with 88 sources in the range z∼8.5–14.5 (∼90 arcmin2), convincingly illustrating a rather flat evolution at z > 8 with the slope d log ϕ / d z 0.11 , which is approximately a third of d log ϕ / d z 0.3 at z < 8 , and only ∼20% of d log ϕ / d z 0.5 in the rapid evolution scenario shown in the left panel of Figure 1. In [43], the authors demonstrate a considerable excess of galaxies with M UV 18 and M UV 20 at z≃ 12–14, indicating that galaxies can emerge in the universe at even earlier epochs, beyond z > 17 .
Chemical evolution of early galaxies, to a certain extent, follows the rather slow evolution of their LFs with a rate proportional to the star formation rate and the galaxy luminosity, though with possible variations among individual galaxies. Roughly speaking, the metallicity during z 10–14 varies in the range z∼(0.03–0.2) Z with the metal yield y Z ∼0.1 M per star. The metallicity in the most distant known galaxy, JADES-GS-z14-0 ( z 14.3 ), has been found to be Z * (0.03–0.2) Z [44,45,46]. 70 Myr later ( z = 12.5 ), the galaxy JADES-GS-z12 revealed a similar value of z∼0.2 Z with high-sensitivity JWST/NIRspec. Spectral measurements of carbon ion (CIII]) line emission [47] support this scenario, though the JWST/MIRI photometry of this galaxy shows a slightly lower value of Z * 0.014 Z [48]. Similar metallicity ∼(0.03–0.1) Z is inferred with HST/WFC3 in the galaxy GN-z11 ( z 10.96 ) approximately 40 Myr later [3,9,11]. It is worth noting that inferring the metallicity in z > 10 galaxies suffers from uncertainties that are associated, in particular, with fitting of spectral energy distribution (SED) of their stellar populations, variations of the escape fraction of ionized photons resulting in uncertainties of the ionization state of carbon as discussed, e.g., in [44,45,48,49]. Galaxies at intermediate z∼8–10 and lower redshifts z∼7–8 generally show on average a rather moderate increase in the metallicity from z∼(0.03–1.0) Z [50,51] to z∼(0.1–0.4) Z [8,52,53,54,55], respectively. Towards the later stages, at z 6 , the metallicity is expected to grow because of contributions from intermediate-mass stars, 4–8 M , at their asymptotic giant branch (AGB) phase. In this regard, it is worth noting that possible traces of such contribution in the form of [N/O] excess are observed in the galaxy A1689-zD1, z 7 [55].
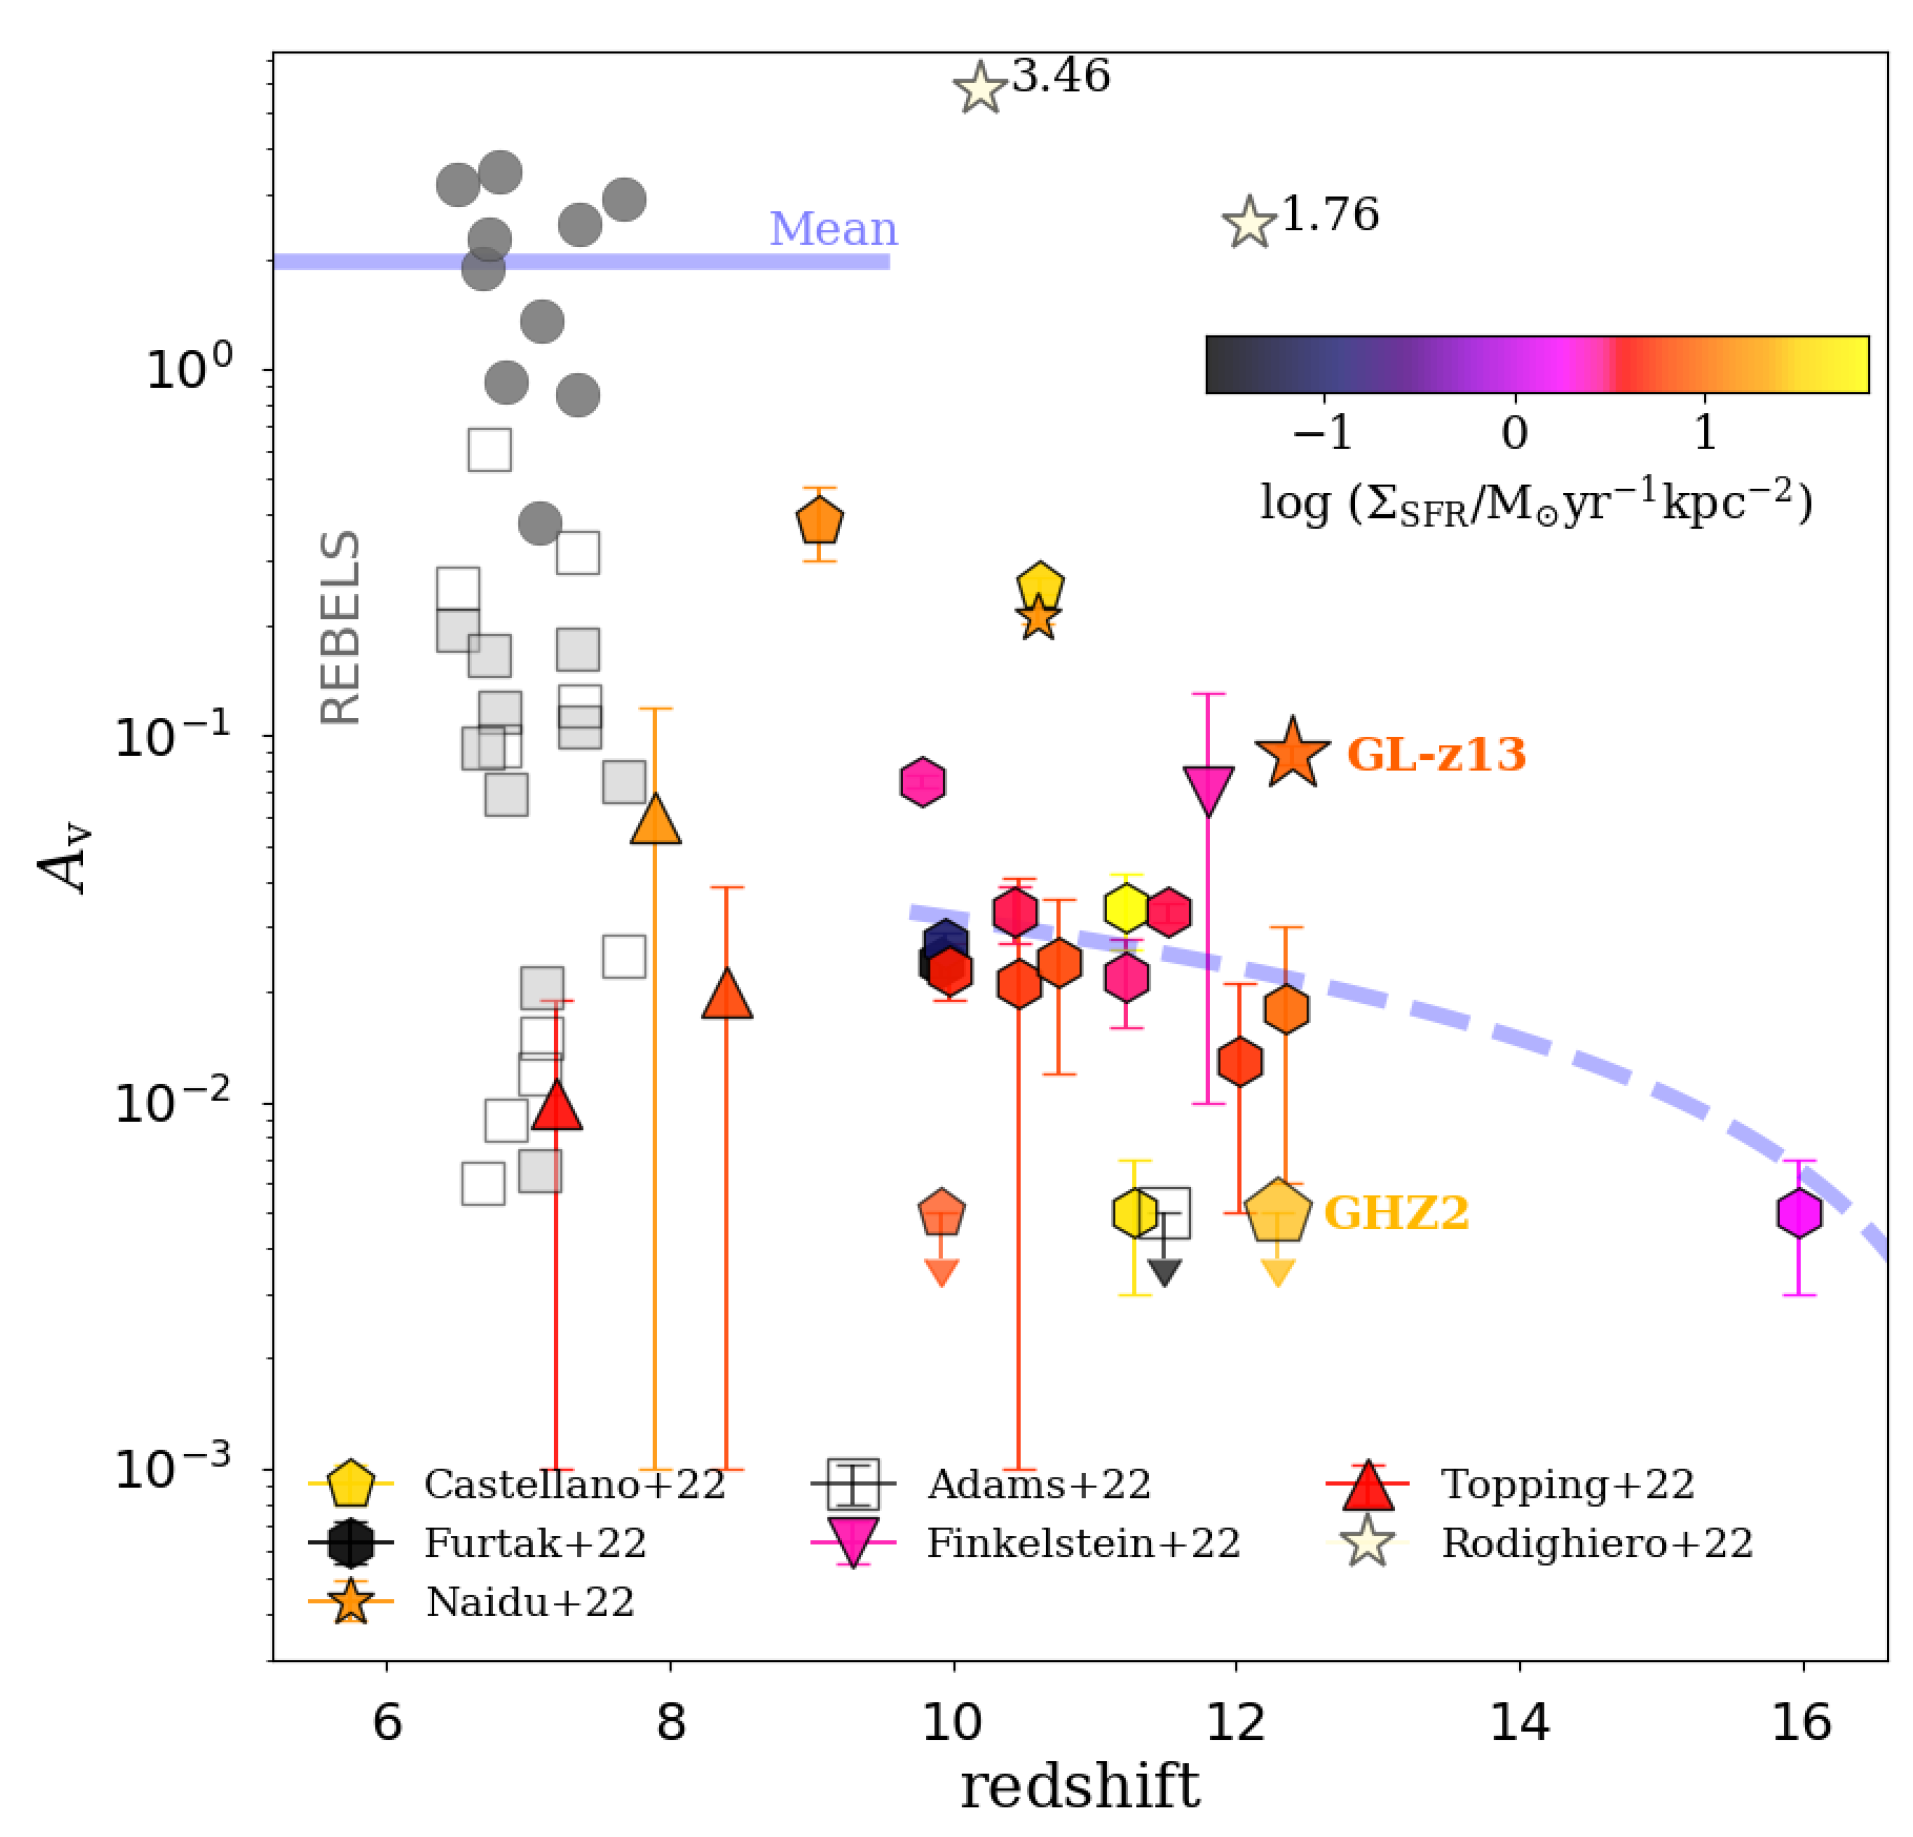
Evolutionary changes associated with the presence of dust in galaxies show a transition from the earlier stages (beyond z 10 ) to the later ones ( z 10 ). The apparent deficiency of dust in z 10 galaxies changes to an excess at z < 9.5 within roughly 35 Myr, as shown in [56], with a rather large increase in the attenuation A V ∼0.03 at z 10 to A V ∼3. This evolutionary stage of the universe between z 10 , ∼9.5–10 and z 9.5 demonstrates three puzzling phenomena: metal-enriched and dust-free galaxies, a 35 Myr long increase in dust content in z∼9.5–10 galaxies, reflected in the jump of the average attenuation A V by a factor of 30, and the subsequent enrichment of galaxies with gas.
These issues will be briefly discussed in the next sections: In Section 2, we discuss z > 10 galaxies that show a deficient amount of dust that is apparently inconsistent with the observed metallicity. Section 3 describes an opposite problem—an excessive amount of dust in z < 10 galaxies with the dust-to-stellar mass ratio exceeding ∼ 10 2 . In Section 4, we discuss a few issues connected with the dust transport in galaxies and the removal of dust from them, and the possible presence of cold and unseen dust in dense, optically thick clouds. Section 5 briefly summarizes these issues.

2. Dust-Free Galaxies: z 10

As mentioned above, observations of metals in galaxies even at z > 8 , by the nature of things, also suggest the presence of dust in them. Therefore, dust is expected to have existed in the early universe along with the initial episodes of stellar nucleosynthesis. First indications of this appeared from the reddening of distant quasars [57,58,59,60]. Detection of dust in quasars at z > 6 [61,62] made it clear that SN explosions can be a predominant source of dust along with metals [63,64]. This interconnection between metals and dust is observed to take place, though, until certain limits, only at low and intermediate redshifts z < 10 . However, as far as the dust mass in galaxies beyond z > 10 is concerned, the overall picture seems to become surprisingly different from that anticipated from the evolutionary sequence of their luminosities and metallicities. This comes from an apparent discord between a relatively high metallicity at z > 10 , z∼(0.03–0.3) Z , and unexpectedly low dust abundance as manifested in a weak UV attenuation A UV < 0.1–0.3 and a steep UV spectral slope β < 2.3 [9,11,15,17,18,46,47,65]. The observed very bright blue galaxies3 at z > 10 with M UV 20 and the SF rate of M ˙ * ∼10–20 M yr−1 [9,11,13,20,44,66] would suggest an efficient dust production along with metals. The dust production rate is given by
M ˙ d ν ¯ y d M ˙ * ,
with ν ¯ being the specific supernova rate per stellar mass, given by
ν ¯ sn = ν ( yr 1 ) M ˙ * ( M yr 1 ) .
Its numerical value is determined by the stellar initial mass function (IMF): for a Salpeter mass function Ψ ( M ) M 2.35 in the mass range M = [0.2–100] M , it is ν ¯ 0.007 M 1 , while for the range M = [1–100] M (more suitable for a distant universe), ν ¯ ∼0.02 M 1 , as in [12]. For simplicity, we use ν ¯ ∼0.01 M 1 . Assuming a conservative value for the net dust yield4 from supernovae to be y d ∼0.1 M , one arrives at the dust production rate,
M ˙ d ν ¯ y d M ˙ * ,
resulting in the dust-to-stellar mass ratio ζ * = M d / M * 0.001 (see more discussion in Section 2.1). For a ‘typical’ z > 10 galaxy with the effective radius R e = 300 R e , 0.3 pc, where R e , 0.3 is the effective radius in the unit of 300 pc, and M * = 10 9 M * , 9 M [9,13,48,67,68], a rough estimate would give,
τ uv κ u v ζ * M * 4 π R e 2 2 × 10 4 ζ * M * , 9 R e , 0.3 2 ,
where κ u v 10 5 cm2 g−1 is the absorption coefficient by mass [69,70]. For ζ * 10 3 , the UV-optical depth is τ uv 10 M * , 9 R e , 0.3 2 . Accounting for the fact that ζ * y d Z / y Z , where y d and y Z are the dust and metal SNe yield and assuming y d 0.3 , one arrives at A V 0.8 for the metallicity Z 0.03 Z . The metallicity in z > 10 galaxies is observed to lie within z∼0.03–0.3 (see, e.g., in [71]), with the expected attenuation A V ∼0.8–2.4. The observed A V < 0.1 shown in Figure 2 clearly indicates a large deficit of dust. Even though this estimate should be treated as an upper limit because of the burning of dust during star formation, the observed low level of dust attenuation A UV 0.3 requires powerful mechanisms for clearing the dust from z > 10 galaxies [56,70,72,73,74].
This dissonance in the dust-to-metals interrelation between galaxies in z < 10 and z > 10 epochs is clearly demonstrated in [56] (see in Figure 2). A very sharp transition in attenuation by Δ A V ∼2 from the early ( z > 10 ) to later ( z < 10 ) stages does not appear to be consistent with smoother variation of the metallicity from z∼10 to z∼9. Similar trend was found in the UV slope β during the transition period between z > 10 and z < 9 galaxies, as inferred from a sample of 295 JWST/NIRSpec galaxies at z 5.5–14.3 [75]: the UV slope from β 2.4 at z 10 to ≃ 1.5 at z 9.5 . The time scale of this transition from z∼10 to ∼9.5 is around 35 Myr, i.e., nearly the time scale of a starburst phase, which is too short to be able to increase the dust mass by
Δ M d 10 5 Δ A V R e , 0.3 2 M .
The corresponding gas mass M g ζ d 1 M d . There are three options for clearing dust from the galaxies below A V 0.1 : (i) destruction of dust, (ii) ejection of dust from galaxies, (iii) spatial redistribution (segregation) of dusty and dust-free gas to make the front-side view mostly transparent. The first option does not seem likely, given the conditions of z > 10 galaxies. The reason is that the regions in which the gas temperature is conducive for efficient dust destruction (T 10 6 K) also suffer from strong radiation cooling. The radiation energy losses needed to maintain the gas mass at T 10 6 K at the densities typical for these galaxies are one to two orders of magnitude higher than the total energy input from stars (see in Section 2.1).
Figure 2. Dust attenuation measured in the z∼6–16 galaxies—within the universe’s first Gyr. The galaxies in z > 9.5 are observed and studied by JWST. The lower redshift galaxies at z < 9 from the REBELS are studied with ALMA and HST. Comparison of the two sets illustrates a considerable difference between the physical properties of the galaxies at higher and lower redshifts, which manifests in the value of dust attenuation and, correspondingly, the amount of dust in them. Grey and empty squares show galaxies from REBELS ALMA survey [76]. Color bar in the upper right indicates the SFR per unit area. Data are from [13,14,68,71,77,78,79,80]. (Adopted from [56]).
Galaxies 13 00064 g002
Therefore, several models and complementary theoretical approaches to resolve this paradox of ‘blue monsters’ are currently under discussion:
(i)
the ‘Attenuation Free Model’ (AFM) [56,81,82,83,84,85]. Within the AFM, strong stellar radiation from a very intense star formation rate sSFR 25 30 Gyr−1, possibly along with a powerful AGN, drives outflows by radiation pressure.
(ii)
Standard stellar feedback connected with supernova explosions and strong ultraviolet ionization after recurrent starbursts [72,86,87,88,89,90,91,92].
(iii)
Self-oscillating feedback-free starbursts driven by high ram pressure from a continuous accretion [93,94].
(iv)
Outlier rapidly assembled with enhanced star formation efficiency on short time scales, particularly in low-mass halos with shallow gravitational potential wells [95,96].
(v)
Enhanced stellar feedback from a top-heavy IMF [21,97,98,99,100].
Another side of this puzzle of ‘blue monsters’ is a sharp increase in the dust attenuation by Δ A V ∼1 from z∼10.5 to z∼9.5. Such an increase in A V is associated with an increase of dust mass M d 10 5 R G , 0.3 2 M into the galaxies. It can be connected either with (i) the falling back of previously evacuated dust, (ii) a decrease in the projected covering fraction of dust-free regions due to turbulent diffusion, or (iii) with in situ injected dust from continuing SNe explosions. The characteristic times of the processes:
(i)
t f f 6 R e , 0.3 3 / 2 M * , 9 1 / 2 Myr, for the first,
(ii)
t RT ∼10 Myr for the second, as discussed in Section 2.2.2, and
(iii)
t SN , inj M d / ( ν ¯ sn y d M ˙ * ) ∼(0.3–1) Myr, for the third R e , 0.3 ∼1, and Σ sfr 10 M yr−1 kpc−2 as shown in Figure 2.
It is seen that at least the first three processes operate within 50 Myr and can replenish the dust that had been either ejected or segregated at previous stages initiated by bursts of stellar activity.
It is worth noting that the observational biases towards bluer sources and towards very young and bright galaxies are still under discussion [17,20,56,96], although the larger sample of z > 10 galaxies in [23] confirms a considerable drop in the UV slope to the extreme blue end β = 2.6 . At intermediate redshifts, z < 10 , a possible bias of predominantly observing the brightest sources cannot, however, be excluded (see discussion in [5,39]). However, the question of whether the ‘blue monsters’ are typical or peculiar objects in the z > 10 universe is of great importance for an understanding of the beginning of stellar nucleosynthesis at z > 10 .

2.1. Conditions for Dust Destruction at z 10

Galaxies at z > 10 exhibit a considerable amount of metals. Since dust at z > 5 is produced along with metals predominantly by SNe [27,29,63,64,101,102,103] (more discussion in Section 3.1), one would expect to find dust nearly proportional to metals if dust grains are not destroyed in hot environments.
Dust is destroyed either by sputtering by hot gas or by astration. High star formation rates in z > 10 galaxies, M ˙ * ∼10–30 M yr−1 [5,9,11,13,15,18] in a very compact volume (typically of radius ∼300 pc) can be heavily destructive to dust. The necessary conditions imply gas temperatures T > 10 6 K, or equivalently, the shocks with velocities5 v s > 200 km s−1. This implies that the dust mass destroyed by a single isolated SN is of order M d 10 M [104,105]. For SN explosions in a cloudy medium, the destroyed dust mass is a factor of two lower: M d 6 M [106].
Dust sputtering comes from SN explosions via gas heating. The gas heating rate is roughly given by
E ˙ + ν ¯ E M ˙ * 3 × 10 41 ν ¯ 0.01 M ˙ * ( M yr 1 ) erg s 1 ,
where ν ¯ = 10 2 ν ¯ 0.01 M 1 is the specific per stellar mass SN rate, M ˙ * , the star formation rate in units ( M yr 1 ) , E, the explosion energy. This energy is lost via radiative cooling at a rate
E ˙ Λ ( T ) n 2 Δ V 10 43 n 2 R e , 0.3 3 erg s 1 .
Here, for the cooling rate at T 10 6 K, we assumed Λ ( T ) 3 × 10 21 erg cm3 s−1 which is connected with the dust cooling [107,108], and n 2 1 / 2 is the gas density averaged over the shock-heated volume Δ V . The ISM gas can be kept in a thermal (quasi-)equilibrium state within a volume that is determined from energy balance E ˙ + = E ˙ . This gives
Δ V ν ¯ E M ˙ * Λ ( T ) n 2 ,
or for the radius of a spherical volume R e , 0.3 0.3 ( E 51 M ˙ * ) 1 / 3 n 2 1 / 6 . Here, R e , 0.3 = R e / 300 pc , E 51 = E / 10 51 is the SN energy explosion normalized by the Bethe energy E B = 10 51 erg, and Λ ( T 6 1 ) 3 × 10 21 erg cm3 s−1 as above. This can result in R e , 0.3 ∼1 for M ˙ * ∼10–30 M yr−1 and n 2 1 / 2 ∼1 cm−3. However, assuming the gas density n 2 1 / 2 10 2 cm−3, close to the observed values measured in z > 10 galaxies [49,109,110,111] the characteristic radius of a heated volume R e , 0.3 0.06 M ˙ * 1 / 3 . This means that a commonly used value M ˙ * ∼10–30 M yr−1 is sufficient to support gas at T 10 6 K in thermal quasi-equilibrium only within a volume that is ∼ 0.2 fraction of a typical z > 10 galaxy volume at T 10 6 K. More generally, Equation (8) implies a fraction of the ISM volume with temperature necessary for destruction of dust, given by
f v ( T > 10 6 ) 3 × 10 2 M ˙ * n 2 1 R e , 0.3 3 .
In order to destroy the dust locked in these regions, it is necessary to keep the hot gas at a high temperature, T 10 6 , K for a time that is longer than the sputtering time t sp ( a ) 10 5 a 0.1 n 1 yr, where a 0.1 is the grain radius in 0.1 μ m. This condition, however, is not always satisfied. If, as expected, the gas contains dust and the radiation cooling is dominated by the dust cooling [107,108], the cooling time at t 10 6 K is t c 10 2 T 6 n 1 yr. Therefore, under such conditions, only the smallest grains, a 10 3 μ m, are subject to destruction. At higher temperatures, the cooling goes slower t c T , and a fraction of dust, particularly of small sizes, can be heavily sputtered (see a brief discussion in Section 3.1.4).
This would imply that for typical ISM densities in z > 10 galaxies of n 2 10 2 cm−3. As shown in [49,109,110,111], the ISM volume fraction with T 10 6 K where the dust is actively sputtered, is only of order f v ( T > 10 6 ) 3 × 10 6 M ˙ * . Under such conditions, a large fraction of dust can avoid being sputtered. At a lower density n 2 1 / 2 ∼1 cm−3, this fraction can become considerable, f v ( T > 10 6 ) ∼0.6–1, for the SFR M ˙ * ∼20–30 M yr−1 typical for z > 10 galaxies. However, such a high SFR does not appear to be consistent with n 2 1 / 2 ∼1 cm−3. Indeed, the star formation rate is M ˙ * = ϵ * M g / t f f , with ϵ * being the SF efficiency and t f f = ( 4 π G ρ ) 1 / 2 , the free-fall time. Combining this with the observed SF rate M ˙ * ∼20–30 M yr1 and the gas mass M g 4 π ρ 2 1 / 2 R e 3 / 3 4 × 10 6 n 2 1 / 2 R e , 0.3 3 M , the required SF efficiency is given by ϵ * ∼(150–180) R e , 0.3 3 n 2 3 / 4 . This relation puts a limit on the gas density, as given by: n 2 1 / 2 > ( 150 180 ) R e , 0.3 3 .
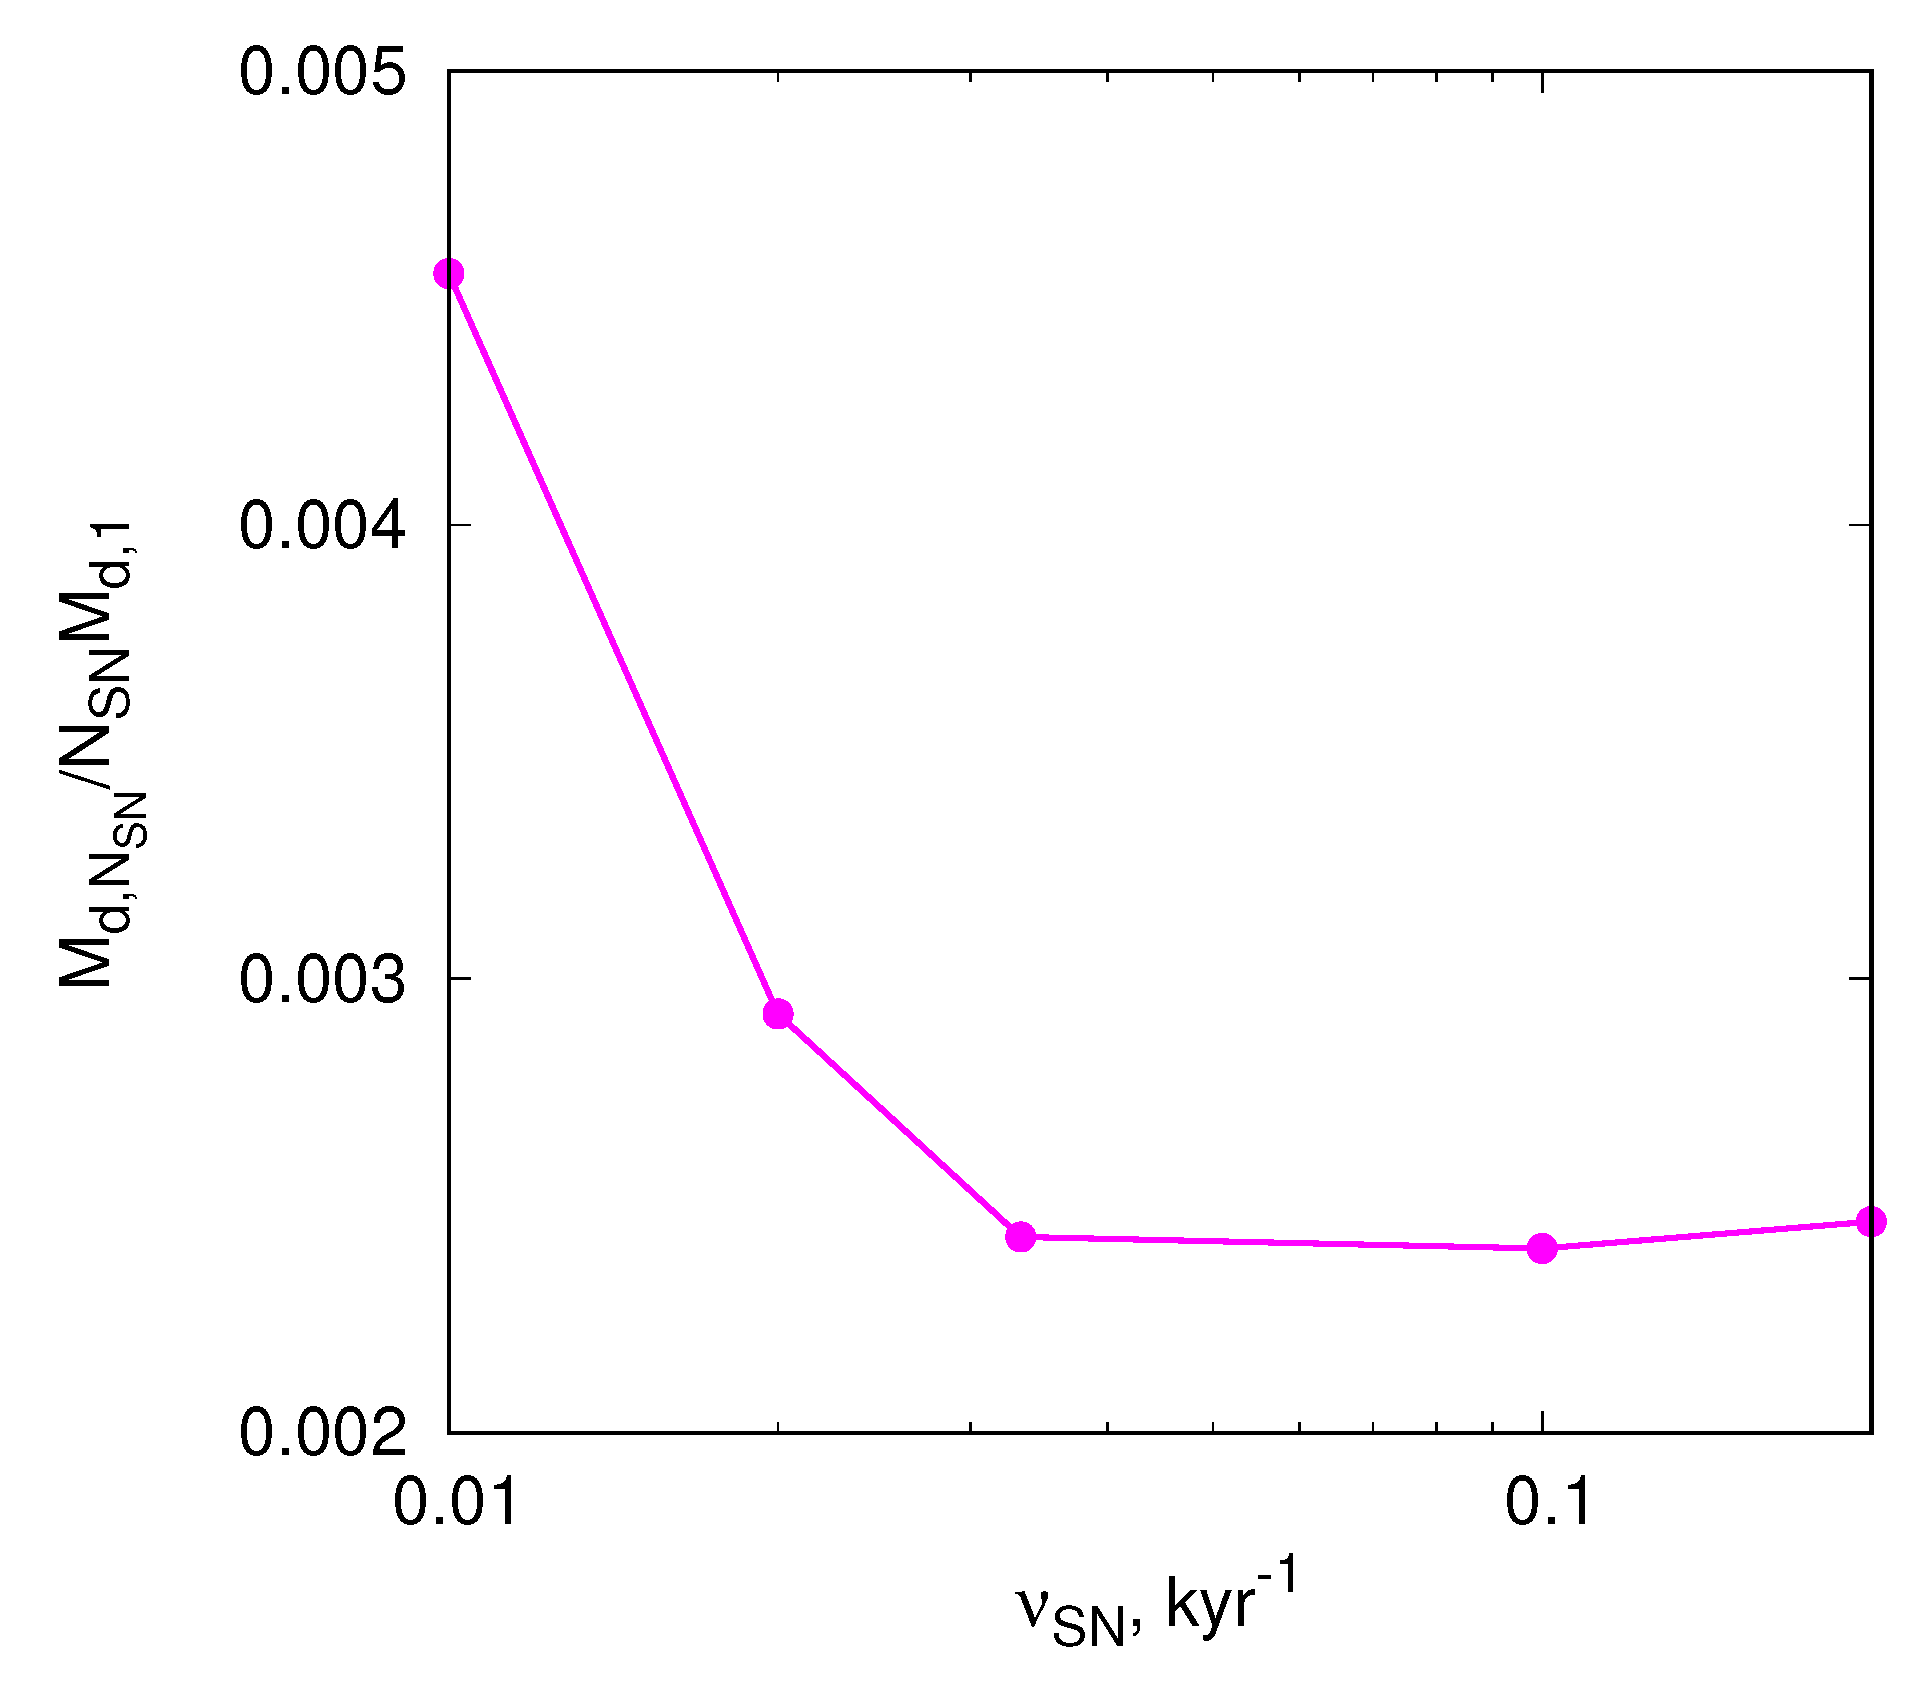
It is also important to stress that destruction of dust particles by multiple shock waves from synchronized SN explosions is less efficient than that from isolated SNe. Synchronous SNe are quite likely to occur in compact galaxies with sufficiently high SFR density, as observed in the z > 10 universe. Contrary to the destruction of dust by a single isolated SN explosion, the effect of multiple coherent explosions in a cluster can be more subtle. The reason is that shock waves from collective explosions considerably lose energy in interaction with dense filaments and clumps in a growing superbubble and in its dense supershell [106]. For compact clusters with coherent SN explosions, most of the dust that is accumulated in the swept-up supershell is shielded by a thick layer of dense gas. At the same time, subsequently expanding shock waves fall onto the shell and add their momenta [112] (see Figure 3). As a result, the efficiency of dust destruction per one SN in clusters M d , N sn / M d , 1 may decrease considerably. As mentioned above, the specific mass of destroyed dust per single isolated SN is estimated as M d , isol 10 M [104,105]. As has been found in 3D multi-fluid simulations, the specific destroyed dust mass per single SN in the cluster decreases considerably [112].
M d , N sn M d , isol 0.0025 0.2 kyr 1 ν sn 0.2 .
Here, M d , N sn = i M d , i / N sn is the specific (per a single SN in the cluster), M d , i being the mass of dust destroyed under the action of the i-th SN in the cluster6, N sn = i N sn , i the total number of SNe exploded in the cluster, and ν sn the SN rate in kyr−1.
One can, therefore, assume that for the relevant conditions, the destruction of dust particles may not be efficient to make z > 10 galaxies as transparent as they appear. Removal of dust in strong outflows seems to be a more likely mechanism. Another option is to lock dust into very dense, compact, dusty clouds with the help of strong turbulence supported, for instance, by converging flows during major mergers [113].

2.2. Clearing the z > 10 Galaxies from Dust

2.2.1. Radiation-Driven Outflows

Motivated by the discovery of extremely bright galaxies in the z > 10 universe by JWST, the ‘attenuation-free model’ (AFM) has been suggested in [70,73,74]. In this scenario, stellar light arising from a starburst episode transfers its momentum to dust particles and expels them along with gas from the galaxy in the form of an outflow [56,84,85]. The key factor that determines the efficiency of the outflow is the Eddington factor—the ratio of radiation and gravitational forces acting on the ISM. In a simplified form, it reads
η E = F r F G = K ( τ ) L 4 π G M * c Σ g ,
where K ( τ ) = 1 e τ is the fraction of photons absorbed by a shell, τ is the optical depth averaged over the stellar spectrum, L is the bolometric stellar luminosity, and Σ g = M g / 4 π R 2 is the surface density of the shell. In a self-consistent approach [56,84] with L Σ sf and Σ sf Σ g α , the Eddington factor η E is determined by the surface star formation density rate Σ sf and optical depth (see Figure 2 in [56]). When η E > 1 , radiation pressure accelerates the shell
M g d v d t = K ( τ ) L c G M * M g R 2 .
In a spherically symmetric case, optical depth τ decreases as R 2 , and as seen at a certain R, the r.h.s. becomes negative, and radiative acceleration terminates. The termination velocity v can be roughly estimated as
v 2 K ( τ = 1 ) L R ( τ = 1 ) c M g
here R ( τ = 1 ) is the shell radius at which τ = 1 . It is readily seen from (13) that v can be reduced to an observational characteristic—the specific star formation rate sSFR / sSFR * normalized by the critical sSFR* defined in [82,84] as
sSFR * = 25 200 A 2 f b o l Gyr 1 ,
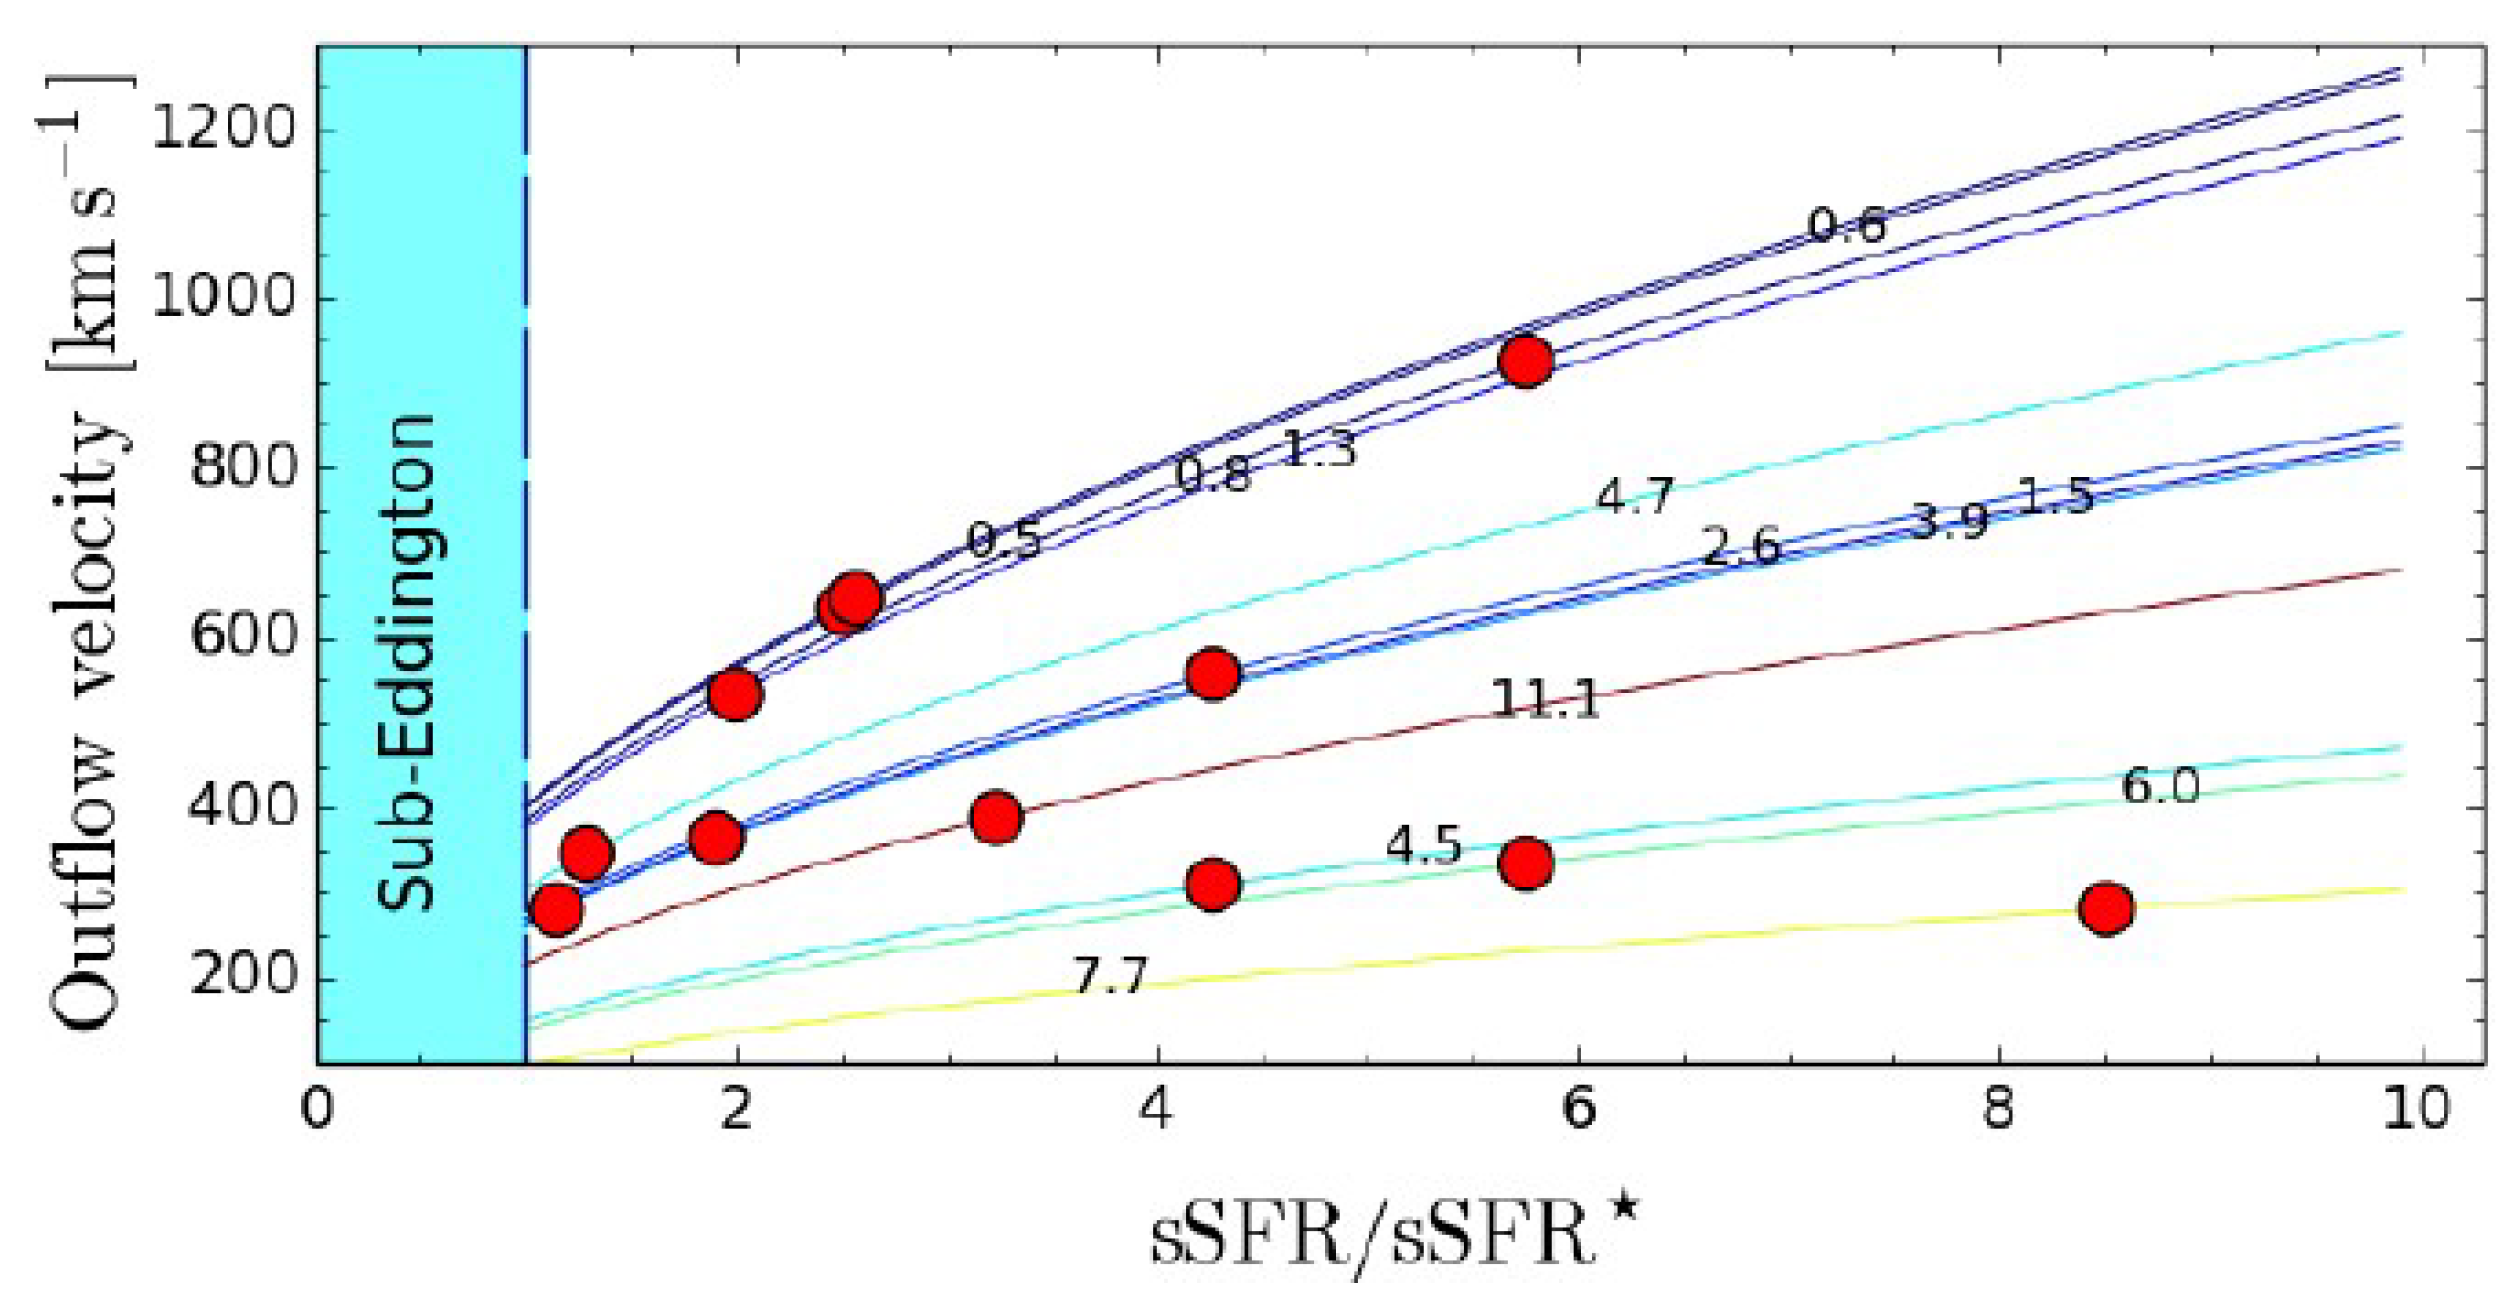
where A = σ d / σ T , the ratio of the dust to Thomson cross section, and f bol = L bol / L 1500 , the ratio of bolometric to UV ( λ = 1500 Å) luminosity [82,84]. Figure 4 illustrates the dependence of terminal velocity on the ratio sSFR / sSFR * for a set of galaxies in the redshift range 3 < z < 9 from [114].
The curves show that the characteristic time for the outflow to leave the half-brightness radius of z > 10 galaxies is only about 3 Myr, i.e., much shorter than the typical time of starbursts of tens of Myr, making them predominantly “attenuation free”.
Observational indications of dust outflows can be recognized, e.g., in the galaxy JADES-GS-z14-0 ( z 14.32 ) in its brightness radial profile: Ly α in Figure 3a–c in [44], and the flux map of the [OIII] 88 μ m emission on the right panel of Figure 1 in [115]. A considerable velocity offset (towards the red) of Δ v ∼555 km s−1 is observed in the galaxy GN-z11 ( z = 10.60 ), as can be seen in Figures 5 and 6 in [66]. The GN-z11 galaxy is known to have extremely low dust content [9,11], and hence the velocity offset is most likely connected with the Ly α backscattering off the outflow as stressed in [66]. However, as the optical depth of a spherically symmetric outflow decreases with the outflow radius (as n R R 2 ), the radiation pressure on the dust as a driver at initial acceleration stages cannot be totally excluded.

2.2.2. SNe-Driven Outflows

Besides radiation pressure, dust can be evacuated along with the gas by ram pressure of shock waves from stellar wind and SN explosions. Typical mechanical surface energy input rate in z > 10 galaxies can be estimated as
E ˙ ν ¯ E B M ˙ * π R G 2 0.1 ν ¯ 0.01 E 51 R e , 0.3 2 erg cm 2 s 1 ,
which is at least 10–30 times the threshold energy input rate for launching a galaxy-scale wind [116,117,118,119,120,121,122]. In terms of the star formation rate, these galaxies fall nearly on the upper branch of the Kennicutt–Schmidt relation, where the most powerful starbursts with Σ ˙ sf 30 M yr 1 kpc 2 are located [123]. The difference between radiation-driven and mechanical-driven motions is determined by the momentum carried by photons on one side, δ P ph ϵ ph / c , and by particles δ P p ϵ p / v on the other. Therefore, even though the UV luminosity from star formation is (Table 1 in [123])
L UV 5 × 10 43 M ˙ * erg s 1 ,
is much higher than the mechanical one:
L m 3 × 10 41 ν ¯ 0.01 M ˙ * erg s 1 ,
the momentum transferred from the mechanical energy flux is higher by a factor of c / v 1 than from the radiative one. Typically, the velocity of SN ejecta is ∼3000 km s−1, resulting in c / v 10 2 ν ¯ 1 . Therefore, as stressed by [124], their contributions are comparable in supporting a large-scale flow, provided the optical depth of a driven material is τ ∼1. In this sense, mechanically driven outflows are still an option in z > 10 galaxies. The difference between them as drivers is in how they propagate from the sources to the targeted gas. From a very generic point, radiation pressure acts on gas in a diffuse manner, whereas the mechanical impacts are more concentrated in the form of shocks. Consequently, the overall dynamics of driven outflows and observational manifestations can differ between the two processes.
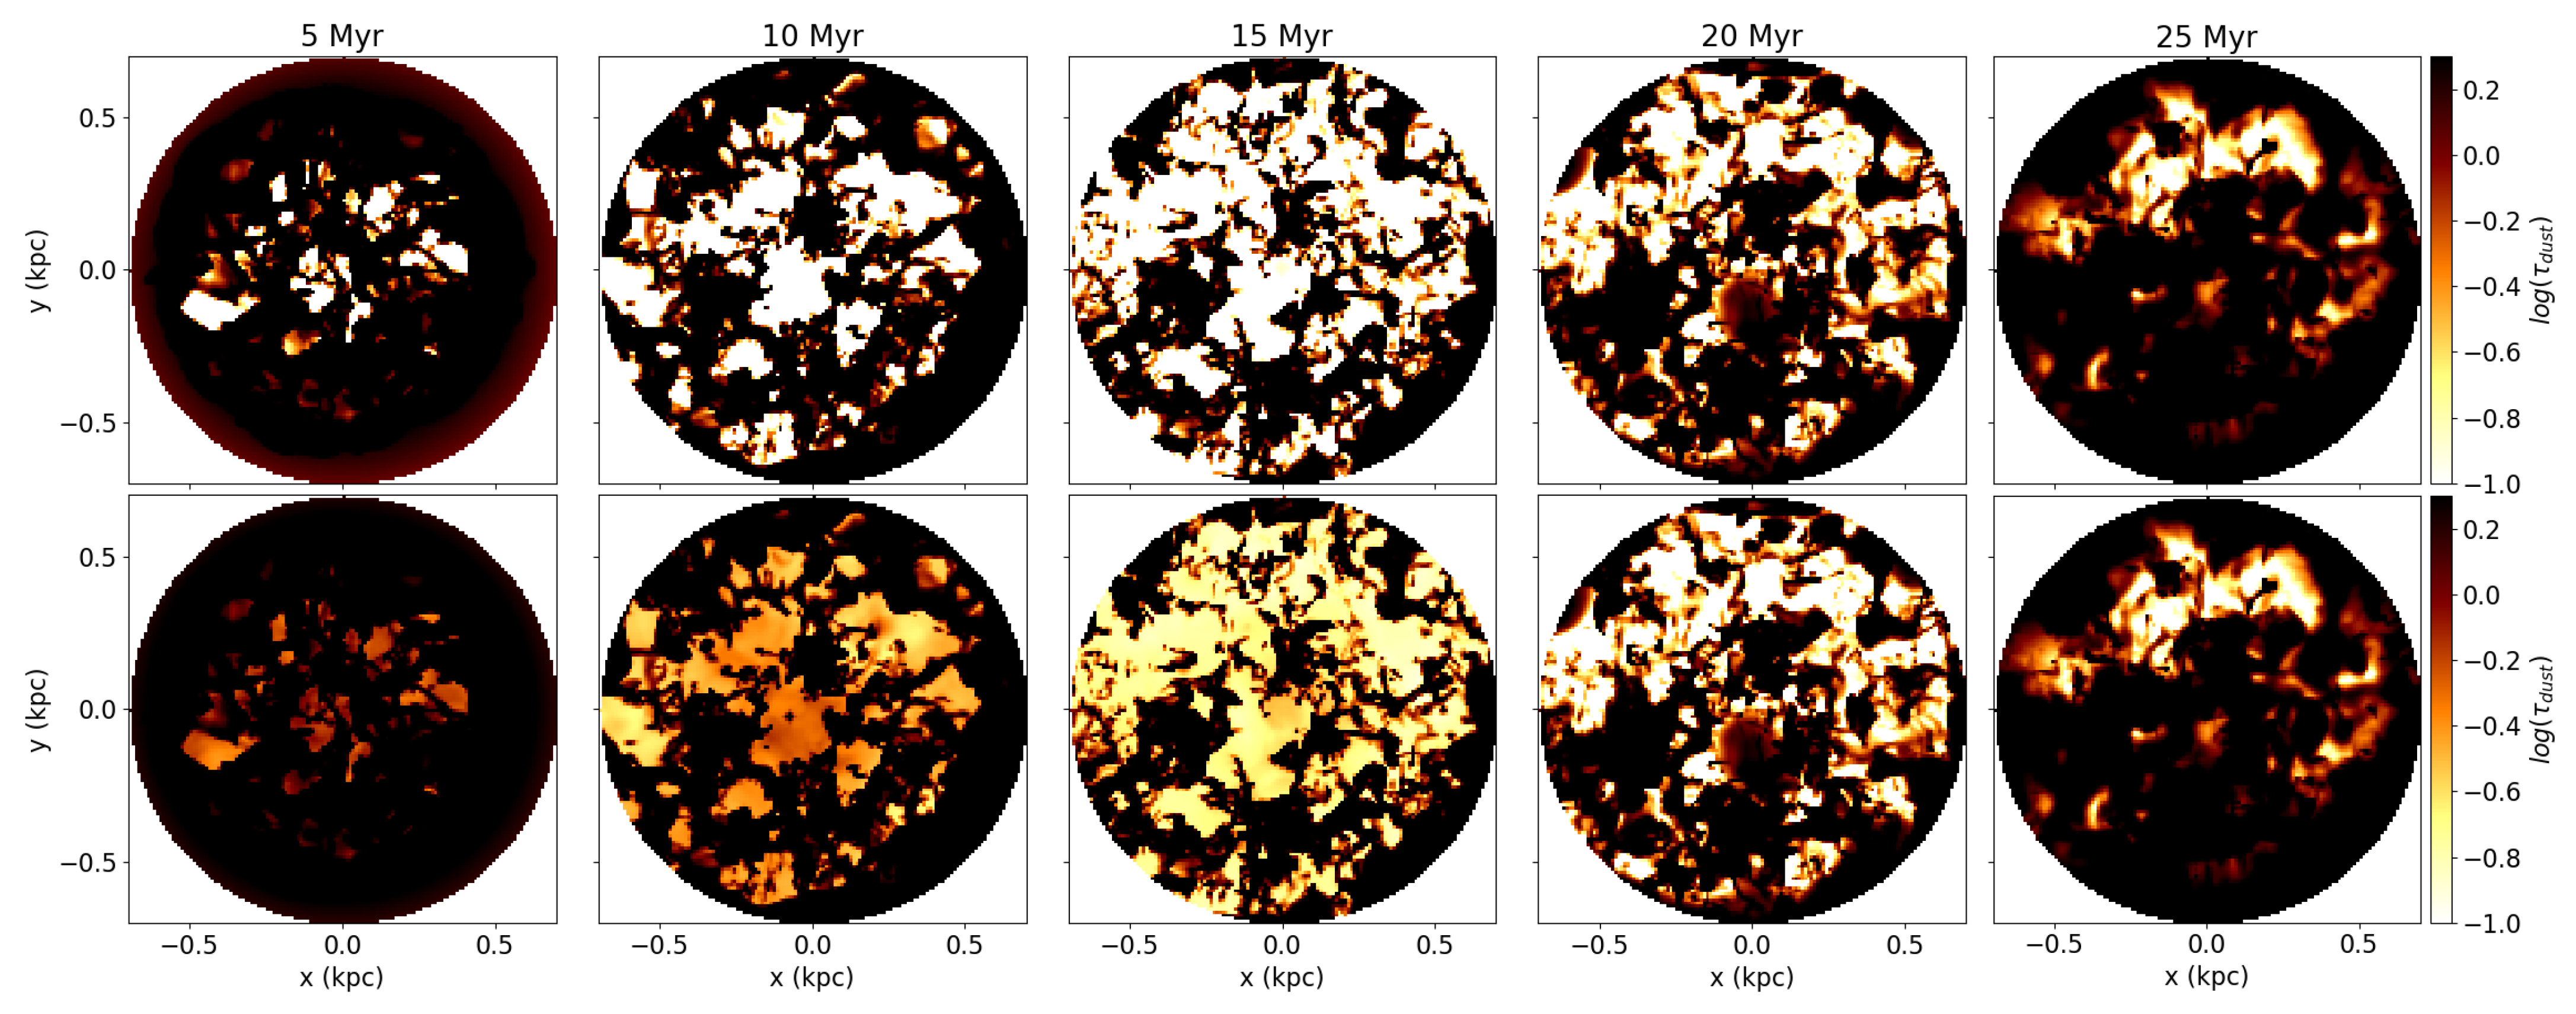
In order to interpret the lack of dust in the galaxy GN-z11 ( z 10.6 ), a 3D numerical scenario of a starburst-driven outflow has been developed in [72]. The GN-z11 galaxy shows a reddening of E ( B V ) ± 0.01 , with a UV slope β 2.4 , although the gas metallicity is rather high ( Z 0.2 Z ) [9,11,13]. In this scenario, a large-scale outflow is initiated by a starburst with SFR 25 M yr−1 occurring in an ellipsoid with axes 0.7 and 0.25 kpc in the center of a disk-like galaxy. When the ensuing supershell reaches a few scale heights in the vertical direction, it fragments under the Rayleigh–Taylor instability. As a result, the dust, along with gas, collects into clouds and filaments, leaving a considerable part of the shell thinner and transparent. Figure 5 illustrates the maps of optical thickness τ uv distribution over the front side of the supershell enveloping the hot superbubble from SN explosions: the upper and lower rows respectively show maps with and without dust sputtering taken into account. It is seen that Rayleigh–Taylor instability redistributes material in the shell to allow dust to be collected in compact and dense clumps and filaments and rarified cavities with the density and optical depth contrasts of order ∼30. After SN explosions are exhausted, the supershell relaxes, and the remaining turbulence in it mixes dense clumps and diluted cavities. The gas density distribution in the shell becomes smooth without transparent cavities, which makes the supershell obscured. As a result, the outflow driven by shocks from clustered SNe can make the supershell enveloping the stellar cluster clear of dusty fog for a period of active SN explosions. It can last Δ t 15 Myr, comparable to the lifetime of the most abundant low-mass SN progenitors. Figure 5 illustrates one such cycle. The presence of a sufficient gas reservoir can make possible alternation between bursts and inhibitions of star formation, similar to that described in the feedback-free starburst scenario [93,94].
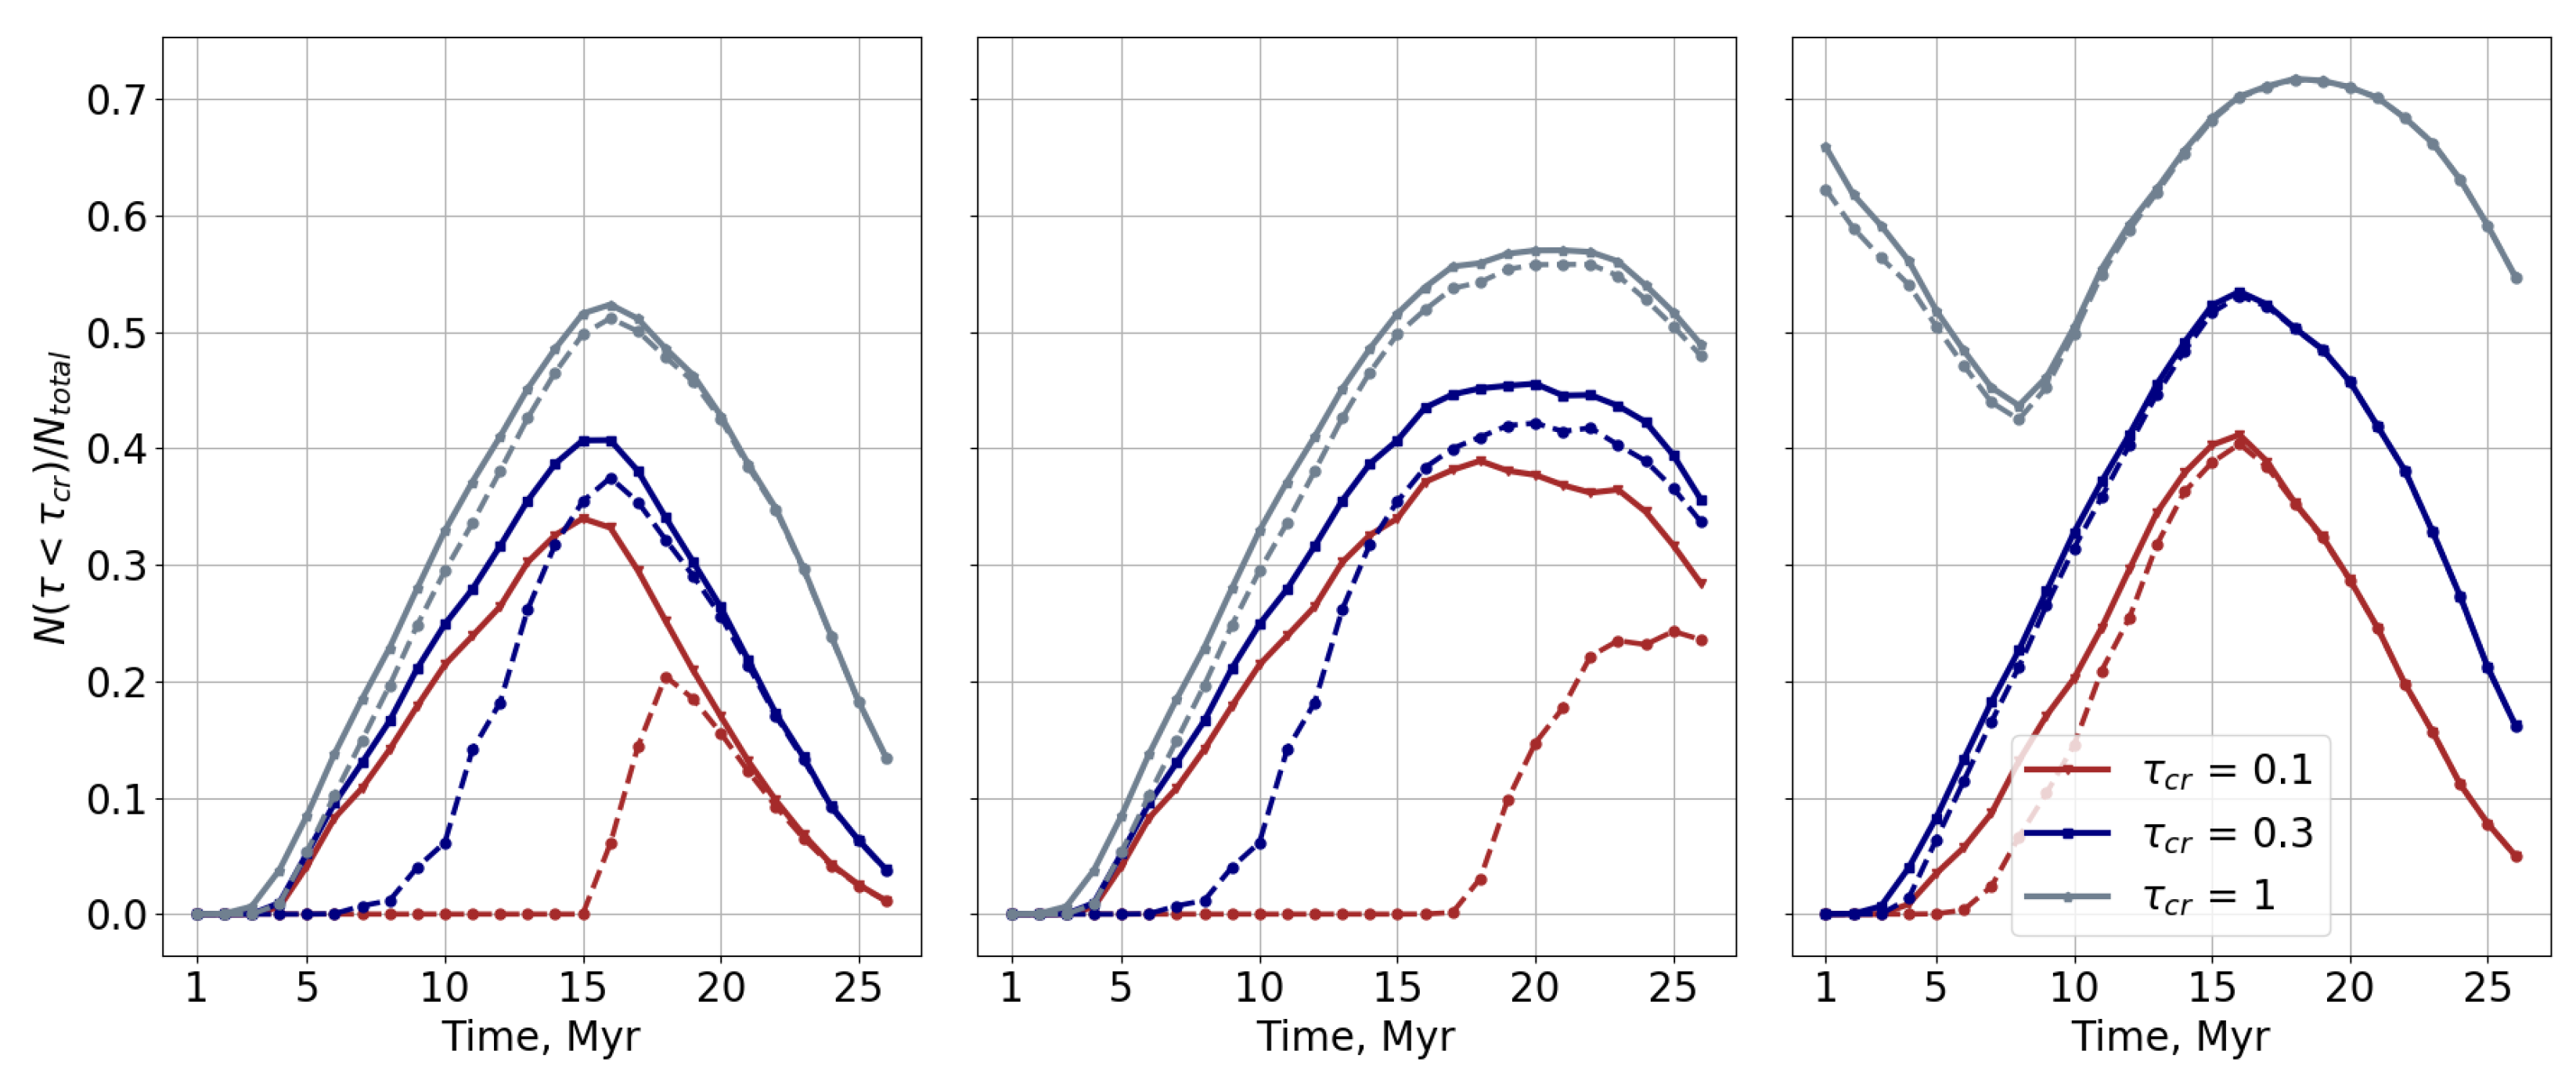
Figure 6 illustrates how the fraction of the shell area with optical depth τ uv below a given “critical” value τ c r : f τ ( t ) f τ u v < τ c r ( t ) = N ( τ < τ c r , t ) / N t o t , evolves with time during the evolution of the supershell. This fraction indicates the part of light generated by the underlying stellar population that will be obscured. The function N ( τ < τ c r , t ) is plotted for three models: (i) the IMF truncated at M * , m = 8 M , the SN explosion time 25 Myr, and MRN dust size distribution n ( a ) a 3.5 [125], with a m = 0.003 μ m and a M = 0.3 μ m; (ii) the IMF truncated at M * , m = 10 M and MRN dust, and (iii) the IMF with M * , m = 10 M and“flat” dust distribution n ( a ) a 1.5 [126]. One can conclude that one of the possible mechanisms of clearing z > 10 galaxies of dusty fog is the Rayleigh–Taylor instability that fragments shock-driven expanding supershells into cavities and clumps. During such episodes, the optical depth of a considerable fraction of expanding supershells can drop below the limit, e.g., τ uv 0.1 , to imitate a free attenuation phase for Δ t 10 Myr, depending on the star formation mode, as shown in examples in Figure 6. The presence of a sufficient gas reservoir can make possible alternation between bursts and suppressions of star formation, similar to that described in the feedback-free starburst scenario [93,94].
Therefore, in the process of SN-driven dust-gas outflows, the expanding dusty supershell becomes transparent for the light from the underlying stellar population, which can thereby be observed as dust-free. The main engine that provides this ‘clearing up of fog’ is connected with Rayleigh–Taylor instability. RT instability is known to be a ubiquitous process in fragmenting large-scale shells that expand in a stratified medium [127,128,129,130]. From this point of view, the RT instability can be thought to be amongst the primary mechanisms that make the z > 10 galaxies appear dust-free.

2.2.3. Feedback-Free Starbursts

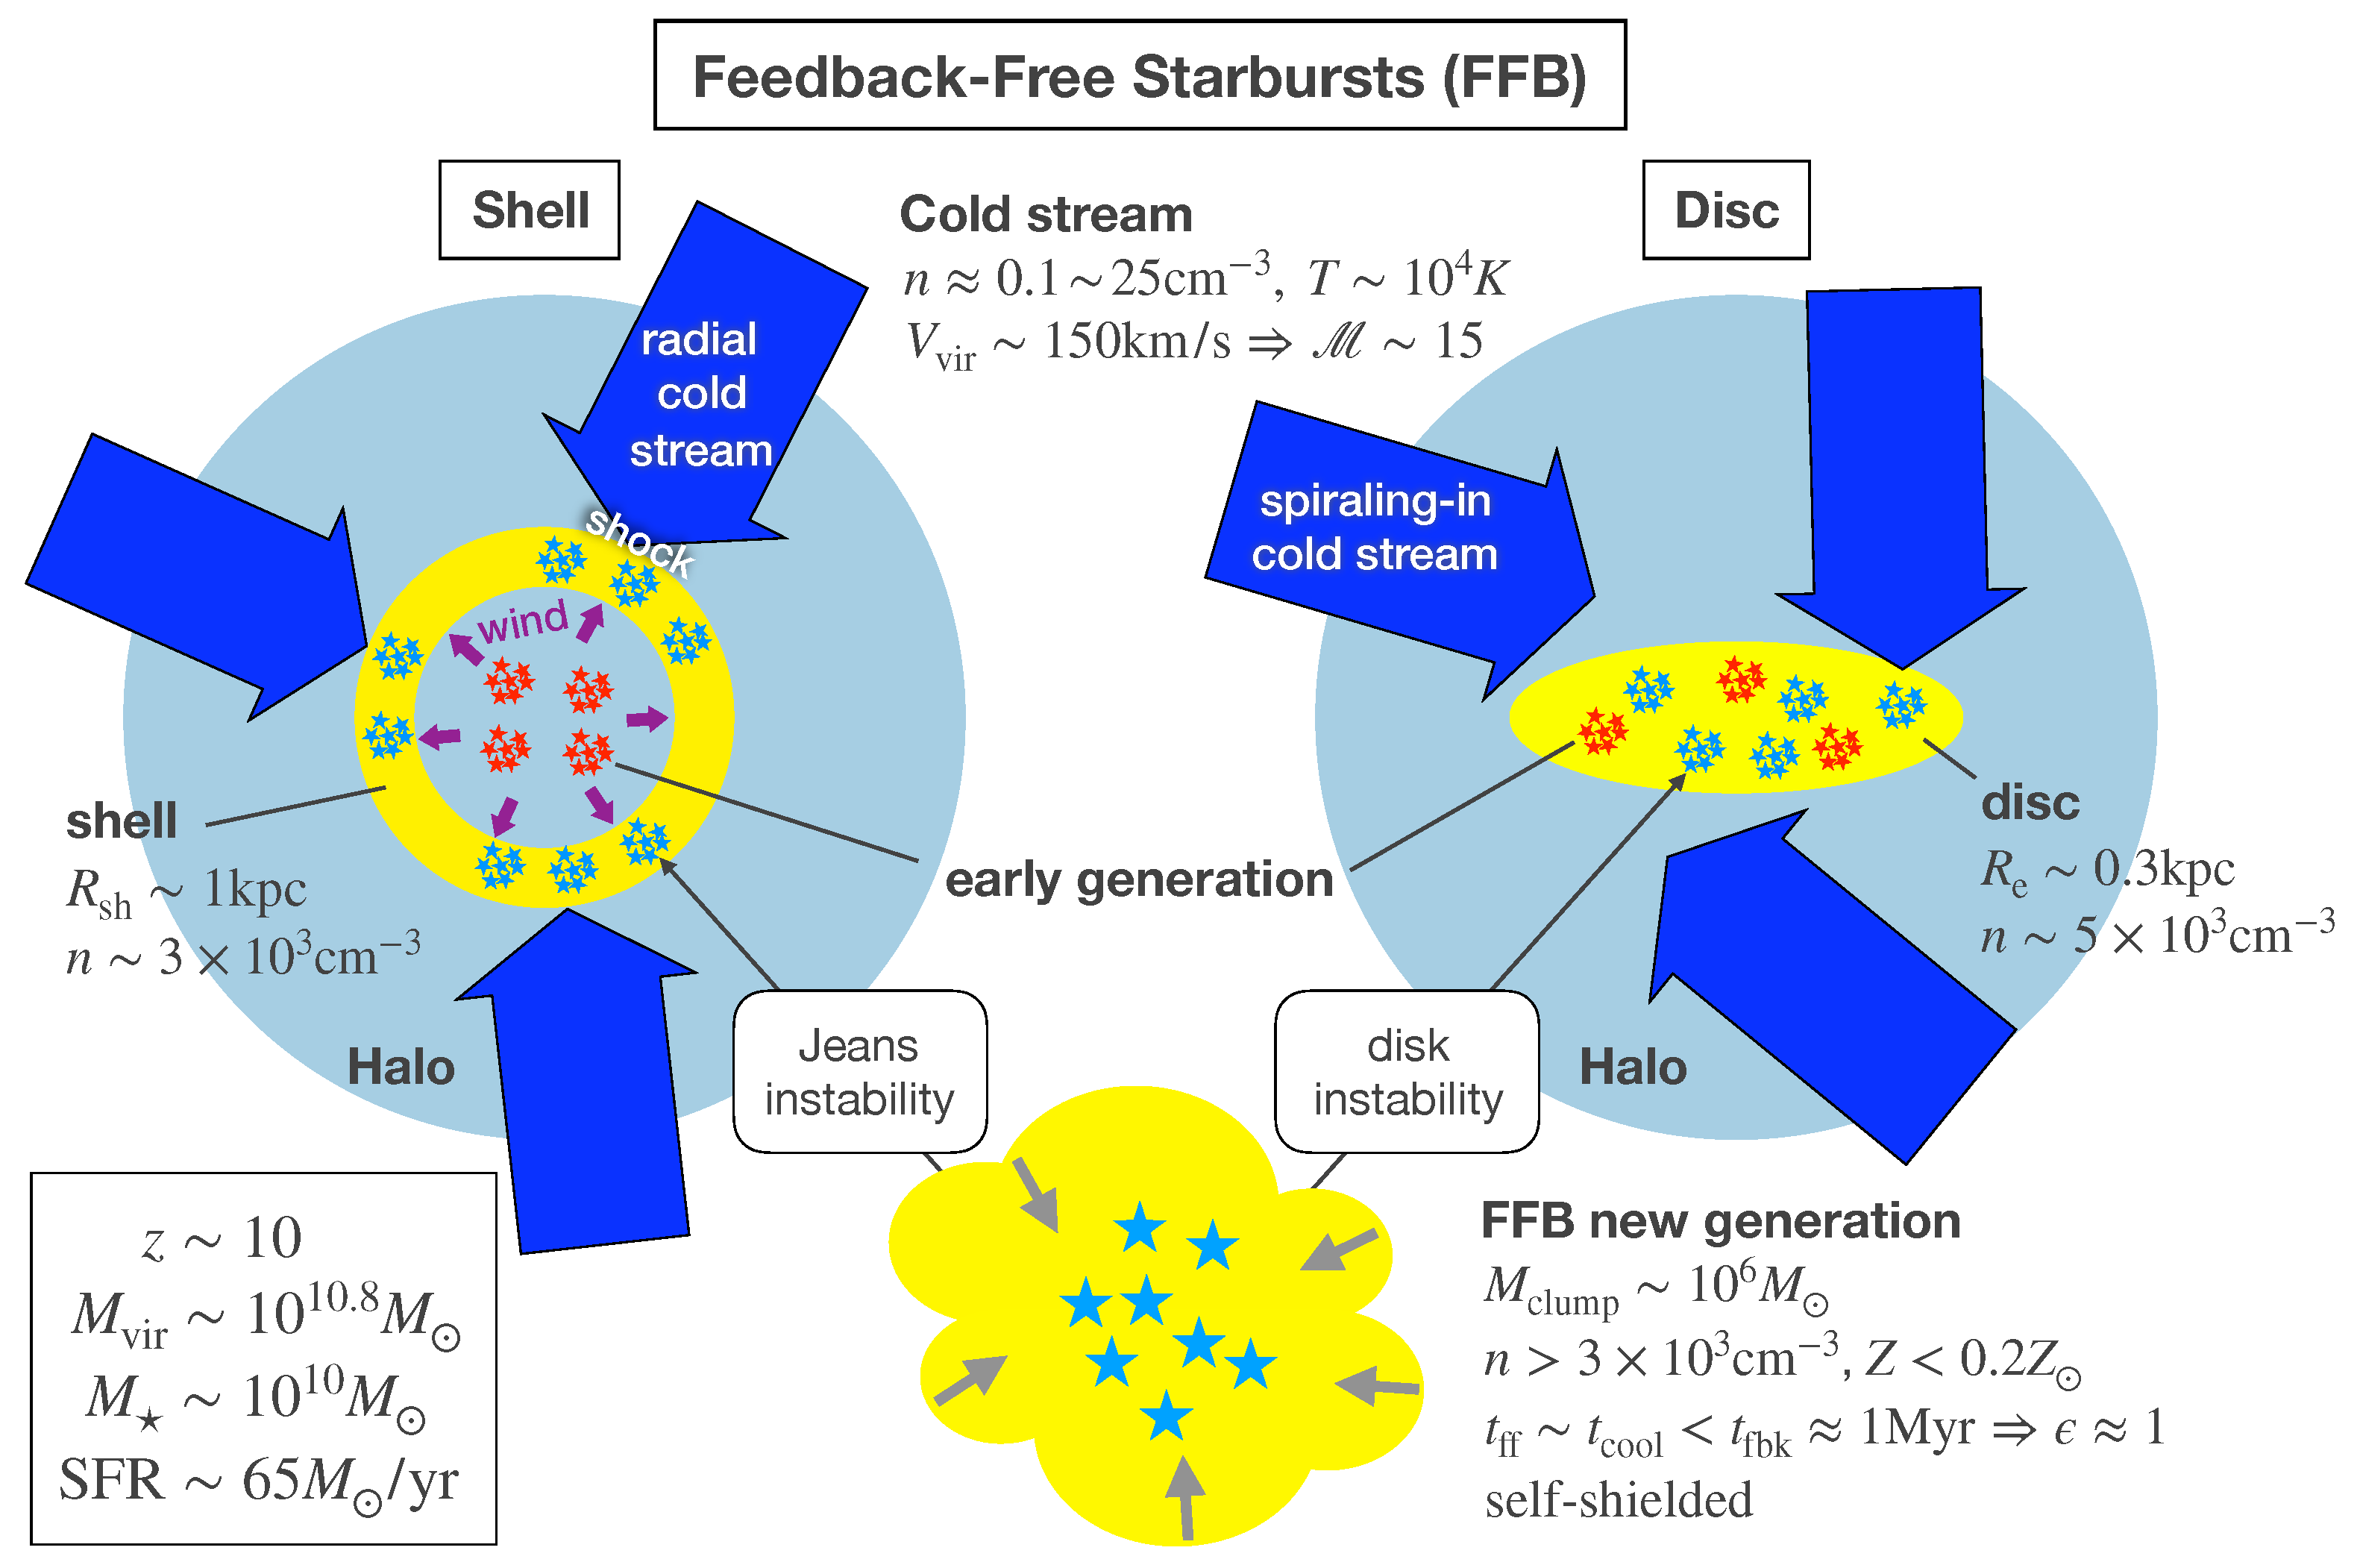
The basic concept of the feedback-free starburst (FFB) scenario described in [93,94] implies the star formation efficiency ϵ * ∼1. For this to fulfill, star formation should proceed on time scales not longer than ∼1 Myr—the time needed for the onset of feedback in the form of stellar wind and SNe explosions. This requires the gas density n > 3 × 10 2 cm−3 in order to keep the free-fall time t f f = ( 3 π / 32 G ρ ) 1 / 2 1.5 × 10 15 n 1 / 2 s, which is t f f 0.85 Myr at n = 300 cm−3. Among the necessary conditions are: (i) the gas temperature during this time is supported against adiabatic heating by the atomic cooling at T 10 4 K and (ii) the surface density of the clouds experiencing a free-fall contraction must be Σ > 10 3 M pc−2 in order to prevent radiative feedback onto star-forming gas, the corresponding mass of the clouds is M c > 10 4 M . These conditions can be fulfilled at z > 10 in compact–sub-kpc scale–galaxies in halos with M h 10 11 M within converging inflows with characteristic time ∼ t f f .
The two possible inflow configurations that can maintain a high star formation efficiency are described in [93,94]: one is based on radial supersonic streams that encounter galaxy external regions and drive shock waves inwards, while the other implies a gas with a low angular momentum falling onto galactic disks. Both scenarios suggest the streams are channeled along a relatively thin galaxy-focusing filament [131,132]. The gas density of the shocked gas in a quasi-spherical shell in the first scenario (n 3 × 10 3 cm−3) and in a gaseous disk (n 5 × 10 3 cm−3) in the second case. The sizes of the compressed shell and the disk where the FFB regime is to be supported are determined by the width ( R s t r 0.7 kpc) of the infalling stream [132] and the ram pressure it exerts on to the galaxy gas. With the temperature kept at T 10 4 K, these conditions are conducive for the gas to fragment and form clouds with the surface density N H 10 23 cm−2 sufficient to prevent them from radiative destruction. The scenarios are illustrated in Figure 7.
It is seen that the scenario suggests a continuous self-oscillating star formation until the accreting baryons are exhausted. This time is of the order of the virial time, and for the assumed parameters, it is t v ∼80 Myr [94]. The star formation proceeds in a bursty regime with several generations of stars depending on the host halo mass M h and the star formation efficiency ϵ * for the halo of M h 10 11 M , the number of such generations N g e n ∼10. Each burst continues t g e n t v / N g e n ∼10–20 Myr with the SF amplitude SFR∼200–500 M yr−1 and the width around the maximum of Δ t ∼(0.2–0.5) t g e n . This means that each burst can be observed as a separate galaxy [94].
As stressed in [93], the halos with masses M h 10 11 M at z 10 are ∼ 5 σ peaks and thus provide conditions for low angular momentum radially converging inflows. This can explain the fact that ‘blue monster’ galaxies are detected at z > 10 .

2.2.4. Delayed Stellar Feedback

The origin of ‘blue monsters’ can be connected with the ‘starburst’ mode, driven by a delayed stellar feedback [87]. The model is based on the fact that in the early universe, the characteristic time scale of star formation, the free-fall time
t f f = 3 π 32 G ρ 1 / 2 ( 1 + z ) 3 / 2 ,
can become comparable to or shorter than the supernovae feedback time of order t s n ∼5–30 Myr. This difference can play an important role in dwarf galaxies prevailing at z > 10 in the universe in the period of early galaxy formation [133].
In the simplest case, the equations of star formation can be written as [87]
M ˙ * ( t ) = ϵ * t f f M g ( t ) , M ˙ g ( t ) = M ˙ a ( t ) M ˙ * ( t ) η M ˙ * ( t t s n ) ,
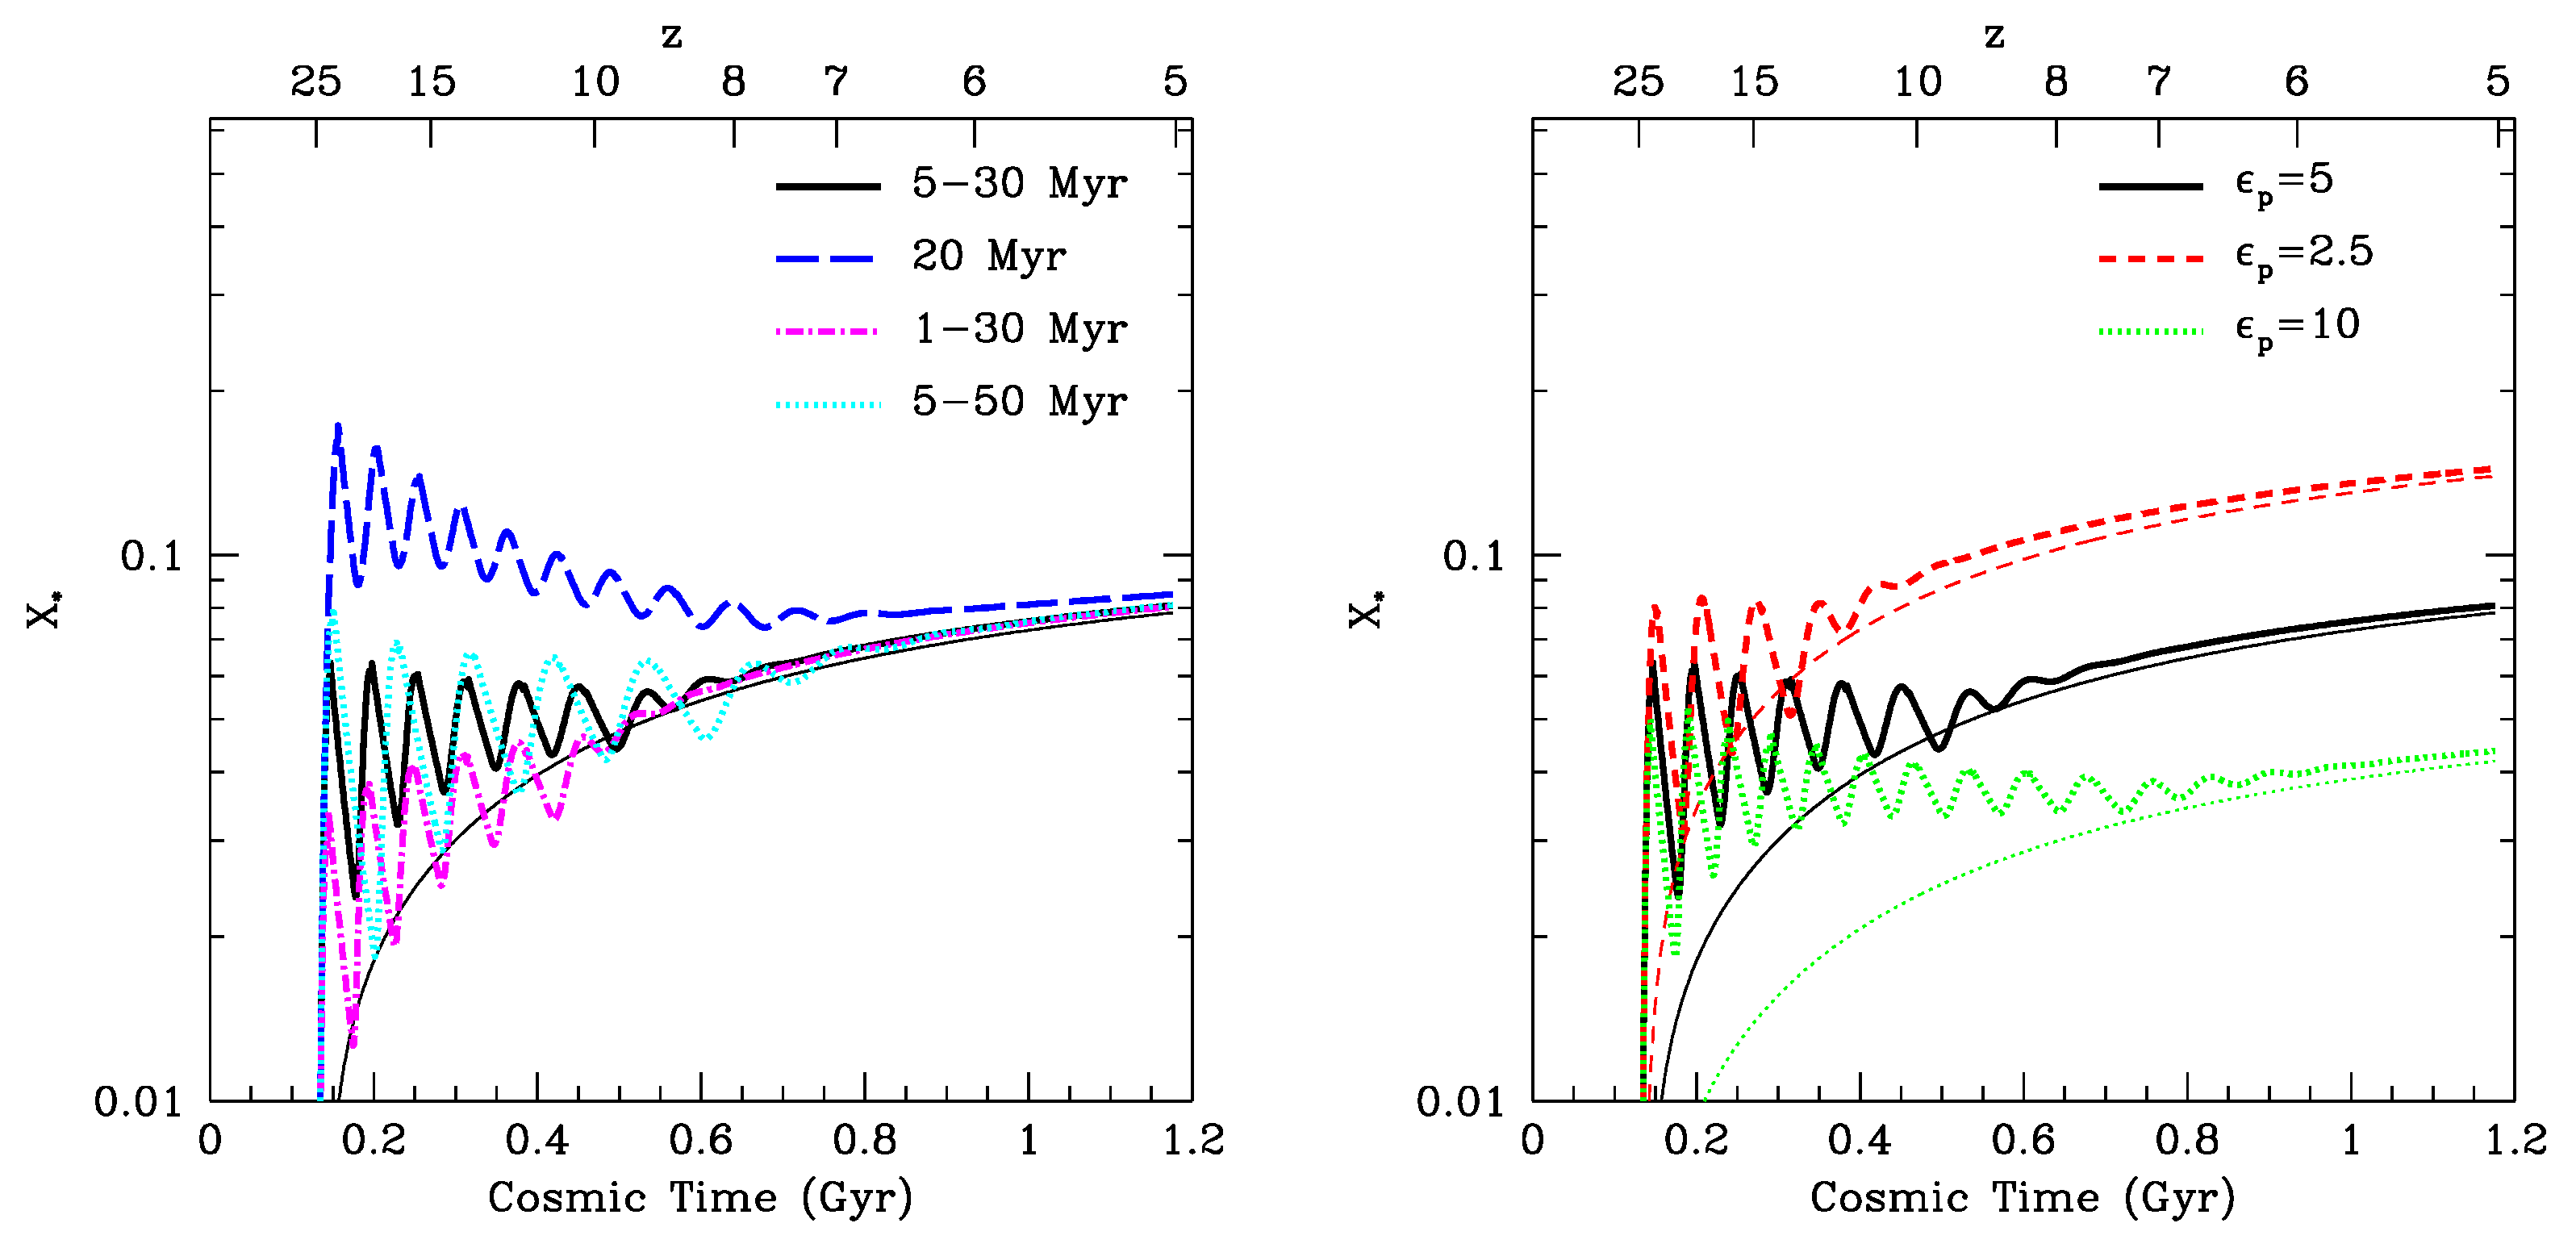
where M ˙ a is the accretion rate onto the galaxy, η = M ˙ e / M ˙ * is the gas mass load factor associated with the SNe feedback, and t s n is the time delay of the SNe feedback. The delayed stellar feedback (DSF) systems are known to reveal oscillatory dynamical equilibrium with continuous competition between gravitational collapse, star formation, and delayed feedback. The models based on the DSF have been used for the interpretation of the bursty mode of star formation in dwarf galaxies of the nearby universe and for the explanation of the scatter in SFR at the low end of surface density in the KS relation [134,135,136]. It is therefore natural to expect that the DSF regime can play an important role in the early universe, where galaxy evolution occurred in a very narrow time interval of order 350 Myr from z∼25 to z∼10.
The critically important parameters that determine the intensity and overall dynamics of the DSF star formation are the free-fall time t f f along with the star formation efficiency ϵ f f , the time delay t s n , the accretion rate M ˙ a , and the energy or momentum gained from stellar activity M ˙ * . The interrelation between these parameters, in particular, between the incoming and outflowing material within a time scale of t s n , the delay time scale, and the momentum injected by SNe. In principle, it is possible to find regions in the parameter space that can fit the general features of galaxy evolution at z > 10 . Among these, the scenario associated with the transition between the oscillation and quasi-equilibrium regimes at around z∼10 appears to be important for the interpretation of the ‘blue monster’ phenomena. Figure 8 illustrates the convergence of the oscillating SF dynamics during the initial period of 0.5–0.6 Gyr to the quasi-equilibrium one at later stages, when the perturbations from the local delayed feedback effects are damped on account of the increasing galactic mass.

3. Dust-Rich Galaxies: z < 10

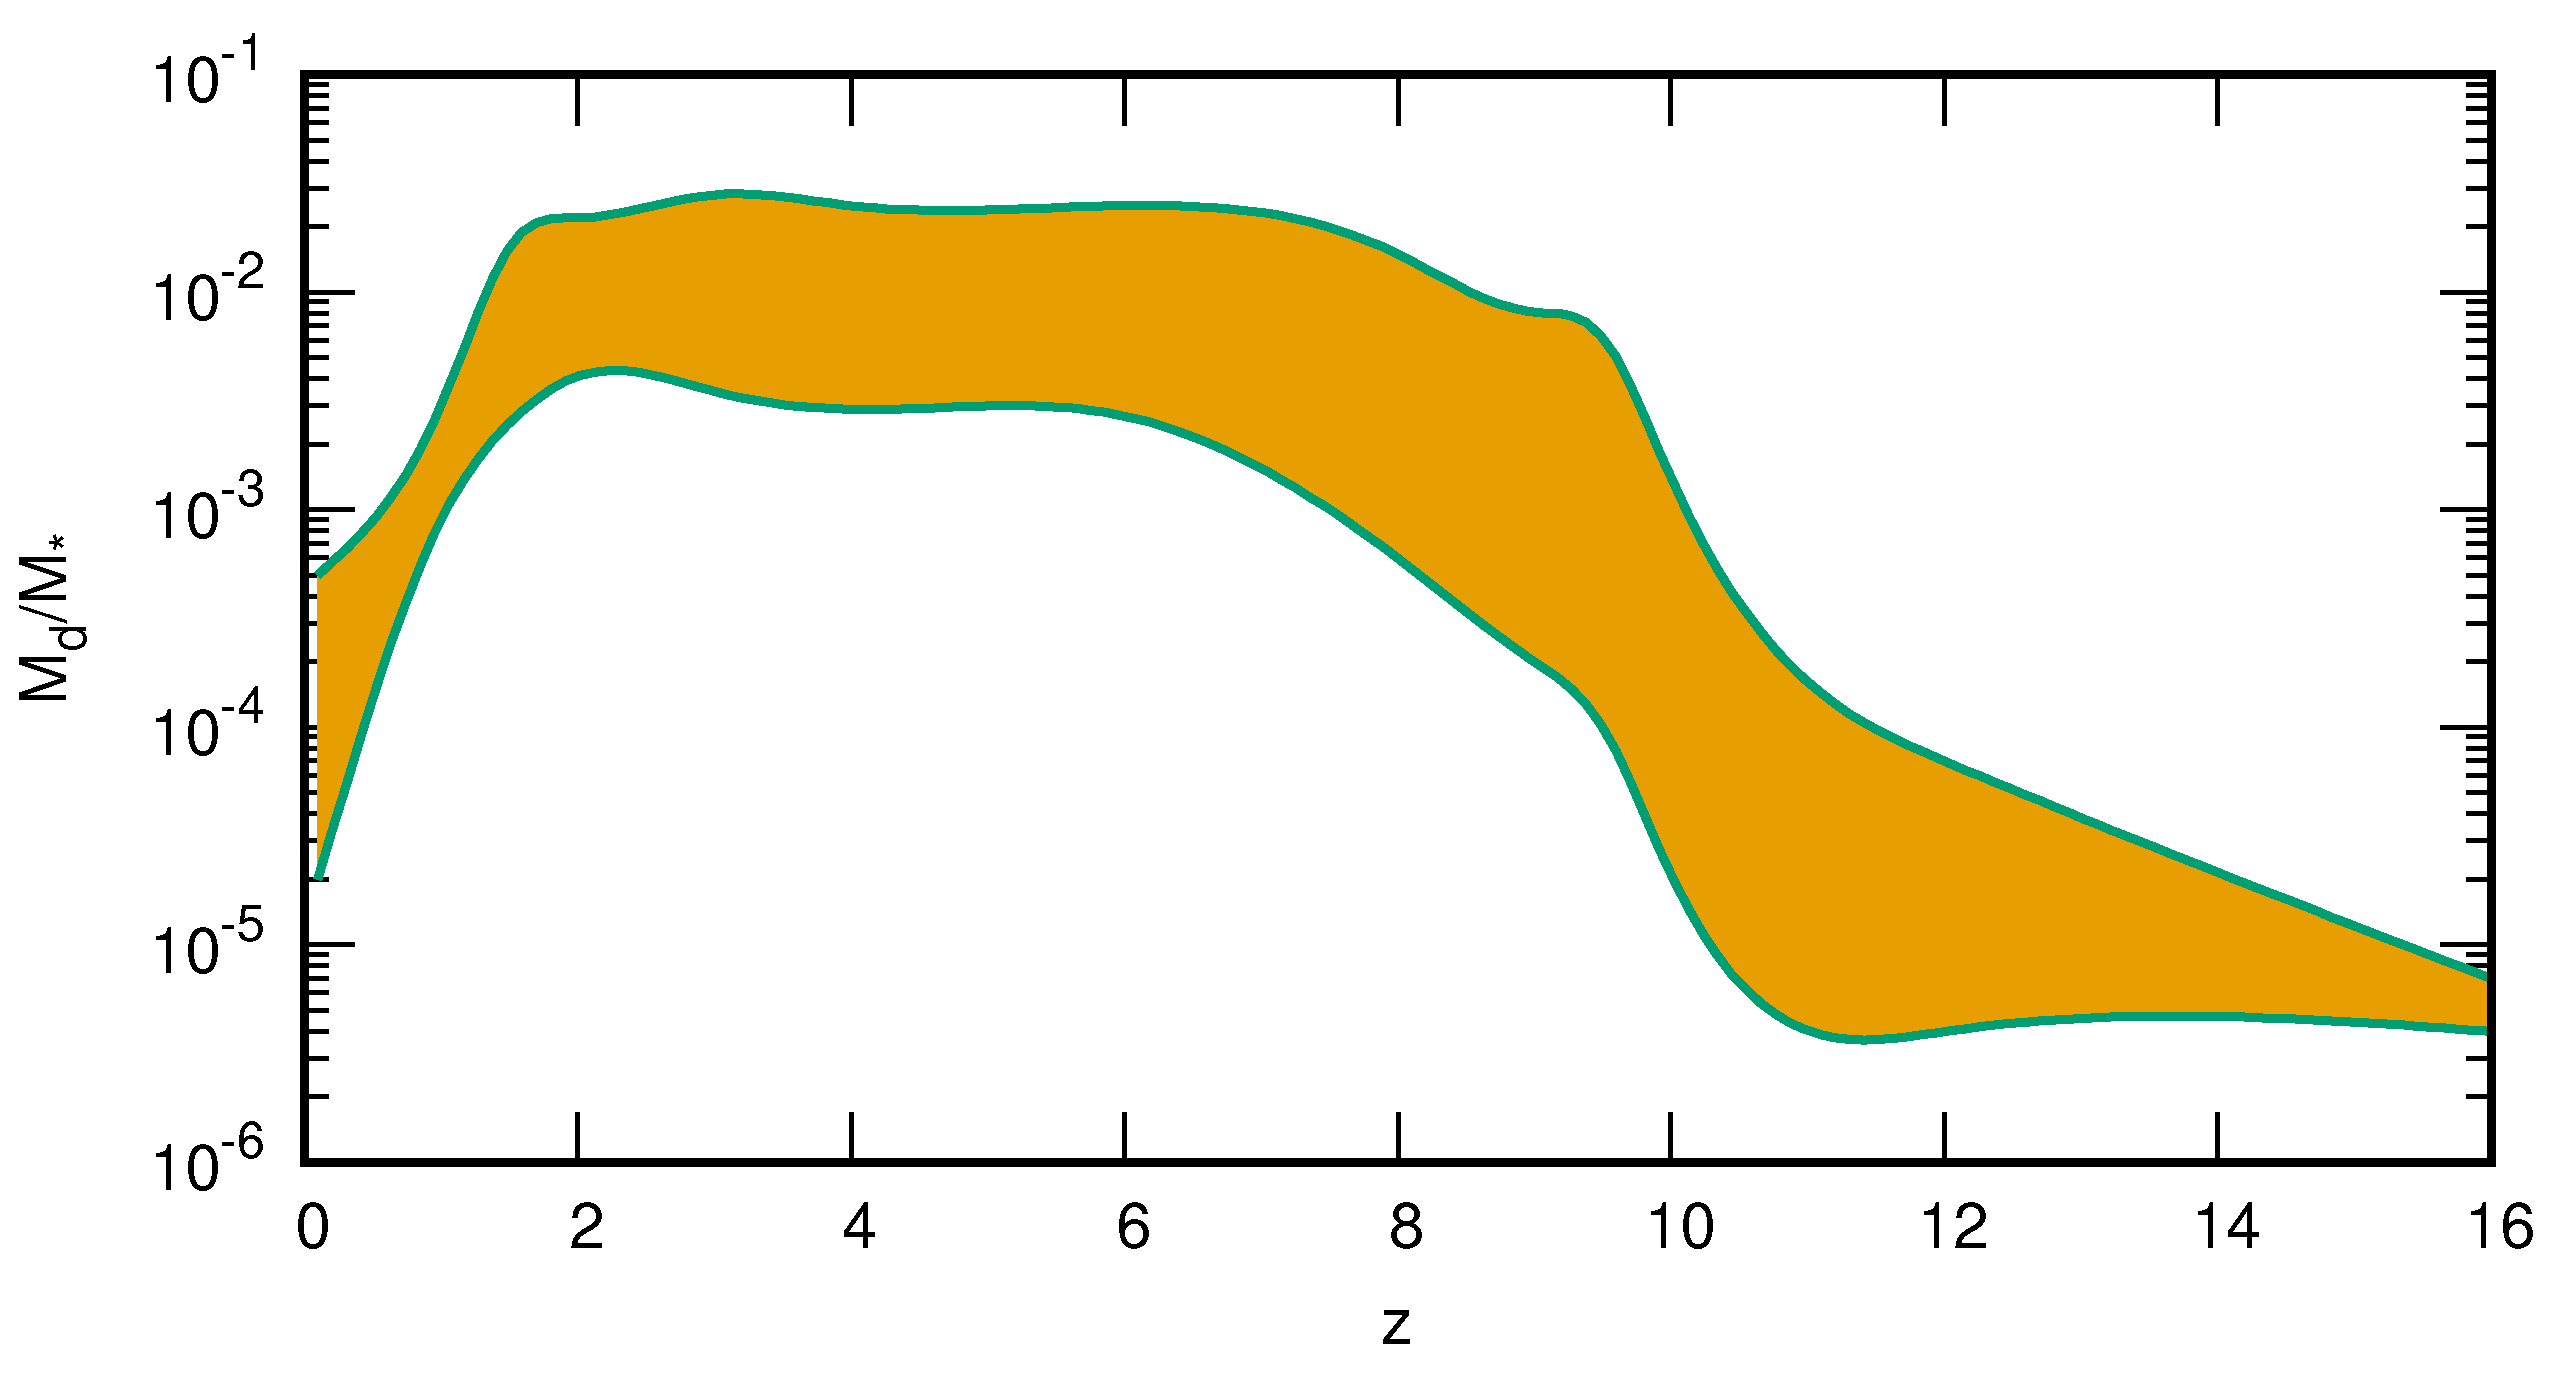
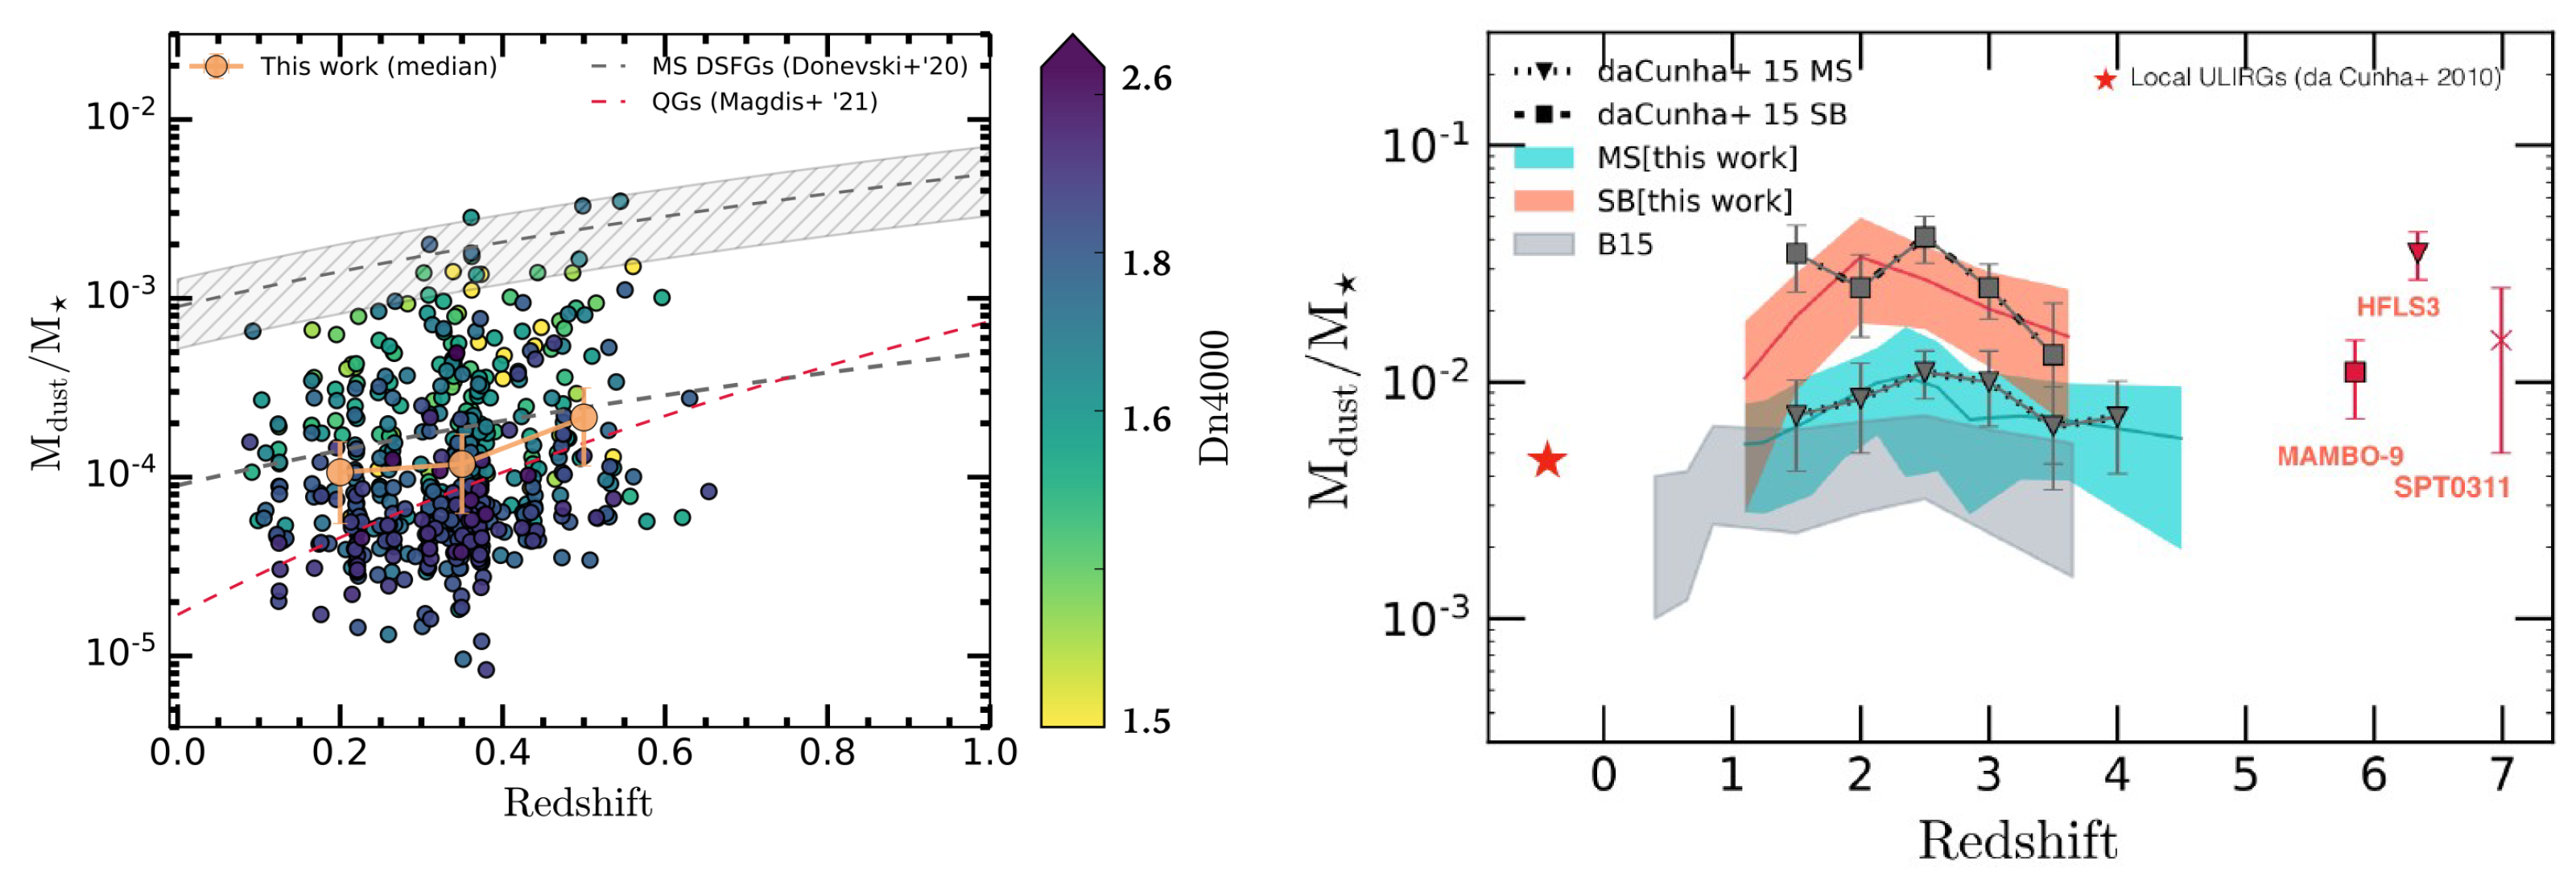
In contrast to high redshift epochs z∼10–16, transition to intermediate z∼8–10 and lower redshifts z∼7–8 shows an enhanced amount of dust, with the dust mass increasing from M d 3 × 10 7 M to M d 3 × 10 8 M in QSO hosts at z∼5–6, with the dust-to-stellar mass ratio ζ * 10 4 10 2 [101,137]. Similar values are inferred for the sample of ALMA REBELS galaxies ( z 7 ) with the ζ * 10 3 10 2 [138]. In some cases galaxies in the intermediate redshifts reveal even an excessive amount of dust with the ζ * = M d / M * (3–30) × 10 3 [52,53,55,138,139,140,141,142,143,144,145]. In this regard it is also interesting to note that even later (in the post-reionization epochs z∼3–6), the dust-to-stellar ratio decreases to the value ∼10−3 after passing through a maximum value of ζ * 0.03 [146,147] and dropping to ∼ 10 5 10 4 at z∼0 [148]. It is important to stress that there are not only starbursts and ULIRGs among galaxies with enhanced dust-to-stellar mass ratios, but a considerable fraction of them are main-sequence galaxies. This overall evolutionary trend from very bright and dust-free galaxies at the beginning of the ‘cosmic dawn’, through dust-rich galaxies at intermediate z∼10 and lower redshifts z∼7–8, and through the ‘cosmic noon’ to the lower epoch z 1 , is schematically shown in Figure 9.

3.1. Intermediate Epochs: Super-Dusty Galaxies

The appearance of dust-enriched z < 10 galaxies soon after the epoch with dust-free galaxies is difficult to explain. This puzzling phenomenon was first reported by [29,63,64,102] and dubbed the ‘dust budget crisis’, and was further confirmed in a series of observations [101,137,149,150,151]. In some cases, galaxies at pre-reionization periods, z∼7–10, exhibit a much larger amount of dust, which the currently observed rate of star formation has difficulty in producing.
As an example, in Ref. [139], measurements from HST/WFC3 and VLT (Very Large Telescope) in λ λ ∼0.8–2.0 μ m showed a considerable amount of dust in the galaxy A1689-zD1 z = 7.6 (age of the universe ≈700 Myr) from spectroscopy of the Ly- α break. The inferred stellar mass is M * = 1.7 × 10 9 M , the dust mass is M d 4 × 10 7 M assuming T d = 35 K, and the dust-to-stellar mass ratio is ζ * 0.02 . More recently, observations by [143] have reduced the estimate of the dust mass in this galaxy by a factor of two, but still the estimated ζ * 0.01 remains rather high.
In [144], the dust mass around M d 10 8.5 M is found in two galaxies, COS-z8M1 ( z 8.4 ) and CEERS-z7M1 ( z 7.6 ), assuming T d = 35 K, with the stellar mass M * 10 10 M and ζ * 0.03 . Even a more dusty galaxy, MACS0454-1251 at z C [ II ] 6.3 (age of the universe ≈880 Myr), has been described in [145]. It has a stellar mass of M * 10 9 M and a dust mass M d 4.8 × 10 7 2.3 × 10 8 M , assuming dust temperature T d = 35 K, and consequently ζ * 0.05–0.23.
The authors of Ref. [152] have inferred a considerable mass of (carbonaceous) dust in the galaxy JADES-GS-z6-0 with the JWST/NIRSpec that made use of the ALMA Band 7 observations allowed to diminish possible contaminations from lower-z dusty star-forming galaxies. The presence of dust is manifested in a strong ( 6 σ ) absorption feature at the rest-frame wavelength very close to the carbonaceous feature at λ = 2175 Å, with A 2175 1 . Although direct estimates of dust mass are not yet available, the observed extinction A 2175 ∼1 for the size of the galaxy d∼300 pc requires a dust mass of ∼ 10 6 M . With the JADES-GS-z6-0 stellar mass M * 10 8 M , this gives ζ * 0.01 . More recently, the carbonaceous 2175 Å ‘bump’ has been found in a sample of JWSTz∼2–12 galaxies with a few of the most distant of them ( z 7–8) showing the bump amplitude B = A b u m p / A 2175 0.1–0.35 comparable to the one of the Milky Way [153]7.
A growing number of galaxies at intermediate redshifts z∼7–9 have been recently found to have ζ * 0.01 , as reported in [52,53,55,138,140,142,154]. In most of these cases, the measured dust mass implies a dust-to-stellar mass ratio to be of order ≳0.01. As stressed in [144], the value of ζ * 0.01 is significantly higher than in dusty star-forming galaxies (DSFG) at lower redshifts. This trend of the dust-to-stellar mass ratio to reach ζ * 0.01–0.03 in main sequence and ζ * 0.01–0.1 in starbursts galaxies continues in the further evolution of galaxies at later stages z 1.5–7, with a considerable contribution from AGB stars [147,148,155,156,157,158], see Figure 10.

3.1.1. Destruction of the Freshly Nucleated Dust

As far as the presence of dust in galaxies at z > 5 is concerned, its origin is supposed to be mainly connected with supernovae explosions8 [27,29,64,101,102,103], which has been observationally confirmed [63,137,149,158,159]; see also [150,151] for review. The dust yield per supernova is likely to be y d ∼0.3–2 M [27,103,160,161,162,163]. The exact value depends on the progenitor mass, its possible rotation, and variations of the explosion energy. The upper limit of the dust-to-stellar mass ratio can be obtained from the estimate ζ * y d ν ¯ sn ∼0.002–0.01, where ν ¯ 1 / 130 is the specific (per stellar mass) SN rate.
It is, however, known that dust particles nucleated in the SN ejecta suffer strong sputtering from the reverse shock (RS) that propagates from the ambient ISM into the ejecta [64,126,164]. The fraction of dust destroyed by the RS varies from f d 0.7 to f d ∼1, depending on the progenitor mass and the ambient density [126,164,165]. Further 2D and 3D hydrodynamical simulations have confirmed that RS heavily destroys dust grains: up to f d ∼0.8–0.9 of silicates and 0.5–0.7 of carbonaceous particles of large sizes (∼0.25–0.5 μ m) in the 2D approach [166]. A comprehensive review is given in [151].
In 3D multi-fluid description, the fraction of destroyed particles is larger than this: the fraction of large ( a > 0.3 μ m) particles that survive the RS for an external density n = 1 cm−3 is only f d , surv 0.3 , whereas the fraction of small-sized dust grains that survive the RS is f d , surv 0.07 [167]. The results are rather sensitive to the ambient density: at n 3 cm−3, the survived fraction f d , surv 0.01 n p , where n is in cm−3 and p > 1 [167]. Therefore, the dust-to-stellar mass ratio from SNe of ζ * 6 × 10 4 3 × 10 3 can be an optimistic estimate. The observed excessive dust mass in galaxies at intermediate redshifts z∼7–9 and below, therefore, needs either additional sources or an efficient inhibition of sputtering effects behind the RS.

3.1.2. Dust Growth in the ISM

An alternative source of dust in the ISM is connected with the accretion of metals onto pre-existing dust particles. The above-mentioned three REBELS galaxies at z∼7 with ζ * 0.06 [12] would require a complementary source of dust to the SN production. Dust growth through coagulation and molecular accretion onto dust surfaces in dense molecular clouds, described first in [168,169] for conditions in the local universe, seems to be the likely candidate. More recently, several models based on this concept of in situ dust growth in the ISM have been developed to interpret the dust content in galaxies over cosmic time z > 7 [155,170,171,172]. In general, they fit well the observed interrelations between the masses of dust, interstellar gas, metallicity, and stars (see review in [173]). They predict the existence of the critical metallicity z∼0.1 Z where the dust growth rate increases by a factor of 3 from ζ d Z to ζ d 3 Z (Figure 9 in [173]). It is remarkable that the modeled dust-to-star mass ratio in z > 6 galaxies with masses M * 10 9 M is around ζ * 10 3 , which is still below the level in the ‘super-dusty’ galaxies. However, galaxies with masses M * > 10 9 M reveal ζ * 10 2 [172]. However, their applicability to the dust in the early universe is still under discussion.
One of the problems is connected with interrelations between characteristic times of the processes involved in the dust growth in the z > 6 ISM dense molecular clouds [174,175]. The accretion time of an atomic particle onto the grain is [176]
t a c c ρ s a A 1 / 2 3 S Z ρ v T 3 × 10 8 a 0.1 S 0.3 T 2 1 / 2 n 2 Z Z 1 yr ,
where ρ s is the mass of the solid material of dust particles, A is the atomic mass of impinging particles (assumed A = 25 ), S 0.3 = S / 0.3 is the sticking coefficient, T 2 = T / 100 K is the ambient gas temperature, n 2 = n / 100 is its density, and Z is the gas metallicity. In general, the sticking coefficient decreases with dust temperature T d , which, in the early universe, exceeds the minimum level maintained by the CMB, T d > 2.73 ( 1 + z ) K ( T d > 20 K at z > 6 ). Stellar activity in host z > 6 galaxies keeps T d at a higher level: the REBELS galaxies at z∼7 show T d 40 K [12,177]. Within this range, the sticking parameter S for most of the chemical species—CO, O2, CH4, except H—remains close to the conservative estimate S = 0.3 [178,179]. However, these differences in sticking coefficients at higher dust temperatures, along with differences in binding energies, strongly inhibit the growth of ice mantle layers [174].
In this scenario dust particles grow in dense and compact molecular clouds that are supposed to be disintegrated by external turbulent motions in order to disperse the formed dust into the ambient inter-cloud medium. For a cloud with radius R c = 10 pc, the amplitude of turbulent motions u t ∼10 km s−1, the characteristic time of disintegration due to Kelvin–Helmholtz instability can be estimated as
t d e s χ 1 / 2 R c / u t 10 7 Myr < t a c c ,
with the density contrast χ = ρ c / ρ i c ∼100, with ρ c and ρ i c being the density in the cloud and in the inter-cloud gas. This shows that coagulation of dust in dense interstellar clouds requires a longer time than the lifetime of clouds, as mentioned in [175].
Moreover, dust particles grown in molecular clouds are coated by ice mantles, which make them unstable against optical and UV radiation from massive stars with a rather short characteristic time t s u b l 10 3 G 0 1 yr, where G 0 is the Habing parameter in the interstellar radiation energy density u ( 6 13.6 eV ) = 5.29 × 10 14 G 0 erg cm−3 [175].

3.1.3. Dust Survival

One of the possibilities to mitigate the destructive effects from the reverse shocks is to decrease the density in the ambient gas where the SN ejecta is expanding. Lyman continuum radiation of the progenitor star ionizes and heats the gas up to T 10 4 K. After t t r = ( α B n 0 ) 1 , ionizing photons establish the Strömgren sphere with an ionization front of D-type that pushes surrounding gas and forms an ionized bubble with density ∼0.1 n 0 , where n 0 is the density in the unperturbed surrounding gas ( α B is the case B recombination rate). At t t r , the density in the HII bubble decreases as ( t / t r ) 6 / 7 [176,180], and can asymptotically fall below n b 0.01 n 0 [181,182,183,184,185]. Stellar wind further enhances the swept-up gas mass and decrease of the density in the bubble n b before the SN explosion, the density becomes established at the level n 10 3 n 0 (Figure 4 in [182]). As shown in [186], dust particles with radius a 0.01 μ m survive in UV radiation fields within HII zones of young massive stars. The fraction of dust particles that survived the strong shock varies approximately as ∼ 10 2 n α ( α 1 , [167]). In this sense, HII zones and wind-driven bubbles preceding explosions of SNe can partly prevent dust destruction.

3.1.4. Thermal Instability Shields Dust Particles

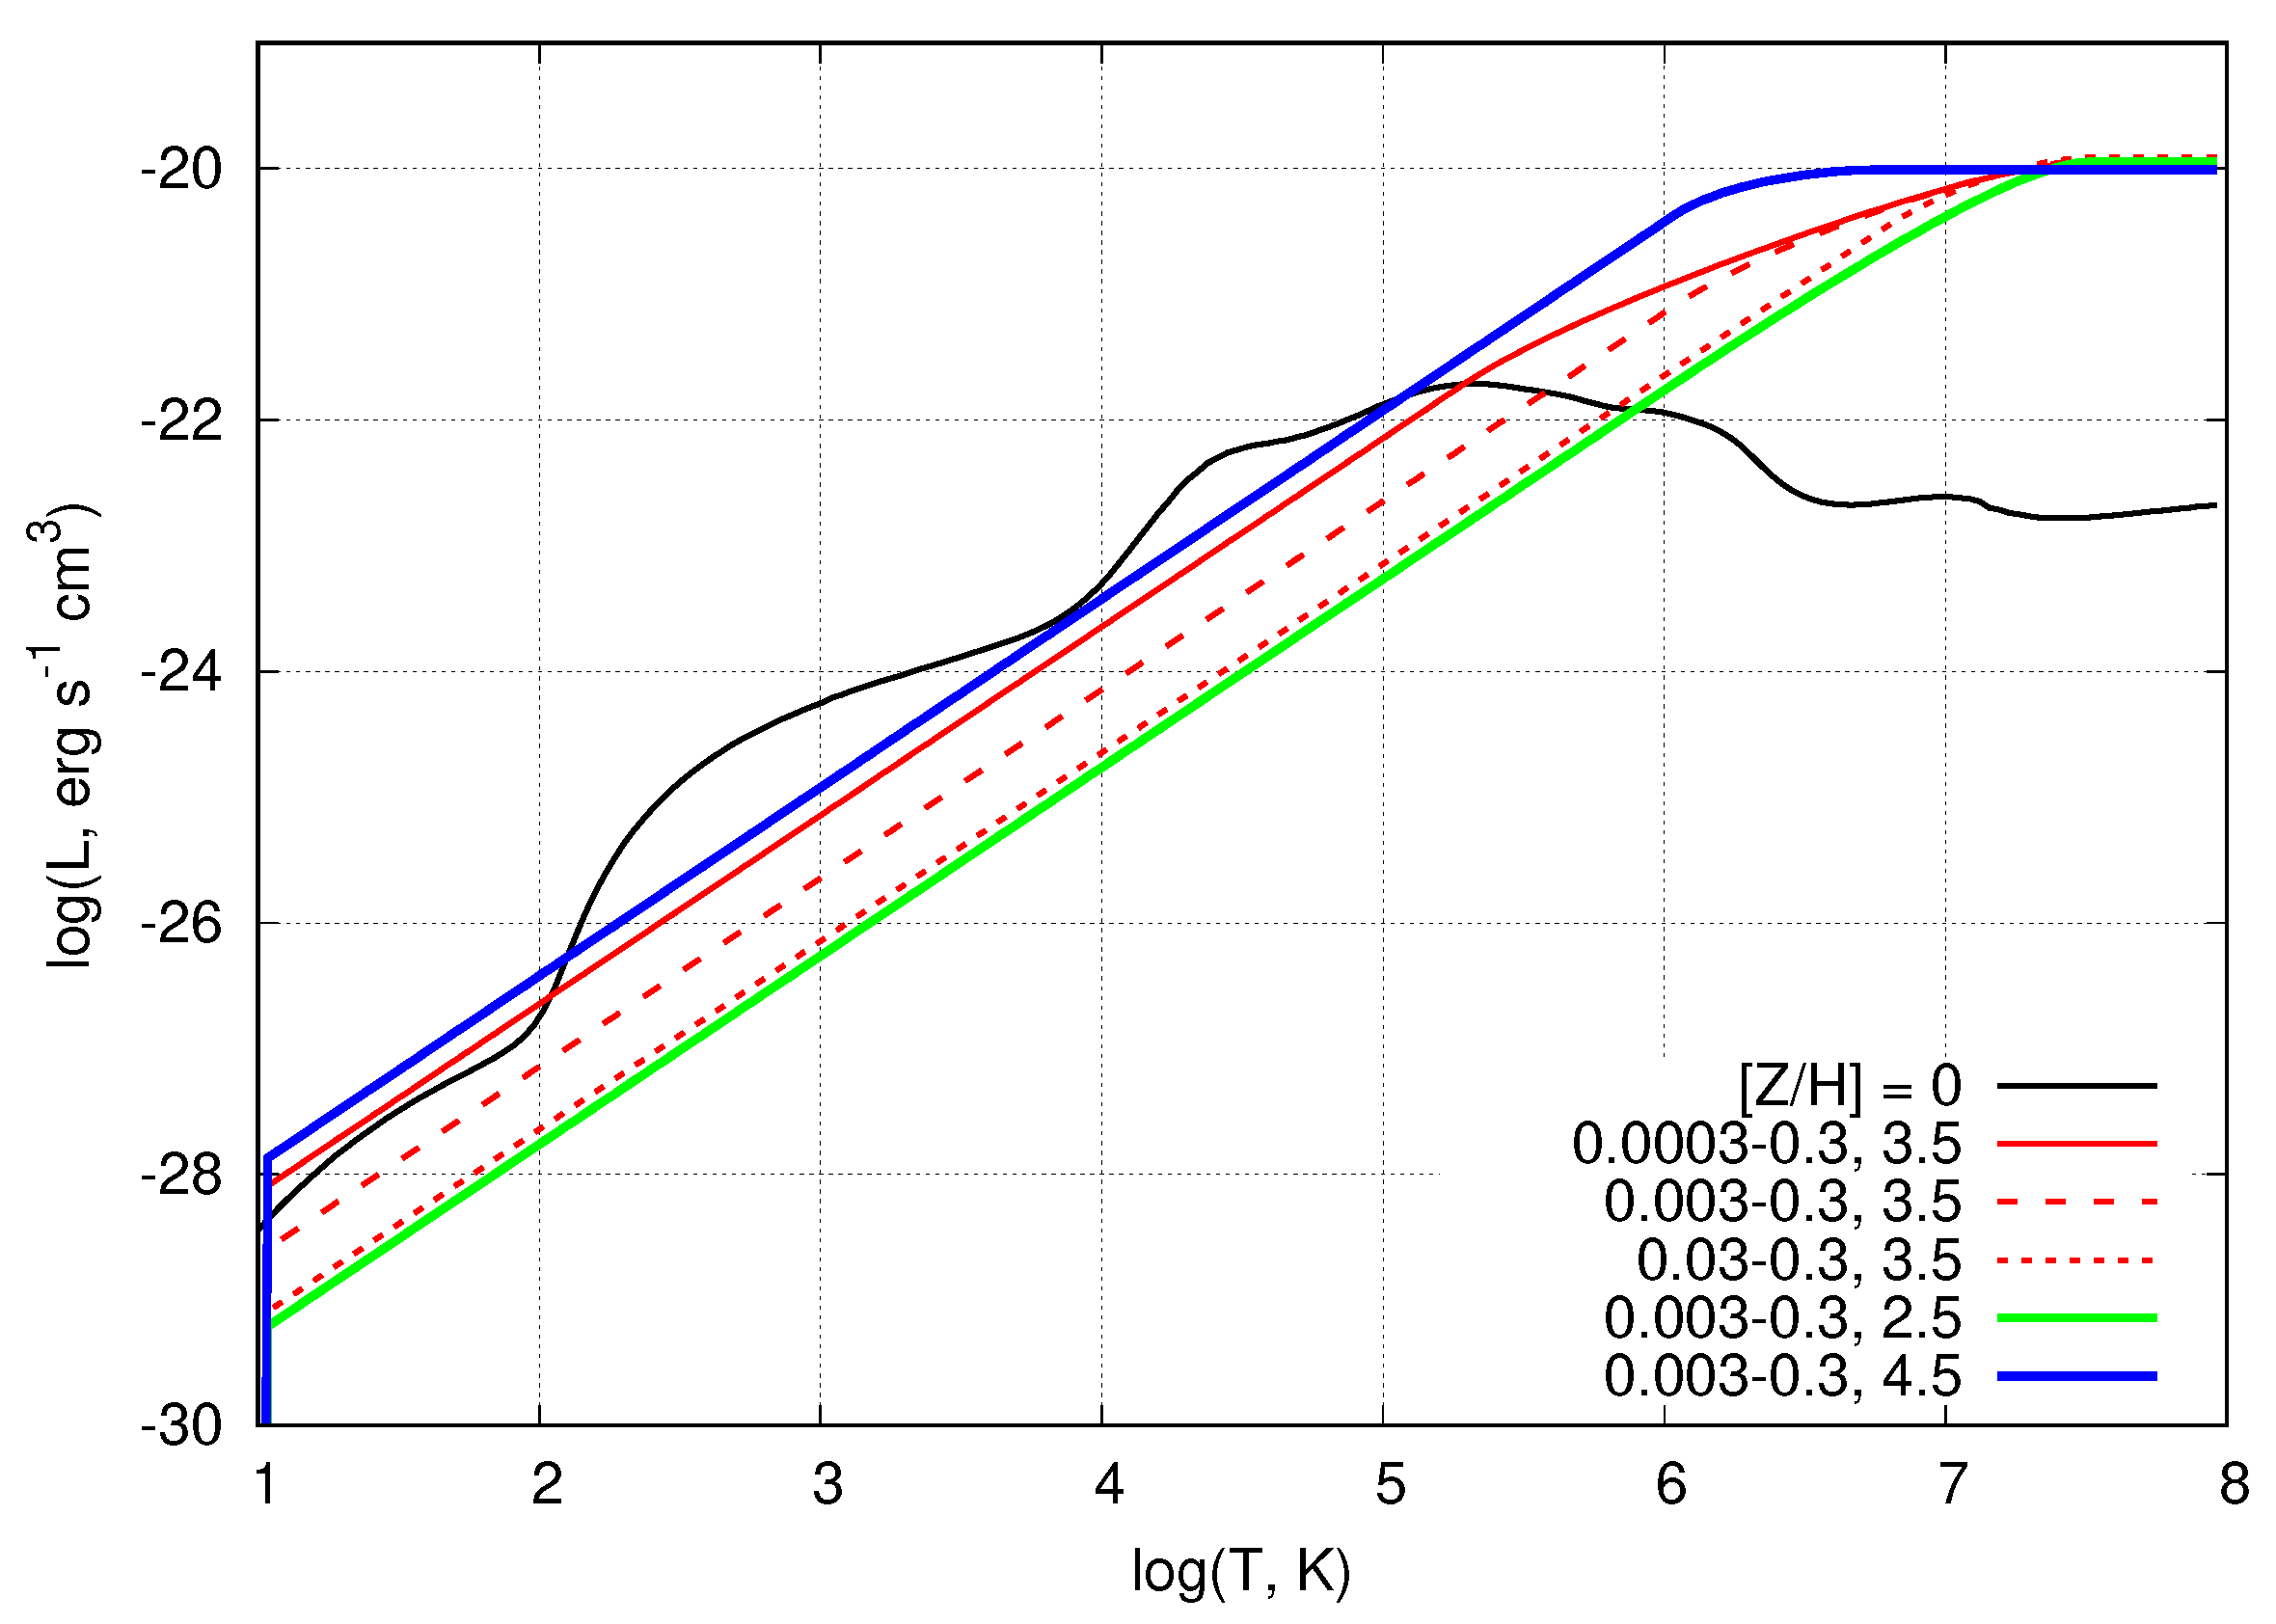
It is well known that dust particles at temperatures higher than T 10 6 K are very efficient cooling agents [107,108]. The mechanism is based on collisional heating of dust particles by the electrons of hot ambient plasma and subsequent re-radiation in the infrared. The plasma cooling rate due to this process at temperatures T > 10 6 K is one to two orders higher than the cooling rate connected with the bremsstrahlung radiation and excitation of highly ionized species. This process is termed ‘dust cooling’ [107]. Its temperature dependence at T > 10 6 K is flat, as can be seen in Figure 11, and this means that the plasma where the ‘dust cooling’ dominates is thermally unstable. In other words, small-amplitude perturbations grow to fragment the plasma into cold and dense clumps.
The cooling regime is unstable if a small perturbation of temperature δ θ / θ grows with time; here, θ = T / T 0 is the dimensional temperature, T 0 being a reference temperature. The equation for the evolution of δ θ is [187]
d δ θ d t = ( α 1 ) θ α 2 t c δ θ ,
where the cooling function assumed a power law Λ ( T ) = Λ 0 ( T / T 0 ) α , as seen in Figure 11 α 0 fits the behavior of the ‘dust cooling’ at temperatures T 3 × 10 6 10 8 K. The relative magnitude δ θ / θ is governed by the equation
d d t δ θ θ = ( 2 α ) θ α 2 t c δ θ θ ,
with the solution
δ θ θ = δ θ θ 0 [ 1 ( 2 α ) t / t c ] 1 ,
which diverges hyperbolically at t m = t c / ( 2 α ) , at which point the temperature θ vanishes. One can expect that small perturbations in hot gas behind the reverse shock can rapidly grow and form dense and cold clumps and filaments where dust particles can be shielded from hot, aggressive plasma.
At the initial state, the ejecta gas has the density n e j 7 × 10 15 M 10 R 13 cm−3 and the temperature T e j 3 × 10 8 E 51 M 10 1 K, where R e j , 0 = 10 3 R cm is the ejecta radius, E 51 , the explosion energy in Bethe units, E B = 10 51 erg. At the time when nucleation process begins to assemble solid particles (∼400–600 days), the gas temperature in ejecta is T 3000 K, and the corresponding gas density n n u c 10 8 cm−3 [27,103,161,162]. The nucleation proceeds rapidly, and within a couple of months the ejecta already contains ∼0.1–0.3 M of dust (see Figure 1 in [27] and Figure 2 in [162] as examples). The reverse shock penetrates the ejecta inward, with n = 10 8 cm 3 n n u c , and the velocity relative to ejecta is v RS 10 8 cm s−1. The post-shock temperature is T RS 10 8 K.
By applying random isobaric perturbations of density and temperature δ T / T = δ n / n with a characteristic amplitude of | δ n / n | 0 0.2 , a highly developed thermal instability with the density contrast of δ n / n ∼20–100 is found to be reached within a relatively short time ( t 1.5 t c ) [187]. Further development leads to a nearly quasi-steady state with slow variations in density contrast and temperature due to weak shocks traveling between the dense ‘walls’. In spite of their relatively small volumes, the dense clumps and filaments comprise the major part of the mass of gas and dust.
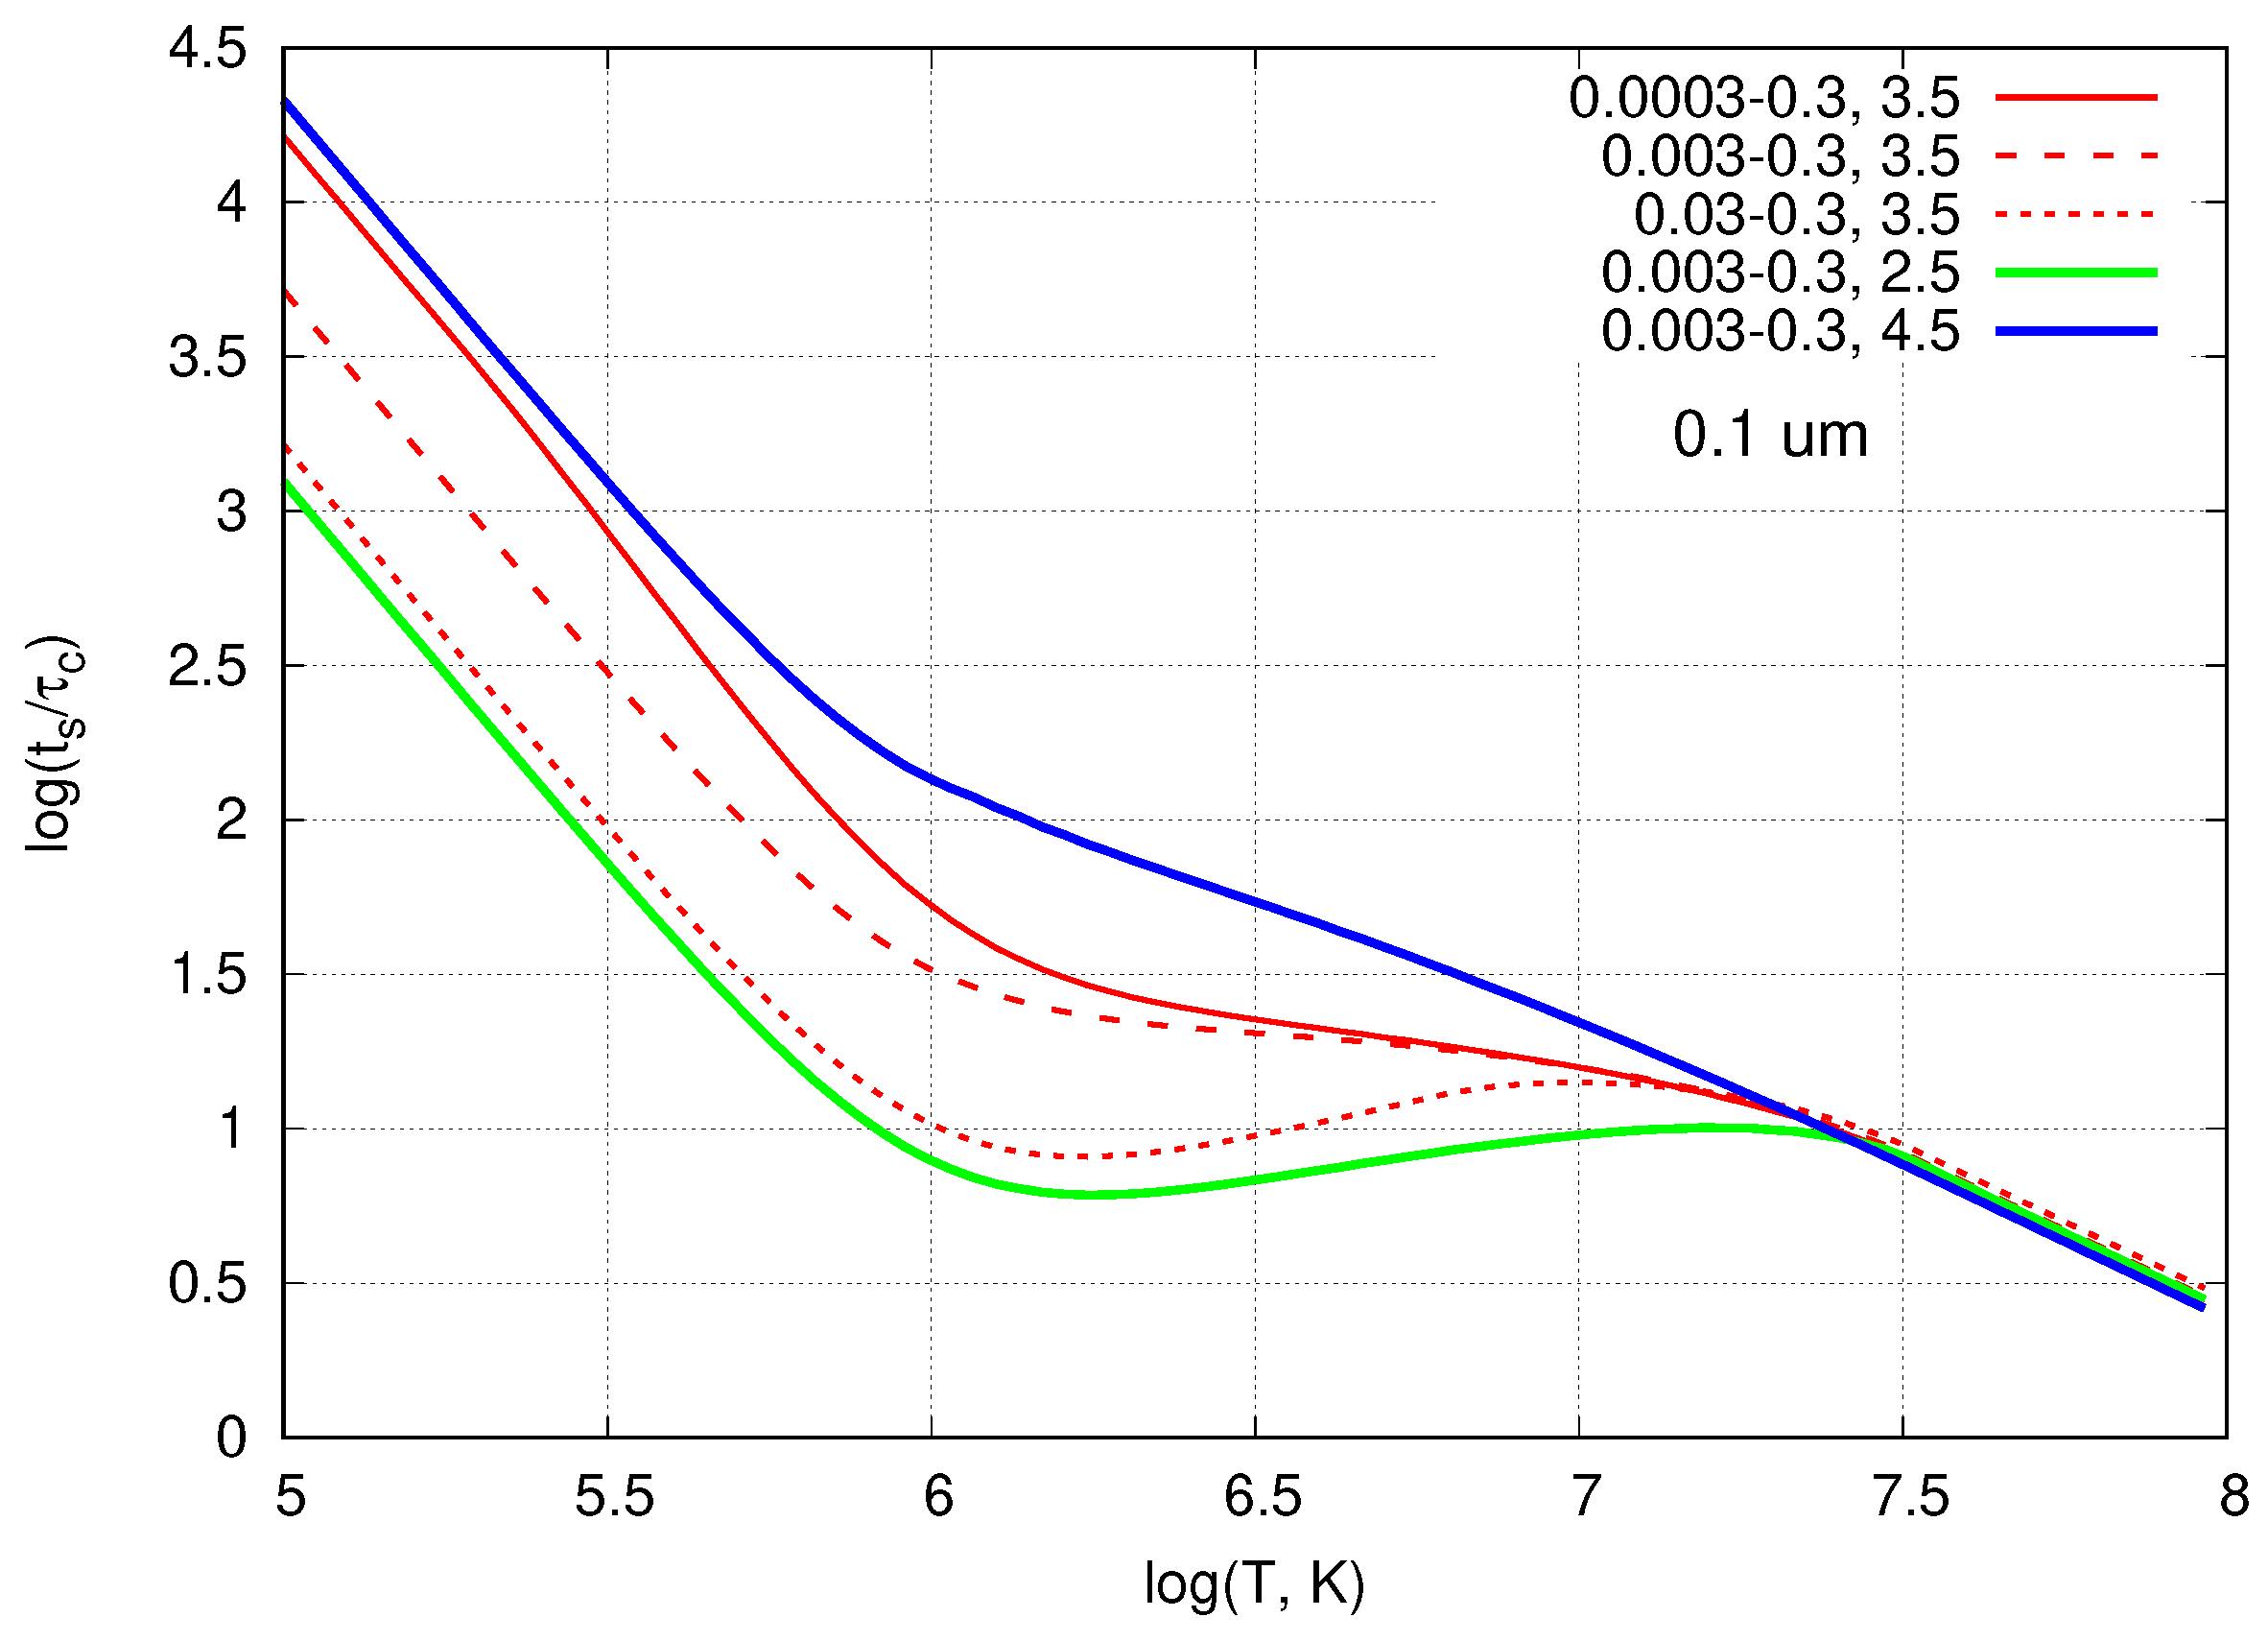
The dust confined within denser and colder regions has a conducive condition in a rapidly cooling environment, and a considerable fraction of it survives, though particles of smaller sizes still suffer from thermal destruction. It can be seen from the comparison with the characteristic time of radiation cooling. Figure 12 shows the ratio of sputtering to cooling times, t sp ( a ) / t c as a function of gas temperature for grains of radius a = 0.1 μ m. Since t sp ( a ) a , the behavior of particles of different sizes a translates up or down depending on whether their radius is larger or smaller than 0.1 μ m. As the figure shows, the most aggressive state even for larger particles is the initial period of the thermal instability with temperature T > 3 × 10 7 K because the cooling time at higher temperatures is t c T . Table 1 illustrates this circumstance. Shown here is the mass fraction of the dust that survived sputtering in the perturbed region in the process of evolution from the beginning of thermal instability for two values of the initial temperature in the post-RS plasma: T 0 = 10 8 K in the left column and T 0 = 3 × 10 7 in parenthesis (right column) [187]. Thus, the ‘dust cooling’ at high temperature range T > 10 6 K typical for the post-RS plasma prevents destruction of dust grains by strong sputtering. This can mitigate the problem of an apparently excessive dust-to-stellar mass ratio in galaxies at intermediate and lower redshifts z∼2–9.

4. Discussion

4.1. Evacuation of Dust in a Clumpy ISM

Recent models of gas and dust outflows, driven either by radiation or SNe shock pressure, are implicitly based on the assumption of a homogeneous density distribution in the ISM. At the same time, it is naturally expected that in conditions of high SF rate, the ISM is in a certain sense a dynamically active medium with multiple overlapping bubbles and shells from HII zones, stellar winds, and SN explosions. Under these conditions, the diffuse ambient gas with density ρ i c forms clumps and filaments with density ρ c l , as clearly observed in active SF regions in the Milky Way, e.g., in [188,189]. This distribution of density and optical depth qualitatively changes the conditions for momentum transfer from photons and shock waves to the gas, which can imply a distinct sequence of dynamical phases characterized by volume filling factors of dense clouds f v and their head-on covering factor f cov (perpendicular to the flow velocity), and as a result, by the efficiency of the momentum transfer [190,191] (see recent review in [192]). Dynamical features of such a medium crucially depend on the initial values of their filling factor f v , density contrast ρ cl / ρ ic , possible radiation energy losses, and the spatial separation perpendicular to the flow, or equivalently, the covering factor f cov . Clouds disrupted by a wind flow form a turbulent wake downstream, with the cross-section along the wind velocity exceeding the initial one by a factor of 2–3 (see [193]). Therefore, during the acceleration, the covering factor of the ensemble of clouds, f cov , increases and results in a stronger interaction between turbulent tails of neighboring clouds, leading to mixing and synchronization of their motion [190,194]. Radiation energy losses are also important for radiatively and mechanically driven multiphase outflows, though their contribution runs opposite to that of Kelvin–Helmholtz instability. Gas cooling makes the density of clouds larger and their sizes smaller. This enhances the inertia of the clouds and diminishes their f cov factor, eventually resulting in inhibition of the momentum transfer to clouds as P ˙ f cov χ 1 [191,194]. These aspects illustrate the complexity of problems associated with the presence or lack of dust in galaxies at the cosmic dawn.

4.2. Cold Dusty Clumps

Among alternative scenarios, the dust segregation in the galaxy ISM—assembling dust into dense gas clumps with a small covering factor, has been suggested in [56]. In the context of the ‘mass entrainment’ problem9. This option looks very likely in any model of ejection of dust from the galaxies. Moreover, in halo mergers—a commonly accepted mechanism driving starbursts—dense clouds and rarefied inter-clump cavities develop within strong turbulence that emerges in converging flows [113]. In this regard, it will be interesting to detect signs of FIR emission from such clumpy dust in z > 10 galaxies. Among such galaxies, the brightest z > 10 galaxy, GHZ2/GLASS-z12, discovered photometrically [13,77] and confirmed later spectroscopically with JWST/NIRSpec [65], has been studied also with ALMA in [198]. In spite of a rather distinct ( 5.8 σ ) [OIII] 88 μ m line, dust emission in FIR is not detected, though it would have been seen provided it were present in the amount corresponding to the abundance of the oxygen Z 0.3 Z . As stressed in [56], this lack of FIR dust emission in GHZ2/GLASS-z12 can indicate that dust is evacuated by the radiation pressure far from heating sources. However, the possibility that dust in this galaxy is locked in dense, optically thick clouds for heating UV radiation, and correspondingly cold clouds, cannot be totally excluded. For rough estimates: very compact dusty clumps r c ∼1 pc with gas density n c 4 × 10 4 cm−3 and mass M c 10 3 M would be optically thick to UV with τ u v ∼2–3 provided that the gas-to-dust mass ratio is ζ d 1 10 3 . The gas and dust in such clumps is to be cold with T g < T d ∼30 K, and hence the clumps can be pressure supported by the ambient gas with T 10 4 K and n i c 10 2 cm−3.

4.3. Environmental Modulation

The overall evolution from the “attenuation-free” state of galaxies at high redshifts z > 10 changes its trend to redshifts below z 10 to reach a value ζ * 10 2 at intermediate epochs, z∼8–10. Later evolution of the ζ * from intermediate to lower redshifts ∼4–7 and further to the cosmic noon at z∼2–4 remains on average within ζ * ∼0.01–0.03 in main sequence galaxies and nearly an order higher values in starbursts [147,156]; at z∼0.1–0.4, the dust-to-stellar ratio goes down to ζ * 10 4 as shown in Figure 2 in [148]. Very roughly, the evolution of dust content in galaxies across cosmic time manifests a general trend from a nearly dust-free state at z > 10 , through the maximum at intermediate epochs at z∼7–10 and later stages z∼4–7, and diminishing between the noon z∼2–4 and relatively nearby universe, z∼0–1. As long as during this evolution the metallicity in galaxies generally grows, though the dust content decreases, this may indicate that dust suffers either strong destruction from shock waves and hot ambient plasma (as in [126,164,166,167,199] or an efficient evacuation outside galaxy disks into circumgalactic or intergalactic medium (as, e.g., in the AFM and RTS approaches).
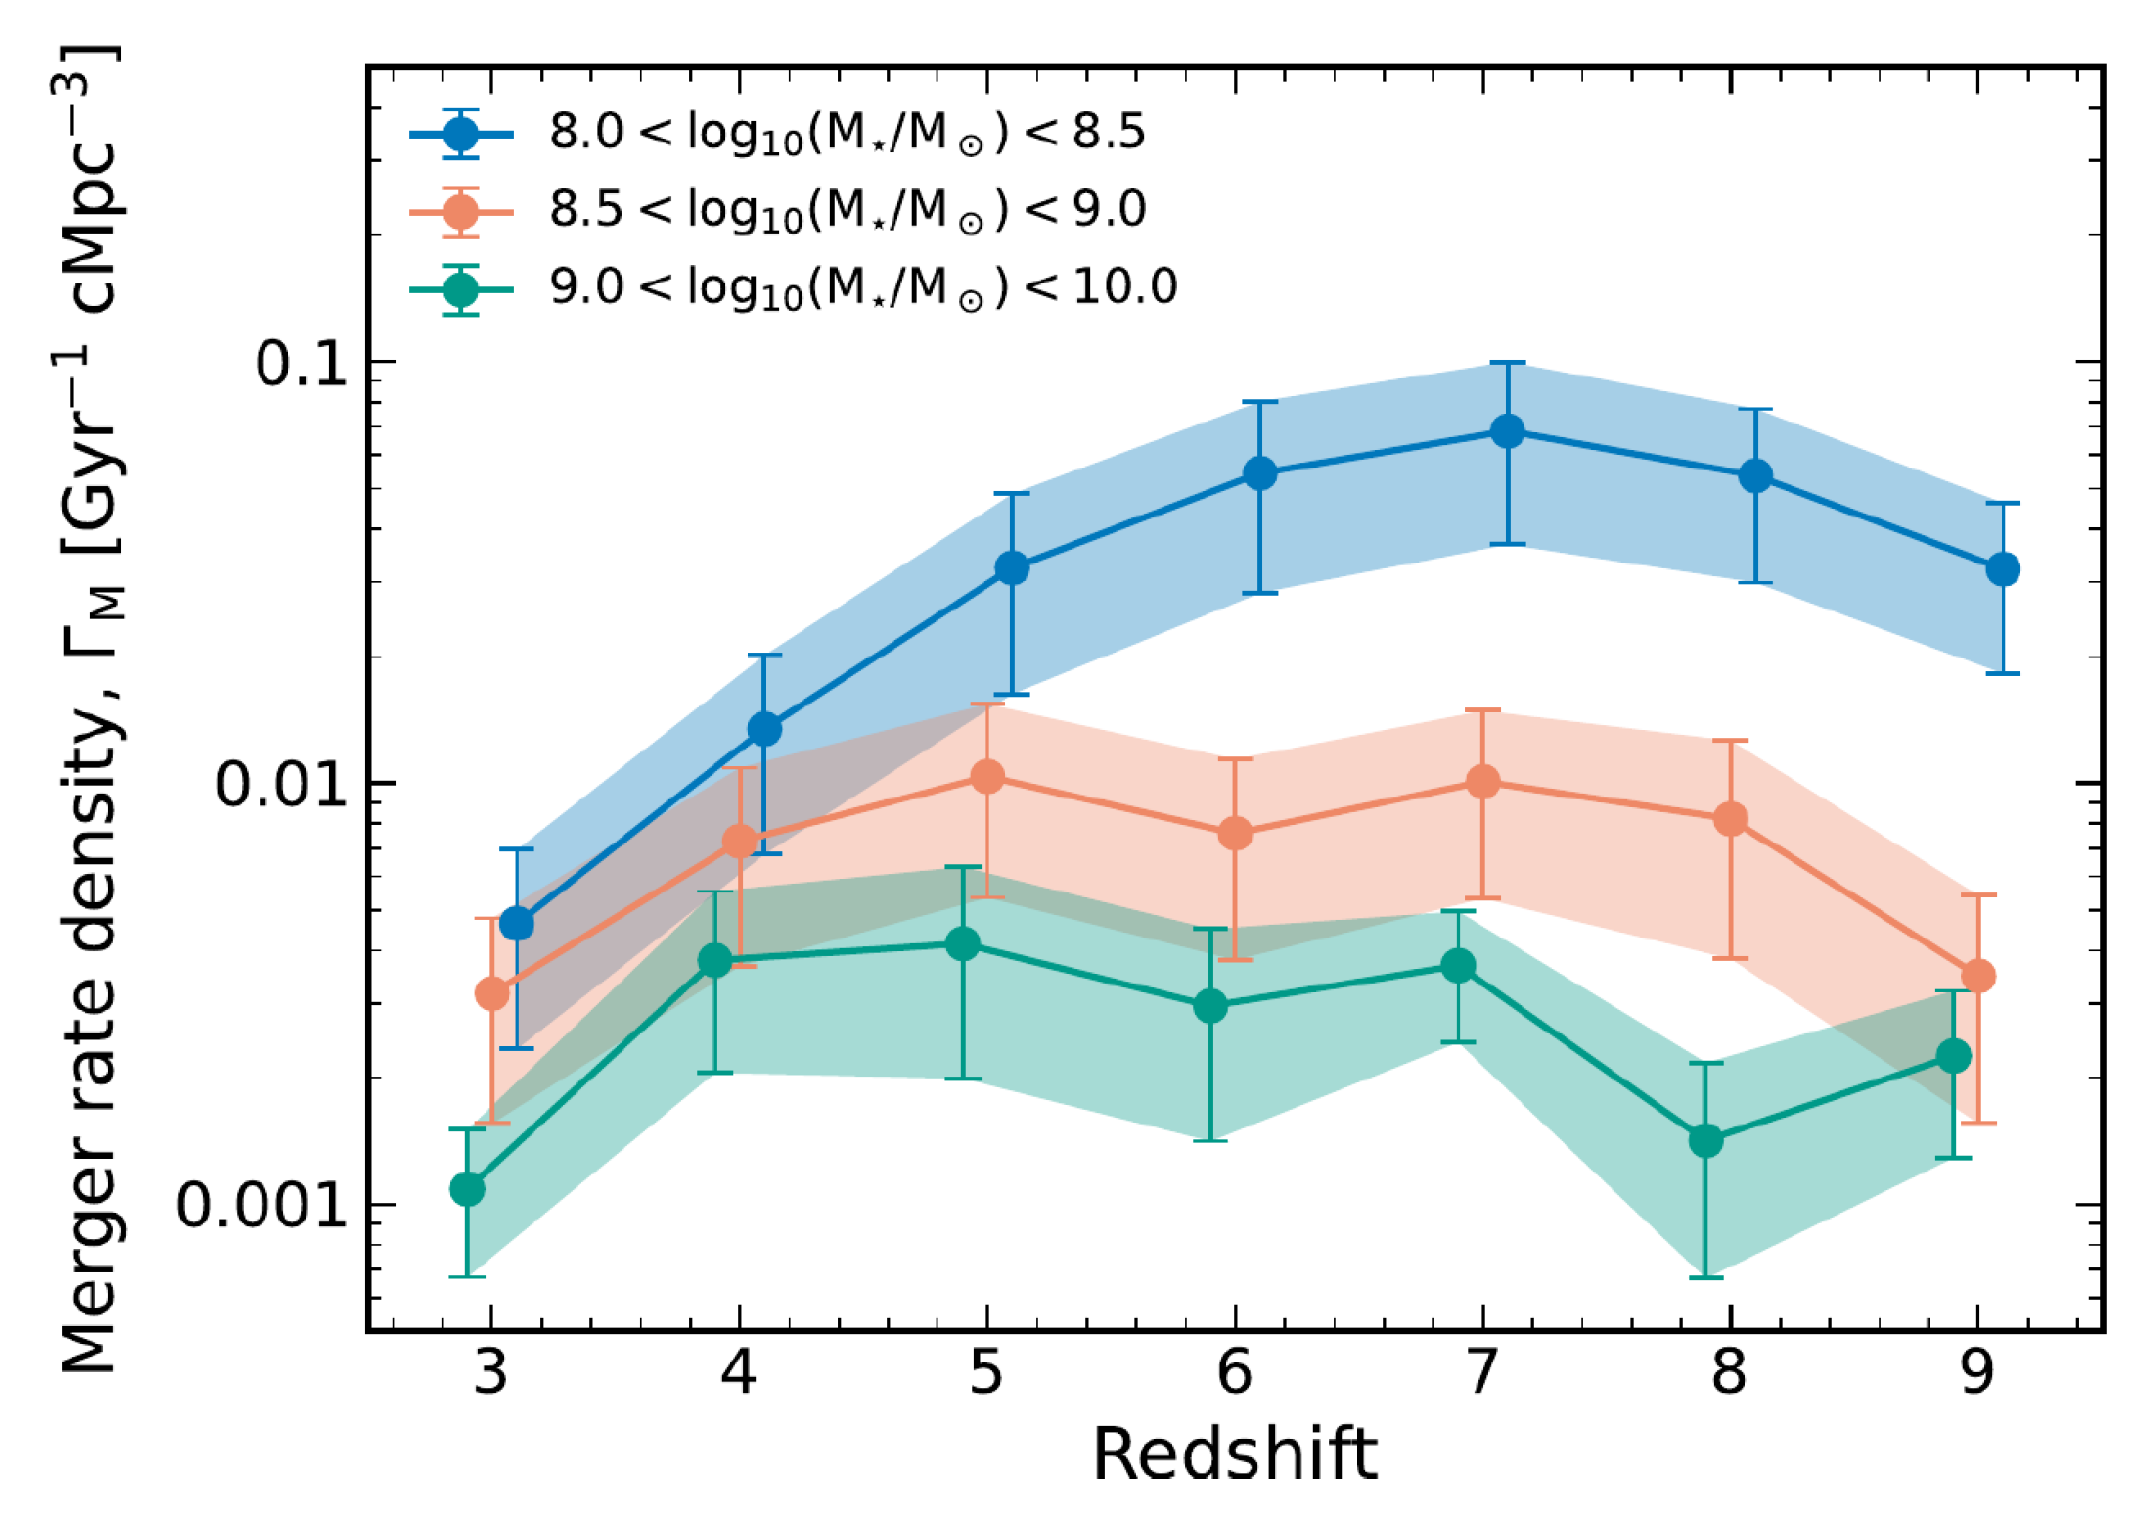
One of the possible factors that can affect gas evacuation from galactic disks is the external gas density and pressure. In both cases, radiation pressure [84,85] and momentum transfer from shock waves from star formation in galaxy centers [72] and AGNs, their efficiency depends on the inertia and transparency of the ambient gas. The most important environmental factor that is critically important for star formation and dynamics of the ISM in growing galaxies on cosmological scales relates to tidal interaction and galaxy mergers. The overall evolution of the dust-to-stellar mass ratio from z∼14 to z∼0 presented in Figure 10 and shown schematically in Figure 9, reminds us of the trend of cosmological evolution of the galaxy merger rate. Commonly thought enhancement of SFR due to mergers is still being debated upon (see discussion in [200,201]), though the expanded interstellar matter in tidally interacting galaxies (see examples of galaxy tidal pairs in Figure 6 in [201]) can affect a neighboring galaxy and prevent outflows by possible redistribution of gravitational forces and the gas density around the base of the outflow, as possibly occurs in GN-z11 [66]. In this regard, it is worth noting the two z∼7 galaxies—Himico and CR7—both being mergers consisting of three and five, correspondingly, massive clumps, of which one of the three has low attenuation A v ∼0.01, while the others have A V ∼0.3 [202]. The metallicity in all clumps except two, where the data are not available, is close to z∼0.3 Z . This is in accord with predictions of possible segregation of dust and gas in mergers, resulting in the formation of dense, compact, dusty cloudlets and extended cavities with low attenuation [113].
The merger rate at z > 10 begins increasing from beyond z > 10 , as can be judged from the evolution of the major galaxy merger rate Γ M studied very recently in [201]; see Figure 13. At z > 9 , the Γ M reaches ∼1 Gyr−1 in hundred comoving Mpc3 for the galaxy stellar masses of 10 8 < M * < 10 10 M . At later stages, z∼7, the lower galaxy mass bin, 10 8 3 × 10 8 M , increases up to a maximum Γ M ∼1 Gyr−1 in ten comoving Mpc3 and then decreases to ∼ 0.01 Gyr−1cMpc−3 at z 3 . For larger galaxies, M * > 3 × 10 8 M remains nearly invariant ∼0.004 Gyr−1cMpc−3 in z∼3–9 [201]. Taking this into account, one can speculatively connect efficient evacuation of dust from z > 10 galaxies with the fact that these galaxies are relatively free of close neighbors that can inhibit dusty outflows into the IGM. Such events seem to be rare and do not affect dust evacuation through galactic outflows.
Mergers at intermediate redshifts z∼5–9 are more frequent and make the galaxies less dynamically isolated. In these conditions, a considerable fraction of the dust produced by stellar activity—SN explosions, and at z < 6 , along with AGB stars,—likely remains locked in the relatively close vicinity of their host galaxy. On the contrary, galaxies in the nearby universe, z < 3 , become more isolated and open to gas outflows. This assumption is supported by observations of dusty halos around nearby galaxies and in the intergalactic medium. Very recently, an extended, up to ≳4 kpc dusty halo has been confirmed in the nearby ( 9.6 Mpc) galaxy NGC 891 [203].
Measurements of dust reddening along with gravitational magnification of galaxies within z 0.3 have allowed us to infer the dust density parameter Ω d 5 × 10 6 , which is comparable to the dust mass locked in galaxies [204]. The equivalent dust-to-stellar mass ratio is ζ * 0.03 . This means that the galaxies, most likely within z∼0–1, ejected during their evolution a considerable fraction of the dust produced by them. The measured range of ζ * 10 5 10 3 for quiescent galaxies at z 0.6 is consistent with this speculative picture.

5. Conclusions

Physical reasons for the explanation of ultra-luminous galaxies (ULGs) in the z > 10 universe remain enigmatic. However, a few recently suggested scenarios sound promising for an adequate interpretation of some of the observational characteristics of galaxies at the Cosmic Dawn. It looks most likely that they are not alternative but rather complementary scenarios, and the truth lies in the synergy between them.
For the z > 10 ULGs with detectable amounts of metals, the most likely scenario is connected with the evacuation of dust by radiation pressure—the attenuation-free model (AFM) [70,73,74]—or by SN-driven outflows dominated by Rayleigh–Taylor instability [72]. The UV luminosity of the underlying stellar population is sufficient to remove the dust from the galaxy. Some of the most distant ULGs at, say, z > 14 , with deficient metallicity, can be treated as the feedback-free starburst (FFB) galaxies formed out of the pristine gas [93,94]. In this regard, the galaxy S5-z17-1 ( z phot = 16.7 ) described in [24] may be a good candidate to represent the FFB model: the observed star formation rate and the gas density are consistent with the star formation efficiency ϵ * 0.7–1.0, as predicted by the SF model [205]. Faint but noticeable signs of outflows can be identified in the morphological features in the galaxy JADES-GS-z14-0 (Figure 1, right panel: the distribution of [OIII] emission in [115], and indications of outflows in the GN-z11 galaxy in the form of velocity offset between H γ and Ly α : [66], Figure 5).
Destruction of dust particles by shock waves in dense (n∼50–3000 cm−3) ISM and compact galactic stellar clusters ( R G ∼300 pc) seems to be problematic, unless the starbursts are confined within R sb 1 pc nuclei. In this case, though, the energy released in the SB by synchronous SN explosions is spent in launching an outflow that evacuates gas and dust outside the galaxy disk. If the mechanical luminosity is sufficient, then the outflows can be fragmented under the Rayleigh–Taylor instability scenario and can become patchily transparent as described in [72].
The excess amount of dust, ζ * 0.01 , observed in z < 10 galaxies can be explained by the survival of a considerable fraction of dust produced against the reverse shock wave that penetrates the SN ejecta after the nucleation. The mechanism of dust survival is connected with a rapidly growing thermal instability under the effect of efficient dust cooling at high temperatures, ∼ 10 7 10 8 K, behind the reverse shock. Consequently, the net dust yield can be considerably enhanced, up to a factor of 3–10, depending on the initial temperature behind the reverse shock.
The origin of the attenuation jump Δ A V ∼1 between z > 10 and z < 10 in time ∼35 Myr, as described in [56], remains unexplained. However, the feedback-free scenario [93,94] along with the delayed stellar feedback toy model [87], both predict convergence of mechanisms maintaining the FFB regime (high star formation efficiency ϵ * ∼0.7–1.0) and conditions for the DSF oscillations towards z 9–10. One of the Δ t ∼10–20 Myr peaks of the starbursts they predict at z > 10 can represent a ‘blue monster’ galaxy. On the other hand, it is remarkable that the time of transition from one of these regimes to a quasi-equilibrium with ϵ * 1 is around one to two feedback times, t s n ∼20–30 Myr.

Author Contributions

All the authors worked on the conceptualization and writing of this manuscript. All authors have read and agreed to the published version of the manuscript.

Funding

This research received no external funding.

Data Availability Statement

Not applicable.

Acknowledgments

We acknowledge valuable discussions with S. Balashev, K. C. Sarkar, and E. O. Vasiliev. We thank the anonymous referees for the criticism and comments that improved the presentation. YS acknowledges the hospitality and support of the Raman Research Institute.

Conflicts of Interest

The authors declare no conflicts of interest.

Abbreviations

The following abbreviations are used in this manuscript:
ApJAstrophysical Journal
ApJLAstrophysical Journal Letters
ApJSAstrophysical Journal Supplement Series
MNRASMonthly Notices of the Royal Astronomical Society
A& AAstronomy & Astrophysics

Notes

1
CAnadian NIRISS Unbiased Cluster Survey.
2
It is worth noting that the estimate of factor 6 drop in the UV LF between z = 8 and 12 in [34] suffers from uncertainties because of small statistics, as stressed by the authors.
3
They are dubbed Blue Monsters [56].
4
By net yield it is commonly understood the dust mass from SN ejecta after its processing through the reverse shock.
5
This condition is not sufficient though, because the destruction time depends on the ambient gas density, dust particle size, and characteristic times of other involved processes.
6
M i is not measurable before SN explosions in the cluster are exhausted.
7
A 2175 is the total attenuation at 2175 Å, B = A b u m p / A 2175 , A b u m p is the difference between the A 2175 and the baseline at 2175 Å.
8
The dominant contribution comes from core-collapse supernovae (CCSN) with the progenitors of M = 12–35 M .
9
This problem arises when cold, dense clouds get involved in diffuse flows. Discussions can be found in [195,196,197].

References

  1. Bouwens, R.J.; Illingworth, G.D.; Oesch, P.; Stiavelli, M.; van Dokkum, P.; Trenti, M.; Magee, D.; Labbé, I.; Franx, M.; Carollo, C.M.; et al. Discovery of z∼8 Galaxies in the Hubble Ultra Deep Field from Ultra-Deep WFC3/IR Observations. Astrophys. J. Lett. 2010, 709, L133–L137. [Google Scholar] [CrossRef]
  2. Zheng, W.; Postman, M.; Zitrin, A.; Moustakas, J.; Shu, X.; Jouvel, S.; Høst, O.; Molino, A.; Bradley, L.; Coe, D.; et al. A magnified young galaxy from about 500 million years after the Big Bang. Nature 2012, 489, 406–408. [Google Scholar] [CrossRef] [PubMed]
  3. Coe, D.; Zitrin, A.; Carrasco, M.; Shu, X.; Zheng, W.; Postman, M.; Bradley, L.; Koekemoer, A.; Bouwens, R.; Broadhurst, T.; et al. CLASH: Three Strongly Lensed Images of a Candidate z≈11 Galaxy. Astrophys. J. 2013, 762, 32. [Google Scholar] [CrossRef]
  4. Ellis, R.S.; McLure, R.J.; Dunlop, J.S.; Robertson, B.E.; Ono, Y.; Schenker, M.A.; Koekemoer, A.; Bowler, R.A.A.; Ouchi, M.; Rogers, A.B.; et al. The Abundance of Star-forming Galaxies in the Redshift Range 8.5–12: New Results from the 2012 Hubble Ultra Deep Field Campaign. Astrophys. J. Lett. 2013, 763, L7. [Google Scholar] [CrossRef]
  5. Oesch, P.A.; Bouwens, R.J.; Illingworth, G.D.; Labbé, I.; Smit, R.; Franx, M.; van Dokkum, P.G.; Momcheva, I.; Ashby, M.L.N.; Fazio, G.G.; et al. The Most Luminous z∼9–10 Galaxy Candidates Yet Found: The Luminosity Function, Cosmic Star-formation Rate, and the First Mass Density Estimate at 500 Myr. Astrophys. J. 2014, 786, 108. [Google Scholar] [CrossRef]
  6. Bouwens, R.J.; Bradley, L.; Zitrin, A.; Coe, D.; Franx, M.; Zheng, W.; Smit, R.; Host, O.; Postman, M.; Moustakas, L.; et al. A Census of Star-forming Galaxies in the z∼9–10 Universe based on HST+Spitzer Observations over 19 Clash Clusters: Three Candidate z∼9–10 Galaxies and Improved Constraints on the Star Formation Rate Density at z∼9.2. Astrophys. J. 2014, 795, 126. [Google Scholar] [CrossRef]
  7. Zitrin, A.; Zheng, W.; Broadhurst, T.; Moustakas, J.; Lam, D.; Shu, X.; Huang, X.; Diego, J.M.; Ford, H.; Lim, J.; et al. A Geometrically Supported z∼10 Candidate Multiply Imaged by the Hubble Frontier Fields Cluster A2744. Astrophys. J. Lett. 2014, 793, L12. [Google Scholar] [CrossRef]
  8. Michałowski, M.J. Dust production 680–850 million years after the Big Bang. Astron. Astrophys. 2015, 577, A80. [Google Scholar] [CrossRef]
  9. Oesch, P.A.; Brammer, G.; van Dokkum, P.G.; Illingworth, G.D.; Bouwens, R.J.; Labbé, I.; Franx, M.; Momcheva, I.; Ashby, M.L.N.; Fazio, G.G.; et al. A Remarkably Luminous Galaxy at z = 11.1 Measured with Hubble Space Telescope Grism Spectroscopy. Astrophys. J. 2016, 819, 129. [Google Scholar] [CrossRef]
  10. Knudsen, K.K.; Watson, D.; Frayer, D.; Christensen, L.; Gallazzi, A.; Michałowski, M.J.; Richard, J.; Zavala, J. A merger in the dusty, z = 7.5 galaxy A1689-zD1? Mon. Not. R. Astron. Soc. 2017, 466, 138–146. [Google Scholar] [CrossRef]
  11. Jiang, L.; Kashikawa, N.; Wang, S.; Walth, G.; Ho, L.C.; Cai, Z.; Egami, E.; Fan, X.; Ito, K.; Liang, Y.; et al. Evidence for GN-z11 as a luminous galaxy at redshift 10.957. Nat. Astron. 2021, 5, 256–261. [Google Scholar] [CrossRef]
  12. Ferrara, A.; Sommovigo, L.; Dayal, P.; Pallottini, A.; Bouwens, R.J.; Gonzalez, V.; Inami, H.; Smit, R.; Bowler, R.A.A.; Endsley, R.; et al. The ALMA REBELS Survey. Epoch of Reionization giants: Properties of dusty galaxies at z ≈ 7. Mon. Not. R. Astron. Soc. 2022, 512, 58–72. [Google Scholar] [CrossRef]
  13. Naidu, R.P.; Oesch, P.A.; van Dokkum, P.; Nelson, E.J.; Suess, K.A.; Brammer, G.; Whitaker, K.E.; Illingworth, G.; Bouwens, R.; Tacchella, S.; et al. Two Remarkably Luminous Galaxy Candidates at z ≈ 10 − 12 Revealed by JWST. Astrophys. J. Lett. 2022, 940, L14. [Google Scholar] [CrossRef]
  14. Finkelstein, S.L.; Bagley, M.B.; Arrabal Haro, P.; Dickinson, M.; Ferguson, H.C.; Kartaltepe, J.S.; Papovich, C.; Burgarella, D.; Kocevski, D.D.; Huertas-Company, M.; et al. A Long Time Ago in a Galaxy Far, Far Away: A Candidate z ∼ 12 Galaxy in Early JWST CEERS Imaging. Astrophys. J. Lett. 2022, 940, L55. [Google Scholar] [CrossRef]
  15. Topping, M.W.; Stark, D.P.; Endsley, R.; Plat, A.; Whitler, L.; Chen, Z.; Charlot, S. Searching for Extremely Blue UV Continuum Slopes at z = 7 − 11 in JWST/NIRCam Imaging: Implications for Stellar Metallicity and Ionizing Photon Escape in Early Galaxies. Astrophys. J. 2022, 941, 153. [Google Scholar] [CrossRef]
  16. Hsiao, T.Y.-Y.; Coe, D.; Abdurroúf; Whitler, L.; Jung, I.; Khullar, G.; Meena, A.K.; Dayal, P.; Barrow, K.S.S.; Santos-Olmsted, L.; et al. JWST Reveals a Possible z ∼ 11 Galaxy Merger in Triply Lensed MACS0647–JD. Astrophys. J. Lett. 2023, 949, L34. [Google Scholar] [CrossRef]
  17. Cullen, F.; McLeod, D.J.; McLure, R.J.; Dunlop, J.S.; Donnan, C.T.; Carnall, A.C.; Keating, L.C.; Magee, D.; Arellano-Cordova, K.Z.; Bowler, R.A.A.; et al. The ultraviolet continuum slopes of high-redshift galaxies: Evidence for the emergence of dust-free stellar populations at z > 10. Mon. Not. R. Astron. Soc. 2024, 531, 997–1020. [Google Scholar] [CrossRef]
  18. Casey, C.M.; Akins, H.B.; Shuntov, M.; Ilbert, O.; Paquereau, L.; Franco, M.; Hayward, C.C.; Finkelstein, S.L.; Boylan-Kolchin, M.; Robertson, B.E.; et al. COSMOS-Web: Intrinsically Luminous z ≳ 10 Galaxy Candidates Test Early Stellar Mass Assembly. Astrophys. J. 2024, 965, 98. [Google Scholar] [CrossRef]
  19. Topping, M.W.; Stark, D.P.; Endsley, R.; Whitler, L.; Hainline, K.; Johnson, B.D.; Robertson, B.; Tacchella, S.; Chen, Z.; Alberts, S.; et al. The UV continuum slopes of early star-forming galaxies in JADES. Mon. Not. R. Astron. Soc. 2024, 529, 4087–4103. [Google Scholar] [CrossRef]
  20. Donnan, C.T.; McLeod, D.J.; Dunlop, J.S.; McLure, R.J.; Carnall, A.C.; Begley, R.; Cullen, F.; Hamadouche, M.L.; Bowler, R.A.A.; Magee, D.; et al. The evolution of the galaxy UV luminosity function at redshifts z ≃ 8–15 from deep JWST and ground-based near-infrared imaging. Mon. Not. R. Astron. Soc. 2023, 518, 6011–6040. [Google Scholar] [CrossRef]
  21. Harikane, Y.; Ouchi, M.; Oguri, M.; Ono, Y.; Nakajima, K.; Isobe, Y.; Umeda, H.; Mawatari, K.; Zhang, Y. A Comprehensive Study of Galaxies at z∼9–16 Found in the Early JWST Data: Ultraviolet Luminosity Functions and Cosmic Star Formation History at the Pre-reionization Epoch. Astrophys. J. Suppl. Ser. 2023, 265, 5. [Google Scholar] [CrossRef]
  22. Atek, H.; Shuntov, M.; Furtak, L.J.; Richard, J.; Kneib, J.-P.; Mahler, G.; Zitrin, A.; McCracken, H.J.; Charlot, S.; Chevallard, J.; et al. Revealing galaxy candidates out to z∼16 with JWST observations of the lensing cluster SMACS0723. Mon. Not. R. Astron. Soc. 2023, 519, 1201–1220. [Google Scholar] [CrossRef]
  23. Cullen, F.; McLure, R.J.; McLeod, D.J.; Dunlop, J.S.; Donnan, C.T.; Carnall, A.C.; Bowler, R.A.A.; Begley, R.; Hamadouche, M.L.; Stanton, T.M. The ultraviolet continuum slopes (β) of galaxies at z = 8–16 from JWST and ground-based near-infrared imaging. Mon. Not. R. Astron. Soc. 2023, 520, 14–22. [Google Scholar] [CrossRef]
  24. Fujimoto, S.; Finkelstein, S.L.; Burgarella, D.; Carilli, C.L.; Buat, V.; Casey, C.M.; Ciesla, L.; Tacchella, S.; Zavala, J.A.; Brammer, G.; et al. ALMA FIR View of Ultra-high-redshift Galaxy Candidates at z∼11–17: Blue Monsters or Low-z Red Interlopers? Astrophys. J. 2023, 955, 130. [Google Scholar] [CrossRef]
  25. Rémy-Ruyer, A.; Madden, S.C.; Galliano, F.; Galametz, M.; Takeuchi, T.T.; Asano, R.S.; Zhukovska, S.; Lebouteiller, V.; Cormier, D.; Jones, A.; et al. Gas-to-dust mass ratios in local galaxies over a 2 dex metallicity range. Astron. Astrophys. 2014, 563, A31. [Google Scholar] [CrossRef]
  26. Kozasa, T.; Hasegawa, H. Formation of dust grains in the ejecta of SN 1987A. Astrophys. J. 1989, 344, 325–331. [Google Scholar] [CrossRef]
  27. Todini, P.; Ferrara, A. Dust formation in primordial Type II supernovae. Mon. Not. R. Astron. Soc. 2001, 325, 726–736. [Google Scholar] [CrossRef]
  28. Wooden, D.H.; Rank, D.M.; Bregman, J.D.; Witteborn, F.C.; Tielens, A.G.G.M.; Cohen, M.; Pinto, P.A.; Axelrod, T.S. Airborne Spectrophotometry of SN 1987A from 1.7 to 12.6 Microns: Time History of the Dust Continuum and Line Emission. Astrophys. J. Suppl. Ser. 1993, 88, 477. [Google Scholar] [CrossRef]
  29. Dunne, L.; Eales, S.; Ivison, R. Type II supernovae as a significant source of interstellar dust. Natur 2003, 424, 285–287. [Google Scholar] [CrossRef]
  30. Oesch, P.A.; Bouwens, R.J.; Illingworth, G.D.; Gonzalez, V.; Trenti, M.; van Dokkum, P.G.; Franx, M.; Labbé, I.; Carollo, C.M.; Magee, D. The Bright End of the Ultraviolet Luminosity Function at z ∼ 8: New Constraints from CANDELS Data in GOODS-South. Astrophys. J. 2012, 759, 135. [Google Scholar] [CrossRef]
  31. Oesch, P.A.; Bouwens, R.J.; Illingworth, G.D.; Labbé, I.; Stefanon, M. The Dearth of z ∼ 10 Galaxies in All HST Legacy Fields—The Rapid Evolution of the Galaxy Population in the First 500 Myr. Astrophys. J. 2018, 855, 105. [Google Scholar] [CrossRef]
  32. Bouwens, R.J.; Oesch, P.A.; Stefanon, M.; Illingworth, G.; Labbé, I.; Reddy, N.; Atek, H.; Montes, M.; Naidu, R.; Nanayakkara, T.; et al. New Determinations of the UV Luminosity Functions from z∼9 to 2 Show a Remarkable Consistency with Halo Growth and a Constant Star Formation Efficiency. AJ 2021, 162, 47. [Google Scholar] [CrossRef]
  33. Willott, C.J.; Desprez, G.; Asada, Y.; Sarrouh, G.T.E.; Abraham, R.; Bradač, M.; Brammer, G.; Estrada-Carpenter, V.; Iyer, K.G.; Martis, N.S.; et al. A Steep Decline in the Galaxy Space Density beyond Redshift 9 in the CANUCS UV Luminosity Function. Astrophys. J. 2024, 966, 74. [Google Scholar] [CrossRef]
  34. Bouwens, R.J.; Stefanon, M.; Brammer, G.; Oesch, P.A.; Herard-Demanche, T.; Illingworth, G.D.; Matthee, J.; Naidu, R.P.; van Dokkum, P.G. Evolution of the UV LF from z∼15 to z∼8 using new JWST NIRCam medium-band observations over the HUDF/XDF. Mon. Not. R. Astron. Soc. 2023, 523, 1036–1055. [Google Scholar] [CrossRef]
  35. Finkelstein, S.L.; Bagley, M.B. On the Coevolution of the AGN and Star-forming Galaxy Ultraviolet Luminosity Functions at 3 < z < 9. Astrophys. J. 2022, 938, 25. [Google Scholar]
  36. McLeod, D.J.; Donnan, C.T.; McLure, R.J.; Dunlop, J.S.; Magee, D.; Begley, R.; Carnall, A.C.; Cullen, F.; Ellis, R.S.; Hamadouche, M.L.; et al. The galaxy UV luminosity function at z ≃ 11 from a suite of public JWST ERS, ERO, and Cycle-1 programs. Mon. Not. R. Astron. Soc. 2024, 527, 5004–5022. [Google Scholar] [CrossRef]
  37. Adams, N.J.; Conselice, C.J.; Austin, D.; Harvey, T.; Ferreira, L.; Trussler, J.; Juodžbalis, I.; Li, Q.; Windhorst, R.; Cohen, S.H.; et al. EPOCHS. II. The Ultraviolet Luminosity Function from 7.5 < z < 13.5 Using 180 arcmin2 of Deep, Blank Fields from the PEARLS Survey and Public JWST Data. Astrophys. J. 2024, 965, 169. [Google Scholar]
  38. Finkelstein, S.L.; Leung, G.C.K.; Bagley, M.B.; Dickinson, M.; Ferguson, H.C.; Papovich, C.; Akins, H.B.; Arrabal Haro, P.; Davé, R.; Dekel, A.; et al. The Complete CEERS Early Universe Galaxy Sample: A Surprisingly Slow Evolution of the Space Density of Bright Galaxies at z ∼ 8.5 − 14.5. Astrophys. J. Lett. 2024, 969, L2. [Google Scholar] [CrossRef]
  39. Finkelstein, S.L. Observational Searches for Star-Forming Galaxies at z > 6. Publ. Astron. Soc. Aust. 2016, 33, e037. [Google Scholar] [CrossRef]
  40. McLeod, D.J.; McLure, R.J.; Dunlop, J.S. The z = 9–10 galaxy population in the Hubble Frontier Fields and CLASH surveys: The z = 9 luminosity function and further evidence for a smooth decline in ultraviolet luminosity density at z ≥ 8. Mon. Not. R. Astron. Soc. 2016, 459, 3812–3824. [Google Scholar] [CrossRef]
  41. Laporte, N.; Zitrin, A.; Ellis, R.S.; Fujimoto, S.; Brammer, G.; Richard, J.; Oguri, M.; Caminha, G.B.; Kohno, K.; Yoshimura, Y.; et al. ALMA Lensing Cluster Survey: A strongly lensed multiply imaged dusty system at z ≥ 6. Mon. Not. R. Astron. Soc. 2021, 505, 4838–4846. [Google Scholar] [CrossRef]
  42. Harikane, Y.; Nakajima, K.; Ouchi, M.; Hiroya, U.; Yuki, I.; Yoshiaki, O.; Yi, X.; Yechi, Z. Pure Spectroscopic Constraints on UV Luminosity Functions and Cosmic Star Formation History from 25 Galaxies at zspec = 8.61 − 13.20 Confirmed with JWST/NIRSpec. Astrophys. J. 2023, 960, 56. [Google Scholar] [CrossRef]
  43. Whitler, L.; Stark, D.P.; Topping, M.W.; Robertson, B.; Rieke, M.; Hainline, K.N.; Endsley, R.; Chen, Z.; Baker, W.M.; Bhatawdekar, R.; et al. The z ∼ 9 galaxy UV luminosity function from the JWST Advanced Deep Extragalactic Survey: Insights into early galaxy evolution and reionization. arXiv 2025, arXiv:2501.00984. [Google Scholar]
  44. Carniani, S.; Hainline, K.; D’Eugenio, F.; Eisenstein, D.J.; Jakobsen, P.; Witstok, J.; Johnson, B.D.; Chevallard, J.; Maiolino, R.; Helton, J.M.; et al. Spectroscopic confirmation of two luminous galaxies at a redshift of 14. Nature 2024, 633, 318–322. [Google Scholar] [CrossRef]
  45. Schouws, S.; Bouwens, R.J.; Ormerod, K.; Smit, R.; Algera, H.; Sommovigo, L.; Hodge, J.; Ferrara, A.; Oesch, P.A.; Rowland, L.; et al. Detection of [OIII]88μm in JADES-GS-z14-0 at z = 14.1793. arXiv 2024, arXiv:2409.20549. [Google Scholar]
  46. Zavala, J.A.; Castellano, M.; Akins, H.B.; Bakx, T.J.L.C.; Burgarella, D.; Casey, C.M.; Chávez Ortiz, Ã.A.; Dickinson, M.; Finkelstein, S.L.; Mitsuhashi, I.; et al. A luminous and young galaxy at z = 12.33 revealed by a JWST/MIRI detection of α and [O iii]. Nat. Astron. 2025, 9, 155–164. [Google Scholar] [CrossRef] [PubMed]
  47. DÉugenio, F.; Maiolino, R.; Carniani, S.; Chevallard, J.; Curtis-Lake, E.; Witstok, J.; Charlot, S.; Baker, W.M.; Arribas, S.; Boyett, K.; et al. JADES: Carbon enrichment 350 Myr after the Big Bang. Astron. Astrophys. 2024, 689, A152. [Google Scholar]
  48. Helton, J.M.; Rieke, G.H.; Alberts, S.; Wu, Z.; Eisenstein, D.J.; Hainline, K.N.; Carniani, S.; Ji, Z.; Baker, W.M.; Bhatawdekar, R.; et al. Photometric detection at 7.7 μm of a galaxy beyond redshift 14 with JWST/MIRI. arXiv 2024, arXiv:2405.18462. [Google Scholar] [CrossRef]
  49. Schouws, S.; Bouwens, R.J.; Algera, H.; Smit, R.; Kumari, N.; Rowland, L.E.; van Leeuwen, I.; Sommovigo, L.; Ferrara, A.; Oesch, P.A.; et al. Deep Constraints on [CII]158μm in JADES-GS-z14-0: Further Evidence for a Galaxy with Low Gas Content at z = 14.2. arXiv 2025, arXiv:2502.01610. [Google Scholar]
  50. Wilkins, S.M.; Bouwens, R.J.; Oesch, P.A.; Labbé, I.; Sargent, M.; Caruana, J.; Wardlow, J.; Clay, S. Quantifying the UV-continuum slopes of galaxies to z ∼ 10 using deep Hubble+Spitzer/IRAC observations. Mon. Not. R. Astron. Soc. 2016, 455, 659–667. [Google Scholar] [CrossRef]
  51. Tacchella, S.; Finkelstein, S.L.; Bagley, M.; Dickinson, M.; Ferguson, H.C.; Giavalisco, M.; Graziani, L.; Grogin, N.A.; Hathi, N.; Hutchison, T.A.; et al. On the Stellar Populations of Galaxies at z = 9 − 11: The Growth of Metals and Stellar Mass at Early Times. Astrophys. J. 2022, 927, 170. [Google Scholar] [CrossRef]
  52. Hashimoto, T.; Inoue, A.K.; Mawatari, K.; Tamura, Y.; Matsuo, H.; Furusawa, H.; Harikane, Y.; Shibuya, T.; Knudsen, K.K.; Kohno, K.; et al. Big Three Dragons: A z = 7.15 Lyman-break galaxy detected in [O III] 88μm, [C II] 158μm, and dust continuum with ALMA. Publ. Astron. Soc. Jpn. 2019, 71, 71. [Google Scholar] [CrossRef]
  53. Fudamoto, Y.; Oesch, P.A.; Schouws, S.; Stefanon, M.; Smit, R.; Bouwens, R.J.; Bowler, R.A.A.; Endsley, R.; Gonzalez, V.; Inami, H.; et al. Normal, dust-obscured galaxies in the epoch of reionization. Nature 2021, 597, 489–492. [Google Scholar] [CrossRef]
  54. Schaerer, D.; Marques-Chaves, R.; Barrufet, L.; Oesch, P.; Izotov, Y.I.; Naidu, R.; Guseva, N.G.; Brammer, G. First look with JWST spectroscopy: Resemblance among z ∼ 8 galaxies and local analogs. Astron. Astrophys. 2022, 665, L4. [Google Scholar] [CrossRef]
  55. Killi, M.; Watson, D.; Fujimoto, S.; Akins, H.; Knudsen, K.; Richard, J.; Harikane, Y.; Rigopoulou, D.; Rizzo, F.; Ginolfi, M.; et al. A solar metallicity galaxy at z > 7? Possible detection of the [N II] 122 μm and [O III] 52 μm lines. Mon. Not. R. Astron. Soc. 2023, 521, 2526–2534. [Google Scholar] [CrossRef]
  56. Ziparo, F.; Ferrara, A.; Sommovigo, L.; Kohandel, M. Blue monsters. Why are JWST super-early, massive galaxies so blue? Mon. Not. R. Astron. Soc. 2023, 520, 2445–2450. [Google Scholar] [CrossRef]
  57. Malhotra, S. Detection of the 2175 ÅDust Feature in Mg II Absorption Systems. Astrophys. J. 1997, 488, L101–L104. [Google Scholar] [CrossRef]
  58. Pettini, M.; Smith, L.J.; Hunstead, R.W.; King, D.L. Metal Enrichment, Dust, and Star Formation in Galaxies at High Redshifts. III. Zn and CR Abundances for 17 Damped Lyman-Alpha Systems. Astrophys. J. 1994, 426, 79–96. [Google Scholar] [CrossRef]
  59. Steidel, C.C.; Pettini, M.; Dickinson, M.; Persson, S.E. Imaging of Two Damped Lyman Alpha Absorbers at Intermediate Redshifts. Astron. J. 1994, 108, 2046. [Google Scholar] [CrossRef]
  60. Omont, A.; Cox, P.; Bertoldi, F.; McMahon, R.G.; Carilli, C.; Isaak, K.G. A 1.2 mm MAMBO/IRAM-30 m survey of dust emission from the highest redshift PSS quasar. Astron. Astrophys. 2001, 374, 371–381. [Google Scholar] [CrossRef]
  61. Bertoldi, F.; Carilli, C.L.; Cox, P.; Fan, X.; Strauss, M.A.; Beelen, A.; Omont, A.; Zylka, R. Dust emission from the most distant quasars. Astron. Astrophys. 2003, 406, L55–L58. [Google Scholar] [CrossRef]
  62. Priddey, R.S.; Isaak, K.G.; McMahon, R.G.; Robson, E.I.; Pearson, C.P. Quasars as probes of the submillimetre cosmos at z > 5—I. Preliminary SCUBA photometry. Mon. Not. R. Astron. Soc. 2003, 344, L74–L78. [Google Scholar] [CrossRef]
  63. Maiolino, R.; Schneider, R.; Oliva, E.; Bianchi, S.; Ferrara, A.; Mannucci, F.; Pedani, M.; Roca Sogorb, M. A supernova origin of dust in a high-redshift quasar. Nature 2004, 431, 533. [Google Scholar] [CrossRef]
  64. Dwek, E.; Galliano, F.; Jones, A.P. The Evolution of Dust in the Early Universe with Applications to the Galaxy SDSS J1148+5251. Astrophys. J. 2007, 662, 927–939. [Google Scholar] [CrossRef]
  65. Castellano, M.; Napolitano, L.; Fontana, A.; Roberts-Borsani, G.; Treu, T.; Vanzella, E.; Zavala, J.A.; Arrabal Haro, P.; Calabrò, A.; Llerena, M.; et al. JWST NIRSpec Spectroscopy of the Remarkable Bright Galaxy GHZ2/GLASS-z12 at Redshift 12.34. Astrophys. J. 2024, 972, 143. [Google Scholar] [CrossRef]
  66. Bunker, A.J.; Saxena, A.; Cameron, A.J. JADES NIRSpec Spectroscopy of GN-z11: Lyman-α emission and possible enhanced nitrogen abundance in a z = 10.60 luminous galaxy. Astron. Astrophys. 2023, 677, A88. [Google Scholar] [CrossRef]
  67. Yang, L.; Morishita, T.; Leethochawalit, N.; Castellano, M.; Calabrò, A.; Treu, T.; Bonchi, A.; Fontana, A.; Mason, C.; Merlin, E.; et al. Early Results from GLASS-JWST. V: The First Rest-frame Optical Size-Luminosity Relation of Galaxies at z > 7. Astrophys. J. Lett. 2022, 938, L17. [Google Scholar] [CrossRef]
  68. Adams, N.J.; Conselice, C.J.; Ferreira, L.; Varadaraj, R.G.; Häußler, B. Discovery and properties of ultra-high redshift galaxies (9 < z < 12) in the JWST ERO SMACS 0723 Field. Mon. Not. R. Astron. Soc. 2023, 518, 4755–4766. [Google Scholar]
  69. Weingartner, J.C.; Draine, B.T. Dust Grain-Size Distributions and Extinction in the Milky Way, Large Magellanic Cloud, and Small Magellanic Cloud. Astrophys. J. 2001, 548, 296–309. [Google Scholar] [CrossRef]
  70. Ferrara, A.; Pallottini, A.; Sommovigo, L. Blue Monsters at z > 10. Where has all their dust gone. Astron. Astrophys. 2025, 694, A286. [Google Scholar] [CrossRef]
  71. Furtak, L.J.; Shuntov, M.; Atek, H.; Zitrin, A.; Richard, J.; Lehnert, M.D.; Chevallard, J. Constraining the physical properties of the first lensed z9 − 16 galaxy candidates with JWST. Mon. Not. R. Astron. Soc. 2023, 519, 3064–3075. [Google Scholar] [CrossRef]
  72. Nath, B.B.; Vasiliev, E.O.; Drozdov, S.A.; Shchekinov, Y.A. Dust-free starburst galaxies at redshifts z > 10. Mon. Not. R. Astron. Soc. 2023, 521, 662–667. [Google Scholar] [CrossRef]
  73. Ferrara, A. The eventful life of GS-z14-0, the most distant galaxy at redshift z = 14.32. Astron. Astrophys. 2024, 689, A310. [Google Scholar] [CrossRef]
  74. Ferrara, A.; Carniani, S.; di Mascia, F.; Bouwens, R.J.; Oesch, P.; Schouws, S. ALMA observations of super-early galaxies: Attenuation-free model predictions. Astron. Astrophys. 2025, 694, A215. [Google Scholar] [CrossRef]
  75. Saxena, A.; Cameron, A.J.; Katz, H.; Bunker, A.J.; Chevallard, J.; D’Eugenio, F.; Arribas, S.; Rachana, B.; Boyett, K.; Cargile, P.A.; et al. Hitting the slopes: A spectroscopic view of UV continuum slopes of galaxies reveals a reddening at z > 9.5. arXiv 2024, arXiv:2411.14532. [Google Scholar]
  76. Bouwens, R.J.; Smit, R.; Schouws, S.; Stefanon, M.; Bowler, R.; Endsley, R.; Gonzalez, V.; Inami, H.; Stark, D.; Oesch, P.; et al. Reionization Era Bright Emission Line Survey: Selection and Characterization of Luminous Interstellar Medium Reservoirs in the z > 6.5 Universe. Astrophys. J. 2022, 931, 160. [Google Scholar] [CrossRef]
  77. Castellano, M.; Fontana, A.; Treu, T.; Santini, P.; Merlin, E.; Leethochawalit, N.; Trenti, M.; Vanzella, E.; Mestric, U.; Bonchi, A.; et al. Early Results from GLASS-JWST. XIX. A High Density of Bright Galaxies at z ≈ 10 in the A2744 Region. Astrophys. J. Lett. 2022, 948, L14. [Google Scholar] [CrossRef]
  78. Topping, M.W.; Stark, D.P.; Endsley, R.; Bouwens, R.J.; Schouws, S.; Smit, R.; Stefanon, M.; Inami, H.; Bowler, R.A.A.; Oesch, P.; et al. The ALMA REBELS Survey: Specific star formation rates in the reionization era. Mon. Not. R. Astron. Soc. 2022, 516, 975–991. [Google Scholar] [CrossRef]
  79. Robertson, B.E.; Tacchella, S.; Johnson, B.D.; Hainline, K.; Whitler, L.; Eisenstein, D.J.; Endsley, R.; Rieke, M.; Stark, D.P.; Alberts, S.; et al. Identification and properties of intense star-forming galaxies at redshifts z > 10. NatAst 2023, 7, 611–621. [Google Scholar] [CrossRef]
  80. Rodighiero, G.; Bisigello, L.; Iani, E.; Marasco, A.; Grazian, A.; Sinigaglia, F.; Cassata, P.; Gruppioni, C. JWST unveils heavily obscured (active and passive) sources up to z ∼ 13. Mon. Not. R. Astron. Soc. Lett. 2023, 518, L19–L24. [Google Scholar] [CrossRef]
  81. Ferrara, A.; Pallottini, A.; Dayal, P. On the stunning abundance of super-early, luminous galaxies revealed by JWST. Mon. Not. R. Astron. Soc. 2023, 522, 3986–3991. [Google Scholar] [CrossRef]
  82. Fiore, F.; Ferrara, A.; Bischetti, M.; Feruglio, C.; Travascio, A. Dusty-wind-clear JWST Super-early Galaxies. Astrophys. J. Lett. 2023, 943, L27. [Google Scholar] [CrossRef]
  83. Tsuna, D.; Nakazato, Y.; Hartwig, T. A photon burst clears the earliest dusty galaxies: Modelling dust in high-redshift galaxies from ALMA to JWST. Mon. Not. R. Astron. Soc. 2023, 526, 4801–4813. [Google Scholar] [CrossRef]
  84. Ferrara, A. Super-early JWST galaxies, outflows, and Lyα visibility in the Epoch of Reionization. Astron. Astrophys. 2024, 684, A207. [Google Scholar] [CrossRef]
  85. Nakazato, Y.; Ferrara, A. Radiation-driven dusty outflows from early galaxies. arXiv 2025, arXiv:2412.07598. [Google Scholar]
  86. Stern, J.; Faucher-Giguŕe, C.-A.; Fielding, D.; Fielding, D.; Quataert, E.; Hafen, Z.; Gurvich, A.B.; Ma, X.; Byrne, L.; El-Badry, K.; et al. Virialization of the Inner CGM in the FIRE Simulations and Implications for Galaxy Disks, Star Formation, and Feedback. Astrophys. J. 2021, 911, 88. [Google Scholar] [CrossRef]
  87. Furlanetto, S.R.; Mirocha, J. Bursty star formation during the Cosmic Dawn driven by delayed stellar feedback. Mon. Not. R. Astron. Soc. 2022, 511, 3895–3909. [Google Scholar] [CrossRef]
  88. Mirocha, J.; Furlanetto, S.R. Balancing the efficiency and stochasticity of star formation with dust extinction in zgeq10 galaxies observed by JWST. Mon. Not. R. Astron. Soc. 2023, 519, 843–853. [Google Scholar] [CrossRef]
  89. Sun, G.; Faucher-Giguŕe, C.-A.; Hayward, C.C.; Shen, X. Seen and unseen: Bursty star formation and its implications for observations of high-redshift galaxies with JWST. Mon. Not. R. Astron. Soc. 2023, 526, 2665–2672. [Google Scholar] [CrossRef]
  90. Sun, G.; Faucher-Giguŕe, C.-A.; Hayward, C.C.; Shen, X. Bursty Star Formation Naturally Explains the Abundance of Bright Galaxies at Cosmic Dawn. Astrophys. J. Lett. 2023, 955, L35. [Google Scholar] [CrossRef]
  91. Pallottini, A.; Ferrara, A. Stochastic star formation in early galaxies: Implications for the James Webb Space Telescope. Astron. Astrophys. 2023, 677, L4. [Google Scholar] [CrossRef]
  92. Sugimura, K.; Ricotti, M.; Park, J.; Garcia, F.A.B.; Yajima, H. Violent Starbursts and Quiescence Induced by Far-ultraviolet Radiation Feedback in Metal-poor Galaxies at High Redshift. Astrophys. J. 2024, 970, 14. [Google Scholar] [CrossRef]
  93. Dekel, A.; Sarkar, K.C.; Birnboim, Y.; Mandelker, N.; Li, Z. Efficient formation of massive galaxies at cosmic dawn by feedback-free starbursts. Mon. Not. R. Astron. Soc. 2023, 523, 3201–3218. [Google Scholar] [CrossRef]
  94. Li, Z.; Dekel, A.; Sarkar, K.C.; Aung, H.; Giavalisco, M.; Mandelker, N.; Tacchella, S. Feedback-free starbursts at cosmic dawn: Observable predictions for JWST. Astron. Astrophys. 2024, 590, A108. [Google Scholar] [CrossRef]
  95. Legrand, L.; Hutter, A.; Dayal, P.; Ucci, G.; Gottlöber, S.; Yepes, G. Astraeus IV: Quantifying the star formation histories of galaxies in the Epoch of Reionization. Mon. Not. R. Astron. Soc. 2022, 509, 595–613. [Google Scholar] [CrossRef]
  96. Mason, C.A.; Trenti, M.; Treu, T. The brightest galaxies at cosmic dawn. Mon. Not. R. Astron. Soc. 2023, 521, 497–503. [Google Scholar] [CrossRef]
  97. Inayoshi, K.; Harikane, Y.; Inoue, A.K.; Li, W.; Ho, L.C. A Lower Bound of Star Formation Activity in Ultra-high-redshift Galaxies Detected with JWST: Implications for Stellar Populations and Radiation Sources. Astrophys. J. Lett. 2022, 938, L10. [Google Scholar] [CrossRef]
  98. Hutter, A.; Cueto, E.R.; Dayal, P.; Gottlöber, S.; Trebitsch, M.; Yepes, G. Astraeus X: Indications of a top-heavy initial mass function in highly star-forming galaxies from JWST observations at z > 10. Astron. Astrophys. 2025, 694, A254. [Google Scholar] [CrossRef]
  99. Jeong, T.B.; Jeon, M.; Song, H. Simulating High-redshift Galaxies: Enhancing UV Luminosity with Star Formation Efficiency and a Top-heavy IMF. Astrophys. J. 2025, 980, 10. [Google Scholar] [CrossRef]
  100. Mauerhofer, V.; Dayal, P.; Haehnelt, M.G.; Kimm, T.; Rosdahl, J.; Teyssier, R. Synergising semi-analytical models and hydrodynamical simulations to interpret JWST data from the first billion years. Astron. Astrophys. 2025, 696. [Google Scholar] [CrossRef]
  101. Michałowski, M.J.; Murphy, E.J.; Hjorth, J.; Watson, D.; Gall, C.; Dunlop, J.S. Dust grain growth in the interstellar medium of 5 < z < 6.5 quasars. Astron. Astrophys. 2010, 522, A15. [Google Scholar]
  102. Morgan, H.L.; Edmunds, M.G. Dust formation in early galaxies. Mon. Not. R. Astron. Soc. 2003, 343, 427–442. [Google Scholar] [CrossRef]
  103. Nozawa, T.; Kozasa, T.; Umeda, H.; Maeda, K.; Nomoto, K. Dust in the Early Universe: Dust Formation in the Ejecta of Population III Supernovae. Astrophys. J. 2003, 598, 785–803. [Google Scholar] [CrossRef]
  104. McKee, C. Dust Destruction in the Interstellar Medium. In Interstellar Dust: Proceedings of the 135th IAU Symposium; Allamandola, L.J., Tielens, A.G.G.M., Eds.; Kluwer: Dordrecht, The Netherlands, 1989; Volume 135, p. 431. [Google Scholar]
  105. Draine, B.T. Interstellar Dust Models and Evolutionary Implications. In Cosmic Dust–Near and Far; ASP Conferences Series; Henning, T., Grun, E., Steinacker, J., Eds.; Astronomical Society of the Pacific: San Francisco, CA, USA, 2009; Volume 414, p. 453. [Google Scholar]
  106. Dedikov, S.Y.; Vasiliev, E.O. Inhibited destruction of dust by supernova in a clumpy medium. New Astron. 2025, 114, 102293. [Google Scholar] [CrossRef]
  107. Dwek, E. The Infrared Diagnostic of a Dusty Plasma with Applications to Supernova Remnants. Astrophys. J. 1987, 322, 812. [Google Scholar] [CrossRef]
  108. Seok, J.Y.; Koo, B.-C.; Hirashita, H. Dust Cooling in Supernova Remnants in the Large Magellanic Cloud. Astrophys. J. 2015, 807, 100. [Google Scholar] [CrossRef]
  109. Isobe, Y.; Ouchi, M.; Nakajima, K.; Harikane, Y.; Ono, Y.; Xu, Y.; Zhang, Y.; Umeda, H. Redshift Evolution of Electron Density in the Interstellar Medium at z∼0–9 Uncovered with JWST/NIRSpec Spectra and Line-spread Function Determinations. Astrophys. J. 2023, 956, 139. [Google Scholar] [CrossRef]
  110. Abdurro’uf; Larson,, R.L.; Coe,, D.; Hsiao,, T.Y.-Y.; Álvarez-Márquez,, J.; Gómez, A.C.; Adamo, A.; Bhatawdekar, R.; Bik, A.; Bradley, L.D.; et al. JWST NIRSpec High-resolution Spectroscopy of MACS0647–JD at z = 10.167: Resolved [O II] Doublet and Electron Density in an Early Galaxy. Astrophys. J. 2024, 973, 47. [Google Scholar] [CrossRef]
  111. Marconcini, C.; D’Eugenio, F.; Maiolino, R.; Arribas, S.; Bunker, A.; Carniani, S.; Charlot, S.; Perna, M.; Rodríguez Del Pino, B.; Übler, H.; et al. GA-NIFS: The interplay between merger, star formation, and chemical enrichment in MACS1149-JD1 at z = 9.11 with JWST/NIRSpec. Mon. Not. R. Astron. Soc. 2024, 533, 2488–2501. [Google Scholar] [CrossRef]
  112. Vasiliev, E.O.; Nath, B.B. Dust destruction from clustered SN explosions. 2025, submitted. 2025; submitted. [Google Scholar]
  113. Hopkins, P.F.; Cox, T.J.; Hernquist, L.; Narayanan, D.; Hayward, C.C.; Murray, N. Star formation in galaxy mergers with realistic models of stellar feedback and the interstellar medium. Mon. Not. R. Astron. Soc. 2013, 430, 1901–1927. [Google Scholar] [CrossRef]
  114. Carniani, S.; Venturi, G.; Parlanti, E.; de Graaff, A.; Maiolino, R.; Arribas, S.; Bonaventura, N.; Boyett, K.; Bunker, A.J.; Cameron, A.J.; et al. JADES: The incidence rate and properties of galactic outflows in low-mass galaxies across 3 < z < 9. Astron. Astrophys. 2024, 685, A99. [Google Scholar] [CrossRef]
  115. Carniani, S.; D’Eugenio, F.; Ji, X.; Parlanti, E.; Scholtz, J.; Sun, F.; Venturi, G.; Bakx, T.J.L.C.; Curti, M.; Maiolino, R.; et al. The eventful life of a luminous galaxy at z = 14: Metal enrichment, feedback, and low gas fraction? Astron. Astrophys. 2024, 696, A87. [Google Scholar] [CrossRef]
  116. Heckman, T.M. Galactic Superwinds at Low and High Redshift. Astron. Soc. Pac. 2001, 240, 345. [Google Scholar]
  117. Heckman, T.M. Galactic Superwinds Circa 2001. Astron. Soc. Pac. 2003, 254, 292. [Google Scholar]
  118. Veilleux, S.; Cecil, G.; Bland-Hawthorn, J. Galactic winds. ARAstron. Astrophys. 2005, 43, 769–826. [Google Scholar] [CrossRef]
  119. Bolatto, A.D.; Warren, S.R.; Leroy, A.K. Suppression of star formation in the galaxy NGC 253 by a starburst-driven molecular wind. Nature 2013, 499, 450–453. [Google Scholar] [CrossRef]
  120. Nath, B.B.; Shchekinov, Y.A. Conditions for Supernovae-driven Galactic Wind. Astrophys. J. Lett. 2013, 777, L12. [Google Scholar] [CrossRef]
  121. Veilleux, S.; Maiolino, R.; Bolatto, A.D.; Aalto, S. Cool outflows in galaxies and their implications. Astron. Astrophys. Rev. 2020, 28, 2. [Google Scholar]
  122. Vasiliev, E.O.; Drozdov, S.A.; Nath, B.B.; Dettmar, R.-J.; Shchekinov, Y.A. Disc-halo gas outflows driven by stellar clusters as seen in multiwavelength tracers. Mon. Not. R. Astron. Soc. 2023, 520, 2655–2667. [Google Scholar] [CrossRef]
  123. Kennicutt, R.C., Jr.; Evan, N.J., II. Star Formation in the Milky Way and Nearby Galaxies. Annu. Rev. Astron. Astrophys. 2012, 50, 531–608. [Google Scholar] [CrossRef]
  124. Murray, N.; Quataert, E.; Thompson, T.A. On the Maximum Luminosity of Galaxies and Their Central Black Holes: Feedback from Momentum-driven Winds. Astrophys. J. 2005, 618, 569–585. [Google Scholar] [CrossRef]
  125. Mathis, J.S.; Rumple, W.; Nordsiek, K.H. The size distribution of interstellar grains. Astrophys. J. 1977, 217, 425–433. [Google Scholar] [CrossRef]
  126. Nozawa, T.; Kosaza, T.; Habe, A.; Dwek, E.; Umeda, H.; Tominaga, N.; Maeda, K.; Nomoto, K. Evolution of dust in primordial supernova remnants: Can dust grains formed in the ejecta survive and be injected into the early interstellar medium? Astrophys. J. 2007, 666, 955. [Google Scholar] [CrossRef]
  127. Mac Low, M.-M.; McCray, R.; Norman, M.L. Superbubble Blowout Dynamics. Astrophys. J. 1989, 337, 141. [Google Scholar] [CrossRef]
  128. Suchkov, A.A.; Balsara, D.S.; Heckman, T.M.; Leitherer, C. Dynamics and X-Ray Emission of a Galactic Superwind Interacting with Disk and Halo Gas. Astrophys. J. 1994, 430, 511–532. [Google Scholar] [CrossRef]
  129. Bisnovatyi-Kogan, G.S.; Silich, S.A. Shock-wave propagation in the nonuniform interstellar medium. Rev. Mod. Phys. 1995, 67, 661–712. [Google Scholar] [CrossRef]
  130. Mac Low, M.-M.; Ferrara, A. Starburst-driven Mass Loss from Dwarf Galaxies: Efficiency and Metal Ejection. Astrophys. J. 1999, 513, 142–155. [Google Scholar] [CrossRef]
  131. Dekel, A.; Birnboim, Y.; Engel, G.; Freundlich, J.; Goerdt, T.; Mumcuoglu, M.; Neistein, E.; Pichon, C.; Teyssier, R.; Zinger, E. Cold streams in early massive hot haloes as the main mode of galaxy formation. Nature 2009, 457, 451–454. [Google Scholar] [CrossRef]
  132. Mandelker, N.; van Dokkum, P.G.; Brodie, J.P.; van den Bosch, F.C.; Ceverino, D. Cold Filamentary Accretion and the Formation of Metal-poor Globular Clusters and Halo Stars. Astrophys. J. 2018, 861, 148. [Google Scholar] [CrossRef]
  133. Faucher-Giguŕe, C.-A. A model for the origin of bursty star formation in galaxies. Mon. Not. R. Astron. Soc. 2018, 473, 3717–3731. [Google Scholar] [CrossRef]
  134. Scalo, J.M.; Struck-Marcell, C. A Physical Mechanism for Bursts of Star Formation. Astrophys. J. 1986, 301, 77. [Google Scholar] [CrossRef]
  135. Orr, M.E.; Hayward, C.C.; Nelson, E.J.; Hopkins, P.F.; Faucher-Giguère, C.-A.; Kereš, D.; Chan, T.K.; Schmitz, D.M.; Miller, T.B. Stacked Star Formation Rate Profiles of Bursty Galaxies Exhibit “Coherent” Star Formation. Astrophys. J. 2017, 849, L2. [Google Scholar] [CrossRef]
  136. Orr, M.E.; Hayward, C.C.; Hopkins, P.F. A simple non-equilibrium feedback model for galaxy-scale star formation: Delayed feedback and SFR scatter. Mon. Not. R. Astron. Soc. 2019, 486, 4724–47376. [Google Scholar] [CrossRef]
  137. Valiante, R.; Schneider, R.; Salvadori, S.; Bianchi, S. The origin of the dust in high-redshift quasars: The case of SDSS J1148+5251. Mon. Not. R. Astron. Soc. 2011, 416, 1916–1935. [Google Scholar] [CrossRef]
  138. Palla, M.; De Looze, I.; Relaõ, M.; van der Giessen, S.; Dayal, P.; Ferrara, A.; Schneider, R.; Graziani, L.; Algera, H.S.B.; Aravena, M.; et al. Metal and dust evolution in ALMA REBELS galaxies: Insights for future JWST observations. Mon. Not. R. Astron. Soc. 2024, 528, 2407–2427. [Google Scholar] [CrossRef]
  139. Watson, D.; Christensen, L.; Knudsen, K.K.; Richard, J.; Gallazzi, A.; Michałowski, M.J. A dusty, normal galaxy in the epoch of reionization. Natur 2015, 519, 327–330. [Google Scholar] [CrossRef]
  140. Laporte, N.; Ellis, R.S.; Boone, F.; Bauer, F.E.; Quénard, D.; Roberts-Borsani, G.W.; Pellò, R.; Pèrez-Fournon, I.; Streblyanska, A. Dust in the Reionization Era: ALMA Observations of a z = 8.38 Gravitationally Lensed Galaxy. Astrophys. J. Lett. 2017, 837, L21. [Google Scholar] [CrossRef]
  141. Sugahara, Y.; Inoue, A.K.; Hashimoto, T.; Yamanaka, S.; Fujimoto, S.; Tamura, Y.; Matsuo, H.; Binggeli, C.; Zackrisson, E. Big Three Dragons: A [N II] 122 μm Constraint and New Dust-continuum Detection of a z = 7.15 Bright Lyman-break Galaxy with ALMA. Astrophys. J. 2021, 923, 5. [Google Scholar] [CrossRef]
  142. Hashimoto, T.; Inoue, A.K.; Sugahara, Y.; Fudamoto, Y.; Fujimoto, S.; Knudsen, K.K.; Matsuo, H.; Tamura, Y.; Yamanaka, S.; Harikane, Y. Big Three Dragons: Molecular Gas in a Bright Lyman-break Galaxy at z = 7.15. Astrophys. J. 2023, 952, 48. [Google Scholar] [CrossRef]
  143. Bakx, T.J.L.C.; Sommovigo, L.; Carniani, S.; Ferrara, A.; Akins, H.B.; Fujimoto, S.; Hagimoto, M.; Knudsen, K.K.; Pallottini, A.; Tamura, Y.; et al. Accurate dust temperature determination in a z = 7.13 galaxy. Mon. Not. R. Astron. Soc. 2021, 508, L58–L63. [Google Scholar] [CrossRef]
  144. Akins, H.B.; Casey, C.M.; Allen, N.; Bagley, M.B.; Dickinson, M.; Finkelstein, S.L.; Franco, M.; Harish, S.; Arrabal Haro, P.; Ilbert, O.; et al. Two Massive, Compact, and Dust-obscured Candidate z ≃ 8 Galaxies Discovered by JWST. Astrophys. J. 2023, 956, 16. [Google Scholar] [CrossRef]
  145. Glazer, K.; Bradăc, M.; Sanders, R.L.; Fujimoto, S.; Bolan, P.; Ferrara, A.; Strait, V.; Jones, T.; Lemaux, B.C.; Vallini, L.; et al. Studying [C II] emission in low-mass galaxies at z∼7. Mon. Not. R. Astron. Soc. 2024, 531, 945–952. [Google Scholar] [CrossRef]
  146. Béthermin, M.; Daddi, E.; Magdis, G.; Lagos, C.; Sargent, M.; Albrecht, M.; Aussel, H.; Bertoldi, F.; Buat, V.; Galametz, M.; et al. Evolution of the dust emission of massive galaxies up to z = 4 and constraints on their dominant mode of star formation. Astron. Astrophys. 2015, 573, A113. [Google Scholar] [CrossRef]
  147. Donevski, D.; Lapi, A.; Malek, K.D.; Liu, D.; Gómez-Guijarro, C.; Davé, R.; Kraljic, K.; Pantoni, L.; Man, A.; Fujimoto, S.; et al. In pursuit of giants. I. The evolution of the dust-to-stellar mass ratio in distant dusty galaxies Astron. Astrophys. 2020, 644, A144. [Google Scholar] [CrossRef]
  148. Donevski, D.; Damjanov, I.; Nanni, A.; Man, A.; Giulietti, M.; Romano, M.; Lapi, A.; Narayanan, D.; Davé, R.; Shivaei, I.; et al. In pursuit of giants. II. Evolution of dusty quiescent galaxies over the last six billion years from the hCOSMOS survey. Astron. Astrophys. 2023, 678, A35. [Google Scholar] [CrossRef]
  149. Gall, C.; Andersen, A.C.; Hjorth, J. Genesis and evolution of dust in galaxies in the early Universe. I. Modelling dust evolution in starburst galaxies. Astron. Astrophys. 2011, 528, A13. [Google Scholar] [CrossRef]
  150. Gall, C.; Hjorth, J.; Andersen, A.C. Production of dust by massive stars at high redshift. Astron. Astrophys. Rev. 2011, 19, 43. [Google Scholar] [CrossRef]
  151. Schneider, R.; Maiolino, R. The formation and cosmic evolution of dust in the early Universe. I. Dust sources. Astron. Astrophys. Rev. 2023, 32, 2. [Google Scholar] [CrossRef]
  152. Witstok, J.; Shivaei, I.; Smit, R.; Maiolino, R.; Carniani, S.; Curtis-Lake, E.; Ferruit, P.; Arribas, S.; Bunker, A.J.; Cameron, A.J.; et al. Carbonaceous dust grains seen in the first billion years of cosmic time. Nature 2023, 621, 267–270. [Google Scholar] [CrossRef]
  153. Markov, V.; Gallerani, S.; Ferrara, A.; Pallottini, A.; Parlanti, E.; Mascia, F.D.; Sommovigo, L.; Kohandel, M. The evolution of dust attenuation in z = 2 − 12 galaxies observed by JWST. Nat. Astron. 2025, 9, 458–468. [Google Scholar] [CrossRef]
  154. Polletta, M.; Frye, B.L.; Garuda, N.; Willner, S.P.; Berta, S.; Kneissl, R.; Dole, H.; Jansen, R.A.; Lehnert, M.D.; Cohen, S.H.; et al. JWST’s PEARLS: Resolved study of the stellar and dust components in starburst galaxies at cosmic noon. Astron. Astrophys. 2024, 690, 285. [Google Scholar] [CrossRef]
  155. Popping, G.; Somerville, R.S.; Galametz, M. The dust content of galaxies from z = 0 to z = 9. Mon. Not. R. Astron. Soc. 2017, 471, 3152–3185. [Google Scholar] [CrossRef]
  156. Liao, C.-L.; Chen, C.-C.; Wang, W.-H.; Smail, I.; Ao, Y.; Chapman, S.C.; Dudzevičiūtė, U.; Frias Castillo, M.; Lee, M.M.; Serjeant, S.; et al. An ALMA Spectroscopic Survey of the Brightest Submillimeter Galaxies in the SCUBA-2-COSMOS Field (AS2COSPEC): Physical Properties of z = 2 − 5 Ultra- and Hyperluminous Infrared Galaxies. Astrophys. J. 2024, 961, 226. [Google Scholar] [CrossRef]
  157. da Cunha, E.; Walter, F.; Smail, I.R.; Swinbank, A.M.; Simpson, J.M.; Decarli, R.; Hodge, J.A.; Weiss, A.; van der Werf, P.P.; Bertoldi, F.; et al. An ALMA Survey of Sub-millimeter Galaxies in the Extended Chandra Deep Field South: Physical Properties Derived from Ultraviolet-to-radio Modeling. Astrophys. J. 2015, 806, 110. [Google Scholar] [CrossRef]
  158. Rowlands, K.; Gomez, H.L.; Dunne, L. The dust budget crisis in high-redshift submillimetre galaxies. Mon. Not. R. Astron. Soc. 2014, 441, 1040–1058. [Google Scholar] [CrossRef]
  159. Péroux, C.; De Cia, A.; Howk, J.C. Observed dust surface density across cosmic times. Mon. Not. R. Astron. Soc. 2023, 522, 4852–4861. [Google Scholar] [CrossRef]
  160. Bianchi, S.; Schneider, R. Dust formation and survival in supernova ejecta. Mon. Not. R. Astron. Soc. 2007, 378, 973–982. [Google Scholar] [CrossRef]
  161. Sarangi, A.; Cherchneff, I. The Chemically Controlled Synthesis of Dust in Type II-P Supernovae. Astrophys. J. 2013, 776, 107. [Google Scholar] [CrossRef]
  162. Sarangi, A.; Cherchneff, I. Condensation of dust in the ejecta of Type II-P supernovae. Astron. Astrophys. 2015, 575, A95. [Google Scholar]
  163. Marassi, S.; Schneider, R.; Limongi, M.; Chieffi, A.; Graziani, L.; Bianchi, S. Supernova dust yields: The role of metallicity, rotation, and fallback. Mon. Not. R. Astron. Soc. 2019, 484, 2587–2604. [Google Scholar] [CrossRef]
  164. Nath, B.B.; Laskar, T.; Shull, J.M. Dust Sputtering by Reverse Shocks in Supernova Remnants. Astrophys. J. 2008, 682, 1055–1064. [Google Scholar] [CrossRef]
  165. Hirashita, H.; Ferrara, A.; Dayal, P.; Ouchi, M. Constraining dust formation in high-redshift young galaxies. Mon. Not. R. Astron. Soc. 2014, 443, 1704–1712. [Google Scholar] [CrossRef]
  166. Slavin, J.D.; Dwek, E.; Mac Low, M.-M.; Hill, A.S. The Dynamics, Destruction, and Survival of Supernova-formed Dust Grains. Astrophys. J. 2020, 902, 135. [Google Scholar] [CrossRef]
  167. Vasiliev, E.O.; Shchekinov, Y.A. Dust evolution in a supernova interacting with the ISM. Mon. Not. R. Astron. Soc. 2024, 527, 8755–8767. [Google Scholar] [CrossRef]
  168. Draine, B.T. Evolution of interstellar dust. Astron. Soc. Pac. 1990, 12, 193. [Google Scholar]
  169. Dwek, E. The Evolution of the Elemental Abundances in the Gas and Dust Phases of the Galaxy. Astrophys. J. 1998, 501, 643. [Google Scholar] [CrossRef]
  170. Asano, R.S.; Takeuchi, T.T.; Hirashita, H.; Inoue, A.K. Dust formation history of galaxies: A critical role of metallicity* for the dust mass growth by accreting materials in the interstellar medium. Earth Planets Space 2013, 65, 213–222. [Google Scholar] [CrossRef]
  171. Asano, R.S.; Takeuchi, T.T.; Hirashita, H.; Nozawa, T. What determines the grain size distribution in galaxies? Mon. Not. R. Astron. Soc. 2013, 432, 637–652. [Google Scholar] [CrossRef]
  172. Narayanan, D.; Stark, D.P.; Finkelstein, S.L.; Torrey, P.; Li, Q.; Cullen, F.; Topping, M.W.; Marinacci, F.; Sales, L.V.; Shen, X.; et al. The Ultraviolet Slopes of Early Universe Galaxies: The Impact of Bursty Star Formation, Dust, and Nebular Continuum Emission. Astrophys. J. 2025, 982, 7. [Google Scholar] [CrossRef]
  173. Galliano, F.; Galametz, M.; Jones, A.P. The Interstellar Dust Properties of Nearby Galaxies. Annu. Rev. Astron. Astrophys. 2018, 56, 673–713. [Google Scholar] [CrossRef]
  174. Ceccarelli, C.; Viti, S.; Balucani, N.; Taquet, V. The evolution of grain mantles and silicate dust growth at high redshif. Mon. Not. R. Astron. Soc. 2018, 476, 1371–1383. [Google Scholar] [CrossRef]
  175. Ferrara, A.; Viti, S.; Ceccarelli, C. The problematic growth of dust in high-redshift galaxies. Mon. Not. R. Astron. Soc. 2016, 463, L112–L116. [Google Scholar] [CrossRef]
  176. Spitzer, L. Physical Processes in the Interstellar Medium; Wiley: New York, NY, USA, 1978. [Google Scholar]
  177. Sommovigo, L.; Ferrara, A.; Pallottini, A.; Dayal, P.; Bouwens, R.J.; Smit, R.; da Cunha, E.; De Looze, I.; Bowler, R.A.A.; Hodge, J.; et al. The ALMA REBELS Survey: Cosmic dust temperature evolution out to z∼7. Mon. Not. R. Astron. Soc. 2022, 513, 3122–3135. [Google Scholar] [CrossRef]
  178. He, J.; Acharyya, K.; Vidali, G. Sticking of Molecules on Nonporous Amorphous Water Ice. Astrophys. J. 2016, 823, 56. [Google Scholar] [CrossRef]
  179. Bossion, D.; Sarangi, A.; Aalto, S.; Esmerian, C.; Hashemi, S.R.; Knudsen, K.K.; Vlemmings, W.; Nyman, G. Accurate sticking coefficient calculation for carbonaceous dust growth through accretion and desorption in astrophysical environments. Astron. Astrophys. 2024, 692, A249. [Google Scholar] [CrossRef]
  180. Draine, B.T. Physics of the Interstellar and Intergalactic Medium; Princeton University Press: Princeton, NJ, USA, 2011. [Google Scholar]
  181. Hosokawa, T.; Inutsuka, S.-I. Dynamical Expansion of Ionization and Dissociation Front around a Massive Star. II. On the Generality of Triggered Star Formation. Astrophys. J. 2006, 646, 240–257. [Google Scholar] [CrossRef]
  182. Gupta, S.; Nath, B.B.; Sharma, P.; Shchekinov, Y. How radiation affects superbubbles: Through momentum injection in early phase and photo-heating thereafter. Mon. Not. R. Astron. Soc. 2016, 462, 4532–4548. [Google Scholar] [CrossRef]
  183. Haid, S.; Walch, S.; Seifried, D.; Wünsch, R.; Dinnbier, F.; Naab, T. The relative impact of photoionizing radiation and stellar winds on different environments. Mon. Not. R. Astron. Soc. 2018, 478, 4799–4815. [Google Scholar] [CrossRef]
  184. Dwarkadas, V.V. On the Evolution of, and Hot Gas in, Wind-Blown Bubbles around Massive Stars-Wind Bubbles Are Not Energy-Conserving. Galaxies 2023, 11, 78. [Google Scholar] [CrossRef]
  185. Kourniotis, M.; Wünsch, R.; Martínez-González, S. Simulations of pre-supernova feedback in spherical clouds. Mon. Not. R. Astron. Soc. 2023, 521, 5686–5698. [Google Scholar] [CrossRef]
  186. Nanni, A.; Cristallo, S.; Donevski, D.; Michałowski, M.J.; Romano, M.; Sawant, P. Dust survival in harsh environments. Investigating the relevance of photo-evaporation process. Astron. Astrophys. 2024, 684, A361. [Google Scholar] [CrossRef]
  187. Shchekinov, Y.A.; Nath, B.B. Survival of dust in superdusty galaxies at redshifts z = 7 − 8. 2025; submitted. [Google Scholar]
  188. André, P.; Men’shchikov, A.; Bontemps, S.; Könyves, V.; Motte, F.; Schneider, N.; Didelon, P.; Minier, V.; Saraceno, P.; Ward-Thompson, D.; et al. From filamentary clouds to prestellar cores to the stellar IMF: Initial highlights from the Herschel Gould Belt Survey. Astron. Astrophys. 2022, 518, L102. [Google Scholar] [CrossRef]
  189. Zavagno, A.; André, P.; Schuller, F.; Peretto, N.; Shimajiri, Y.; Arzoumanian, D.; Csengeri, T.; Figueira, M.; Fuller, G.A.; Könyves, V.; et al. The role of Galactic H II regions in the formation of filaments. High-resolution submilimeter imaging of RCW 120 with ArTéMiS. Astron. Astrophys. 2020, 638, A7. [Google Scholar] [CrossRef]
  190. Poludnenko, A.Y.; Frank, A.; Blackman, E.G. Hydrodynamic Interaction of Strong Shocks with Inhomogeneous Media. I. Adiabatic Case. Astrophys. J. 2002, 576, 832–848. [Google Scholar] [CrossRef]
  191. Korolev, V.V.; Vasiliev, E.O.; Kovalenko, I.G.; Shchekinov, Y.A. Dynamics of a supernova envelope in a cloudy interstellar medium. ARep 2015, 59, 690–708. [Google Scholar] [CrossRef]
  192. Faucher-Giguére, C.-A.; Oh, S.P. Key Physical Processes in the Circumgalactic Medium. ARAstron. Astrophys. 2023, 61, 131–195. [Google Scholar] [CrossRef]
  193. Schneider, E.E.; Robertson, B.E. Hydrodynamical Coupling of Mass and Momentum in Multiphase Galactic Winds. Astrophys. J. 2017, 834, 144. [Google Scholar] [CrossRef]
  194. Villares, A.S.; Banda-Barragán, W.E.; Rojas, C. Hydrodynamic shielding in radiative multicloud outflows within multiphase galactic winds. Mon. Not. R. Astron. Soc. 2024, 535, 1163–1182. [Google Scholar] [CrossRef]
  195. Zhang, D.; Thompson, T.A.; Quataert, E.; Murray, N. Entrainment in trouble: Cool cloud acceleration and destruction in hot supernova-driven galactic winds. Mon. Not. R. Astron. Soc. 2017, 468, 4801–4814. [Google Scholar] [CrossRef]
  196. Zhang, D.; Davis, S.W.; Jiang, Y.-F.; Stone, J.M. Dusty Cloud Acceleration by Radiation Pressure in Rapidly Star-forming Galaxies. Astrophys. J. 2018, 854, 110. [Google Scholar] [CrossRef]
  197. Gronke, M.; Oh, S.P. The growth and entrainment of cold gas in a hot wind. Mon. Not. R. Astron. Soc. 2018, 480, L111–L115. [Google Scholar] [CrossRef]
  198. Bakx, T.J.L.C.; Zavala, J.A.; Mitsuhashi, I.; Treu, T.; Fontana, A.; Tadaki, K.-i.; Casey, C.M.; Castellano, M.; Glazebrook, K.; Hagimoto, M.; et al. Deep ALMA redshift search of a z ∼ 12 GLASS-JWST galaxy candidate. Mon. Not. R. Astron. Soc. 2023, 519, 5076–5085. [Google Scholar] [CrossRef]
  199. Slavin, J.D.; Dwek, E.; Jones, A.P. Destruction of Interstellar Dust in Evolving Supernova Remnant Shock Waves. Astrophys. J. 2015, 803, 7. [Google Scholar] [CrossRef]
  200. Pearson, W.J.; Wang, L.; Alpaslan, M.; Baldry, I.; Bilicki, M.; Brown, M.J.I.; Grootes, M.W.; Holwerda, B.W.; Kitching, T.D.; Kruk, S.; et al. Effect of galaxy mergers on star-formation rates. Astron. Astrophys. 2019, 631, A51. [Google Scholar] [CrossRef]
  201. Puskás, D.; Tacchella, S.; Simmonds, C.; Hainline, K.; D’Eugenio, F.; Alberts, S.; Arribas, S.; Baker, W.M.; Bunker, A.J.; Carniani, S.; et al. Constraining the major merger history of z∼ 9 galaxies using JADES: Dominant in-situ star formation. arXiv 2025, arXiv:2502.01721. [Google Scholar] [CrossRef]
  202. Kiyota, T.; Ouchi, M.; Xu, Y.; Nakazato, Y.; Soga, K.; Yajima, H.; Fujimoto, S.; Harikane, Y.; Nakajima, K.; Ono, Y.; et al. Comprehensive JWST+ALMA Study on the Extended Lyα Emitters, Himiko and CR7 at z∼7: Blue Major Merger Systems in Stark Contrast to Submillimeter Galaxies. arXiv 2025, arXiv:2504.03156. [Google Scholar]
  203. Chastenet, J.; De Looze, I.; Relaño, M.; Dale, D.A.; Williams, T.G.; Bianchi, S.; Xilouris, E.M.; Baes, M.; Bolatto, A.D.; Boyer, M.L.; et al. JWST MIRI and NIRCam observations of NGC 891 and its circumgalactic medium. Astron. Astrophys. 2024, 690, A348. [Google Scholar] [CrossRef]
  204. Ménard, B.; Scranton, R.; Fukugita, M.; Richards, G. Measuring the galaxy-mass and galaxy-dust correlations through magnification and reddening. Mon. Not. R. Astron. Soc. 2010, 405, 1025–1039. [Google Scholar] [CrossRef]
  205. Fukushima, H.; Yajima, H. Radiation hydrodynamics simulations of massive star cluster formation in giant molecular clouds. Mon. Not. R. Astron. Soc. 2021, 506, 5512–5539. [Google Scholar] [CrossRef]
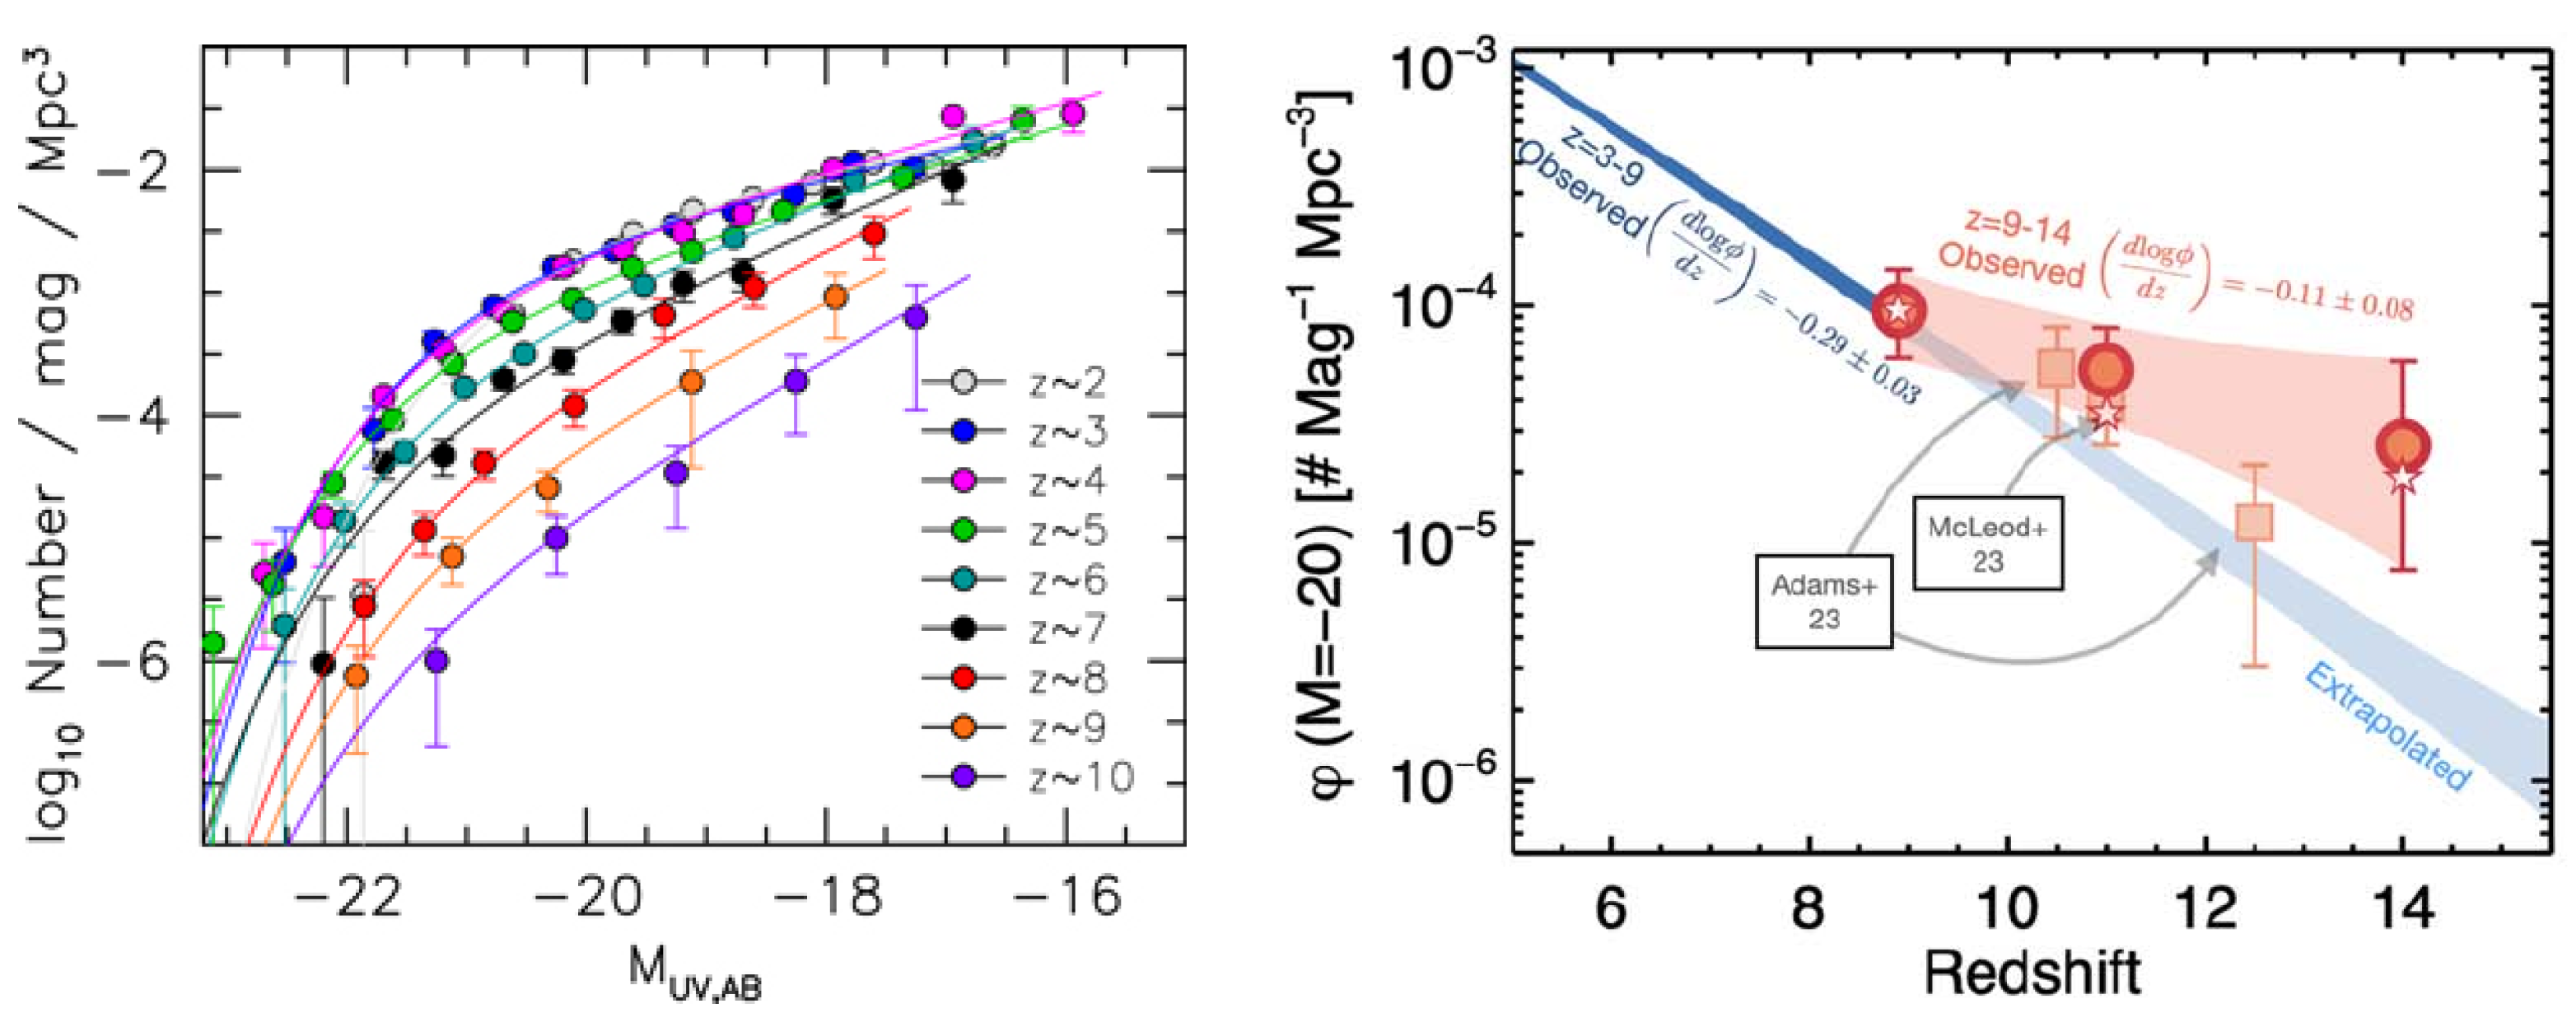
Figure 1. (Left panel): the stepwise ultraviolet LF ϕ ( M U V ) ( z ) in the redshift range z∼2–10 HST color-coded as shown in the legend, with the best-fit Schechter LF in lines colored accordingly to the observational points. Data for z∼10 are from [31]. Adopted from [32]. (Right panel): the number density of the CEERS galaxy sample with M U V = 20 versus redshift is presented by the red circles connected by the light shaded area; small stars correspond to a double power-law LF fit for M U V = 20 . The dark blue region shows the data inferred from a number of surveys in [35], and light blue area is the extrapolated dependence obtained in [35]. The pale red squares from [36,37] used the full CEERS area of 180 arcmin°. Adopted from [38].
Galaxies 13 00064 g001
Figure 3. The efficiency of dust destruction by a compact cluster of SN explosions: the ratio of the specific mass of dust (per one exploded SN) M d destroyed by a collective action of N sn : M d , N sn = M d / N sn , to the mass M d , 1 destroyed by a single isolated SN [112].
Galaxies 13 00064 g003
Figure 4. Outflow terminal velocity versus the specific SFR normalized to its critical value [84]. Cyan band on the left shows the range of sSRF below the Eddington threshold sSFR = sSFR * . Red circles show the data for 12 JADES galaxies from [114]; numbers at curves are the percentage of gas mass involved in the outflow. Adopted from [84].
Galaxies 13 00064 g004
Figure 5. From left to right: the maps of a patchy distribution optical depth τ uv over the front-side hemisphere of the bubble are shown during its evolution. The upper and lower rows illustrate the distribution with and without dust sputtering, respectively. In both cases, pervading patches of reduced extinction are seen. Time stamps indicate the period since the explosion of the first most massive progenitor, M = 40 M . The starburst is exhausted when the least massive stars ( M = 10 M ) explode at t = 15 Myr. At this time, the total transparent area of the shell reaches a maximum, and in the next 10 Myr, the supershell becomes nearly opaque. Without dust sputtering, the supershell remains ‘foggy’ by at least a factor of 2 (the figure is adopted from [72]).
Galaxies 13 00064 g005
Figure 6. (Left panel) presents the fraction of the supershell f τ ( t ) of the front-side hemisphere τ uv lower than a given level τ c r , as shown in the legend, for the model with the IMF truncated at M SN , min = 10 M . It is seen that models with the destroyed dust (solid curves) are more transparent than those in which dust survived sputtering (dashed curves). (Middle panel) shows the model with M SN , min = 8 M . (Right panel): same as the (left panel) ( M SN , min = 10 M ) for the dust with size distribution n ( a ) a 1.5 and a minimal grain radius of a min = 0.003 μ m as in (Figure 6, lower panel in [126]). An obvious difference caused by a flatter dust distribution is its higher transparency—at the very initial stages of evolution, a considerable fraction of the front side of the hemisphere has f τ c r = 1 ( t ) 0.6 . At later times, f τ c r = 1 ( t ) decreases while the SNe dust supply competes with its destruction by shocks at t∼8 Myrs. (Figure is adopted from [72]).
Galaxies 13 00064 g006
Figure 7. Schematic representation of the two scenarios of inflows that initiate feedback-free star formation mode with ϵ * ∼1. On the left, the dense shell compressed by the shock formed under converging radial streams and the wind pressure driven from inside by the stars of the previous generation (shown in red). It fragments further into clouds, which give rise to the next star generation (shown in blue). On the right, the gaseous, slowly rotating disk breaks into massive clouds as soon as the accreting gas brings the Toomre parameter Q below unity. Adopted from [93].
Galaxies 13 00064 g007
Figure 8. Oscillatory star formation history for several toy models of a galaxy started its evolution at z = 25 , the halo mass M h = 10 11 M at z = 5 ; y-axis shows the fraction of baryons converted into stars X * = M * / ( Ω b M h ) . All models are under the momentum-regulated feedback regime, with the SF efficiency ϵ * = 0.015 . (Left panel) presents the dependence of the SF history on the time delays t s n shown in the legend with a fixed momentum transfer factor ϵ p = 5 ; the delay with t s n = 20 Myr corresponds to an instantaneous injection after 20 Myr. (Right panel) illustrates the effects of momentum transfer ϵ p with a fixed delay t s n = 5–30 Myr. Thin solid lines present the quasi-equilibrium model. Adopted from [87].
Galaxies 13 00064 g008
Figure 9. Schematic illustration of dust-to-stellar ratio evolution from the beginning of stellar nucleosynthesis at z > 14 over cosmic time.
Galaxies 13 00064 g009
Figure 10. (Left): the dust-to-stellar mass ratio ζ * in the local universe, z = 0–0.6. Adopted from [148]. (Right): ζ * for several galaxy samples in the range z = 0–7, as shown in the legend: triangles for main sequence and squares for starburst galaxies are from the sample described in [157]. Cyan and orange shaded areas envelop the averaged and standard errors for MS and SB galaxies. The grey shade covers the observed trend of stacking data in [146]. The red star is the median of star-forming ULIRGs in z = 0–0.5. Adopted from [147].
Galaxies 13 00064 g010
Figure 11. The gas cooling function adopted in simulations: black solid line shows the gas cooling function without contribution from dust; dust cooling function is shown by colored lines for dust-size distributions within a = [ a 1 : a 2 ] (the first column in the legend), and the power-law index p (the second column), the dust-to-gas mass ratio is ζ d = 0.02 . (Figure is adopted from [187]).
Galaxies 13 00064 g011
Figure 12. The ratio t s p ( a ) / t c as a function of the ambient gas temperature for a = 0.1 μ m. The ratio is shown for the cooling functions shown in Figure 11; colors and line types are the same as in Figure 11. From [187].
Galaxies 13 00064 g012
Figure 13. The major galaxy merger rate per comoving Mpc−3 versus redshift for three different mass ranges is shown in the legend. Γ M is the galaxy merger rate density. Adopted from [201].
Galaxies 13 00064 g013
Table 1. Fraction of the dust survived sputtering: f d , surv in the left column is for T 0 = 10 8 K; the right in parenthesis shows f d , surv for T 0 = 3 × 10 7 K.
Time0.3 μ m0.1 μ m0.03 μ m0.01 μ m
0.5 t c 0.75 (0.95)0.3 (0.76)0.03 (0.3)… (0.03)
1.0 t c 0.5 (0.8)0.1 (0.55)… (0.06)… (…)
1.5 t c 0.3 (0.75)0.03 (0.1)… (…)… (…)
Disclaimer/Publisher’s Note: The statements, opinions and data contained in all publications are solely those of the individual author(s) and contributor(s) and not of MDPI and/or the editor(s). MDPI and/or the editor(s) disclaim responsibility for any injury to people or property resulting from any ideas, methods, instructions or products referred to in the content.