Abstract
MWC 342 (V1972 Cyg) was discovered nearly 90 years ago as an early-type emission-line star. It was among the first hot stars whose strong infrared excess was detected in the early 1970s. Several mostly short-term photometric and spectroscopic studies resulted in contradictory conclusions about the nature and evolutionary status of MWC 342. It has been classified as a pre-main-sequence Herbig Be star, an evolved suspected binary system, and a long-period variable star. Suggestions on the nature of the secondary component to this B0/B1 primary included a cool M-type giant and an X-ray source. We collected medium- and high-resolution optical spectra of MWC 342 taken in 1994–2024 as well as optical photometric data taken in 1986–2024. Analysis of these data shows strong variations in the object’s brightness and spectral line properties at various time scales, but no strictly periodic phenomena have been found. Inparticular, such a long-term dataset allowed us to reveal the optical brightness variations over a nearly 20-year-long quasi-period, as well as their anti-correlation with the H emission-line strength. Also, we did not confirm the presence of He ii emission lines and absorption lines of the star’s atmosphere that were suspected in previously published studies.
1. Introduction
MWC 342 is an example of a variable star whose nature has been the subject of scientific debate for decades. Initially identified in 1933 through hydrogen emission lines, it attracted attention due to its complex spectral profile, including both permitted and forbidden Fe ii lines [1,2]. Subsequent observations revealed a significant infrared excess [3]. The coexistence of permitted and forbidden lines in its spectrum led to its early classification as a peculiar Be star and its later inclusion in the B[e] class characterized by dense circumstellar gaseous and dusty environments and diverse physical processes [4].
In 1978, MWC 342 was classified as a B3 iii star surrounded by an optically thin gas-and-dust shell [5], suggesting a developed circumstellar envelope capable of producing complex spectral line profiles. However, later studies uncovered additional components that made the interpretation of its properties even more unclear. In 1982, analysis of its spectral energy distribution (SED) in the optical range via spectrophotometry resulted in the suggestion of a cool (M0–type) secondary companion, raising the possibility of a binary system [6].
Efforts to clarify MWC 342’s evolutionary status through multicolor photometry led to its tentative classification as a pre-main-sequence Herbig Ae/Be star [7] (the object’s ID is misspelled in this paper title: MWC 324 instead of MWC 342). However, the absence of a nearby star-forming region and a visible nebulosity made this interpretation less probable. Analysis of the observed properties of MWC 342 and comparison with those of other objects with the B[e] phenomenon from their original list compiled by Allen and Swings [4] led Lamers et al. [8] to conclude that its evolutionary status could not be determined from the existing data and to suggest putting it in a group of unclassified objects with the B[e] phenomenon.
From 1999 onward, high-resolution spectroscopic and photometric data rejected the hypothesis of MWC 342 as a young star [9]. Instead, it was suggested as a binary system with mass transfer, typical of FS CMa objects—intermediate-mass binary systems at various evolutionary stages [10]. More recently, data from the Gaia mission identified the star as a long-period variable candidate [11]. As demonstrated by its research history, the nature and evolutionary status of MWC 342 remain unresolved.
In this study, we present the results of our preliminary analysis of decades-long spectroscopic and photometric observations of MWC 342. Our aim is to analyze variations in its spectrum and brightness, attempt to uncover the physical mechanisms underlying its complex behavior, and refine its evolutionary status. These findings may provide insights into common processes in objects with the B[e] phenomenon.
2. Observations
We collected all optical photometric and spectroscopic data available in the literature and added our own data taken over the last two decades. The previously published spectroscopic data were either relatively low-resolution and/or covered selected spectral regions, typically around emission lines. In particular, the H line equivalent widths which we use in our study were taken from 9 spectra obtained in 1986–1995 [9], 3 spectra obtained in 1987–1990 [12], and 102 spectra obtained in 2004–2010 [13]. For the past 20 years, we took 66 mostly higher-resolution spectra with various instruments which are listed in Table 1.
The published photometric data collected in one place for the first time are shown in Table 2. Additionally, we took photometric data in the Johnson–Cousins bands using a 1 m telescope in the Tien-Shan Astronomical Observatory (TShAO) [14] of the Fesenkov Astrophysical Institute (Kazakhstan) in 2002–2024, the 60 cm telescope of the Maidanak Observatory (Uzbekistan) in 1999–2008 [15], and the 1.25 m telescope of the Crimean Astrophysical Observatory in 2008.

Table 1.
Spectroscopic observations.
Table 1.
Spectroscopic observations.
| Observatory | Dates | Telescope/Spectrograph/Location | R | Range (Å) | # sp. | Ref |
|---|---|---|---|---|---|---|
| Mauna Kea | 2004–2022 | 3.6 m, CFHT, ESPaDoNs, Hawaii | 65,000 | 3800–10,500 | 10 | [16] |
| OAN SPM | 2005–2019 | 2 m, REOSC, Baja California, Mexico | 18,000 | 3700–7300 | 14 | [17] |
| McD | 2005–2012 | 2.7 m, Texas, USA | 60,000 | 3700–10,500 | 2 | [18] |
| Pic du Midi | 2007 | 2 m, NARVAL, France | 65,000 | 3700–10,500 | 1 | [19] |
| Indian Astron. Obs. | 2018–2019 | 2 m, HCT, Hanle, India | 25,000 | 4200–10,500 | 4 | [20] |
| ORLM | 2010–2021 | 1.2 m, HERMES, La Palma, Spain | 85,000 | 3800–9,000 | 30 | [21] |
| Apache Point | 2021–2023 | 3.5 m, ARCES, New Mexico, USA | 31,500 | 3600–10,500 | 2 | [22] |
| TCO | 2023 | 0.81 m, Eshel, North Carolina, USA | 12,000 | 3800–7800 | 2 | [23] |
Notes: R—solving power, # sp.—total number of spectra taken, Ref.—references to descriptions of the spectrographs. Observatory IDs: SPM—Observatorio Astronómico Nacional San Pedro Martir; CFHT—Canada–France–Hawaii Telescope; McD—McDonald Observatory; NARVAL—Bernard Lyot Telescope; ORLM—Observatorio del Roque de Los Muchachos; APO—Apache Point Observatory; TCO—Three College Observatory; HCT—Himalayan Chandra Telescope.

Table 2.
Photometric observations.
Table 2.
Photometric observations.
| Observatory | Dates | Telescope/Location | Filters | # | Ref |
|---|---|---|---|---|---|
| Majdanak | 1984–1999 | 0.6 m, Uzbekistan | 774 | [15] | |
| Assy-Turgen | 1986–1994 | 1.0 m, Kazakhstan | 46 | [7,9] | |
| TShAO | 1995–1999 | 1.0 m, Kazakhstan | 16 | [9] | |
| INTEGRAL | 2002–2008 | , space | V | 28 | [24] |
| Abastumani | 1989–1993 | 1.25 m, Georgia | 48 | [25] | |
| APAS DR10 | 2011 | multiple telescopes | 2 | [26] | |
| ASAS-SN | 2015–2024 | multiple telescopes | 1178 | [27,28] |
Notes: Information in columns 1–3 is the same as in the corresponding columns of Table 1, column 4 shows the filters used, column 5 shows the number of photometric data points obtained, and column 6 shows references to the publications of these data. ⋆—OMM is the Optical Monitoring Mission onboard the INTEGRAL space mission.
3. Results and Discussion
The optical spectrum of MWC 342 contains many emission lines, among which double-peaked lines of the Balmer series with a much stronger red peak are most pronounced. These features were first described by Swings and Struve [2], and later Miroshnichenko and Corporon [9] confirmed their profiles. Based on 102 spectra obtained at the Ondrejov Observatory (Czech Republic) in 2004–2010, variations in the peak shapes, line intensity, and equivalent width (EW) were revealed, especially noticeable in the blue-shifted peak of the H line [13]. These data showed a possible ∼1500-day cycle in the H line violet-to-red peak intensity () variations. However, only two maxima were observed due to the limited period of the monitoring.
The He i and O i lines demonstrate complex dynamics associated with the circumstellar medium, including asymmetric emission wings. These features are typical for objects with the B[e] phenomenon and hot supergiants, where the interaction of the stellar wind and disk plays a key role. There are a few absorption lines present in the spectrum (mostly interstellar ones) that indicate a strong veiling of the photospheric spectrum. The latter is also reflected in the discrepancy between the interstellar and total extinction noticed in [9].
3.1. Variability
The optical brightness variability of MWC 342 has been discussed several times based on monitoring from the 1980s to the 1990s, e.g., [7,9,13,25]. It was found that the object exhibits quasi-periodic behavior with characteristic times from a few weeks to a few months. However, no cycle exhibited long-term stability. More recent data from ASAS SN revealed longer cycles of 632.75 days based on a sample of V-band observations during ∼1400 days with an amplitude of 0.37 mag (The results for ASASSN–V J202303.63+392949.8 are shown at https://asas-sn.osu.edu/variables/1131d03b-0b32-53d7-bebb-daedd95aaeaa (accessed on 14 May 2025). However, the whole collection of the ASAS SN data taken so far does not support this conclusion.
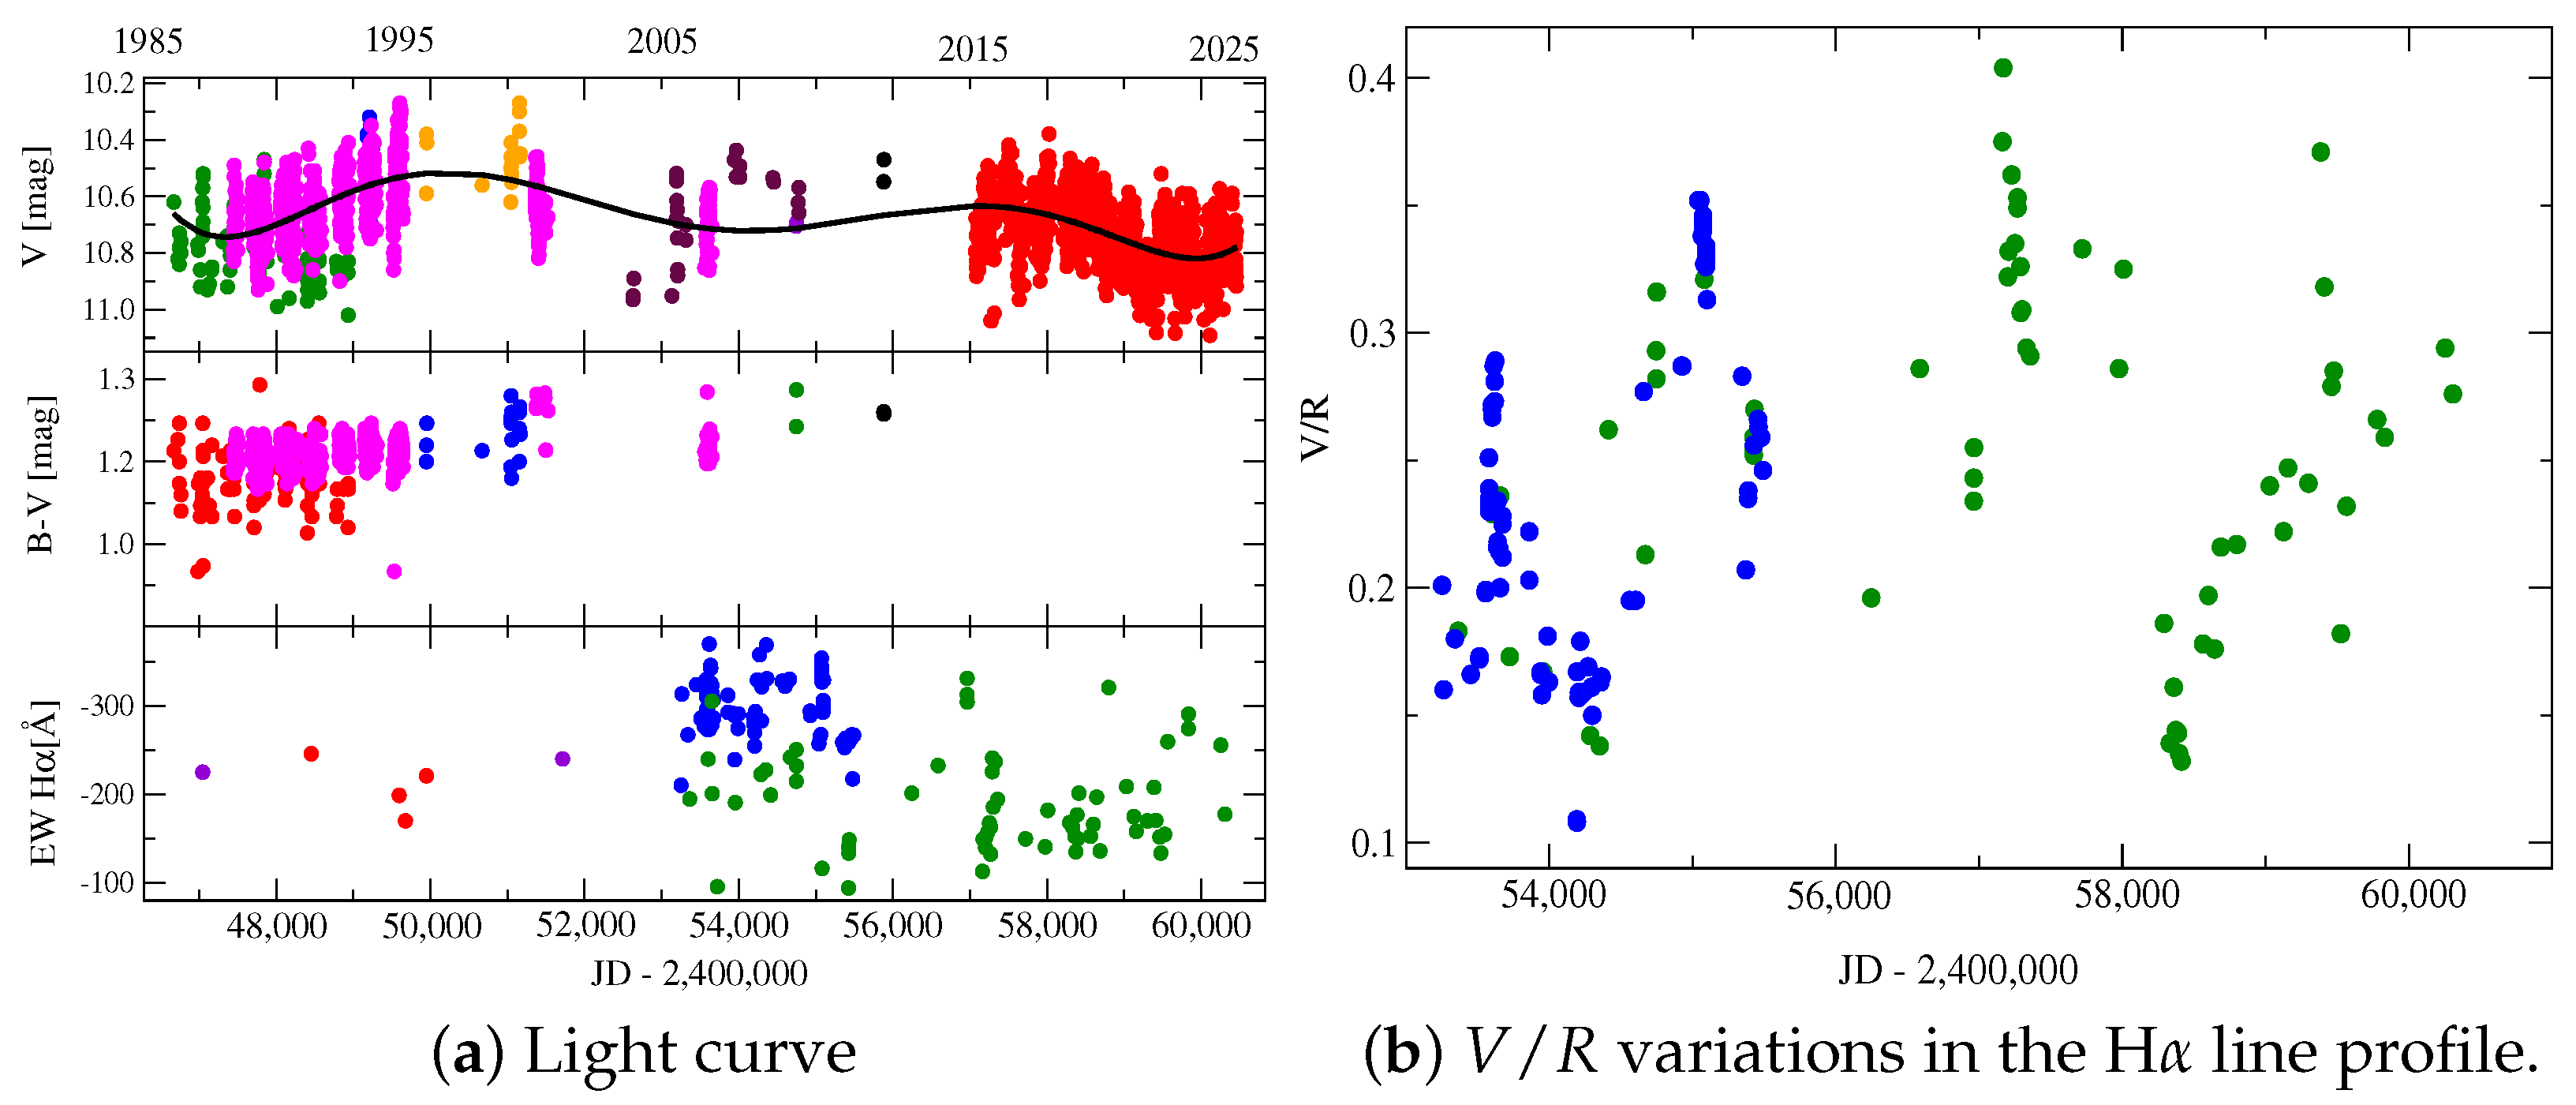
Analysis of our collection of photometric data (see Table 2 for the time coverage and statistics) revealed even a longer cycle of ∼20 years (see the upper left panel of Figure 1). Although the time frame between 2003 and 2015 has a scarce coverage, two local brightness maxima around 1995 and 2017 as well as three minima near 1987, 2007, and 2024 are noticeable. There is also a hint of a gradual fading (minima ∼11 mag near 1987 and ∼11.2 mag near 2024, maxima ∼10.2 mag near 1999 and ∼10.4 mag near 2017), but this may be due to irregular monitoring before 1999. At the same time, the () color-index changed very slightly and showed a modest increase between 1986 and 2015 along with a smaller variation amplitude compared to that in the V-band.
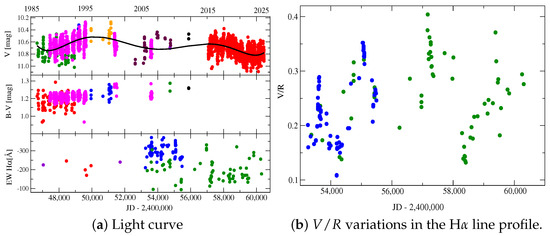
Figure 1.
(a) Light curve of MWC 342 in the V-band (top panel), color-index (middle panel), and the equivalent width of the H line (bottom panel). The symbols represent data taken at different sites: Maidanak Observatory (magenta); TShAO (orange); Assy-Turgen Observatory (green); Abastumani Observatory (blue); CrAO (violet); INTEGRAL (maroon); APAS DR10 (black); and ASAS SN (red). The g-band data from ASAS SN are shifted by 0.48 mag to match the V-band data. The black solid line in the top panel traces the average V-band brightness. The H EW data symbols are taken from the following sources: red [9], blue [13], violet [12], and green—our measurements (see Table 1). (b) temporal variations from [13] (blue symbols) and our data (green symbols).
It is harder to describe the emission-line strength variability, as the observations were sparse before ∼2005. There has been no significant drop in the H line strength for the last 20 years. The visible difference between our data (green points in the bottom left panel of Figure 1) and the measurements from [13] can be explained by the continuum normalization of the spectra, which were noisier in the latter set. Comparison of our H EW measurements with the photometric behavior in the ASAS SN data suggests that the brightness decrease between 2017 and 2024 is accompanied by a H fading, which may be partially due to a fainter continuum. At the same time, the fadings might have been due to an enhanced mass-loss (or transfer) that would make the emission lines stronger.
The H ratio (see right panel of Figure 1) in our data shows similar variations to those found in [13], but it does not follow the 1560-day cycle suspected by these authors. We detected two increases in the ratio near JD 2,457,200 and JD 2,459,500 separated by a longer time (∼2300 days). Comparing this behavior with the V-band light curve indicates that such increases occur when the object is fainter than average. If true, this effect may be due to decreases in the mass-loss rate from the underlying star, as the blue-shifted P Cyg–type absorption component typical of stellar winds becomes weaker, thus leading to larger ratios.
The color-index , whose temporal behavior is shown in the middle panel of Figure 1, shows small variations between 1.1 and 1.3 mag. A slight increase is noticed toward the end of active monitoring around 2010–2015. Using the ASAS SN V- and g-band data taken contemporaneously before this survey completely shifted to taking g-band data only, we found that the average color-index was mag. Translation of this value into using an equation from [29] gives mag. However, if a strong H line which contributes to the V–band brightness is taken into account, the color-index does not seem to exhibit any significant changes compared to the earlier data taken in the Johnson photometric system.
3.2. Extinction, Distance, and Luminosity
Due to uncertainties in the extinction and distance to MWC 342, its luminosity is not as well-known. Bergner et al. [7] estimated the distance to be ∼1 kpc based on the interstellar extinction law found from data for stars projectionally close to the object. Miroshnichenko and Corporon [9] used EWs of the strongest diffuse interstellar bands (DIBs) and estimated the interstellar part of the reddening to be mag. These authors also estimated the circumstellar reddening, due to gasesous and dusty components, to be mag and mag, respectively. Assuming that the ratio of the total to selective visual interstellar extinction is typical for field stars (/E() = 3.1), they derived mag and, using an average visual brightness of mag, found a luminosity of log L/.
This calculation does not take into account the contribution of the circumstellar continuum due to free–free and free–bound transitions. This continuum is obviously present, because the emission-line spectrum is strong and some of the absorption lines are filled with emissions (e.g., H i, He i, Si ii). Removing the circumstellar continuum would make the star’s luminosity lower.
Another uncertainty in the luminosity calculation presents the determination of the visual brightness of the star’s photosphere. Miroshnichenko and Corporon [9] used the averaged V-band brightness measured from the photometric data available at the end of the 20th century ( mag). The 21st century photometry slightly expanded this range, but the average brightness remained unchanged. At the same time, using the average is not strictly correct, because the emission lines and thus the circumstellar continuum are present even at the lowest brightness level.
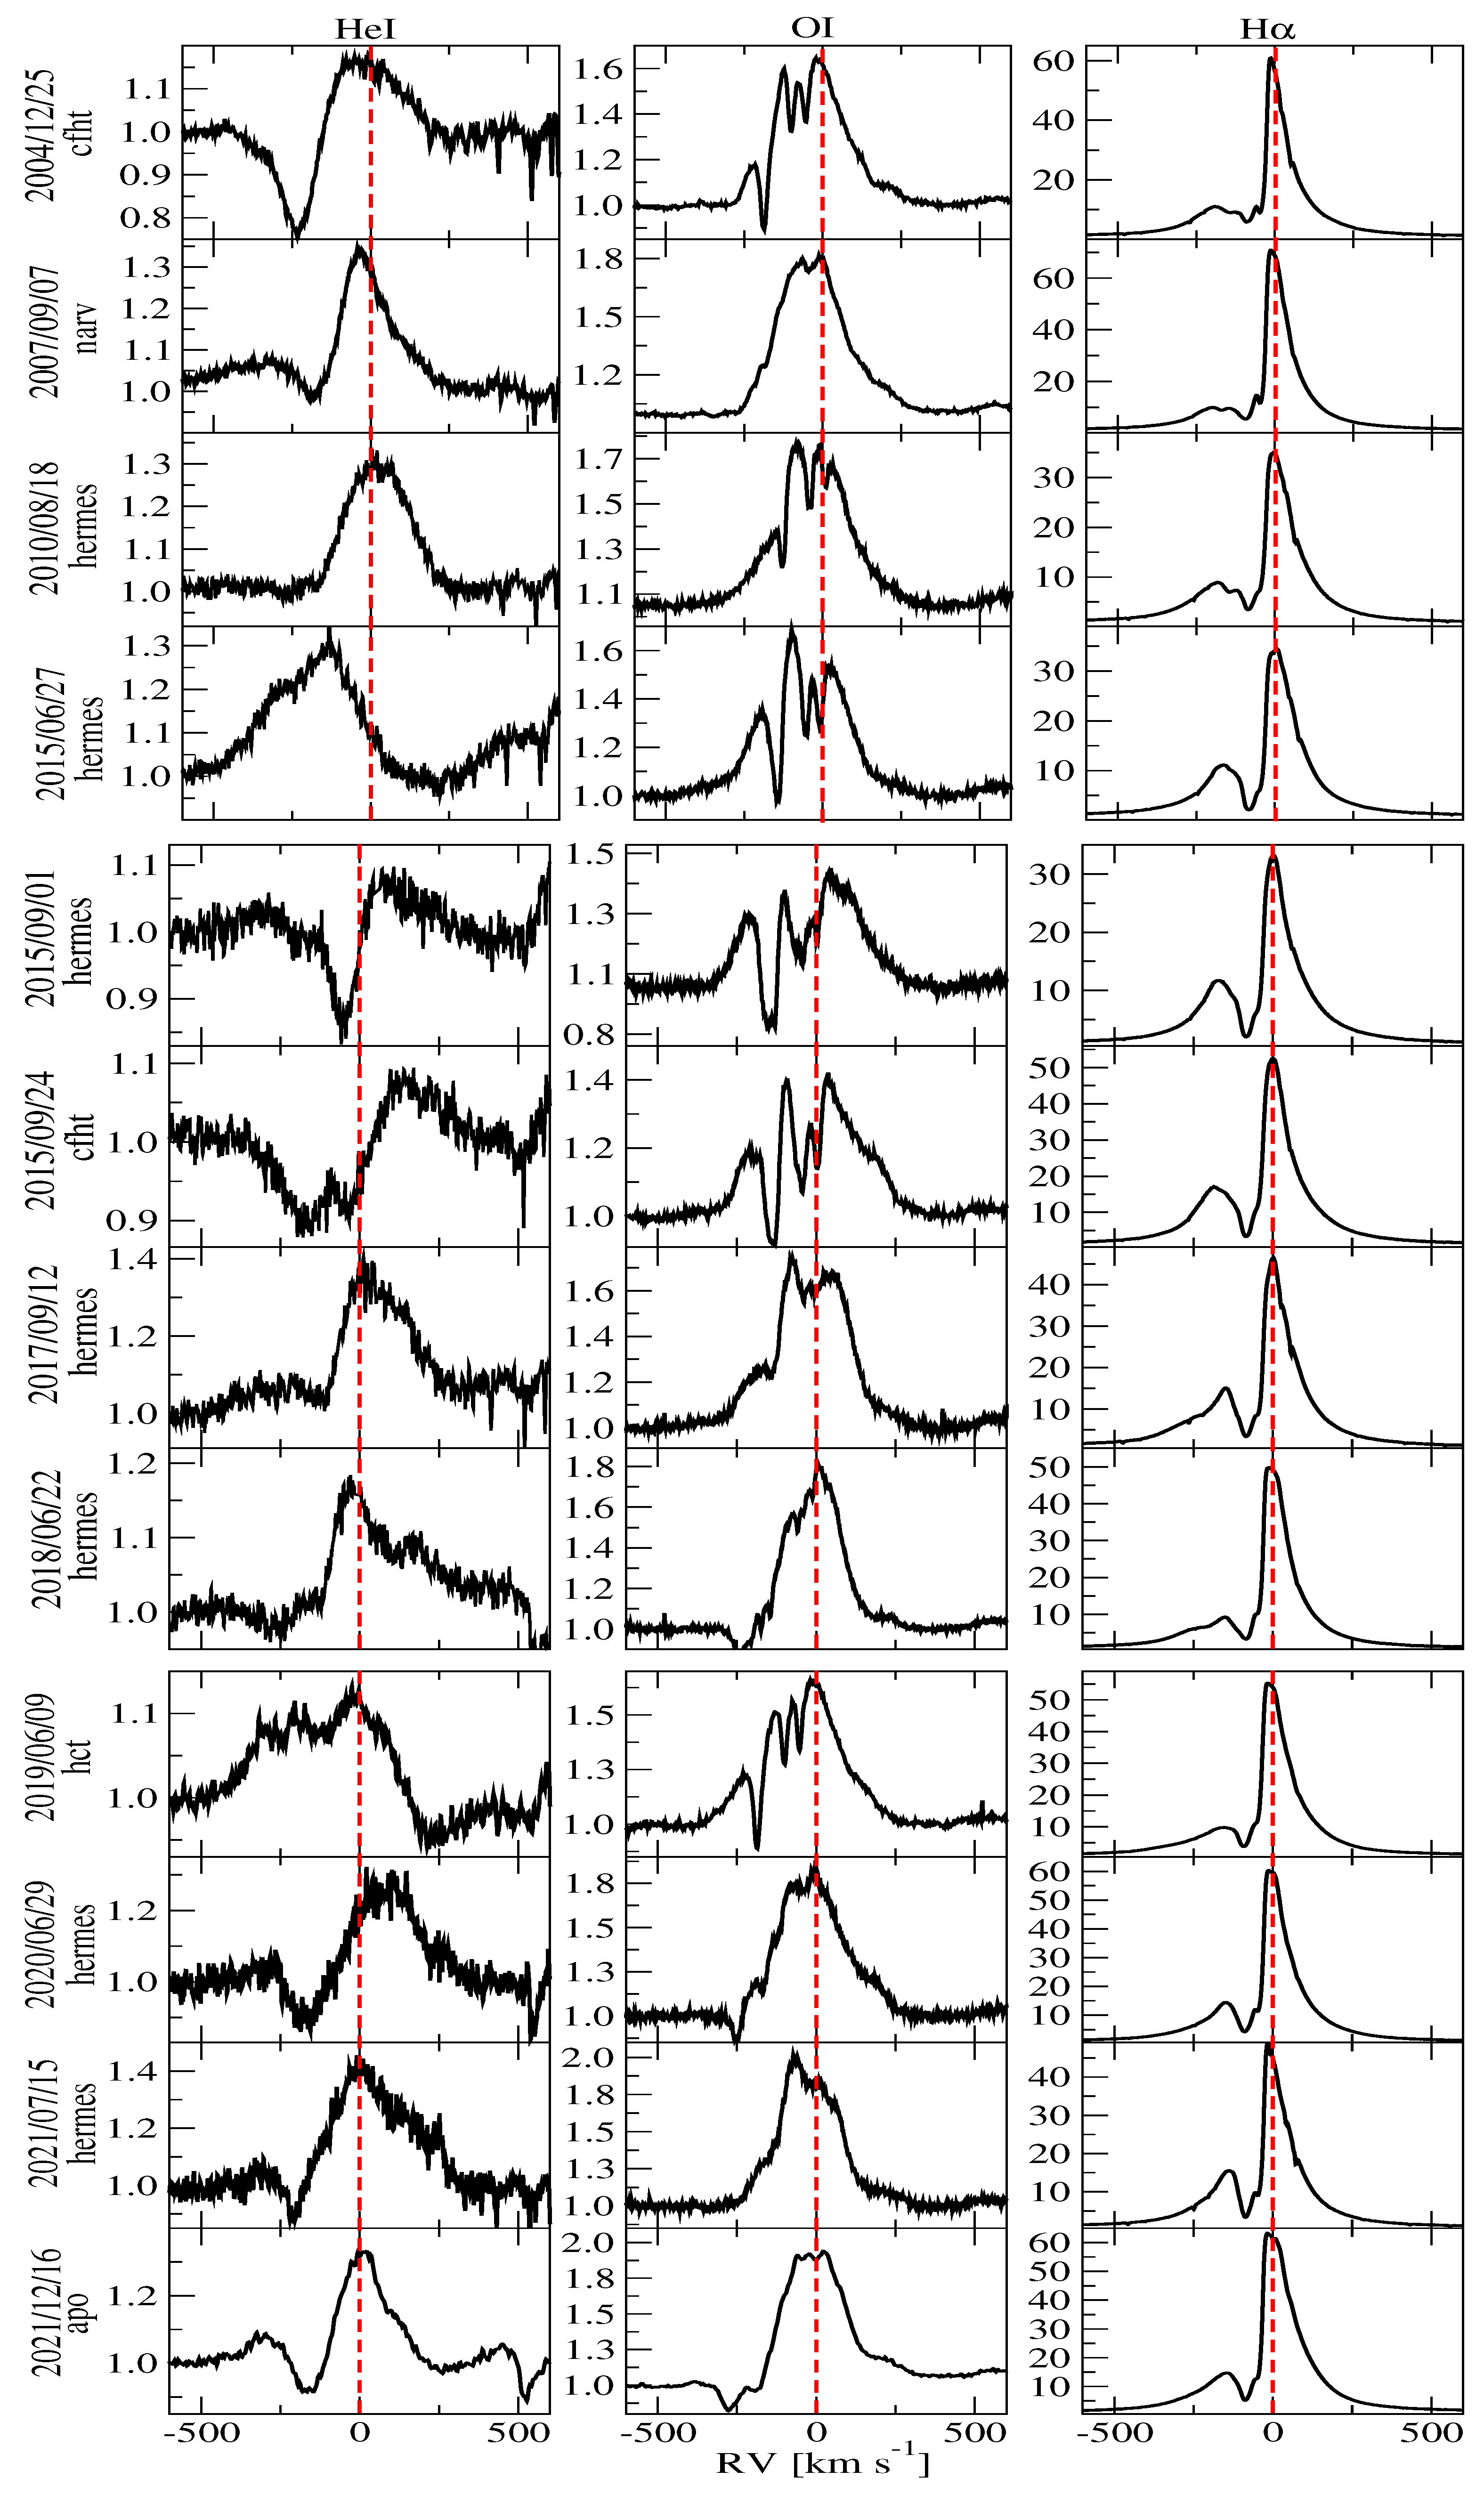
Monnier et al. [30] took interferometric observations of MWC 342 at a wavelength of 10.7 μm with the 10 m Keck telescope and detected an asymmetric structure (a dusty disk), which was barely resolved along the major axis (Full Width at Half Maximum, FWHM, milliarcseconds) and unresolved along the minor axis (FWHM milliarcseconds). This result is consistent with a nearly edge-on view of the circumstellar disk, which may also be responsible for double-peaked profiles with a much weaker blue-shifted peak (see right panels of Figure 1 and Figure 2) and deep central absorption components of high members of the Balmer series, see Figure 3 in [9]. Monnier et al. [30] also used a mid-IR size versus luminosity diagram for young stars to estimate the objects’ luminosity. Although these authors did not quote the distance to MWC 342, their luminosity estimate turned out to be just a little over .
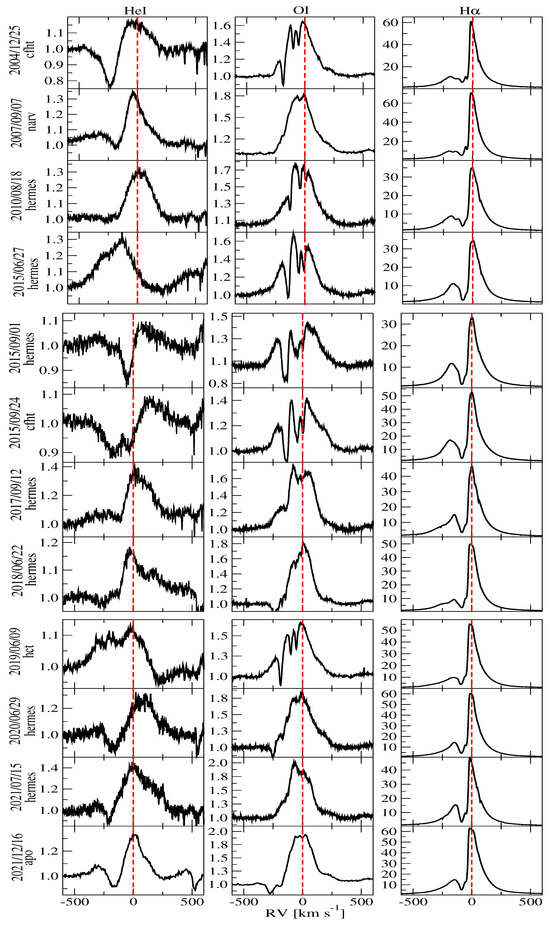
Figure 2.
From left to right: Profiles of the He i (5875 Å), O i (7771/7774/7775 Å), and H (6563 Å) lines. The vertical red dotted lines show the stationary positions of the spectral lines; however, for the oxygen line, the average wavelength of the three lines is given. The horizontal axis shows heliocentric RVs on km , and the vertical axis shows the line intensity in units of the local continuum.
According to Gaia DR3 [31], the distance to MWC 342 is kpc, which is ∼70% larger than the estimate from [9]. Combining our high-resolution CFHT spectra to increase the signal-to-noise ratio in continuum to allowed us to improve the accuracy of the interstellar extinction estimate based on the DIB strengths compared to that obtained in [9]. Using the DIBs at 5780, 5797, and 6614 Å whose EWs were 0.35 Å, 0.14 Å, and 0.17 Å, respectively, and the calibrations from [32,33], we determined an interstellar reddening of E mag. This estimate virtually coincides with that taken from the extinction map by [34] for the Gaia DR3 distance in the direction of MWC 342.
In order to produce a new object’s luminosity estimate, one needs to take into account the circumstellar free–free and bound–free continuum and the fact that even at the lowest optical brightness of mag the emission-line spectrum is still strong. However, the circumstellar continuum contribution should not be very large, as we still see some absorption lines that most likely form in the star’s atmosphere (see Section 3.3). These considerations suggest a rough estimate for the circumstellar contribution to the visual brightness of ∼0.5 mag.
Therefore, with the new consistent data on the distance and interstellar reddening of MWC 342, the photospheric brightness of ∼11.5–12.0 mag, and a total extinction of mag [9], we derive an absolute visual magnitude of mag and (with a bolometric correction of mag for = 20,000 K) a luminosity of log L/. The uncertainty of the luminosity that contains the distance, circumstellar contribution, , and total extinction is rather large. However, it still coincides with the abovementioned estimates within the uncertainty.
A lower limit for the luminosity (log L/) is set by the zero-age main sequence for early B-type stars. It is unlikely that the underlying star is underluminous for its surface temperature. Also, if the star is single, then its fundamental parameters indicate an initial mass of 6–10 unless the adopted circumstellar contribution (both absorption and emission) to the observed brightness is significantly off. It is unusual for a single intermediate-mass star to be surrounded by such a large amount of circumstellar matter if it is not at the pre-main-sequence stage of evolution. However, the absence of a nearby star-forming region mentioned above (see Section 1) and a fast decrease in the IR flux longward of 10 μm [10], which is one of the distinguishing features of FS CMa objects, rule out the early age of the object.
3.3. Spectral Features
Our higher-resolution and higher signal-to-noise spectra compared to those previously published allowed us to refine the description of several observed features in order to obtain a better understanding of the underlying energy source in this system. In particular, Andrillat and Jaschek [35] suspected the presence of absorption lines of O ii at 4649 and 5208 Å and C ii at 5242 Å in their low-resolution spectrum () taken in 1997. We see a hint of an absorption line near 4649 Å in our spectra with a S/N , but it is very weak and may be an artifact of the continuum drawing between Fe ii emission lines in this region. Moreover, no other lines of O ii (Mult. 8) are present. No obvious absorptions were detected near 5208 and 5242 Å.
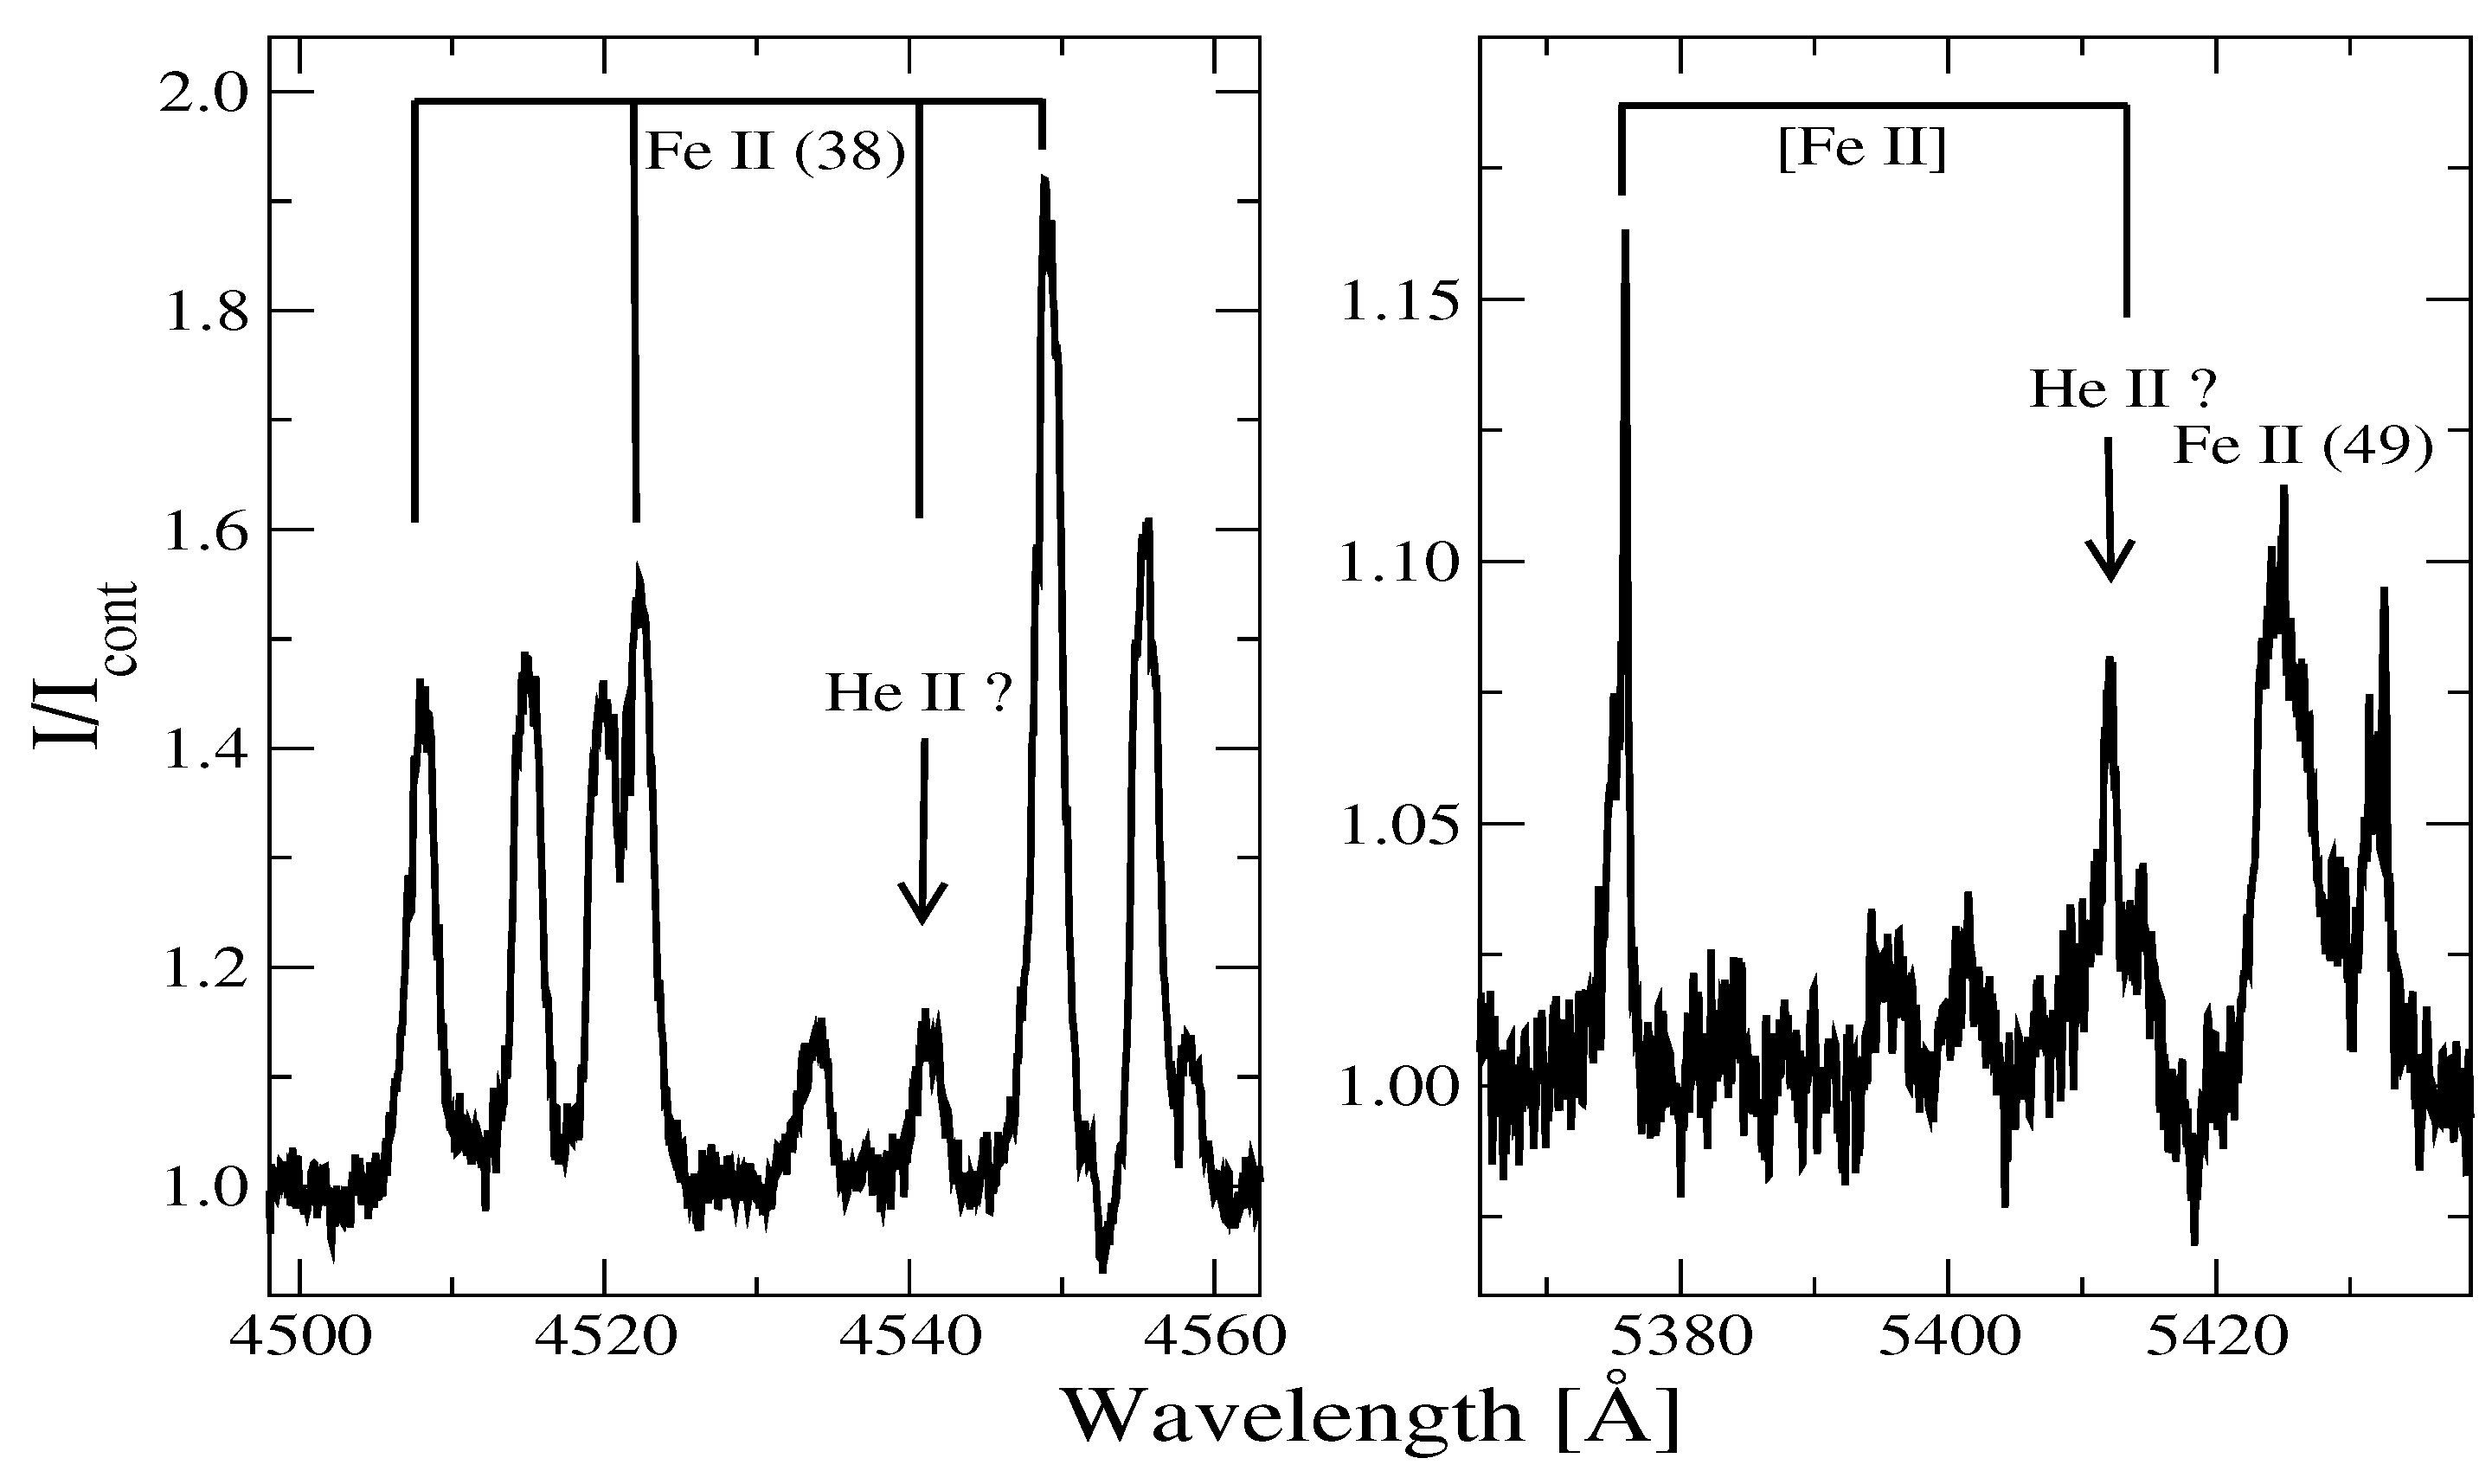
Miroshnichenko and Corporon [9] discussed the possibility of the presence of He ii emission lines at 4541, 4686, and 5411 Å. Figure 4 in their paper shows an emission line at 5412 Å. Neither of our high S/N spectra show any sign of an emission or an absorption line at 4686 Å, while the emission features present near 4541 and 5412 Å can be confidently identified with the Fe ii (Mult. 38) 4541.52 Å and [Fe ii] (Mult. 17) 5412.64 Å lines, respectively (see Figure 3).
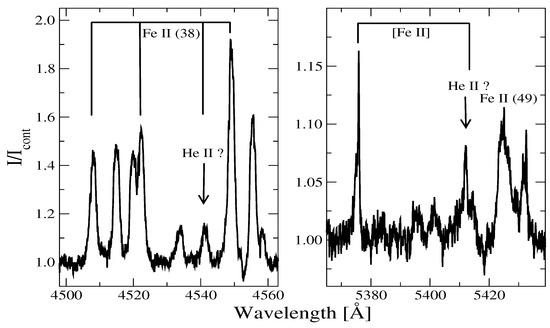
Figure 3.
Parts of the ARCES spectra of MWC 342 around possible locations of the He ii 4541.59 Å (left panel) and 5411.52 Å (right panel). All the lines in the left panel are Fe ii lines of Multiplets 37 and 38. The two narrow emission lines in the right panel are the 5376.47 Å [Fe ii] (Mult. 19F) and the 5412.64 Å [Fe ii] (Mult. 17F) lines.
The He ii 4541.59 Å line is located very close to the Fe ii (Mult. 38) 4541.52 Å line and, in principle, can be considered an identification of the line shown in the left panel of Figure 3. However, the other Fe ii (Mult. 38) lines are obviously present in this spectral part and have similar profiles that makes it more appropriate to identify this line with that of Fe ii (Mult. 38). At the same time, the He ii 5411.52 Å line is shifted by 60 km from the position of the [Fe ii] (Mult. 17F) 5412.64 Å line, which has a similar profile and RV with that of the other [Fe ii] line shown in the right panel of Figure 3. Moreover, both mentioned He ii lines belong to the same Multiplet 2 and should not have such different profiles as those seen in the panels of Figure 3. As a consequence of the absence of He ii lines, the T of the underlying star being higher than K can be ruled out, see ref. [36].
The underlying star’s spectral type was estimated to be B3 iii [5], B0/B1 [9], or B0 [35] from spectroscopy and B8 from optical spectrophotometry, from an SED fitting [6]. The strong emission-line spectrum, which is always present, clearly suggests a hot excitation source. Our spectra show that several He i lines, such as those at 4471 and 4713 Å, are seen in pure absorption most of the time, while those at 5876, 6678, and 7065 Å exhibit either P Cyg-type or purely emission profiles (see the left panel of Figure 2). Along with the presence of strong emission lines of O i (7772–7775 Å, see central panel of Figure 2), Si ii (5979, 6347, and 6371 Å), and the hydrogen lines of the Paschen series, see Figure 1 in [35], this behavior is consistent with an underlying early B-type star.
The emission line profile variations are very strong in both shape and position. This is especially noticeable for the He i 5875 Å line (left panel of Figure 2) and the near-IR oxygen triplet (central panel of Figure 2). Although no regular component has been clearly found in the variations, they seem to be indicative of fast active changes of the circumstellar gas distribution near the star.
4. Conclusions
We collected and preliminarily analyzed optical spectroscopic and photometric variations of the emission-line star MWC 342 which does not have a well-understood evolutionary status. The variations in the profiles and positions of spectral lines of MWC 342 were not found to exhibit strictly periodic behavior (Figure 2). Similarly, the photometric data analysis reveals the absence of long-term periodic variability. Instead, quasi-periodic changes are observed, most likely linked to fluctuations in the optical depth of the circumstellar envelope. In addition to the various possible periods found in the literature (from a few weeks to a few months), we found a nearly 20-year-long quasi-period in the optical brightness of the object. We also found signs of an anti-correlation between the optical brightness and the EW of the H line that suggests that the latter is partly due to the variations in the underlying continuum.
Using higher-resolution and higher S/N spectra than those published previously, we did not confirm the presence of He ii emission lines in the spectrum of MWC 342 that were suspected in [9]. Also, we used a Gaia DR3 distance and a new estimate of the interstellar reddening based on the extinction map from [34] and a new evaluation of the circumstellar contribution to the object’s brightness to derive a new estimate of the object’s luminosity (log L/). It turned out to coincide with the previously published ones, log L/ [9,30]. However, the luminosity uncertainty is still rather large (of the order of 0.4 dex) and requires a careful modeling of this complicated system.
The findings underscore the importance of continued multi-wavelength observations of MWC 342, particularly in the IR region, to gain deeper insights into the processes occurring in its circumstellar environment. Special attention should be devoted to tracking temporal variability to refine the understanding of the envelope’s dynamic structure. Since the photometric variations are large at a variety of time scales, it would be important to organize a contemporaneous photometric (especially multicolor) and high-resolution spectroscopic campaign in order to more closely study variations in the brightness and spectral features. The most helpful would be weekly monitoring for a few years. Currently, the ASAS SN survey frequently provides one-band brightness data, but the addition of spectroscopic coverage is crucial for further understanding of the object’s nature.
Thus, MWC 342 remains a fascinating and intricate object, offering valuable opportunities to study the interaction between a star and its circumstellar environment as well as the evolutionary pathways of stars exhibiting the B[e] phenomenon. It is one of the most active objects with the B[e] phenomenon from the FS CMa group. Other very active group objects are the group prototype, FS CMa (HD 45677), and HD 50138, both of which we are actively investigating and will be presenting long-term studies on in the nearest future. A review of recent results on the FS CMa group objects can be found in [37].
Author Contributions
Observations, A.S.M., S.V.Z., S.D.C., N.M., H.V.W., A.R., K.N.G., I.V.R., R.I.K. and C.T.O.; data reduction, A.S.M., S.V.Z., N.M. and H.V.W.; data analysis, A.Z.A., A.S.M. and S.A.K.; software, A.Z.A., A.S.M., S.V.Z., N.M. and A.T.A.; writing—original draft preparation, A.Z.A. and A.S.M.; writing—review and editing, A.Z.A., A.S.M., S.V.Z., H.V.W., S.A.K. and N.L.V. All authors have read and agreed to the published version of the manuscript.
Funding
This research was funded by the Science Committee of the Ministry of Science and Higher Education of the Republic of Kazakhstan (Grant No. AP23484898). The work was carried out within the frameworks of Project No. BR24992759, “Development of the concept for the first Kazakhstani orbital cislunar telescope - Phase I”, financed by the Ministry of Science and Higher Education of the Republic of Kazakhstan, and Project No. BR24992807, “Development of Kazakhstan digital environment for astronomical research of near and deep space objects within the international virtual observatory network”, financed by the Ministry of Science and Higher Education of the Republic of Kazakhstan). S.V.Z. acknowledges the PAPIIT grants IN102120 and IN119323.
Data Availability Statement
The TCO spectra and unpublished photometric data are available on request via email to a_mirosh@uncg.edu. The HERMES spectra are available on request via email to Hans.VanWinckel@kuleuven.be.
Acknowledgments
This research has made use of the SIMBAD database, operated at CDS, Strasbourg, France; and the SAO/NASA ADS, ASAS, and Gaia data products. This paper is partly based on observations obtained with the 2.1 m telescope of the Observatorio Astronómico Nacional San Pedro Martir (Baja California, Mexico); the 2.1 m Otto Struve Telescope and the 2.7 m Harlan J. Smith telescope at the McDonald Observatory (Texas, USA); the Canada–France–Hawaii Telescope (CFHT), which is operated by the National Research Council of Canada, the Institut National des Sciences de l’Univers of the Centre National de la Recherche Scientifique de France, and the University of Hawaii; the Mercator Telescope, operated on the island of La Palma by the Flemish Community at the Spanish Observatorio del Roque de los Muchachos of the Instituto de Astrofísica de Canarias; the 2 m Chandra Himalayan Telescope (Hanle, India); and the 0.81 m telescope of Three College Observatory (North Carolina, USA). A.M. acknowledges technical support from Dan Gray (Sidereal Technology company), Joshua Haislip (University of North Carolina Chapel Hill), and Mike Shelton (University of North Carolina Greensboro), as well as funding from the UNCG College of Arts and Sciences and Department of Physics and Astronomy.
Conflicts of Interest
The authors declare no conflicts of interest.
Abbreviations
The following abbreviations are used in this manuscript: RV—radial velocity, R—spectral resolving power, SED—spectral energy distribution.
References
- Merrill, P.W.; Burwell, C.G. Catalogue and Bibliography of Stars of Classes B and A whose Spectra have Bright Hydrogen Lines. Astrophys. J. 1933, 78, 87. [Google Scholar] [CrossRef]
- Swings, V.P.; Struve, O. Spectrographic Observations of Peculiar Stars. Astrophys. J. 1943, 97, 194. [Google Scholar] [CrossRef][Green Version]
- Geisel, S.L. Infrared Excesses, Low-Excitation Emission Lines, and Mass Loss. Astrophys. J. 1970, 161, L105. [Google Scholar] [CrossRef]
- Allen, D.A.; Swings, J.P. The spectra of peculiar Be star with infrared excesses. Astron. Astrophys. 1976, 47, 293–302. [Google Scholar]
- Brosch, N.; Leibowitz, E.M.; Spector, N. The emission-line spectrum of MWC 342 in 1974 - 1975. Astron. Astrophys. 1978, 65, 259–263. [Google Scholar]
- Arkhipova, V.P.; Ipatov, A.P. Spectrophotometry of three peculiar emission-line stars. Sov. Astron. Lett. 1982, 8, 298–302. [Google Scholar]
- Bergner, Y.K.; Miroshnichenko, A.S.; Sudnik, I.S.; Yudin, R.V.; Yutanov, N.Y.; Krivtsov, A.A.; Sokolov, A.N.; Kuratov, K.S.; Mukanov, D.V. MWC:324—A Young Star. Astrophysics 1990, 32, 109. [Google Scholar] [CrossRef]
- Lamers, H.J.G.L.M.; Zickgraf, F.J.; de Winter, D.; Houziaux, L.; Zorec, J. An improved classification of B[e]-type stars. Astron. Astrophys. 1998, 340, 117–128. [Google Scholar]
- Miroshnichenko, A.; Corporon, P. Revealing the nature of the B[e] star MWC 342. Astron. Astrophys. 1999, 349, 126–134. [Google Scholar]
- Miroshnichenko, A.S. Toward Understanding the B[e] Phenomenon. I. Definition of the Galactic FS CMa Stars. Astrophys. J. 2007, 667, 497–504. [Google Scholar] [CrossRef]
- Lebzelter, T.; Mowlavi, N.; Lecoeur-Taibi, I.; Trabucchi, M.; Audard, M.; García-Lario, P.; Gavras, P.; Holl, B.; Jevardat de Fombelle, G.; Nienartowicz, K.; et al. Gaia Data Release 3. The second Gaia catalogue of long-period variable candidates. Astron. Astrophys. 2023, 674, A15. [Google Scholar] [CrossRef]
- Zickgraf, F.J. Kinematical structure of the circumstellar environments of galactic B[e] -type stars. Astron. Astrophys. 2003, 408, 257–285. [Google Scholar] [CrossRef]
- Kučerová, B.; Korčáková, D.; Polster, J.; Wolf, M.; Votruba, V.; Kubát, J.; Škoda, P.; Šlechta, M.; Křížek, M. Time-dependent spectral-feature variations of stars displaying the B[e] phenomenon. II. MWC 342. Astron. Astrophys. 2013, 554, A143. [Google Scholar] [CrossRef]
- Bergner, Y.K.; Miroshnichenko, A.S.; Yudin, R.V.; Kuratov, K.S.; Mukanov, D.B.; Shejkina, T.A. Observations of emission-line stars with IR excesses. II. Multicolor photometry of B[e] stars. Astron. Astrophys. Suppl. Ser. 1995, 112, 221. [Google Scholar]
- Herbst, W.; Shevchenko, V.S. A Photometric Catalog of Herbig AE/BE Stars and Discussion of the Nature and Cause of the Variations of UX Orionis Stars. Astron. J. 1999, 118, 1043–1060. [Google Scholar] [CrossRef]
- Manset, N.; Donati, J.F. ESPaDOnS: An exhelle spectro-polarimetric device for the observation of stars. In Polarimetry in Astronomy; Fineschi, S., Ed.; Society of Photo-Optical Instrumentation Engineers (SPIE) Conference Series; SPIE: Bellingham, WA, USA, 2003; Volume 4843, pp. 425–436. [Google Scholar] [CrossRef]
- Contarini, G.; Gratton, R. The Instrumental Profile and Straylight in the REOSC Ekar Echelle Spectrograph. In Proceedings of the European Southern Observatory Conference and Workshop Proceedings, Garching, Germany, 27–30 April 1992; European Southern Observatory Conference and Workshop Proceedings. Volume 42, p. 737. [Google Scholar]
- Tull, R.G.; MacQueen, P.J.; Sneden, C.; Lambert, D.L. The High-Resolution Cross-Dispersed Echelle White Pupil Spectrometer of the McDonald Observatory 2.7-m Telescope. Publ. Astron. Soc. Pac. 1995, 107, 251. [Google Scholar] [CrossRef]
- Aurière, M. Stellar Polarimetry with NARVAL. In EAS Publications Series; Arnaud, J., Meunier, N., Eds.; EAS Publications: Les Ulis Cedex A, France, 2003; Volume 9, p. 105. [Google Scholar]
- Sriram, S.; Kumar, A.; Surya, A.; Sivarani, T.; Giridhar, S.; Kathiravan, S.; Anand, M.N.; Jones, D.; Grobler, D.; Jakobsson, R.; et al. Hanle echelle spectrograph: Design and performance. In Ground-Based and Airborne Instrumentation for Astronomy VII; Evans, C.J., Simard, L., Takami, H., Eds.; Society of Photo-Optical Instrumentation Engineers (SPIE) Conference Series; SPIE: Bellingham, WA, USA, 2018; Volume 10702, p. 107026K. [Google Scholar] [CrossRef]
- Raskin, G.; van Winckel, H.; Hensberge, H.; Jorissen, A.; Lehmann, H.; Waelkens, C.; Avila, G.; de Cuyper, J.P.; Degroote, P.; Dubosson, R.; et al. HERMES: A high-resolution fibre-fed spectrograph for the Mercator telescope. Astron. Astrophys. 2011, 526, A69. [Google Scholar] [CrossRef]
- Wang, S.i.; Hildebrand, R.H.; Hobbs, L.M.; Heimsath, S.J.; Kelderhouse, G.; Loewenstein, R.F.; Lucero, S.; Rockosi, C.M.; Sandford, D.; Sundwall, J.L.; et al. ARCES: An echelle spectrograph for the Astrophysical Research Consortium (ARC) 3.5m telescope. In Instrument Design and Performance for Optical/Infrared Ground-Based Telescopes; Society of Photo-Optical Instrumentation Engineers (SPIE) Conference Series; Iye, M., Moorwood, A.F.M., Eds.; SPIE: Bellingham, WA, USA, 2003; Volume 4841, pp. 1145–1156. [Google Scholar] [CrossRef]
- Miroshnichenko, A.S.; Danford, S.; Andronov, I.L.; Aarnio, A.N.; Lauer, D.; Buroughs, H. Refining Orbits of Bright Binary Systems. Galaxies 2023, 11, 8. [Google Scholar] [CrossRef]
- Alfonso-Garzón, J.; Domingo, A.; Mas-Hesse, J.M.; Giménez, A. The first INTEGRAL-OMC catalogue of optically variable sources. Astron. Astrophys. 2012, 548, A79. [Google Scholar] [CrossRef]
- Chkhikvadze, J.N.; Kakhiani, V.O.; Djaniashvili, E.B. Results of Photoelectric Observations of MWC 342. Astrophysics 2002, 45, 8–14. [Google Scholar] [CrossRef]
- Henden, A.A. APASS DR10 Has Arrived! (Abstract). J. Am. Assoc. Var. Star Obs. 2019, 47, 130. [Google Scholar]
- Kochanek, C.S.; Shappee, B.J.; Stanek, K.Z.; Holoien, T.W.S.; Thompson, T.A.; Prieto, J.L.; Dong, S.; Shields, J.V.; Will, D.; Britt, C.; et al. The All-Sky Automated Survey for Supernovae (ASAS-SN) Light Curve Server v1.0. Publ. Astron. Soc. Pac. 2017, 129, 104502. [Google Scholar] [CrossRef]
- Hart, K.; Shappee, B.J.; Hey, D.; Kochanek, C.S.; Stanek, K.Z.; Lim, L.; Dobbs, S.; Tucker, M.; Jayasinghe, T.; Beacom, J.F.; et al. ASAS-SN Sky Patrol V2.0. arXiv 2023, arXiv:2304.03791. [Google Scholar] [CrossRef]
- Fukugita, M.; Ichikawa, T.; Gunn, J.E.; Doi, M.; Shimasaku, K.; Schneider, D.P. The Sloan Digital Sky Survey Photometric System. Astron. J. 1996, 111, 1748. [Google Scholar] [CrossRef]
- Monnier, J.D.; Berger, J.P.; Millan-Gabet, R.; Traub, W.A.; Schloerb, F.P.; Pedretti, E.; Benisty, M.; Carleton, N.P.; Haguenauer, P.; Kern, P.; et al. Few Skewed Disks Found in First Closure-Phase Survey of Herbig Ae/Be Stars. Astrophys. J. 2006, 647, 444–463. [Google Scholar] [CrossRef]
- Bailer-Jones, C.A.L.; Rybizki, J.; Fouesneau, M.; Demleitner, M.; Andrae, R. Estimating Distances from Parallaxes. V. Geometric and Photogeometric Distances to 1.47 Billion Stars in Gaia Early Data Release 3. Astron. J. 2021, 161, 147. [Google Scholar] [CrossRef]
- Herbig, G.H. The Diffuse Interstellar Bands. IX. Constraints on the Identification. Astrophys. J. 1993, 407, 142. [Google Scholar] [CrossRef]
- Kos, J.; Zwitter, T. Properties of Diffuse Interstellar Bands at Different Physical Conditions of the Interstellar Medium. Astrophys. J. 2013, 774, 72. [Google Scholar] [CrossRef]
- Green, G.M.; Schlafly, E.; Zucker, C.; Speagle, J.S.; Finkbeiner, D. A 3D Dust Map Based on Gaia, Pan-STARRS 1, and 2MASS. Astrophys. J. 2019, 887, 93. [Google Scholar] [CrossRef]
- Andrillat, Y.; Jaschek, C. B[e] stars. VIII. MWC 342. Astron. Astrophys. Suppl. Ser. 1999, 136, 59–63. [Google Scholar] [CrossRef]
- Schmutz, W.; Leitherer, C.; Hubeny, I.; Vogel, M.; Hamann, W.R.; Wessolowski, U. Non–LTE Analysis of the Ofpe/WN9 Star HDE 269227 (R84). Astrophys. J. 1991, 372, 664. [Google Scholar] [CrossRef]
- Miroshnichenko, A.S.; Zharikov, S.V.; Manset, N.; Khokhlov, S.A.; Nodyarov, A.S.; Klochkova, V.G.; Danford, S.; Kuratova, A.K.; Mennickent, R.; Chojnowski, S.D.; et al. Recent Progress in Finding Binary Systems with the B[e] Phenomenon. Galaxies 2023, 11, 36. [Google Scholar] [CrossRef]
Disclaimer/Publisher’s Note: The statements, opinions and data contained in all publications are solely those of the individual author(s) and contributor(s) and not of MDPI and/or the editor(s). MDPI and/or the editor(s) disclaim responsibility for any injury to people or property resulting from any ideas, methods, instructions or products referred to in the content. |
© 2025 by the authors. Licensee MDPI, Basel, Switzerland. This article is an open access article distributed under the terms and conditions of the Creative Commons Attribution (CC BY) license (https://creativecommons.org/licenses/by/4.0/).

