
The Relationship between Oral Health-Related Quality of Life and Body Mass Index in an Older Population from Southern Italy: The Salus in Apulia Study

 ,
,  , , ,
, , ,  ,
,  and
and 
Abstract
:1. Introduction
2. Materials and Methods
2.1. Study Sample and Design
2.2. Assessment of the Oral Health-Related Quality of Life (OHRQoL)
2.3. Dietary, Laboratory, and Clinical Assessment
2.4. Statistical Analysis
3. Results
3.1. Descriptive Analysis
3.2. Logistic Regression Analyses
3.3. Random Forest Regression Model
4. Discussion
5. Conclusions
Author Contributions
Funding
Institutional Review Board Statement
Informed Consent Statement
Data Availability Statement
Acknowledgments
Conflicts of Interest
References
- World Health Organization. 2020. Available online: https://www.who.int/news-room/fact-sheets/detail/oral-health (accessed on 27 June 2023).
- Azarpazhooh, A.; Leake, J.L. Systematic Review of the Association Between Respiratory Diseases and Oral Health. J. Periodontol. 2006, 77, 1465–1482. [Google Scholar] [CrossRef] [PubMed]
- Kudiyirickal, M.G.; Pappachan, J.M. Diabetes mellitus and oral health. Endocrine 2015, 49, 27–34. [Google Scholar] [CrossRef] [PubMed]
- Holmlund, A.; Lampa, E.; Lind, L. Oral health and cardiovascular disease risk in a cohort of periodontitis patients. Atherosclerosis 2017, 262, 101–106. [Google Scholar] [CrossRef] [PubMed]
- Michaud, D.S.; Fu, Z.; Shi, J.; Chung, M. Periodontal Disease, Tooth Loss, and Cancer Risk. Epidemiol. Rev. 2017, 39, 49–58. [Google Scholar] [CrossRef]
- Kossioni, A.E.; Hajto-Bryk, J.; Janssens, B.; Maggi, S.; Marchini, L.; McKenna, G.; Müller, F.; Petrovic, M.; Roller-Wirnsberger, R.E.; Schimmel, M.; et al. Practical Guidelines for Physicians in Promoting Oral Health in Frail Older Adults. J. Am. Med. Dir. Assoc. 2018, 19, 1039–1046. [Google Scholar] [CrossRef]
- Sheiham, A.; Steele, J.; Marcenes, W.; Finch, S.; Walls, A. The impact of oral health on stated ability to eat certain foods; Findings from the National Diet and Nutrition Survey of Older People in Great Britain. Gerodontology 1999, 16, 11–20. [Google Scholar] [CrossRef]
- Flood, K.L.; Carr, D.B. Nutrition in the elderly. Curr. Opin. Gastroenterol. 2004, 20, 125–129. [Google Scholar] [CrossRef]
- Tôrres, L.H.D.N.; De Marchi, R.J.; Hilgert, J.B.; Hugo, F.N.; Ismail, A.I.; Antunes, J.L.F.; Sousa, M.D.L.R.D. Oral health and Obesity in Brazilian elders: A longitudinal study. Community Dent. Oral Epidemiol. 2020, 48, 540–548. [Google Scholar] [CrossRef]
- Dibello, V.; Zupo, R.; Sardone, R.; Lozupone, M.; Castellana, F.; Dibello, A.; Daniele, A.; De Pergola, G.; Bortone, I.; Lampignano, L.; et al. Oral frailty and its determinants in older age: A systematic review. Lancet Healthy Longev. 2021, 2, e507–e520. [Google Scholar] [CrossRef]
- Dibello, V.; Lozupone, M.; Manfredini, D.; Dibello, A.; Zupo, R.; Sardone, R.; Daniele, A.; Lobbezoo, F.; Panza, F. Oral frailty and neurodegeneration in Alzheimer’s disease. Neural Regen. Res. 2021, 16, 2149–2153. [Google Scholar] [CrossRef]
- E Gerritsen, A.; Allen, P.F.; Witter, D.J.; Bronkhorst, E.M.; Creugers, N.H. Tooth loss and oral health-related quality of life: A systematic review and meta-analysis. Health Qual. Life Outcomes 2010, 8, 126. [Google Scholar] [CrossRef] [PubMed]
- Slade, G.D. Oral health-related quality of life is important for patients, but what about populations? Community Dent. Oral Epidemiol. 2012, 40, 39–43. [Google Scholar] [CrossRef] [PubMed]
- Adamo, D.; Pecoraro, G.; Fortuna, G.; Amato, M.; Marenzi, G.; Aria, M.; Mignogna, M.D. Assessment of oral health-related quality of life, measured by OHIP-14 and GOHAI, and psychological profiling in burning mouth syndrome: A case-control clinical study. J. Oral Rehabil. 2020, 47, 42–52. [Google Scholar] [CrossRef] [PubMed]
- Slade, G.D.; Spencer, A.J. Development and evaluation of the Oral Health Impact Profile. Community Dent Health 1994, 11, 3–11. [Google Scholar]
- Slade, G.D. Derivation and validation of a short-form oral health impact profile. Community Dent. Oral Epidemiol. 1997, 25, 284–290. [Google Scholar] [CrossRef]
- Rosli, T.I.; Chan, Y.M.; Kadir, R.A.; Hamid, T.A.A. Association between oral health-related quality of life and nutritional status among older adults in district of Kuala Pilah, Malaysia. BMC Public Health 2019, 19, 547. [Google Scholar] [CrossRef]
- Lozupone, M.; Panza, F.; Piccininni, M.; Copetti, M.; Sardone, R.; Imbimbo, B.P.; Stella, E.; D’urso, F.; Barulli, M.R.; Battista, P.; et al. Social Dysfunction in Older Age and Relationships with Cognition, Depression, and Apathy: The GreatAGE Study. J. Alzheimer’s Dis. 2018, 65, 989–1000. [Google Scholar] [CrossRef]
- Sardone, R.; Lampignano, L.; Guerra, V.; Zupo, R.; Donghia, R.; Castellana, F.; Battista, P.; Bortone, I.; Procino, F.; Castellana, M.; et al. Relationship between Inflammatory Food Consumption and Age-Related Hearing Loss in a Prospective Observational Cohort: Results from the Salus in Apulia Study. Nutrients 2020, 12, 426. [Google Scholar] [CrossRef]
- Corridore, D.; Campus, G.; Guerra, F.; Ripari, F.; Sale, S.; Ottolenghi, L. Validation of the Italian version of the Oral Health Impact Profile-14 (IOHIP-14). Ann. Stomatol. 2013, 4, 239–243. [Google Scholar]
- Locker, D.; Slade, G. Oral Health and quality of life among older adults: The Oral Health Impact Profile. J. Can. Dent. Assoc. 1993, 59, 830–833. [Google Scholar]
- Locker, D. Measuring oral health: A conceptual framework. Community Dent. Health 1988, 5, 3–18. [Google Scholar] [PubMed]
- Allen, P.F.; Locker, D. Do weights really matter? An assessment using the oral health impact profile? Community Dent. Health 1997, 14, 133–138. [Google Scholar] [PubMed]
- Lampignano, L.; Sardone, R.; D’urso, F.; Altamura, M.; Piccininni, C.; Griseta, C.; Bortone, I.; Castellana, F.; Zupo, R.; Donghia, R.; et al. Processed meat consumption and the risk of incident late-onset depression: A 12-year follow-up of the Salus in Apulia Study. Age Ageing 2022, 51, afab257. [Google Scholar] [CrossRef] [PubMed]
- World Health Organization. Obesity: Preventing and Managing the Global Epidemic; WHO Technical Report Series 894; Report of a WHO Consultation; World Health Organization: Geneva, Switzerland, 2000. [Google Scholar]
- Swoboda, J.; Kiyak, H.A.; Persson, R.E.; Persson, G.R.; Yamaguchi, D.K.; MacEntee, M.I.; Wyatt, C.C. Predictors of oral health quality of life in older adults. Spéc. Care Dent. 2006, 26, 137–144. [Google Scholar] [CrossRef]
- Ohlsson, B.; Manjer, J. Sociodemographic and Lifestyle Factors in relation to Overweight Defined by BMI and “Normal-Weight Obesity”. J. Obes. 2020, 2020, 2070297. [Google Scholar] [CrossRef]
- Baniasadi, K.; Armoon, B.; Higgs, P.; Bayat, A.; Gharehghani, M.A.M.; Hemmat, M.; Fakhri, Y.; Mohammadi, R.; Moghaddam, L.F.; Schroth, R.J. The Association of Oral Health Status and socio-economic determinants with Oral Health-Related Quality of Life among the elderly: A systematic review and meta-analysis. Int. J. Dent. Hyg. 2021, 19, 153–165. [Google Scholar] [CrossRef]
- Kumar, P.; Mastan, K.; Chowdhary, R.; Shanmugam, K. Oral manifestations in hypertensive patients: A clinical study. J. Oral Maxillofac. Pathol. 2012, 16, 215–221. [Google Scholar] [CrossRef]
- Soltani, S.; Shirani, F.; Chitsazi, M.J.; Salehi-Abargouei, A. The effect of dietary approaches to stop hypertension (DASH) diet on weight and body composition in adults: A systematic review and meta-analysis of randomized controlled clinical trials. Obes. Rev. 2016, 17, 442–454. [Google Scholar] [CrossRef]
- Hession, M.; Rolland, C.; Kulkarni, U.; Wise, A.; Broom, J. Systematic review of randomized controlled trials of low-carbohydrate vs. low-fat/low-calorie diets in the management of obesity and its comorbidities. Obes. Rev. 2009, 10, 36–50. [Google Scholar] [CrossRef]
- Makhija, S.K.; Gilbert, G.H.; Litaker, M.S.; Allman, R.M.; Sawyer, P.; Locher, J.L.; Ritchie, C.S. Association Between Aspects of Oral Health-Related Quality of Life and Body Mass Index in Community-Dwelling Older Adults. J. Am. Geriatr. Soc. 2007, 55, 1808–1816. [Google Scholar] [CrossRef]
- Khongsirisombat, N.; Kiattavorncharoen, S.; Thanakun, S. Increased Oral Dryness and Negative Oral Health-Related Quality of Life in Older People with Overweight or Obesity. Dent. J. 2022, 10, 231. [Google Scholar] [CrossRef]
- Daly, R.M.; Elsner, R.J.F.; Allen, P.F.; Burke, F.M. Associations between self-reported dental status and diet. J. Oral Rehabil. 2003, 30, 964–970. [Google Scholar] [CrossRef] [PubMed]
- Allen, P.F. Association between diet, social resources and oral health related quality of life in edentulous patients. J. Oral Rehabil. 2005, 32, 623–628. [Google Scholar] [CrossRef] [PubMed]
- Kamphuis, C.B.; de Bekker-Grob, E.W.; van Lenthe, F.J. Factors affecting food choices of older adults from high and low socioeconomic groups: A discrete choice experiment. Am. J. Clin. Nutr. 2015, 101, 768–774. [Google Scholar] [CrossRef] [PubMed]
- El Osta, N.; Hennequin, M.; Tubert-Jeannin, S.; Naaman, N.B.A.; El Osta, L.; Geahchan, N. The pertinence of oral health indicators in nutritional studies in the elderly. Clin. Nutr. 2014, 33, 316–321. [Google Scholar] [CrossRef]
- Pillai, R.S.; Mathur, V.P.; Jain, V.; Shah, N.; Kalra, S.; Kumar, P.; Dey, A.B. Association between dental prosthesis need, nutritional status and quality of life of elderly subjects. Qual. Life Res. 2015, 24, 2863–2871. [Google Scholar] [CrossRef]
- Hugo, C.; Cockburn, N.; Ford, P.; March, S.; Isenring, E. Poor nutritional status is associated with worse oral health and poorer quality of life in aged care residents. J. Nurs. Home Res. Sci. 2016, 2, 118–122. [Google Scholar] [CrossRef]
- Dahl, K.; Wang, N.; Holst, D.; Öhrn, K. Oral health-related quality of life among adults 68-77 years old in Nord-Trøndelag, Norway. Int. J. Dent. Hyg. 2011, 9, 87–92. [Google Scholar] [CrossRef]
- Choi, J.; Kim, M.; Kho, H. Oral health-related quality of life and associated factors in patients with xerostomia. Int. J. Dent. Hyg. 2021, 19, 313–322. [Google Scholar] [CrossRef]
- Henni, S.H.; Skudutyte-Rysstad, R.; Ansteinsson, V.; Hellesø, R.; Hovden, E.A.S. Oral health and oral health-related quality of life among older adults receiving home health care services: A scoping review. Gerodontology 2022, 40, 161–171. [Google Scholar] [CrossRef]
- Elwood, P.C.; Bates, J.F. Dentition and nutrition. Dent. Pr. Dent. Rec. 1972, 22, 427–429. [Google Scholar]
- Aishima, M.; Ishikawa, T.; Ikuta, K.; Noguchi-Watanabe, M.; Nonaka, S.; Takahashi, K.; Anzai, T.; Fukui, S. Unplanned Hospital Visits and Poor Oral Health With Undernutrition in Nursing Home Residents. J. Am. Med. Dir. Assoc. 2023. ahead of print. [Google Scholar] [CrossRef] [PubMed]


| Ideal BMI | Unfavorable BMI | ||||
|---|---|---|---|---|---|
| Mean ± SD | Median (min to max) | Mean ± SD | Median (min to max) | p § | |
| Sociodemographic Assessment | |||||
| Proportion (%) | 152 (70.40) | 64 (29.60) | |||
| Age (years) | 71.95 ± 5.39 | 70 (65 to 87) | 70.12 ± 4.05 | 70 (65 to 82) | 0.0 |
| Sex | |||||
| Male | 72 (47.40) | 36 (56.20) | 0.23 x2 | ||
| Female | 80 (52.60) | 28 (43.80) | |||
| BMI (Kg/m2) | 25.96 ± 2.84 | 26.42 (18.96 to 29.9) | 33.7 ± 4.23 | 32.77 (17.38 to 47.69) | <0.01 |
| Education (years) | 7.39 ± 3.47 | 7 (0 to 18) | 6.84 ± 3.38 | 5 (2 to 16) | 0.21 |
| Nutritional Assessment | |||||
| Lipid consumption (g/die) | 86.80 ± 52.00 | 78.60 (28.40 to 531) | 85.40 ± 65.10 | 74.00 (33.20 to 501) | 0.32 |
| Carbohydrate consumption (g/week) | 471.00 ± 227.00 | 449 (21.90 to 1382) | 467.0 ± 342 | 402 (52.70 to 2344) | 0.33 |
| Protein consumption (g/die) | 62.10 ± 24.10 | 59.50 (4.63 to 138) | 86.10 ± 118.00 | 70.50 (33.20 to 887) | 0.11 |
| Alcohol consumption (g/die) | 13.70 ± 18.70 | 10.40 (0 to 105) | 16.30 ± 23.10 | 10.40 (0 to 81.10) | 0.91 |
| Metabolic Biomarkers | |||||
| DBP (mmHg) | 77.60 ± 6.54 | 80 (60 to 90) | 81.40 ± 7.42 | 80 (60 to 100) | <0.01 |
| SBP (mmHg) | 130.00 ± 12.4 | 130.00 (100 to 160) | 136.00 ± 15.4 | 140 (100 to 170) | <0.01 |
| FBG (mg/dL) | 98.41 ± 15.46 | 96 (70 to 166) | 114.77 ± 33.96 | 105.5 (73 to 260) | <0.01 |
| HbA1c (mmol/mol) | 37.95 ± 7.38 | 37 (23 to 79) | 42.62 ± 12.33 | 40.5 (28 to 101) | <0.01 |
| Total cholesterol (mg/dL) | 183.33 ± 36.59 | 180.5 (96 to 287) | 182.22 ± 35.26 | 185 (76 to 248) | 0.83 * |
| HDL cholesterol (mg/dL) | 49.34 ± 13.16 | 46.5 (28 to 91) | 45.61 ± 10.71 | 45 (27 to 74) | 0.10 |
| LDL cholesterol (mg/dL) | 113.01 ± 30.45 | 111 (36 to 217) | 113.7 ± 26.81 | 113.5 (55 to 182) | 0.87 * |
| Triglycerides (mg/dL) | 99.03 ± 44.7 | 92 (28 to 344) | 113.78 ± 50.55 | 108 (39 to 261) | 0.05 |
| Hemoglobin (g/dL) | 13.88 ± 1.3 | 13.9 (10.3 to 16.9) | 13.94 ± 1.25 | 13.7 (11.4 to 16.5) | 0.87 |
| RBC (106 cells/mm3) | 5.01 ± 2.96 | 4.75 (3.58 to 40.8) | 4.79 ± 0.47 | 4.76 (3.95 to 6.01) | 0.88 |
| WBC (103 cells/mm3) | 6.1 ± 1.75 | 5.9 (2.6 to 10.7) | 5.97 ± 1.5 | 5.9 (3.06 to 9.4) | 0.77 |
| Platelets (103 cells/mm3) | 224.74 ± 54.74 | 219.5 (114 to 459) | 231.78 ± 60.75 | 234.5 (110 to 452) | 0.24 |
| OHIP-14 questionnaire | |||||
| Q1 Difficult to pronounce words | 0.10 ± 0.44 | 0 (0 to 3) | 0.13 ± 0.50 | 0 (0 to 2) | 0.72 |
| Q2 Worsened taste | 0.24 ± 0.70 | 0 (0 to 4) | 0.31 ± 0.82 | 0 (0 to 3) | 0.75 |
| Q3 Pain | 1.14 ± 1.12 | 2 (0 to 4) | 1.34 ± 1.13 | 2 (0 to 3) | 0.20 |
| Q4 Uncomfortable to eat | 1.02 ± 1.30 | 0 (0 to 4) | 1.50 ± 1.35 | 2 (0 to 4) | 0.01 |
| Q5 Concern for the mouth | 0.16 ± 0.60 | 0 (0 to 3) | 0.31 ± 0.88 | 0 (0 to 4) | 0.18 |
| Q6 Self-consciousness due to oral problems | 0.26 ± 0.69 | 0 (0 to 3) | 0.31 ± 0.84 | 0 (0 to 4) | 0.96 |
| Q7 Diet unsatisfactory | 0.12 ± 0.56 | 0 (0 to 4) | 0.21 ± 0.68 | 0 (0 to 3) | 0.24 |
| Q8 Interrupted meals | 0.11 ± 0.43 | 0 (0 to 2) | 0.21 ± 0.68 | 0 (0 to 3) | 0.30 |
| Q9 Difficult to relax due to oral problems | 0.17 ± 0.55 | 0 (0 to 3) | 0.11 ± 0.48 | 0 (0 to 3) | 0.42 |
| Q10 Embarrassment due to oral problems | 0.11 ± 0.52 | 0 (0 to 3) | 0.20 ± 0.70 | 0 (0 to 4) | 0.31 |
| Q11 Irritability | 0.01 ± 0.16 | 0 (0 to 2) | 0.13 ± 0.53 | 0 (0 to 3) | 0.01 |
| Q12 Difficult to do jobs due to oral problems | 0.01 ± 0.16 | 0 (0 to 2) | 0.08 ± 0.45 | 0 (0 to 3) | 0.14 |
| Q13 Life less satisfying due to oral problems | 0.01 ± 0.08 | 0 (0 to 1) | 0.06 ± 0.08 | 0 (0 to 3) | 0.14 |
| Q14 Totally unable to function | 0.00 ± 0.00 | 0 (0 to 0) | 0.03 ± 0.25 | 0 (0 to 2) | 0.11 |
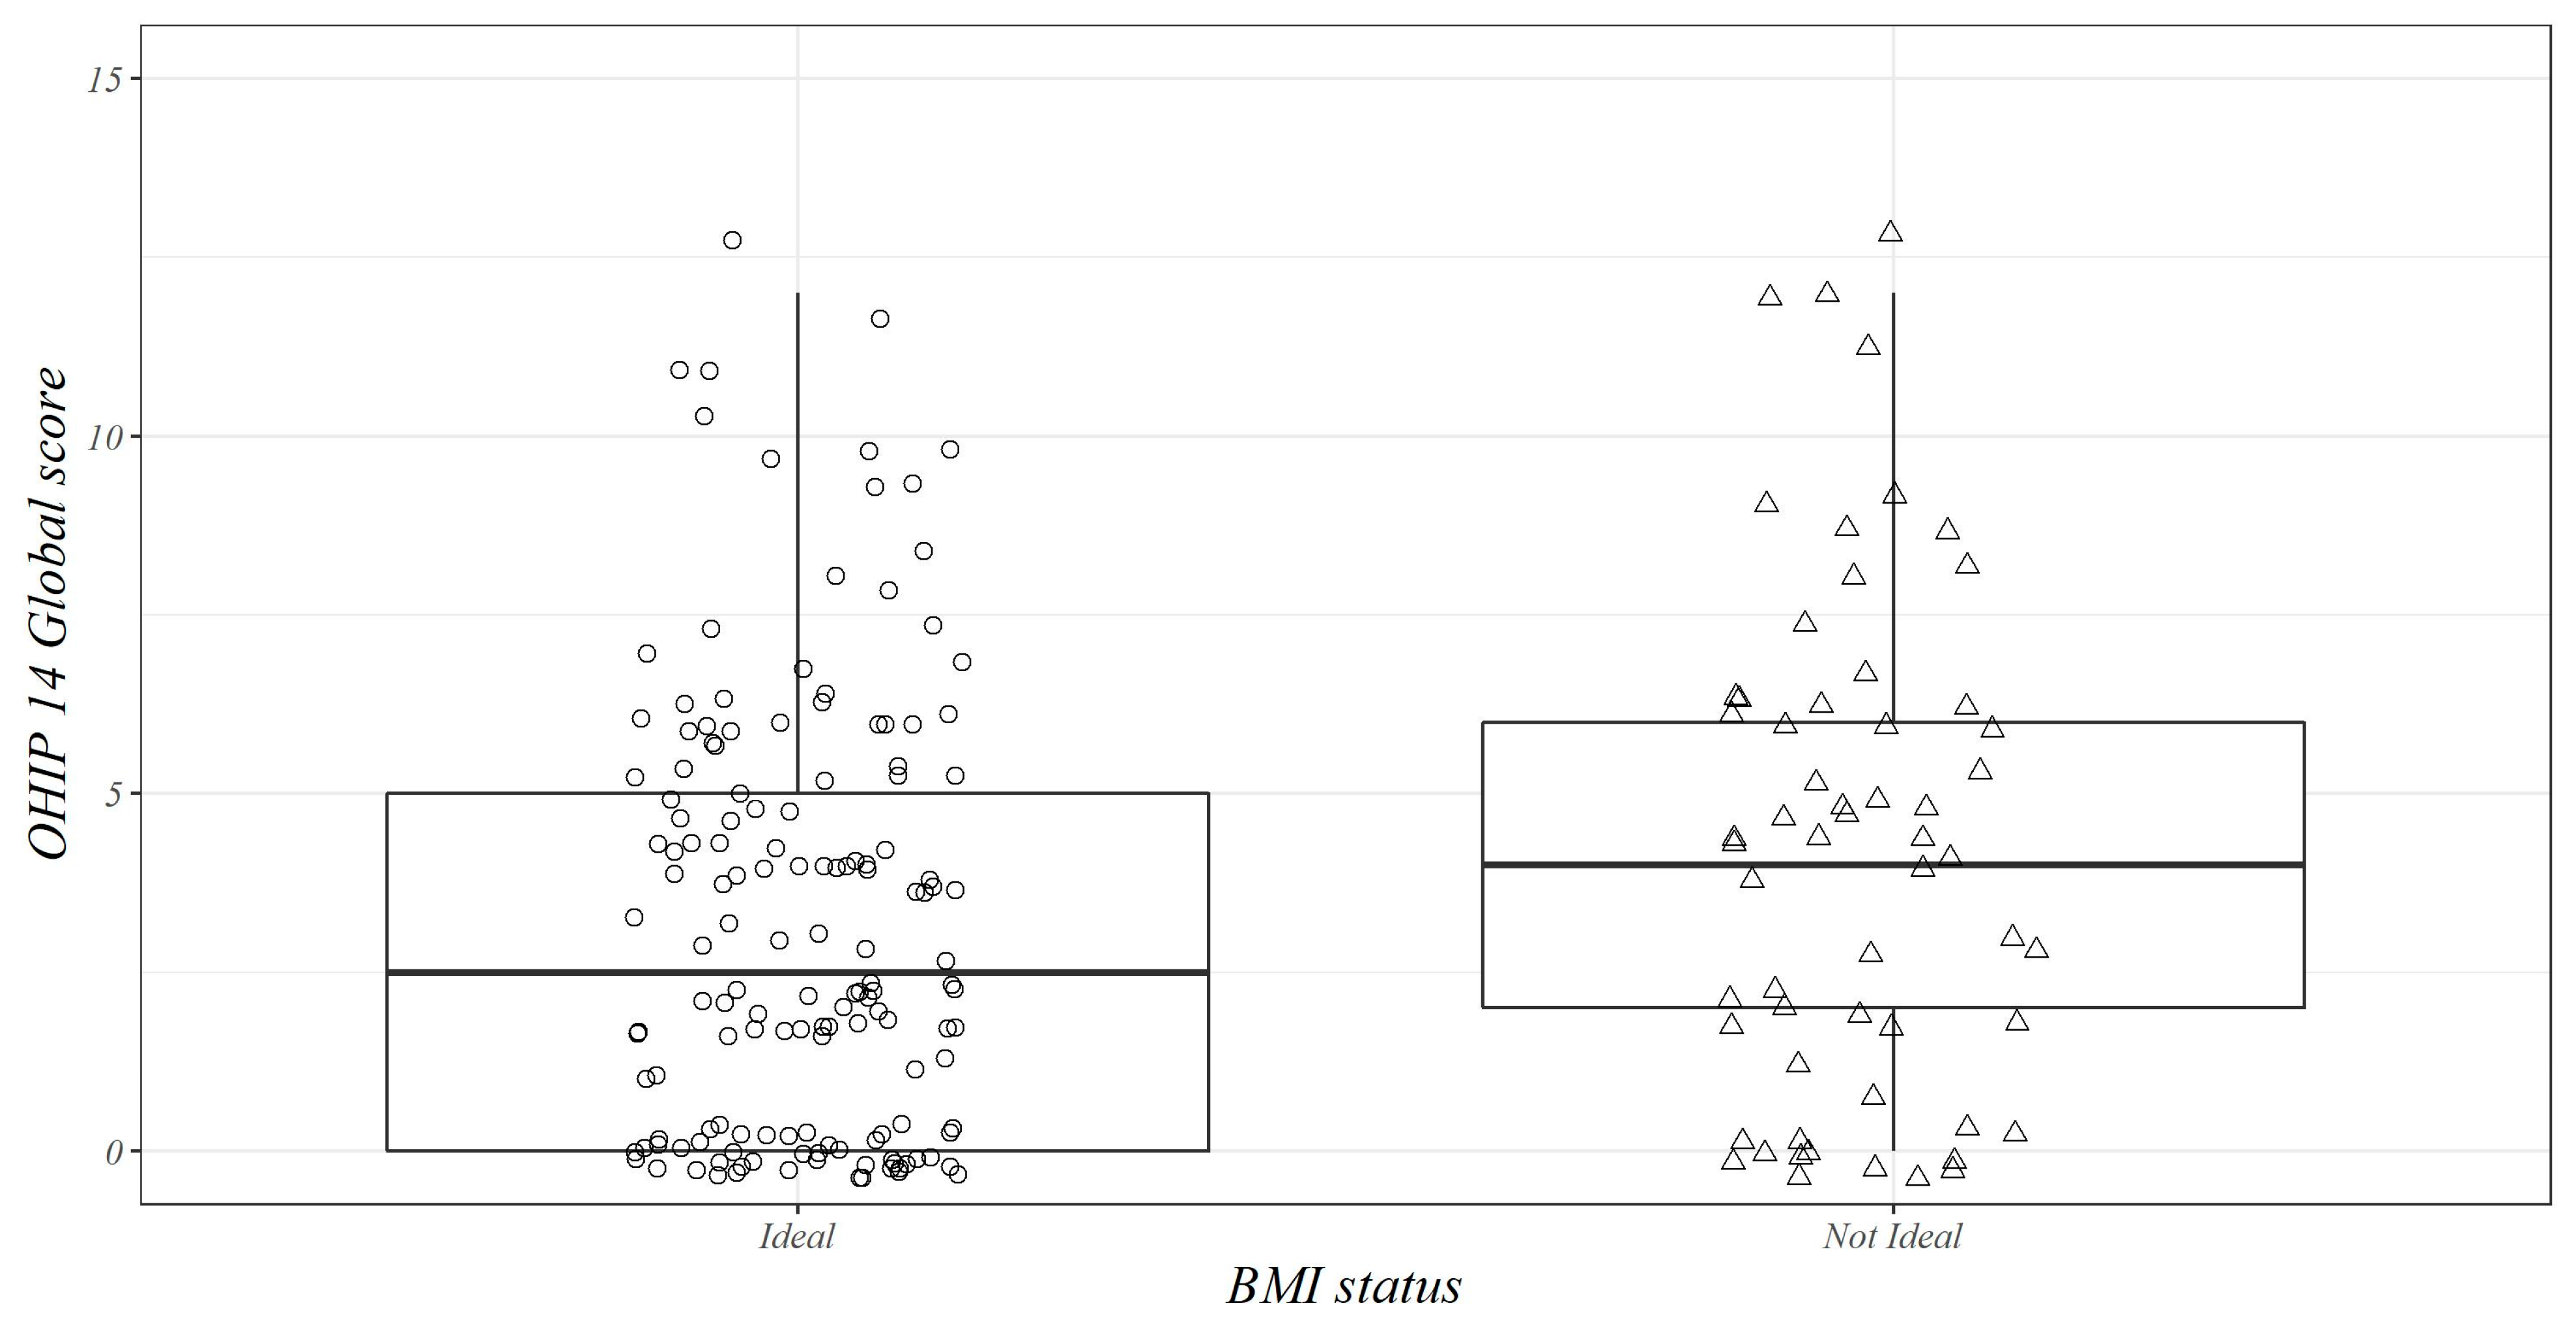
| OHIP-14 Total score | 3.46 ± 3.75 | 2.5 (0 to 25) | 5 ± 5.67 | 4 (0 to 37) | 0.03 |
| OR | 95% CI | p Value | |
|---|---|---|---|
| Model 1 | |||
| OHIP-14 total score | 1.08 | 1.01 to 1.15 | 0.03 |
| Model 2 | |||
| OHIP-14 total score | 1.10 | 1.01 to 1.22 | 0.04 |
| Age (years) | 0.89 | 0.82 to 0.97 | <0.01 |
| Sex (Female) | 0.48 | 0.21 to 1.11 | 0.08 |
| Education (years) | 0.91 | 0.81 to 1.02 | 0.11 |
| Carbohydrates consumption (g/week) | 1.10 | 0.95 to 1.10 | 0.39 |
| Alcohol consumption (g/day) | 1.00 | 0.98 to 1.02 | 0.80 |
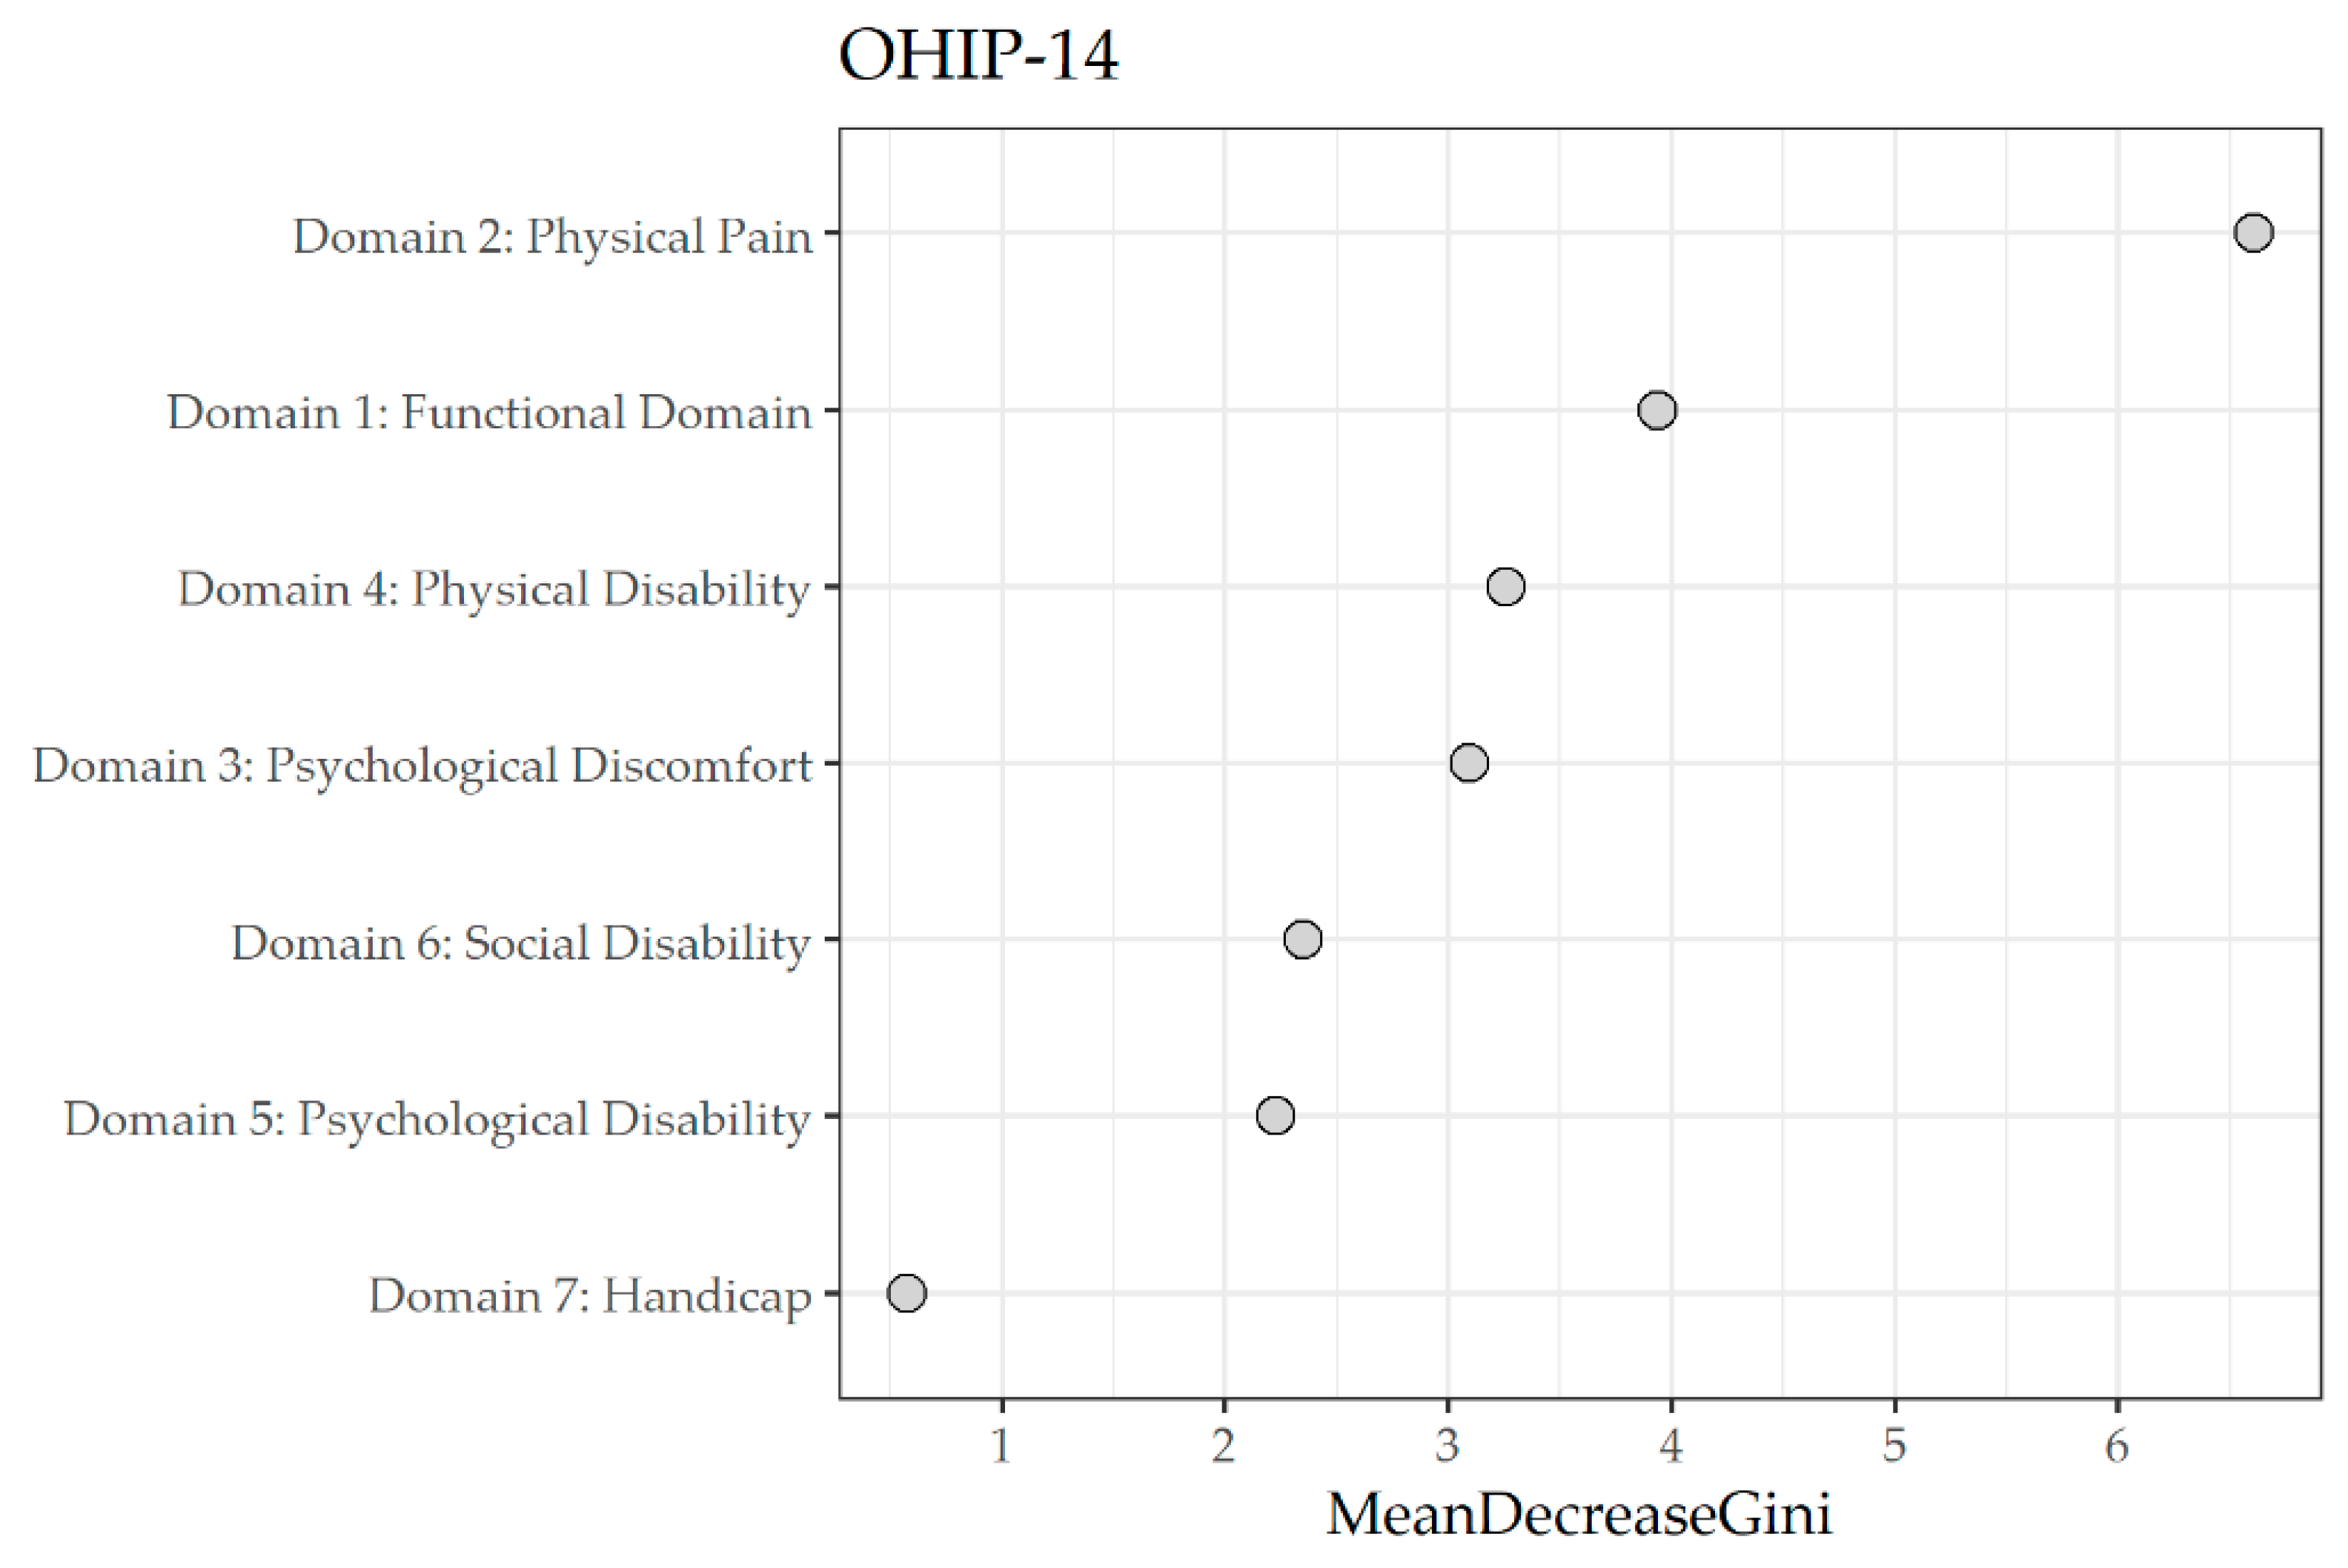
| Domain | Mean Decrease in Gini |
|---|---|
| 2 Physical pain | 6.63 |
| 1 Functional limitation | 3.54 |
| 3 Psychological discomfort | 3.15 |
| 4 Physical disability | 3.04 |
| 6 Social disability | 2.54 |
| 5 Psychological disability | 2.28 |
| 7 Handicap | 0.5 |
Disclaimer/Publisher’s Note: The statements, opinions and data contained in all publications are solely those of the individual author(s) and contributor(s) and not of MDPI and/or the editor(s). MDPI and/or the editor(s) disclaim responsibility for any injury to people or property resulting from any ideas, methods, instructions or products referred to in the content. |
© 2023 by the authors. Licensee MDPI, Basel, Switzerland. This article is an open access article distributed under the terms and conditions of the Creative Commons Attribution (CC BY) license (https://creativecommons.org/licenses/by/4.0/).
Share and Cite
Dibello, V.; Lobbezoo, F.; Sardone, R.; Lozupone, M.; Castellana, F.; Zupo, R.; Pilotto, A.; Daniele, A.; Solfrizzi, V.; Manfredini, D.; et al. The Relationship between Oral Health-Related Quality of Life and Body Mass Index in an Older Population from Southern Italy: The Salus in Apulia Study. J. Pers. Med. 2023, 13, 1300. https://doi.org/10.3390/jpm13091300
Dibello V, Lobbezoo F, Sardone R, Lozupone M, Castellana F, Zupo R, Pilotto A, Daniele A, Solfrizzi V, Manfredini D, et al. The Relationship between Oral Health-Related Quality of Life and Body Mass Index in an Older Population from Southern Italy: The Salus in Apulia Study. Journal of Personalized Medicine. 2023; 13(9):1300. https://doi.org/10.3390/jpm13091300
Chicago/Turabian StyleDibello, Vittorio, Frank Lobbezoo, Rodolfo Sardone, Madia Lozupone, Fabio Castellana, Roberta Zupo, Alberto Pilotto, Antonio Daniele, Vincenzo Solfrizzi, Daniele Manfredini, and et al. 2023. "The Relationship between Oral Health-Related Quality of Life and Body Mass Index in an Older Population from Southern Italy: The Salus in Apulia Study" Journal of Personalized Medicine 13, no. 9: 1300. https://doi.org/10.3390/jpm13091300
APA StyleDibello, V., Lobbezoo, F., Sardone, R., Lozupone, M., Castellana, F., Zupo, R., Pilotto, A., Daniele, A., Solfrizzi, V., Manfredini, D., & Panza, F. (2023). The Relationship between Oral Health-Related Quality of Life and Body Mass Index in an Older Population from Southern Italy: The Salus in Apulia Study. Journal of Personalized Medicine, 13(9), 1300. https://doi.org/10.3390/jpm13091300