
Using Consumer-Wearable Activity Trackers for Risk Prediction of Life-Threatening Heart Arrhythmia in Patients with an Implantable Cardioverter-Defibrillator: An Exploratory Observational Study

 ,
,  , , ,
, , ,  and
and
Abstract
:
1. Introduction
2. Materials and Methods
2.1. Study Settings and Objectives
2.2. Recruitment of Participants and Ethical Considerations
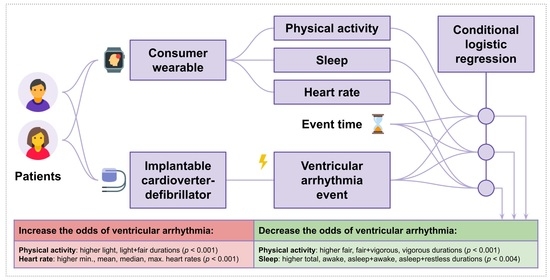
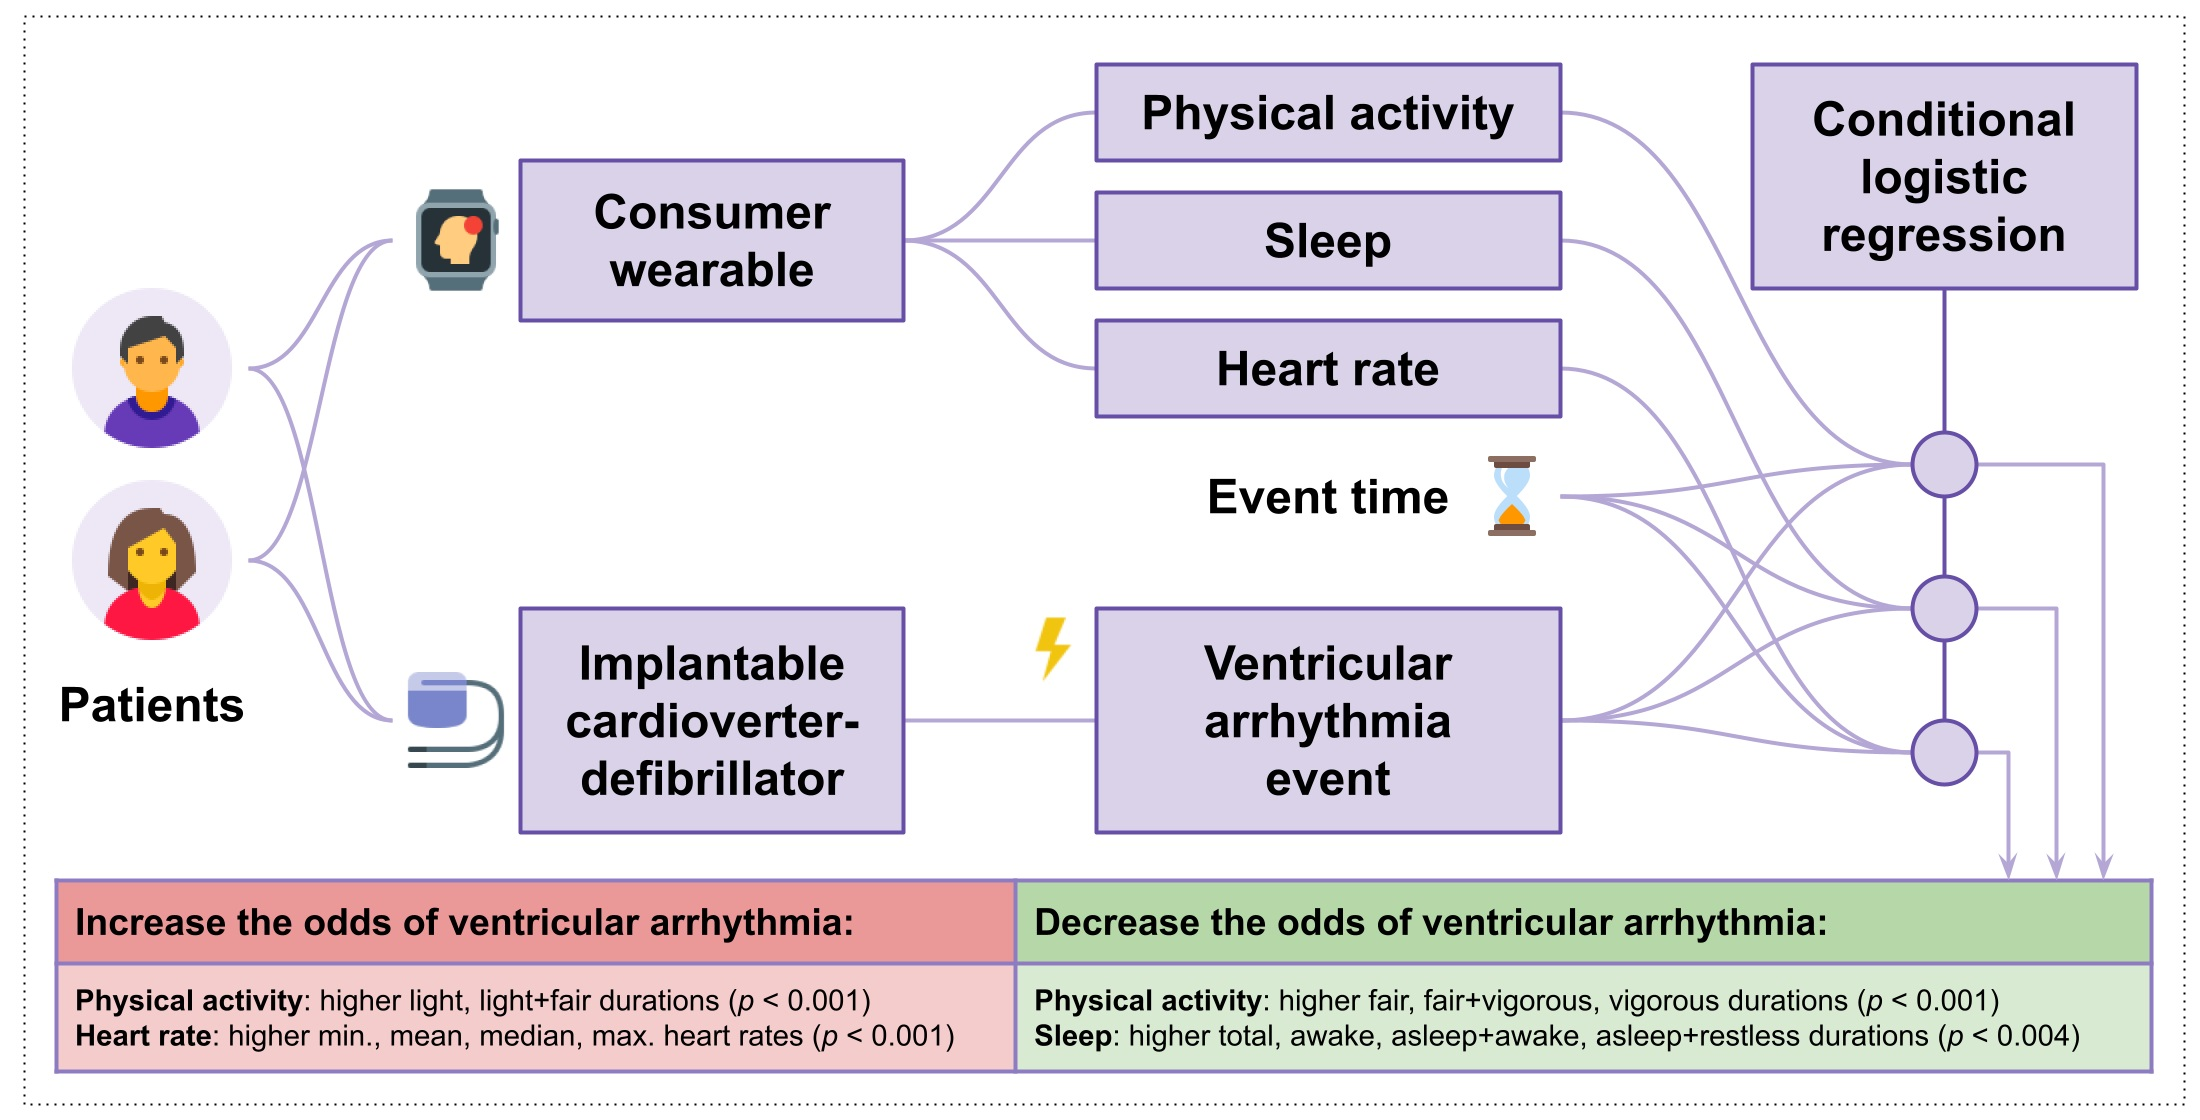
2.3. Measured Outcomes
2.3.1. ICD-Reported Outcomes
2.3.2. Fitbit-Reported Data
2.4. Data Analysis
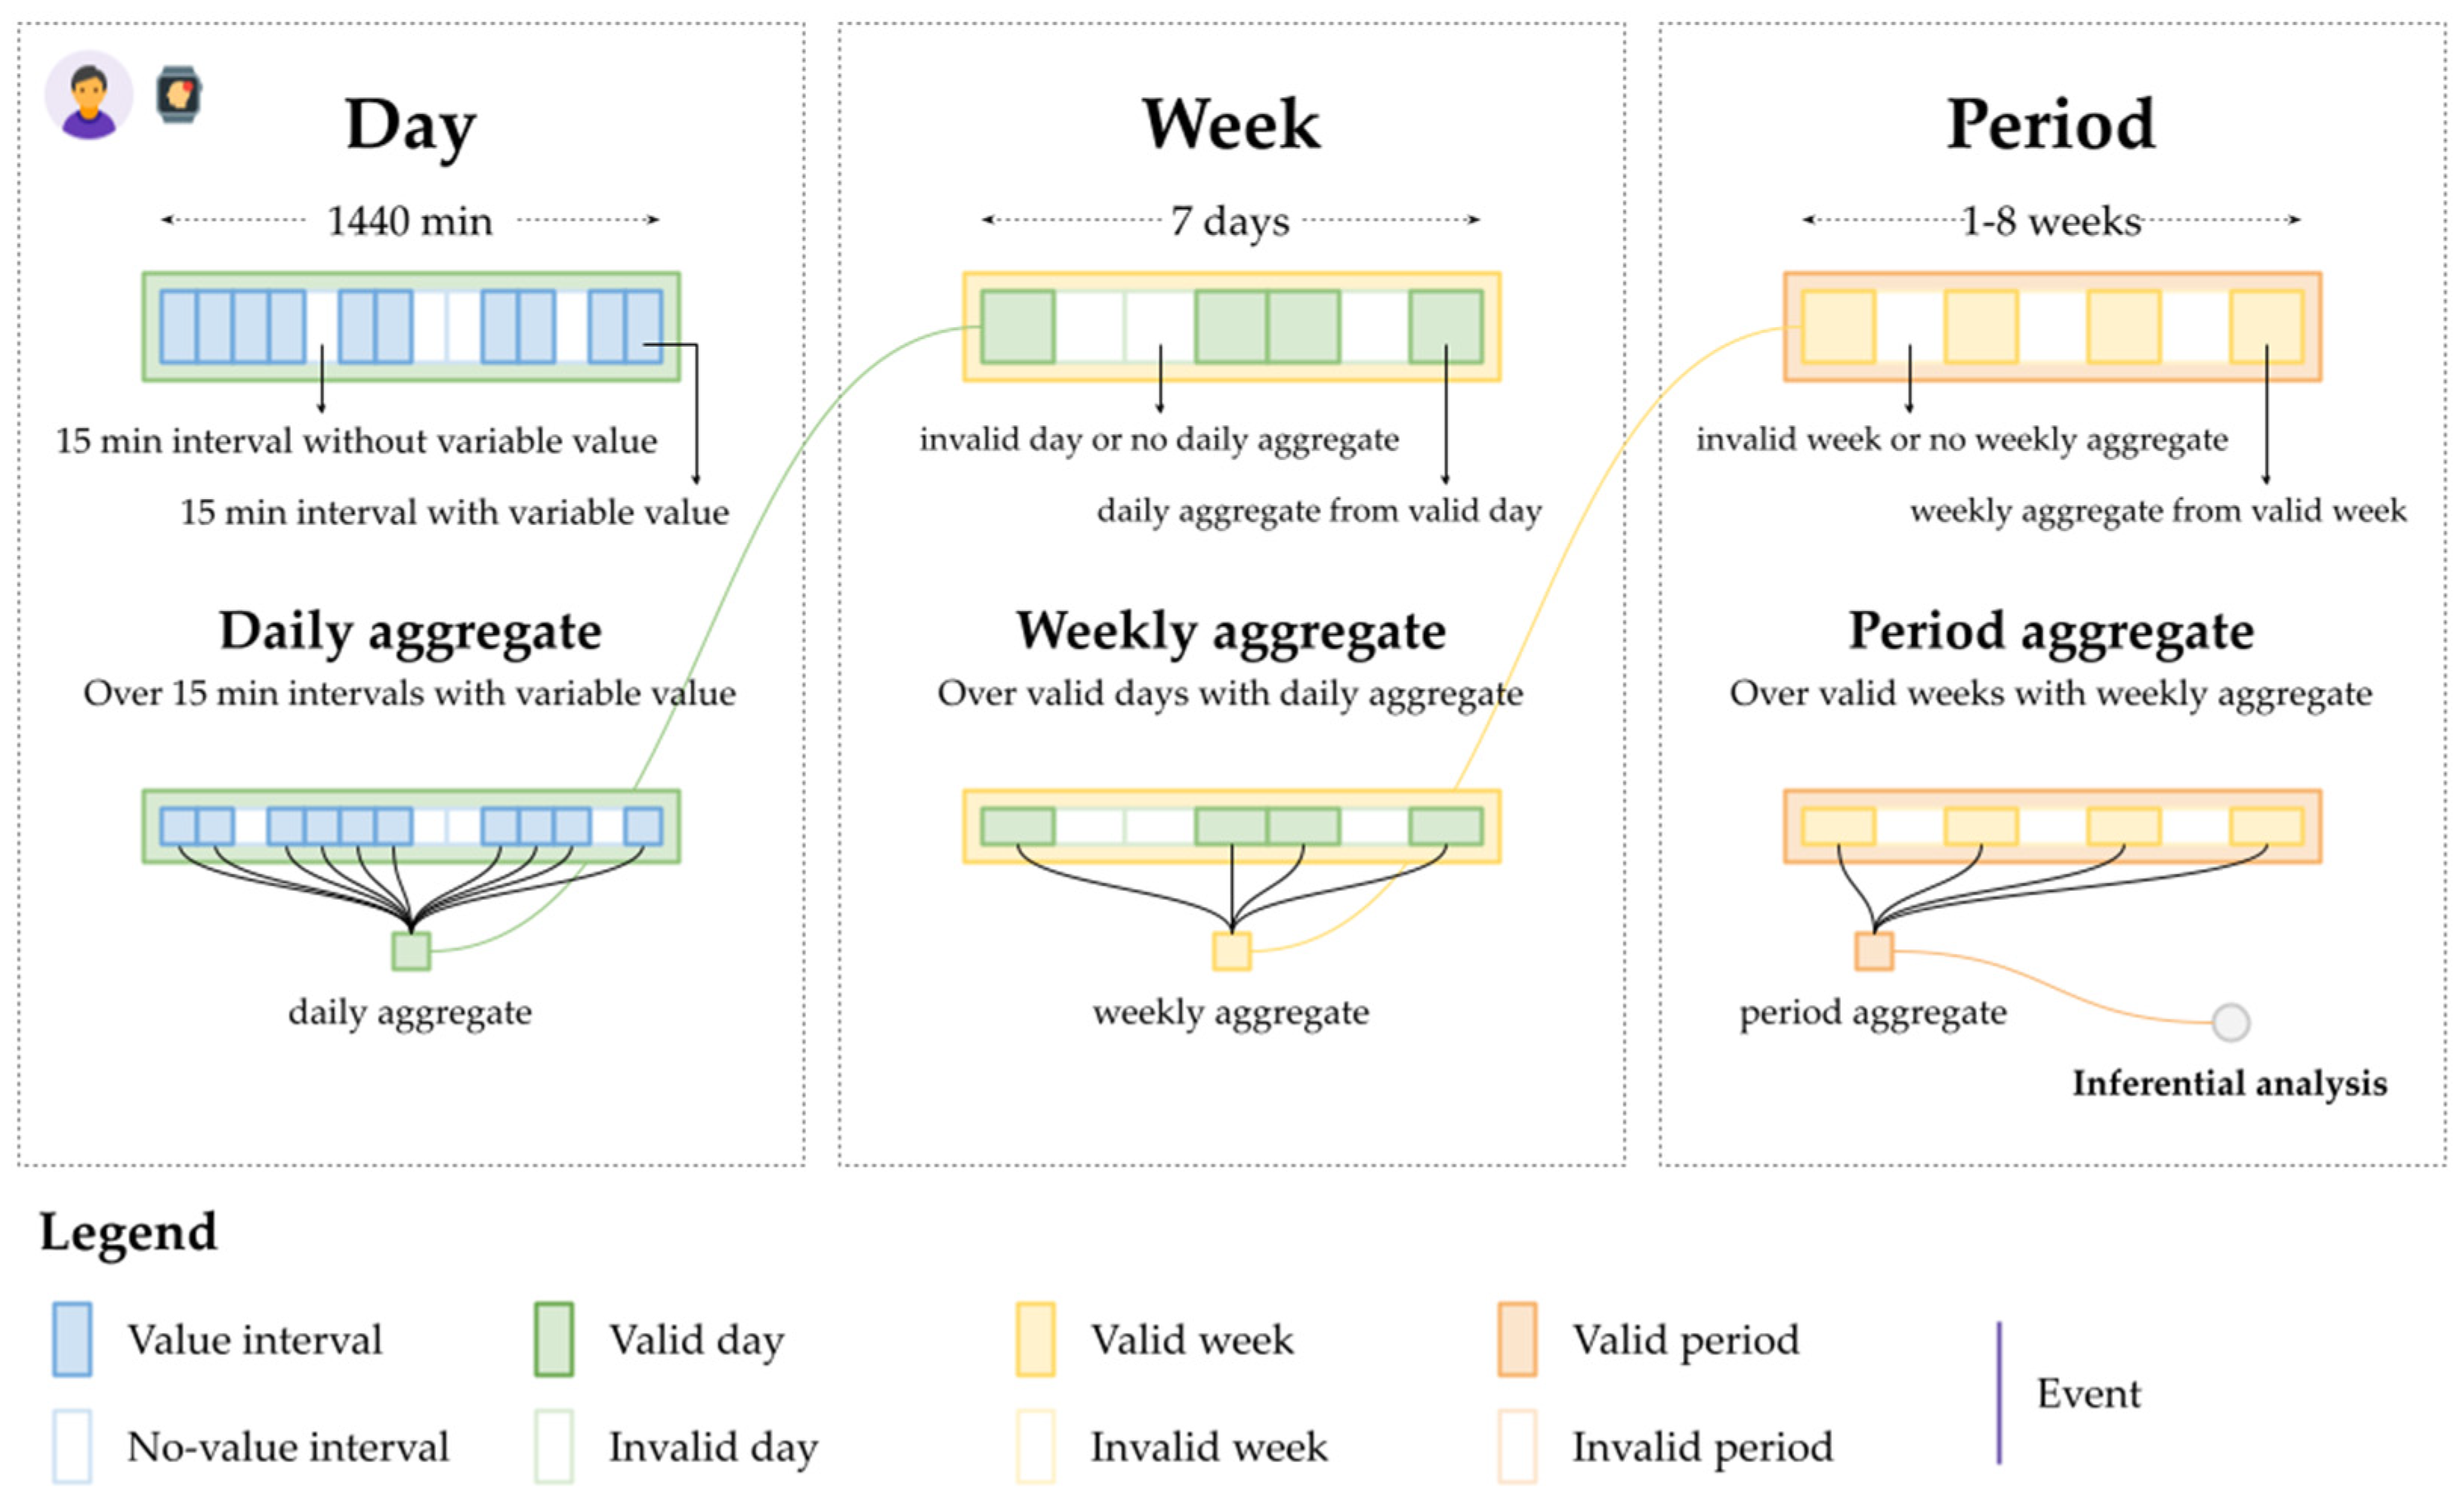
2.4.1. Data Quality Assurance and Data Aggregation
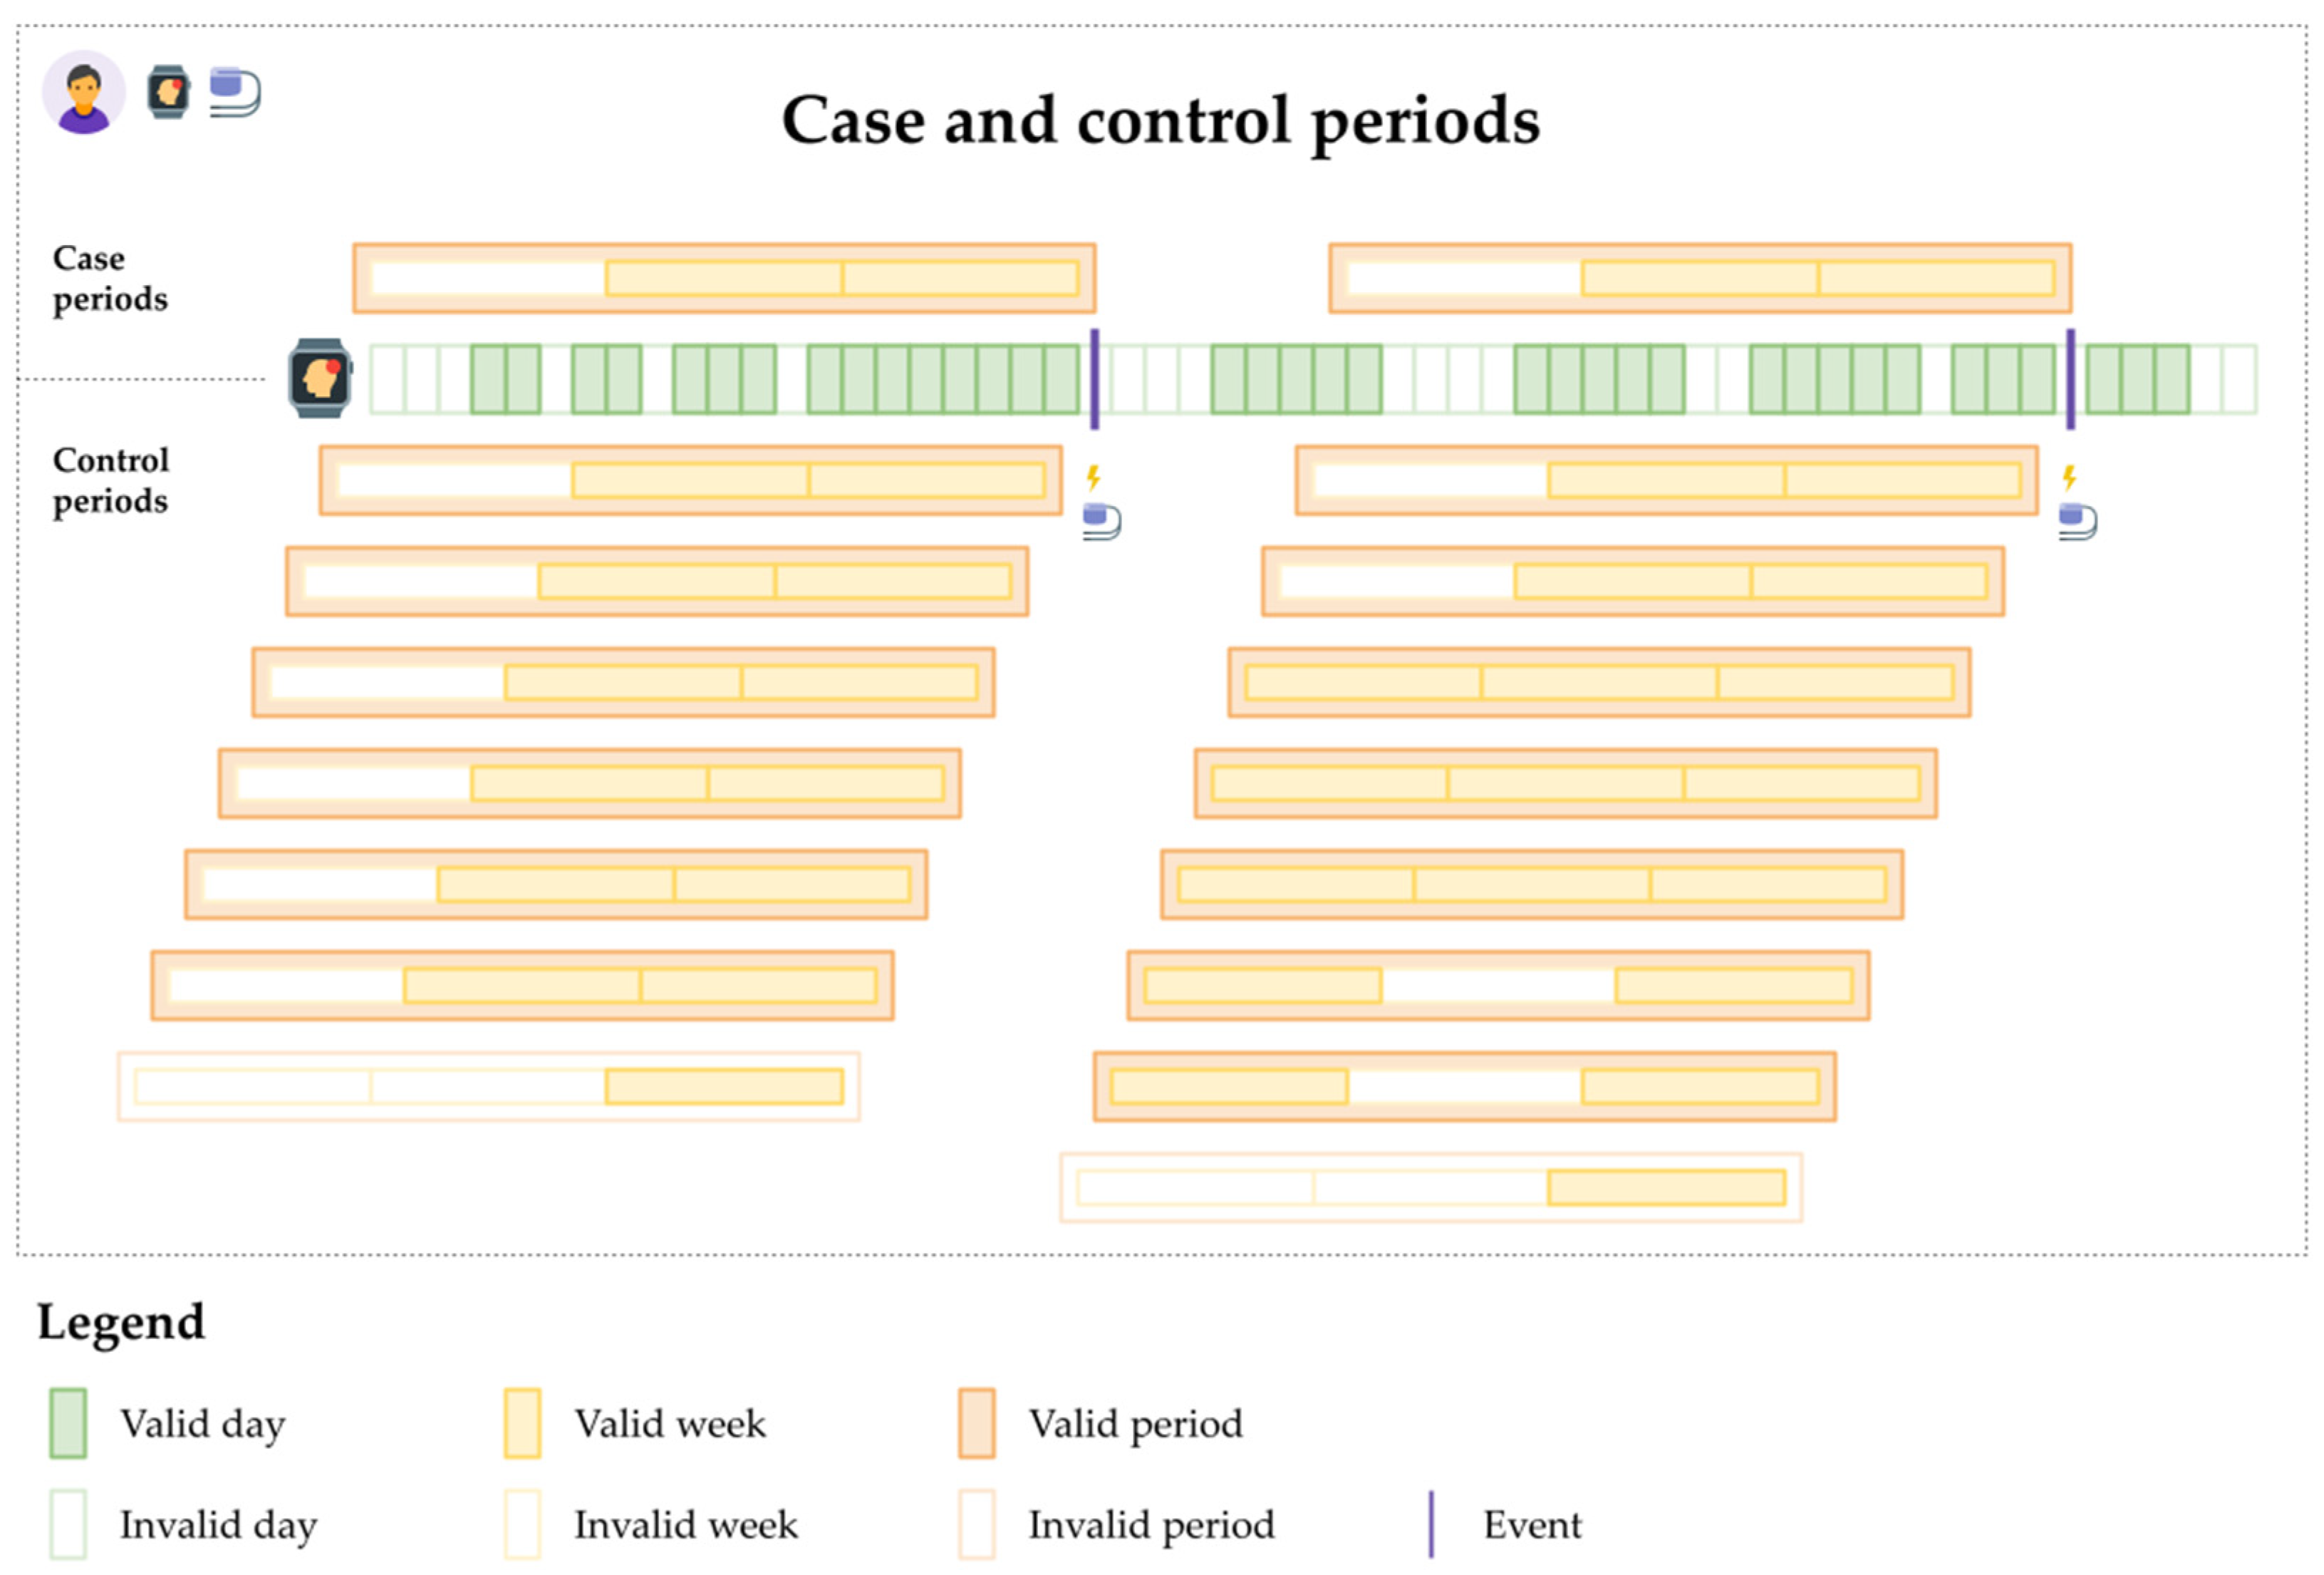
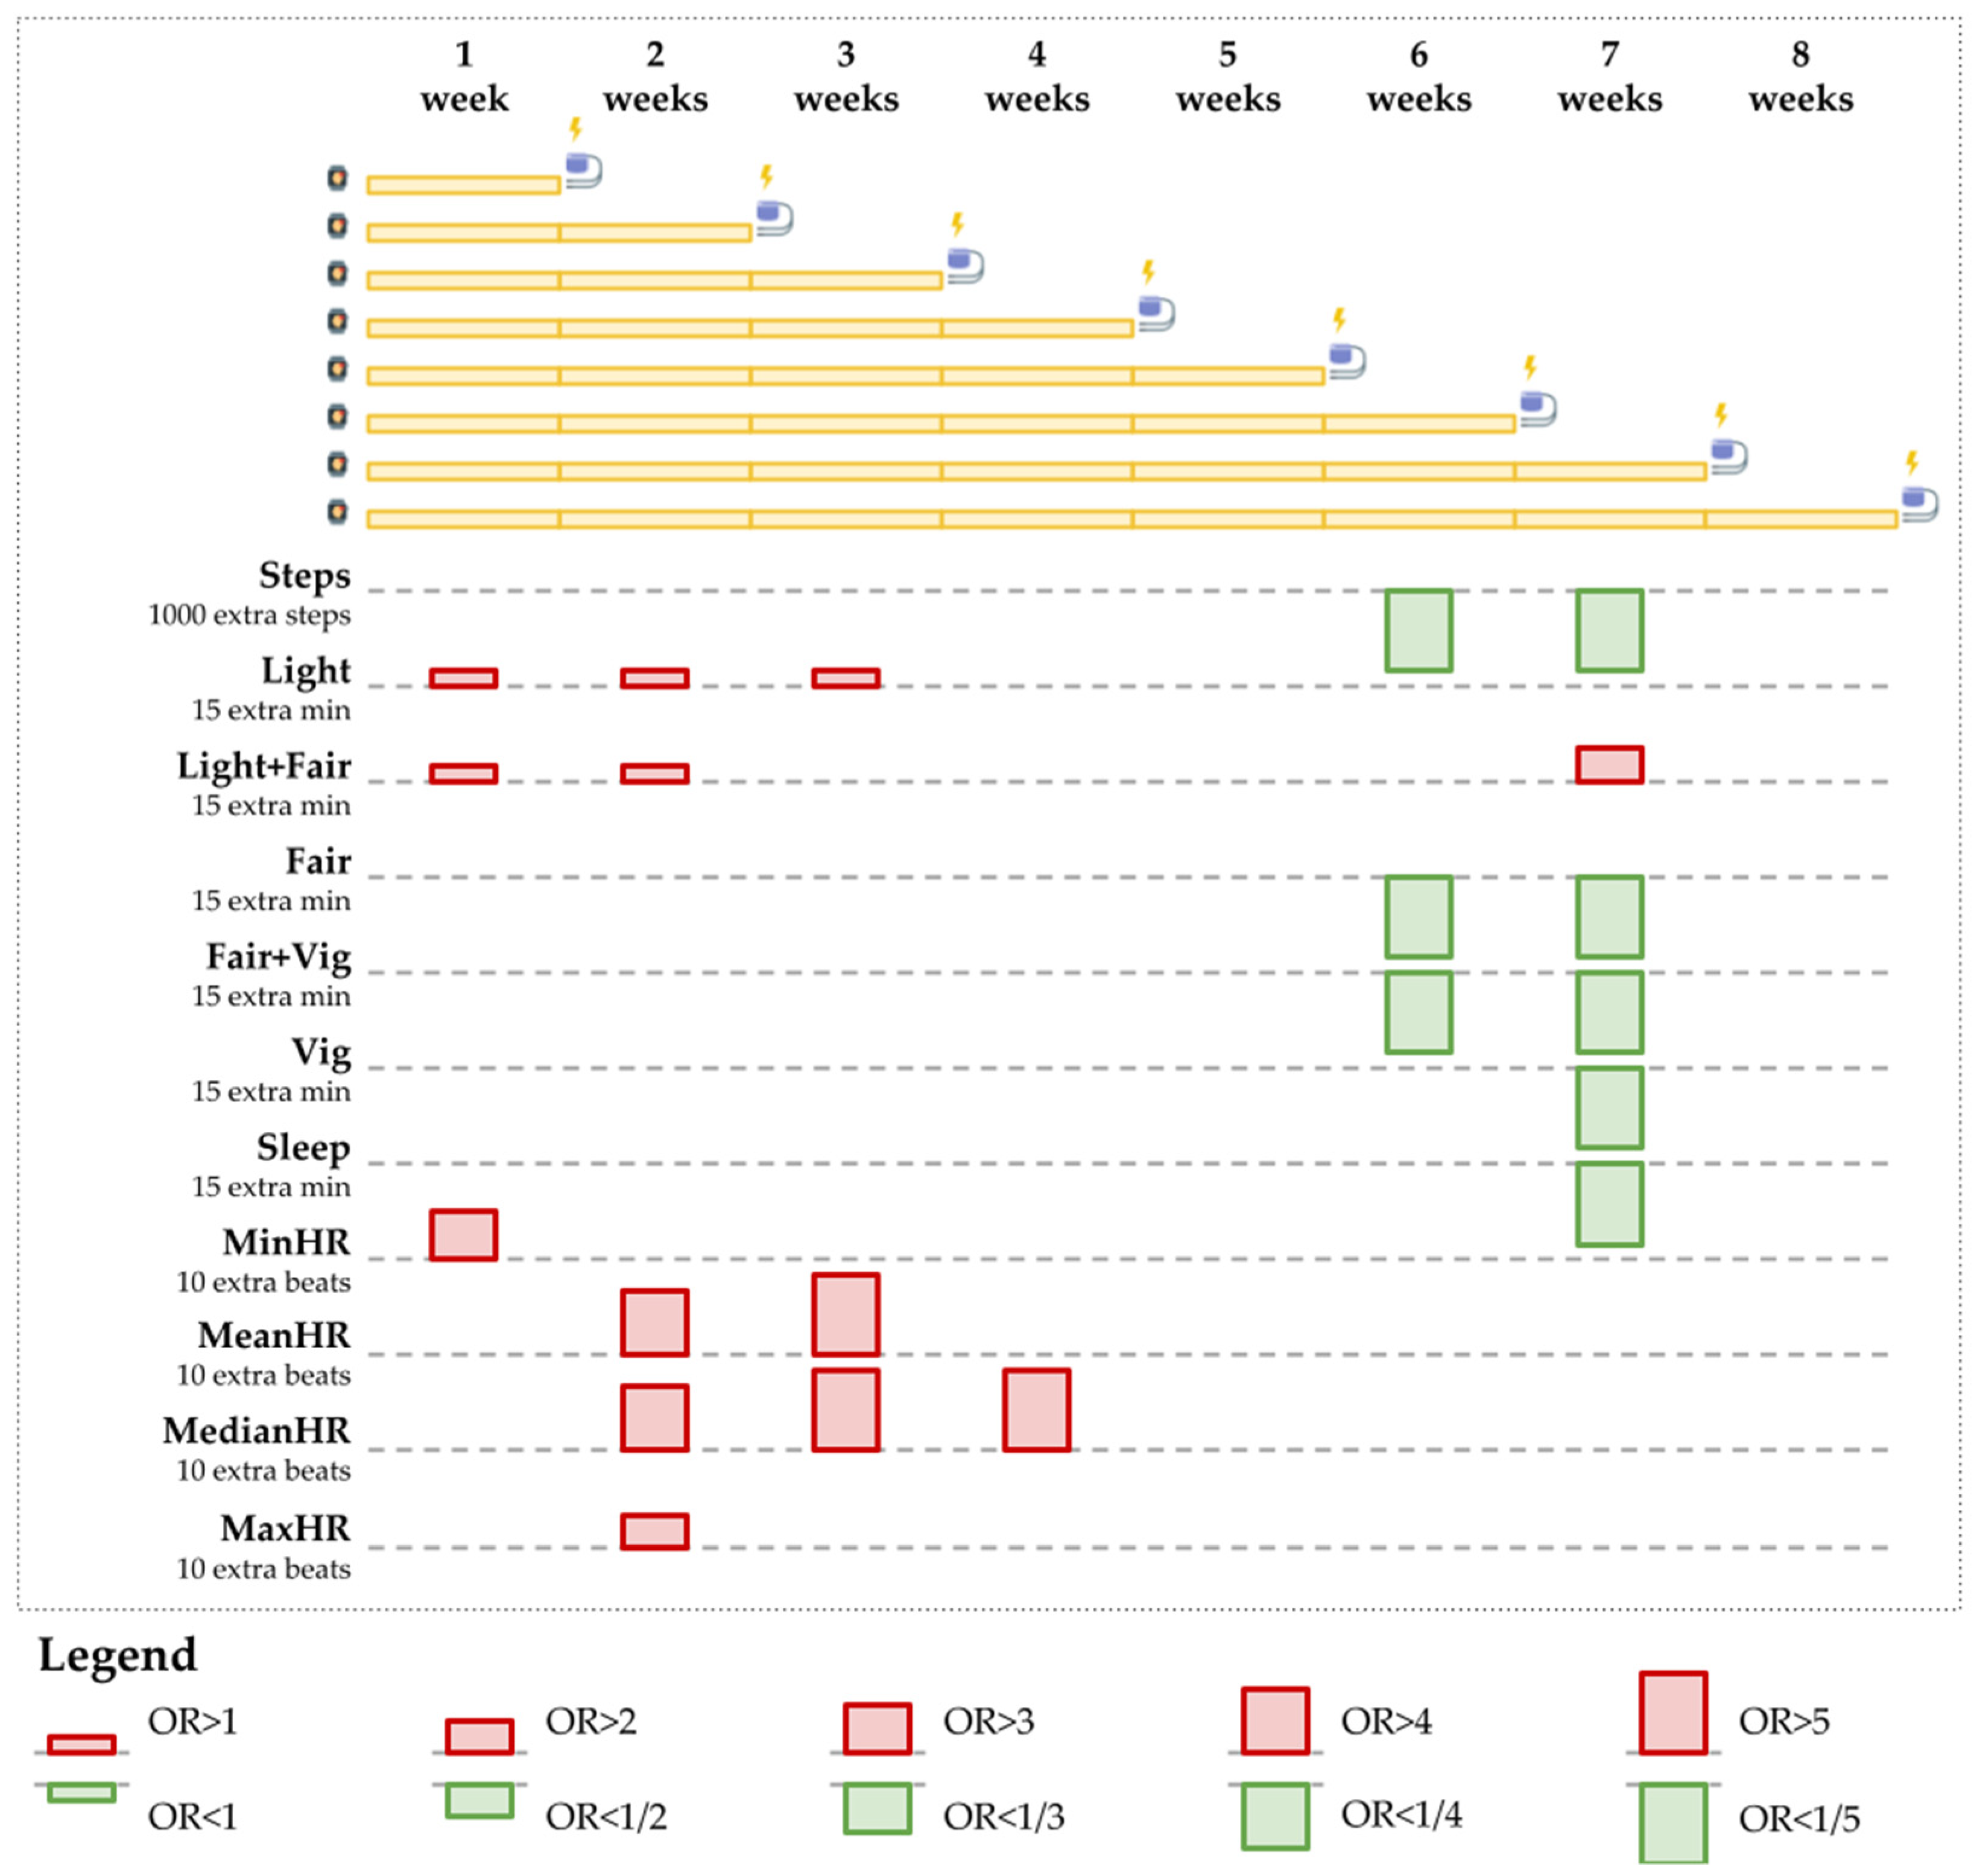
2.4.2. Analytic Design
2.4.3. Conditional Logistic Regression
3. Results
3.1. Participant Information
3.2. Descriptive Analysis of Data Quality and Behavioral Markers
3.3. Inferential Analysis
4. Discussion
4.1. Key Findings Compared to Prior Work
4.2. Implications for Designing Systems for Ventricular Arrhythmia Risk Assessment Using Wearable Activity Data
4.3. Strengths and Limitations
5. Conclusions
Supplementary Materials
Author Contributions
Funding
Institutional Review Board Statement
Informed Consent Statement
Data Availability Statement
Acknowledgments
Conflicts of Interest
Abbreviations
| Abbreviation | Term |
| Active | Cumulative light, fair, and vigorous-intensity physical activity duration |
| Asleep | Duration of sleep in the asleep type |
| Asleep + Awake | Cumulative duration of sleep in the asleep and awake types |
| Asleep + Restless | Cumulative duration of sleep in the asleep and restless types |
| Awake | Duration of sleep of the awake type |
| Awake + Restless | Cumulative duration of sleep in the awake and restless types |
| CA | California |
| CRT | Cardiac resynchronization therapy defibrillator |
| CSV | Comma-separated value format |
| Fair | Fair-intensity physical activity duration |
| Fair + Vig | Cumulative fair and vigorous-intensity physical activity duration |
| FDA | United States Food and Drug Administration |
| HR | Heart rate |
| ICD | Implantable cardioverter-defibrillator |
| JSON | JavaScript object notation format |
| Light | Light-intensity physical activity duration |
| Light + Fair | Cumulative light and fair-intensity physical activity duration |
| MaxHR | Maximum heart rate |
| MeanHR | Mean heart rate |
| MedianHR | Median heart rate |
| MinHR | Minimum heart rate |
| OR | Odds ratio |
| Restless | Duration of sleep in the restless type |
| SCAUT | Self-, Collaborative- and AUTo-detection of signs and symptoms of deterioration |
| SD | Standard deviation |
| SDHR | Standard deviation of heart rate |
| Sed | Sedentary duration |
| Sed + Light | Cumulative sedentary and light-intensity physical activity duration |
| Sleep | Duration of sleep |
| Unknown | Duration of sleep of an unknown type |
| USA | United States of America |
| VA | Ventricular arrhythmia |
| Vig | Vigorous-intensity physical activity duration |
| VF-VT | Ventricular tachycardia into ventricular fibrillation |
| VT | Ventricular tachycardia |
| VT1 | Ventricular tachycardia in Zone 1 |
| VT2 | Ventricular tachycardia in Zone 2 |
Appendix A
Appendix A.1. Fitbit as a Consumer Wearable Activity Tracker
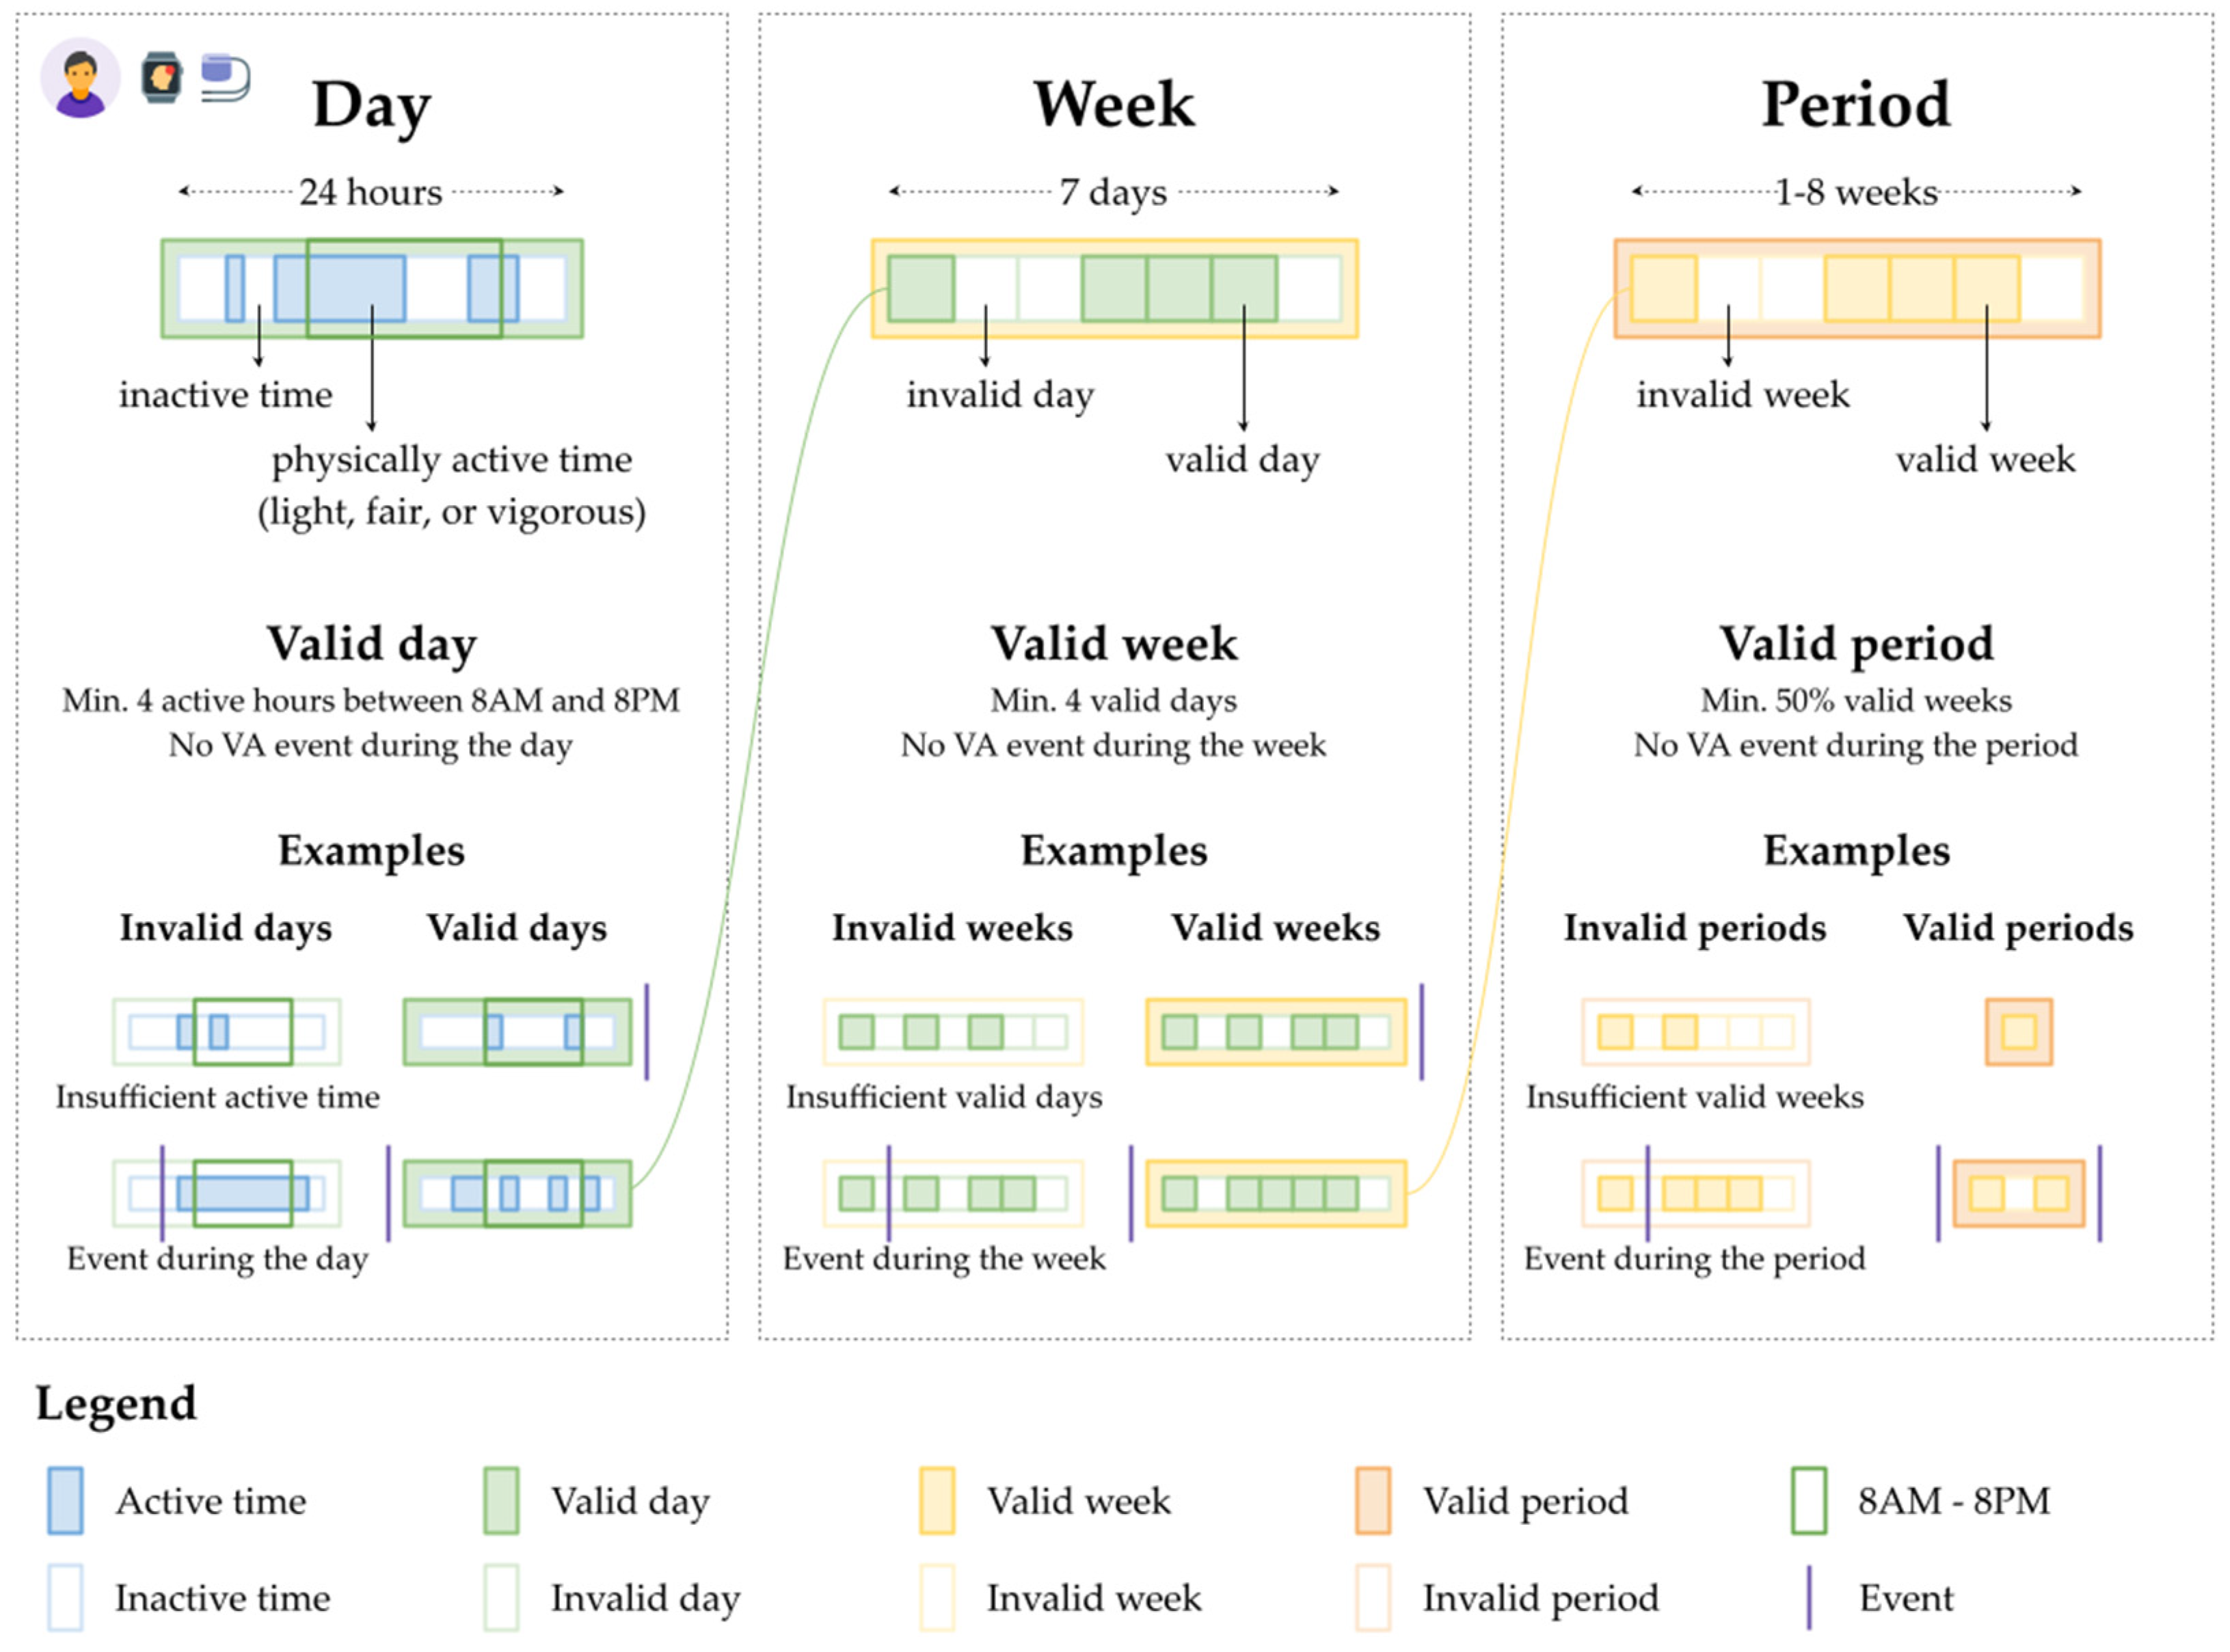
Appendix A.2. Data Quality Validation
- Scenario type 1: had a minimum of 18, 21, or 23 h of physical activity or sedentarism (three separate scenarios).
- Scenario type 2: had a minimum of 15, 30, or 45 min of physical activity (three separate scenarios).
- Scenario type 3: had a minimum of one, two, four, or eight hours of physical activity between 8 a.m. and 8 p.m. (four separate scenarios).
Appendix B
Appendix B.1. Descriptive Analysis
Appendix B.1.1. Data Quality
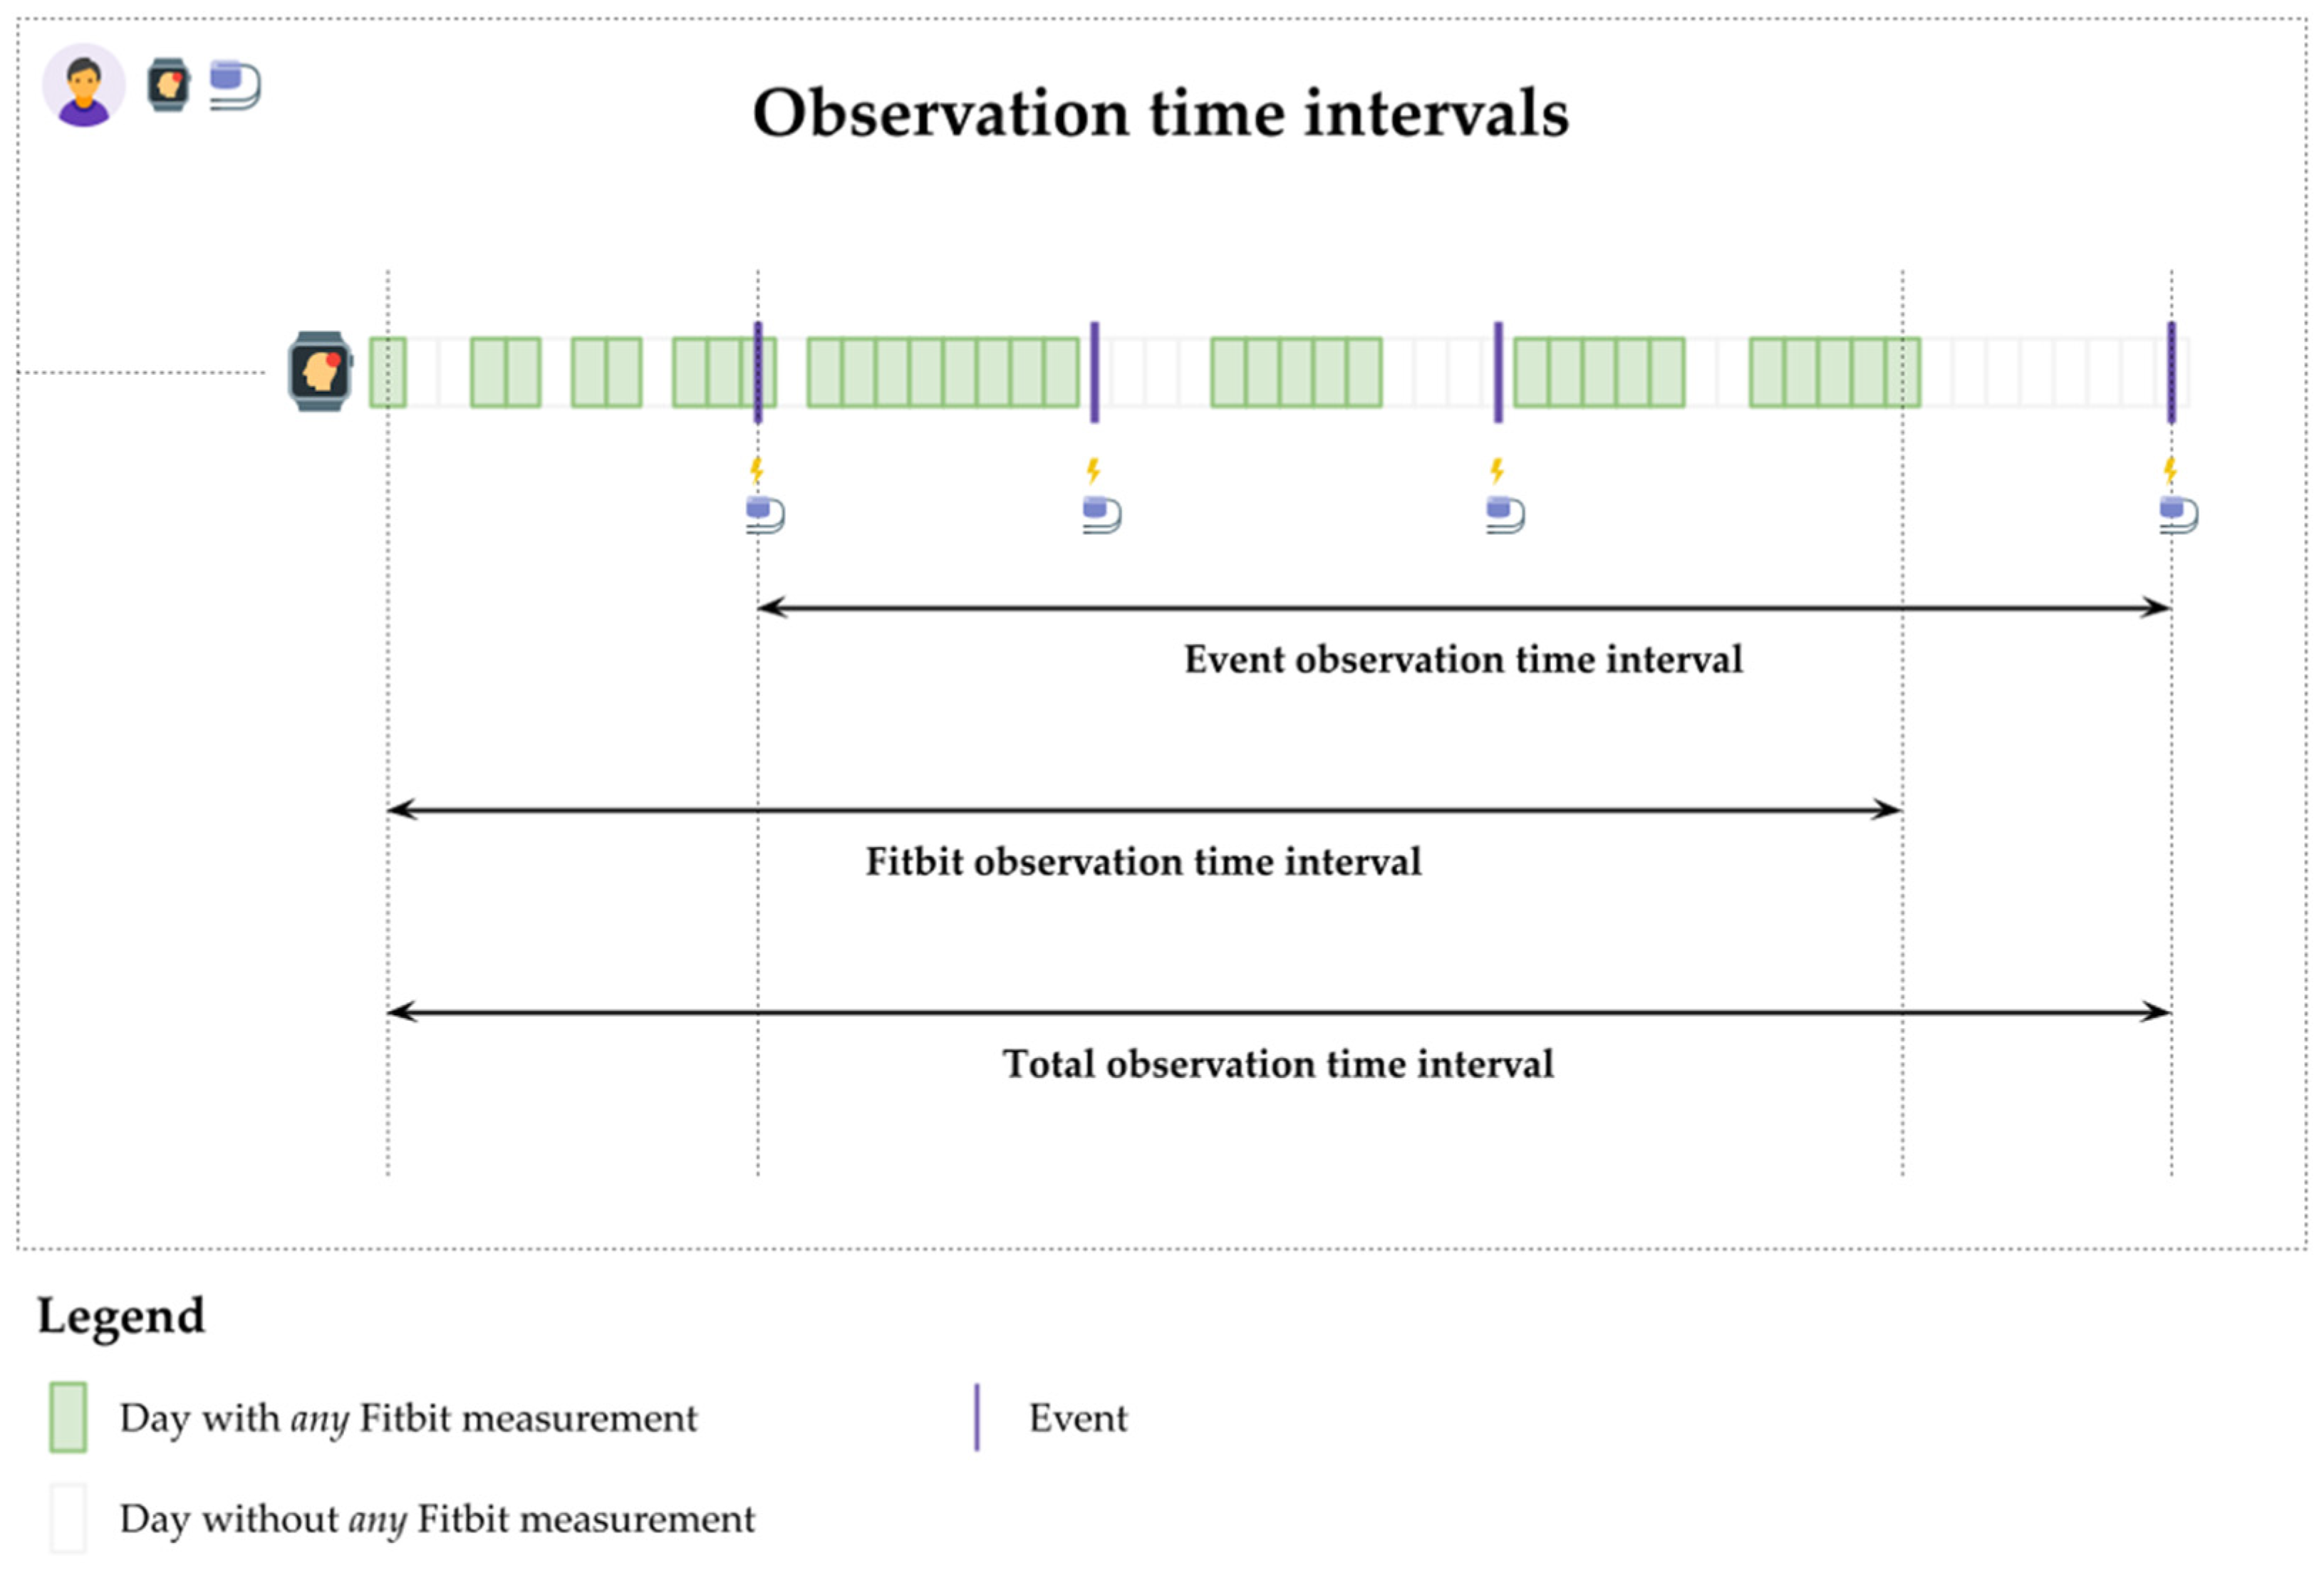
- Event observation time interval: the difference between the patient’s earliest and latest days with VA events.
- Fitbit observation time interval: the difference between the patient’s earliest and latest days with any Fitbit monitoring.
- Total observation interval: the difference between the patient’s earliest and latest days with either VA event, Fitbit monitoring, or both.

| Patient ID | Device Type | Events of Type | Event Observation Time Interval (Days) | ||||
|---|---|---|---|---|---|---|---|
| VT | VT1 | VT2 | VF-VT | Total | |||
| 1 | ICD | 0 | 6 | 0 | 0 | 6 | 4 |
| 4 | ICD | 1 | 0 | 0 | 0 | 1 | 1 |
| 5 | ICD | 1 | 0 | 0 | 5 | 6 | 419 |
| 7 | ICD | 0 | 0 | 0 | 1 | 1 | 1 |
| 9 | ICD | 0 | 0 | 0 | 1 | 1 | 1 |
| 11 | ICD | 0 | 2 | 0 | 3 | 5 | 1019 |
| 12 | CRT-D | 5 | 12 | 0 | 6 | 23 | 1034 |
| 13 | CRT-D | 2 | 0 | 0 | 3 | 5 | 642 |
| 14 | ICD | 0 | 0 | 0 | 1 | 1 | 1 |
| 15 | ICD | 0 | 0 | 0 | 6 | 6 | 2714 |
| 16 | ICD | 0 | 11 | 0 | 0 | 11 | 809 |
| 18 | ICD | 9 | 6 | 0 | 5 | 20 | 972 |
| 19 | ICD | 3 | 42 | 0 | 0 | 45 | 1718 |
| 20 | ICD | 35 | 90 | 0 | 2 | 127 | 869 |
| 22 | ICD | 0 | 0 | 0 | 1 | 1 | 1 |
| 25 | ICD | 0 | 3 | 0 | 0 | 3 | 829 |
| Sum | 56 | 172 | 0 | 34 | 262 | 11,034 | |
| Minimum | 0 | 0 | 0 | 0 | 1 | 1 | |
| Quartile 1 | 0 | 0 | 0 | 0 | 1 | 1 | |
| Quartile 2 | 0 | 1 | 0 | 1 | 5.5 | 725.5 | |
| Quartile 3 | 2.3 | 7.3 | 0 | 3.5 | 13.3 | 983.8 | |
| Maximum | 35 | 90 | 0 | 6 | 127 | 2714 | |
| Mean | 3.5 | 10.8 | 0 | 2.13 | 16.4 | 689.6 | |
| SD | 8.8 | 23.6 | 0 | 2.25 | 31.7 | 750.3 | |
| Patient ID | Event Observation Time Interval (Days) | Fitbit Observation Time Interval (Days) | Total Observation Time Interval (Days) |
|---|---|---|---|
| 1 | 4 | 193 | 330 |
| 2 | 0 | 966 | 966 |
| 3 | 0 | 120 | 120 |
| 4 | 1 | 960 | 960 |
| 5 | 419 | 364 | 1331 |
| 6 | 0 | 79 | 79 |
| 7 | 1 | 65 | 3428 |
| 8 | 0 | 567 | 567 |
| 9 | 1 | 519 | 519 |
| 10 | 0 | 261 | 261 |
| 11 | 1019 | 60 | 1019 |
| 12 | 1034 | 647 | 1147 |
| 13 | 642 | 357 | 1725 |
| 14 | 1 | 317 | 449 |
| 15 | 2714 | 332 | 3352 |
| 16 | 809 | 980 | 1092 |
| 17 | 0 | 99 | 99 |
| 18 | 972 | 326 | 993 |
| 19 | 1718 | 450 | 1718 |
| 20 | 869 | 801 | 1079 |
| 21 | 0 | 148 | 148 |
| 22 | 1 | 395 | 1739 |
| 23 | 0 | 98 | 98 |
| 24 | 0 | 136 | 136 |
| 25 | 829 | 842 | 1723 |
| 26 | 0 | 891 | 891 |
| 27 | 0 | 796 | 796 |
| Sum | 11,034 | 11,769 | 26,765 |
| Minimum | 0 | 60 | 79 |
| Quartile 1 | 0 | 142 | 295.5 |
| Quartile 2 | 1 | 357 | 960.0 |
| Quartile 3 | 819 | 721.5 | 1239 |
| Maximum | 2714 | 980 | 3428 |
| Mean | 408.7 | 435.9 | 991.3 |
| SD | 666.4 | 316.3 | 880.9 |
| Patient ID | Min. 18 h | Min. 21 h | Min. 23 h |
|---|---|---|---|
| Valid Days | Valid Days | Valid Days | |
| 1 | 122 | 122 | 122 |
| 2 | 0 | 0 | 0 |
| 3 | 0 | 0 | 0 |
| 4 | 819 | 819 | 819 |
| 5 | 57 | 57 | 57 |
| 6 | 0 | 0 | 0 |
| 7 | 37 | 37 | 37 |
| 8 | 0 | 0 | 0 |
| 9 | 185 | 185 | 185 |
| 10 | 0 | 0 | 0 |
| 11 | 45 | 45 | 45 |
| 12 | 543 | 543 | 543 |
| 13 | 105 | 105 | 105 |
| 14 | 306 | 306 | 306 |
| 15 | 5 | 5 | 5 |
| 16 | 890 | 890 | 890 |
| 17 | 0 | 0 | 0 |
| 18 | 218 | 218 | 218 |
| 19 | 263 | 263 | 263 |
| 20 | 167 | 167 | 167 |
| 21 | 0 | 0 | 0 |
| 22 | 329 | 329 | 329 |
| 23 | 0 | 0 | 0 |
| 24 | 0 | 0 | 0 |
| 25 | 51 | 51 | 51 |
| 26 | 0 | 0 | 0 |
| 27 | 0 | 0 | 0 |
| Sum | 4142 | 4142 | 4142 |
| Minimum | 0 | 0 | 0 |
| Quartile 1 | 0 | 0 | 0 |
| Quartile 2 | 45 | 45 | 45 |
| Quartile 3 | 201.5 | 201.5 | 201.5 |
| Maximum | 890 | 890 | 890 |
| Mean | 153.4 | 153.4 | 153.4 |
| SD | 243.2 | 243.2 | 243.2 |
| Patient ID | Min. 15 min | Min. 30 min | Min. 45 min |
|---|---|---|---|
| Valid Days | Valid Days | Valid Days | |
| 1 | 122 | 119 | 116 |
| 2 | 866 | 866 | 865 |
| 3 | 50 | 50 | 50 |
| 4 | 819 | 805 | 796 |
| 5 | 57 | 53 | 51 |
| 6 | 53 | 52 | 52 |
| 7 | 37 | 35 | 35 |
| 8 | 448 | 448 | 446 |
| 9 | 185 | 182 | 176 |
| 10 | 211 | 211 | 210 |
| 11 | 45 | 44 | 42 |
| 12 | 543 | 543 | 540 |
| 13 | 105 | 104 | 102 |
| 14 | 306 | 303 | 303 |
| 15 | 5 | 5 | 5 |
| 16 | 890 | 890 | 890 |
| 17 | 96 | 96 | 96 |
| 18 | 218 | 217 | 212 |
| 19 | 263 | 254 | 243 |
| 20 | 167 | 165 | 161 |
| 21 | 145 | 145 | 145 |
| 22 | 329 | 328 | 328 |
| 23 | 88 | 88 | 86 |
| 24 | 132 | 132 | 131 |
| 25 | 51 | 50 | 47 |
| 26 | 794 | 793 | 788 |
| 27 | 652 | 650 | 642 |
| Sum | 7677 | 7628 | 7558 |
| Minimum | 5 | 5 | 5 |
| Quartile 1 | 72.5 | 70.5 | 69 |
| Quartile 2 | 167 | 165 | 161 |
| Quartile 3 | 388.5 | 388 | 387 |
| Maximum | 890 | 890 | 890 |
| Mean | 284.3 | 282.5 | 279.9 |
| SD | 284.3 | 283.6 | 282.7 |
| Patient ID | Min. 1 h | Min. 2 h | Min. 4 h | Min. 8 h |
|---|---|---|---|---|
| Valid Days | Valid Days | Valid Days | Valid Days | |
| 1 | 115 | 112 | 96 | 13 |
| 2 | 864 | 843 | 468 | 0 |
| 3 | 48 | 47 | 31 | 0 |
| 4 | 787 | 740 | 531 | 72 |
| 5 | 50 | 44 | 33 | 4 |
| 6 | 47 | 44 | 22 | 0 |
| 7 | 32 | 31 | 23 | 10 |
| 8 | 442 | 425 | 286 | 0 |
| 9 | 166 | 157 | 148 | 60 |
| 10 | 204 | 170 | 28 | 0 |
| 11 | 42 | 36 | 28 | 1 |
| 12 | 537 | 505 | 278 | 2 |
| 13 | 101 | 92 | 33 | 0 |
| 14 | 303 | 302 | 250 | 5 |
| 15 | 4 | 4 | 3 | 0 |
| 16 | 890 | 890 | 883 | 606 |
| 17 | 96 | 89 | 15 | 0 |
| 18 | 207 | 176 | 52 | 2 |
| 19 | 238 | 222 | 180 | 29 |
| 20 | 159 | 152 | 135 | 27 |
| 21 | 143 | 139 | 54 | 0 |
| 22 | 327 | 324 | 306 | 128 |
| 23 | 80 | 59 | 3 | 0 |
| 24 | 128 | 74 | 5 | 0 |
| 25 | 46 | 44 | 39 | 1 |
| 26 | 769 | 645 | 148 | 0 |
| 27 | 611 | 407 | 8 | 0 |
| Sum | 7436 | 6773 | 4086 | 960 |
| Minimum | 4 | 4 | 3 | 0 |
| Quartile 1 | 65 | 53 | 25.5 | 0 |
| Quartile 2 | 159 | 152 | 52 | 1 |
| Quartile 3 | 384.5 | 365.5 | 215 | 11.5 |
| Maximum | 890 | 890 | 883 | 606 |
| Mean | 275.4 | 250.9 | 151.3 | 35.6 |
| SD | 280.0 | 262.3 | 205.2 | 117.7 |
Appendix B.1.2. Behavioral Markers
| Patient ID | Steps | Sed | Sed + Light | Light | Light + Fair | Fair | Fair + Vig | Vig | Active |
|---|---|---|---|---|---|---|---|---|---|
| 1 | 8178.3 | 1060.4 | 1356.7 | 296.3 | 306.1 | 32.4 | 88.3 | 81.6 | 365.0 |
| 2 | 6677.4 | 828.1 | 1364.0 | 537.1 | 538.8 | 21.0 | 59.8 | 58.3 | 577.6 |
| 3 | 14,322.4 | 746.6 | 1136.4 | 390.0 | 457.2 | 88.5 | 223.8 | 151.2 | 597.2 |
| 4 | 4743.4 | 952.8 | 1243.3 | 292.7 | 307.4 | 32.3 | 73.9 | 56.4 | 351.8 |
| 5 | 6641.7 | 1094.7 | 1370.3 | 275.8 | 281.1 | 23.1 | 60.7 | 57.6 | 319.5 |
| 6 | 7019.0 | 968.8 | 1239.3 | 270.8 | 379.7 | 122.5 | 193.0 | 81.5 | 456.7 |
| 7 | 10,293.7 | 909.1 | 1373.3 | 464.6 | 465.4 | 15.0 | 70.6 | 72.4 | 510.4 |
| 8 | 16,683.7 | 563.8 | 947.1 | 444.3 | 628.3 | 198.6 | 339.0 | 148.0 | 769.7 |
| 9 | 6269.9 | 737.3 | 1171.1 | 437.0 | 446.5 | 34.4 | 88.1 | 76.7 | 510.3 |
| 10 | 4256.0 | 775.0 | 1104.1 | 330.6 | 339.2 | 31.0 | 58.9 | 47.9 | 371.7 |
| 11 | 4402.0 | 870.7 | 1212.4 | 348.3 | 349.0 | 15.0 | 30.0 | 33.0 | 356.3 |
| 12 | 3377.2 | 851.3 | 1118.7 | 275.1 | 282.3 | 23.6 | 45.8 | 38.1 | 310.4 |
| 13 | 2879.0 | 1085.9 | 1313.4 | 228.0 | 228.1 | 15.0 | 21.0 | 20.0 | 231.0 |
| 14 | 9990.4 | 942.5 | 1222.0 | 280.6 | 294.7 | 31.5 | 81.6 | 67.2 | 356.4 |
| 15 | 5297.6 | 1018.4 | 1351.4 | 333.0 | 333.0 | 0.0 | 15.0 | 15.0 | 336.0 |
| 16 | 14,794.4 | 762.7 | 1317.4 | 554.8 | 582.4 | 40.1 | 121.2 | 93.7 | 672.2 |
| 17 | 8528.1 | 938.3 | 1372.3 | 434.1 | 440.0 | 21.1 | 67.8 | 62.5 | 494.1 |
| 18 | 4347.6 | 969.4 | 1195.7 | 227.2 | 232.5 | 27.2 | 42.2 | 33.0 | 246.5 |
| 19 | 5126.9 | 794.0 | 1111.8 | 321.2 | 325.6 | 28.2 | 41.6 | 34.7 | 342.0 |
| 20 | 5763.7 | 943.0 | 1368.3 | 425.5 | 426.5 | 20.0 | 39.3 | 38.5 | 443.2 |
| 21 | 7978.4 | 810.3 | 1266.1 | 459.2 | 470.4 | 24.2 | 52.3 | 41.6 | 507.9 |
| 22 | 11,148.7 | 945.2 | 1296.2 | 351.1 | 392.0 | 53.1 | 136.8 | 96.5 | 483.7 |
| 23 | 6012.7 | 1058.1 | 1351.7 | 294.4 | 320.1 | 52.5 | 79.4 | 48.9 | 354.4 |
| 24 | 9588.3 | 1037.7 | 1325.3 | 287.6 | 347.3 | 69.7 | 110.0 | 51.1 | 391.8 |
| 25 | 8115.4 | 1064.1 | 1391.4 | 327.4 | 330.3 | 25.0 | 41.5 | 37.1 | 355.0 |
| 26 | 9570.8 | 962.3 | 1344.3 | 382.2 | 407.9 | 52.3 | 83.7 | 55.4 | 455.4 |
| 27 | 5021.6 | 1070.5 | 1327.9 | 257.8 | 273.3 | 31.3 | 55.9 | 39.5 | 302.6 |
| Minimum | 2879.0 | 563.8 | 947.1 | 227.2 | 228.1 | 0.0 | 15.0 | 15.0 | 231.0 |
| Quartile 1 | 5074.3 | 819.2 | 1204.1 | 284.1 | 306.8 | 22.1 | 44.0 | 38.3 | 346.9 |
| Quartile 2 | 6677.4 | 943.0 | 1313.4 | 330.6 | 347.3 | 31.0 | 67.8 | 55.4 | 371.7 |
| Quartile 3 | 9579.6 | 1028.1 | 1354.2 | 429.8 | 443.3 | 46.2 | 88.2 | 74.6 | 501.0 |
| Maximum | 166,83.7 | 1094.7 | 1391.4 | 554.8 | 628.3 | 198.6 | 339.0 | 151.2 | 769.7 |
| Mean | 7667.7 | 917.1 | 1266.4 | 352.8 | 377.2 | 43.4 | 86.0 | 60.6 | 424.8 |
| SD | 3521.6 | 132.0 | 111.2 | 89.8 | 101.6 | 40.1 | 69.6 | 33.0 | 127.2 |
| Patient ID | Asleep | Awake | Restless | Asleep + Awake | Awake + Restless | Asleep + Restless | Sleep |
|---|---|---|---|---|---|---|---|
| 1 | 276.3 | 9.0 | 19.2 | 280.8 | 24.6 | 292.3 | 296.8 |
| 2 | 186.4 | 6.6 | 10.8 | 192.3 | 16.5 | 196.7 | 199.8 |
| 3 | 294.7 | 3.0 | 10.5 | 295.8 | 11.5 | 305.2 | 306.2 |
| 4 | 290.6 | 4.7 | 13.2 | 292.4 | 17.1 | 302.0 | 303.1 |
| 5 | 152.6 | 4.0 | 9.1 | 155.7 | 12.2 | 161.7 | 164.8 |
| 6 | 124.0 | 4.0 | 10.0 | 125.3 | 11.6 | 132.3 | 133.7 |
| 7 | 180.0 | 4.7 | 10.0 | 183.5 | 13.5 | 190.0 | 193.5 |
| 8 | 245.8 | 5.6 | 11.0 | 250.2 | 15.4 | 256.7 | 261.0 |
| 9 | 264.4 | 4.5 | 20.9 | 268.2 | 24.6 | 285.1 | 289.4 |
| 10 | 420.9 | 8.0 | 21.2 | 426.6 | 27.0 | 441.9 | 447.6 |
| 11 | 231.1 | 9.0 | 21.7 | 238.9 | 29.7 | 252.2 | 260.1 |
| 12 | 370.3 | 11.1 | 35.5 | 380.8 | 46.2 | 405.2 | 414.9 |
| 13 | 171.0 | 4.0 | 11.4 | 172.4 | 12.9 | 181.4 | 182.8 |
| 14 | 206.4 | 4.9 | 9.5 | 208.6 | 11.8 | 214.4 | 216.6 |
| 15 | 102.3 | 1.0 | 4.5 | 102.5 | 4.8 | 106.8 | 107.0 |
| 16 | 109.5 | 2.6 | 9.9 | 110.9 | 11.4 | 119.2 | 119.1 |
| 17 | 78.5 | 1.7 | 4.8 | 80.0 | 6.3 | 83.3 | 82.0 |
| 18 | 288.6 | 2.5 | 19.7 | 290.0 | 21.1 | 308.3 | 309.7 |
| 19 | 353.9 | 5.8 | 15.0 | 357.7 | 18.9 | 368.4 | 372.2 |
| 20 | 112.4 | 2.3 | 9.1 | 113.2 | 9.9 | 121.1 | 121.1 |
| 21 | 113.8 | 4.0 | 15.3 | 115.9 | 17.3 | 128.6 | 130.6 |
| 22 | 159.3 | 3.6 | 10.2 | 161.8 | 12.6 | 169.5 | 166.9 |
| 23 | 130.7 | 2.3 | 8.1 | 131.8 | 9.2 | 138.8 | 139.9 |
| 24 | 127.0 | 2.3 | 5.4 | 127.7 | 6.1 | 132.4 | 126.5 |
| 25 | 101.3 | 2.5 | 7.4 | 101.8 | 8.1 | 106.5 | 107.0 |
| 26 | 138.1 | 2.3 | 10.7 | 138.9 | 11.7 | 148.1 | 146.8 |
| 27 | 214.1 | 5.7 | 12.7 | 216.6 | 15.4 | 225.3 | 226.1 |
| Minimum | 78.5 | 1.0 | 4.5 | 80.0 | 4.8 | 83.3 | 82.0 |
| Quartile 1 | 125.5 | 2.5 | 9.3 | 126.5 | 11.5 | 132.4 | 132.2 |
| Quartile 2 | 180.0 | 4.0 | 10.7 | 183.5 | 12.9 | 190.0 | 193.5 |
| Quartile 3 | 270.4 | 5.7 | 15.2 | 274.5 | 18.1 | 288.7 | 293.1 |
| Maximum | 420.9 | 11.1 | 35.5 | 426.6 | 46.2 | 441.9 | 447.6 |
| Mean | 201.6 | 4.5 | 12.8 | 204.5 | 15.8 | 213.8 | 215.8 |
| SD | 92.4 | 2.5 | 6.7 | 94.0 | 8.8 | 97.5 | 99.6 |
| Patient ID | MinHR | MeanHR | MedianHR | MaxHR | SDHR |
|---|---|---|---|---|---|
| 1 | 45.1 | 57.2 | 50.9 | 115.3 | 4.2 |
| 2 | 62.3 | 94.0 | 94.5 | 134.8 | 3.7 |
| 3 | 49.9 | 73.7 | 69.1 | 129.2 | 5.8 |
| 4 | 51.6 | 69.1 | 65.8 | 125.0 | 4.8 |
| 5 | 46.7 | 65.0 | 61.1 | 116.7 | 5.4 |
| 6 | 43.5 | 65.4 | 58.6 | 123.5 | 5.8 |
| 7 | 56.4 | 85.5 | 84.7 | 135.1 | 4.1 |
| 8 | 54.8 | 84.0 | 81.1 | 148.1 | 4.7 |
| 9 | 58.2 | 81.1 | 78.2 | 127.3 | 4.2 |
| 10 | 43.3 | 61.8 | 58.7 | 122.5 | 3.8 |
| 11 | 48.0 | 63.6 | 62.5 | 102.9 | 2.8 |
| 12 | 50.9 | 67.1 | 63.8 | 120.0 | 4.2 |
| 13 | 53.0 | 63.1 | 60.4 | 111.4 | 3.6 |
| 14 | 39.6 | 54.7 | 51.7 | 115.8 | 3.9 |
| 15 | 45.2 | 63.6 | 63.0 | 102.0 | 2.9 |
| 16 | 53.2 | 75.6 | 72.1 | 152.5 | 5.1 |
| 17 | 48.4 | 69.4 | 65.7 | 126.9 | 4.5 |
| 18 | 43.5 | 57.0 | 55.4 | 111.1 | 3.8 |
| 19 | 52.7 | 65.8 | 61.3 | 114.0 | 3.5 |
| 20 | 68.0 | 82.9 | 81.2 | 118.7 | 2.6 |
| 21 | 60.3 | 77.6 | 75.7 | 131.0 | 3.2 |
| 22 | 49.7 | 69.2 | 63.4 | 132.0 | 4.8 |
| 23 | 47.7 | 67.5 | 63.8 | 136.8 | 4.0 |
| 24 | 39.5 | 55.6 | 50.4 | 144.8 | 6.1 |
| 25 | 47.5 | 63.7 | 61.3 | 116.6 | 4.1 |
| 26 | 49.9 | 71.2 | 69.1 | 137.0 | 3.9 |
| 27 | 49.5 | 65.6 | 63.7 | 120.8 | 3.8 |
| Minimum | 39.5 | 54.7 | 50.4 | 102.0 | 2.6 |
| Quartile 1 | 46.0 | 63.6 | 60.8 | 116.2 | 3.8 |
| Quartile 2 | 49.7 | 67.1 | 63.7 | 123.5 | 4.1 |
| Quartile 3 | 53.1 | 74.7 | 70.6 | 133.4 | 4.8 |
| Maximum | 68.0 | 94.0 | 94.5 | 152.5 | 6.1 |
| Mean | 50.3 | 69.3 | 66.2 | 124.9 | 4.2 |
| SD | 6.7 | 9.8 | 10.7 | 12.7 | 0.9 |
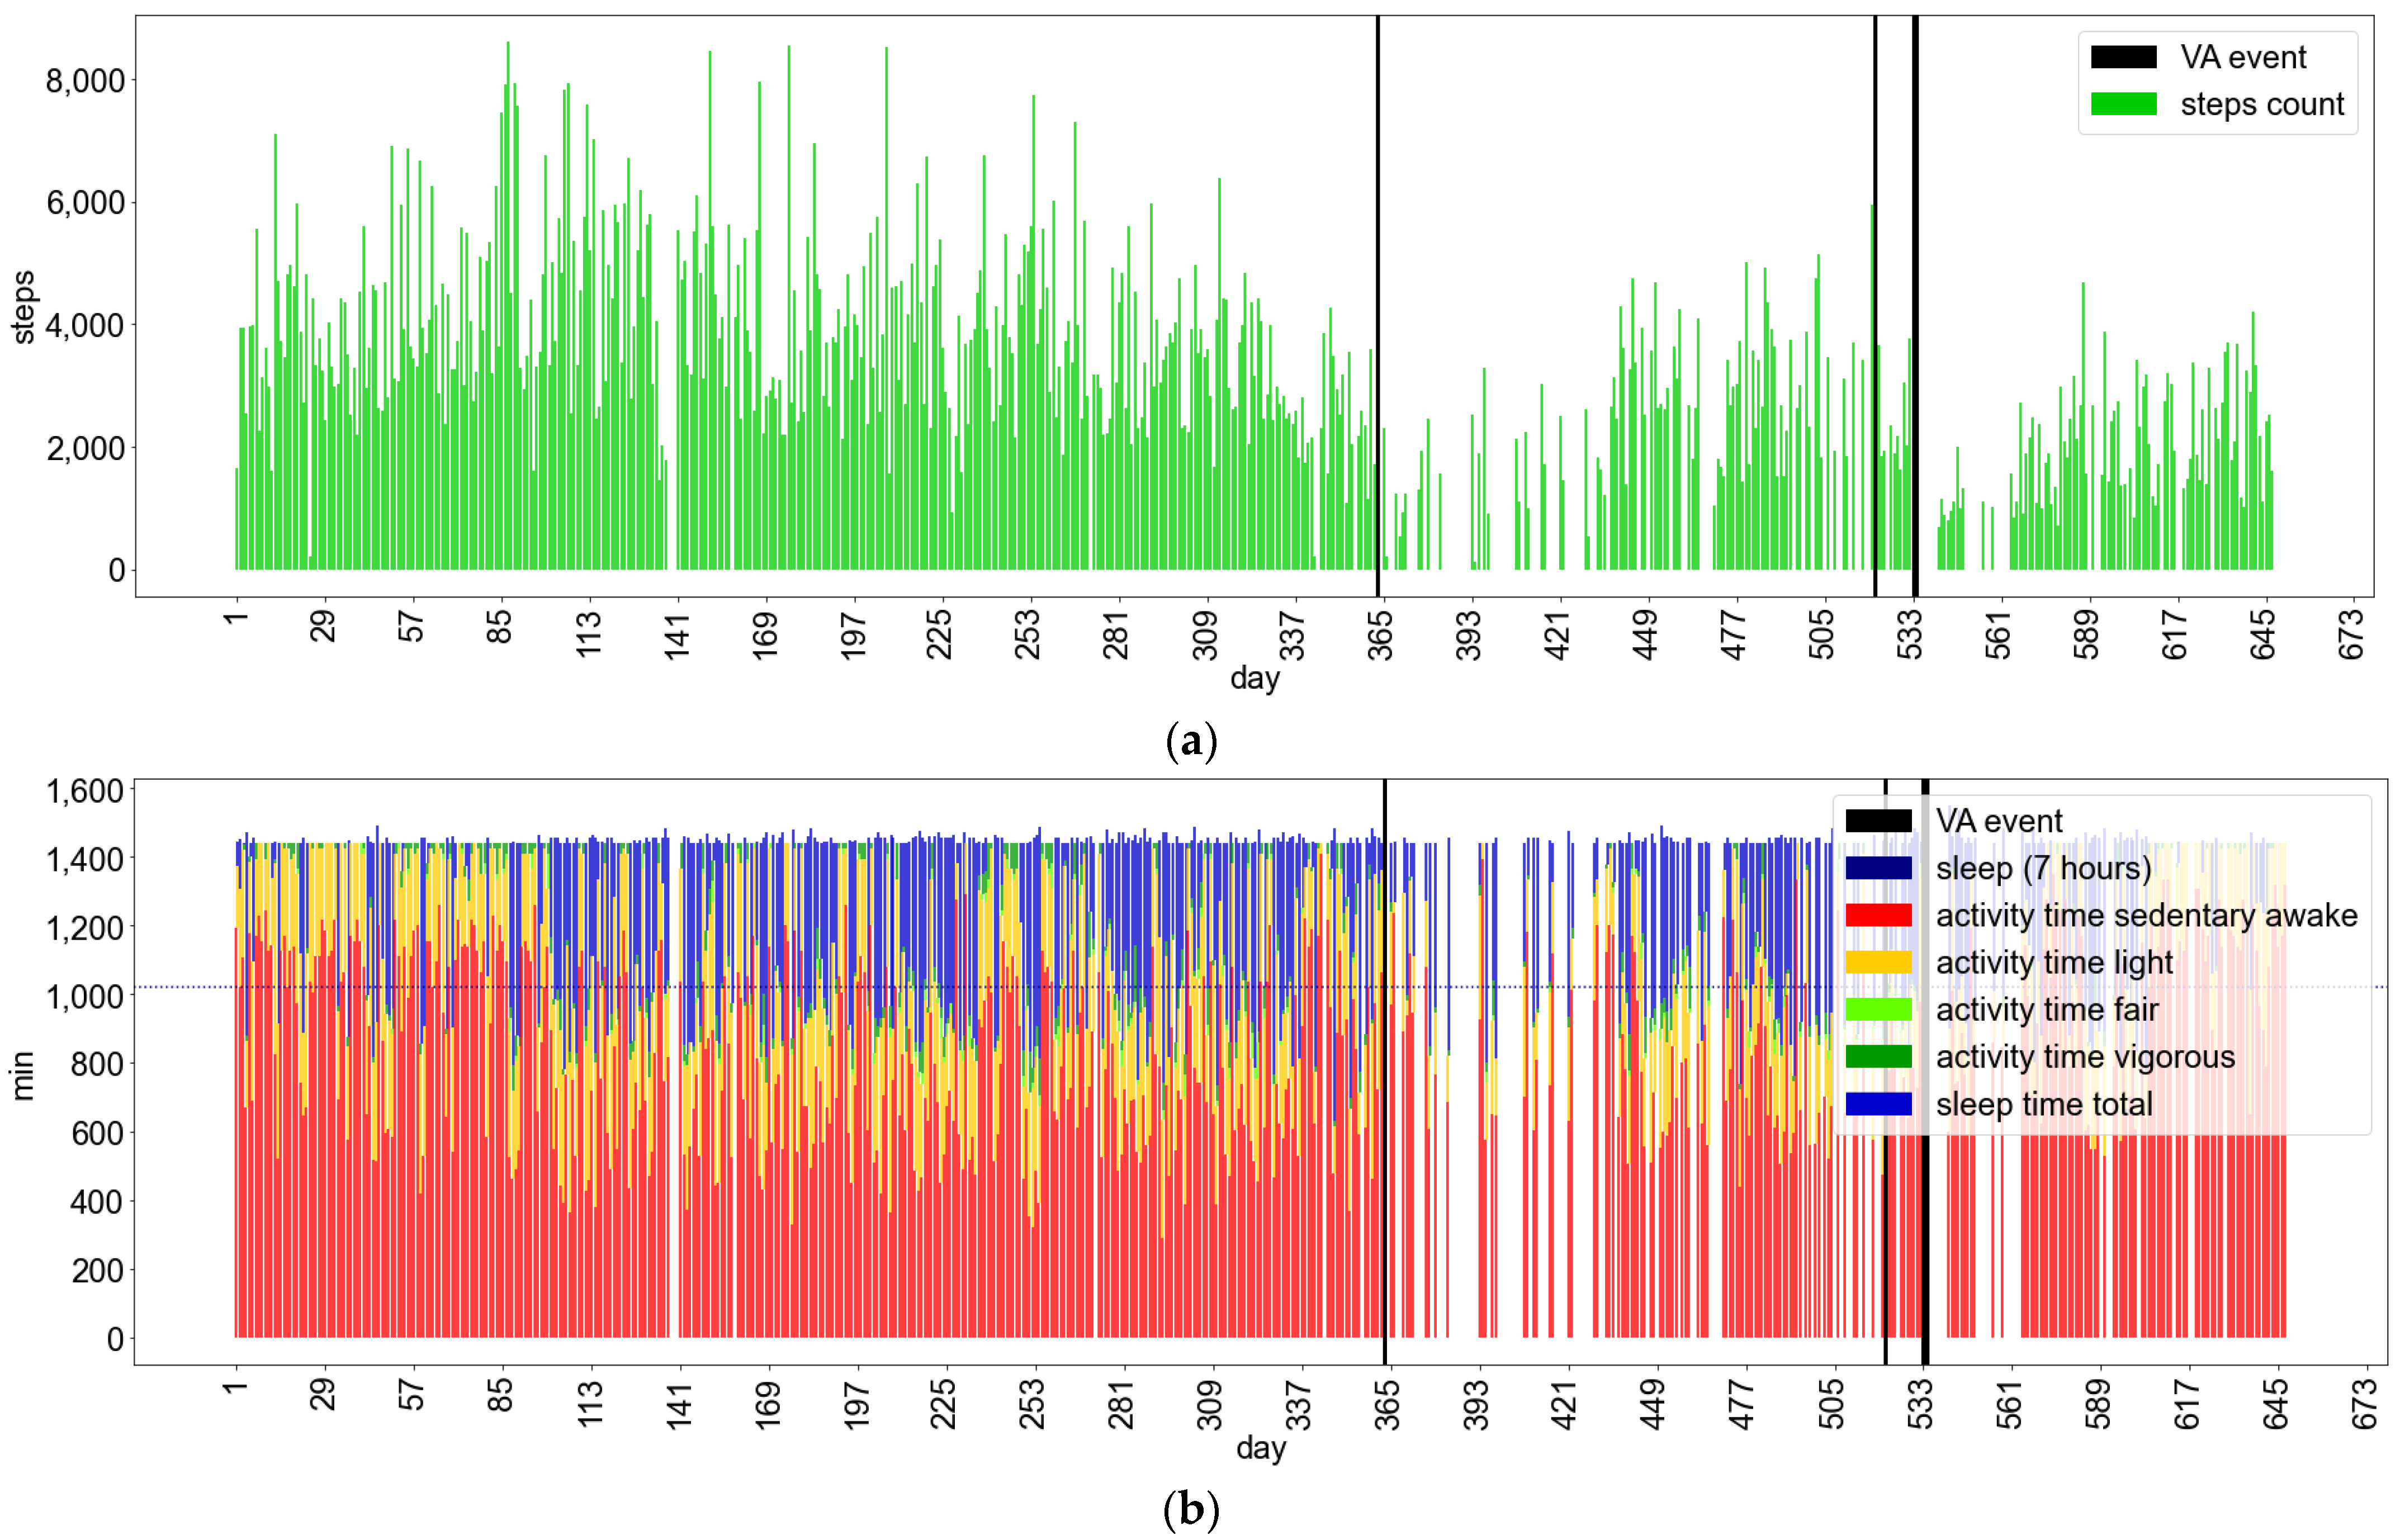
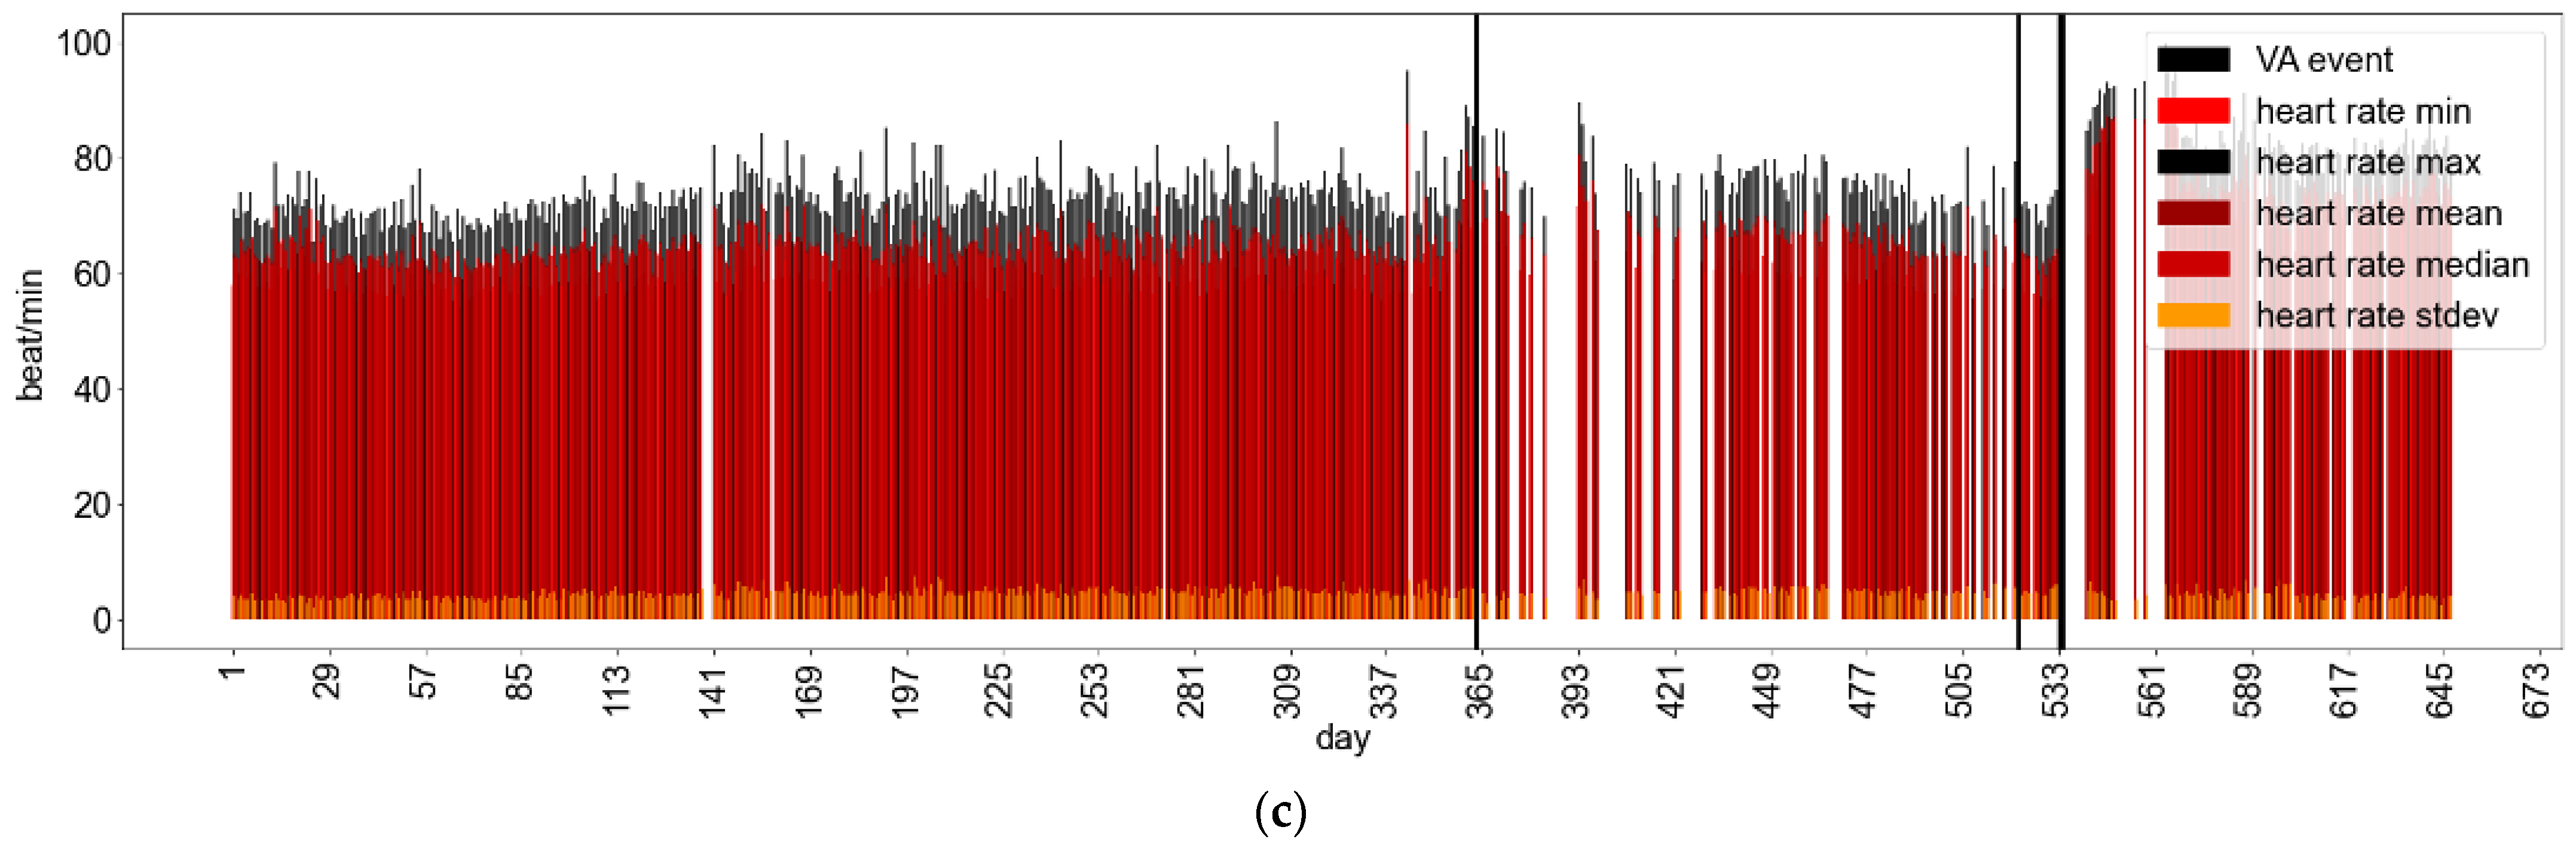
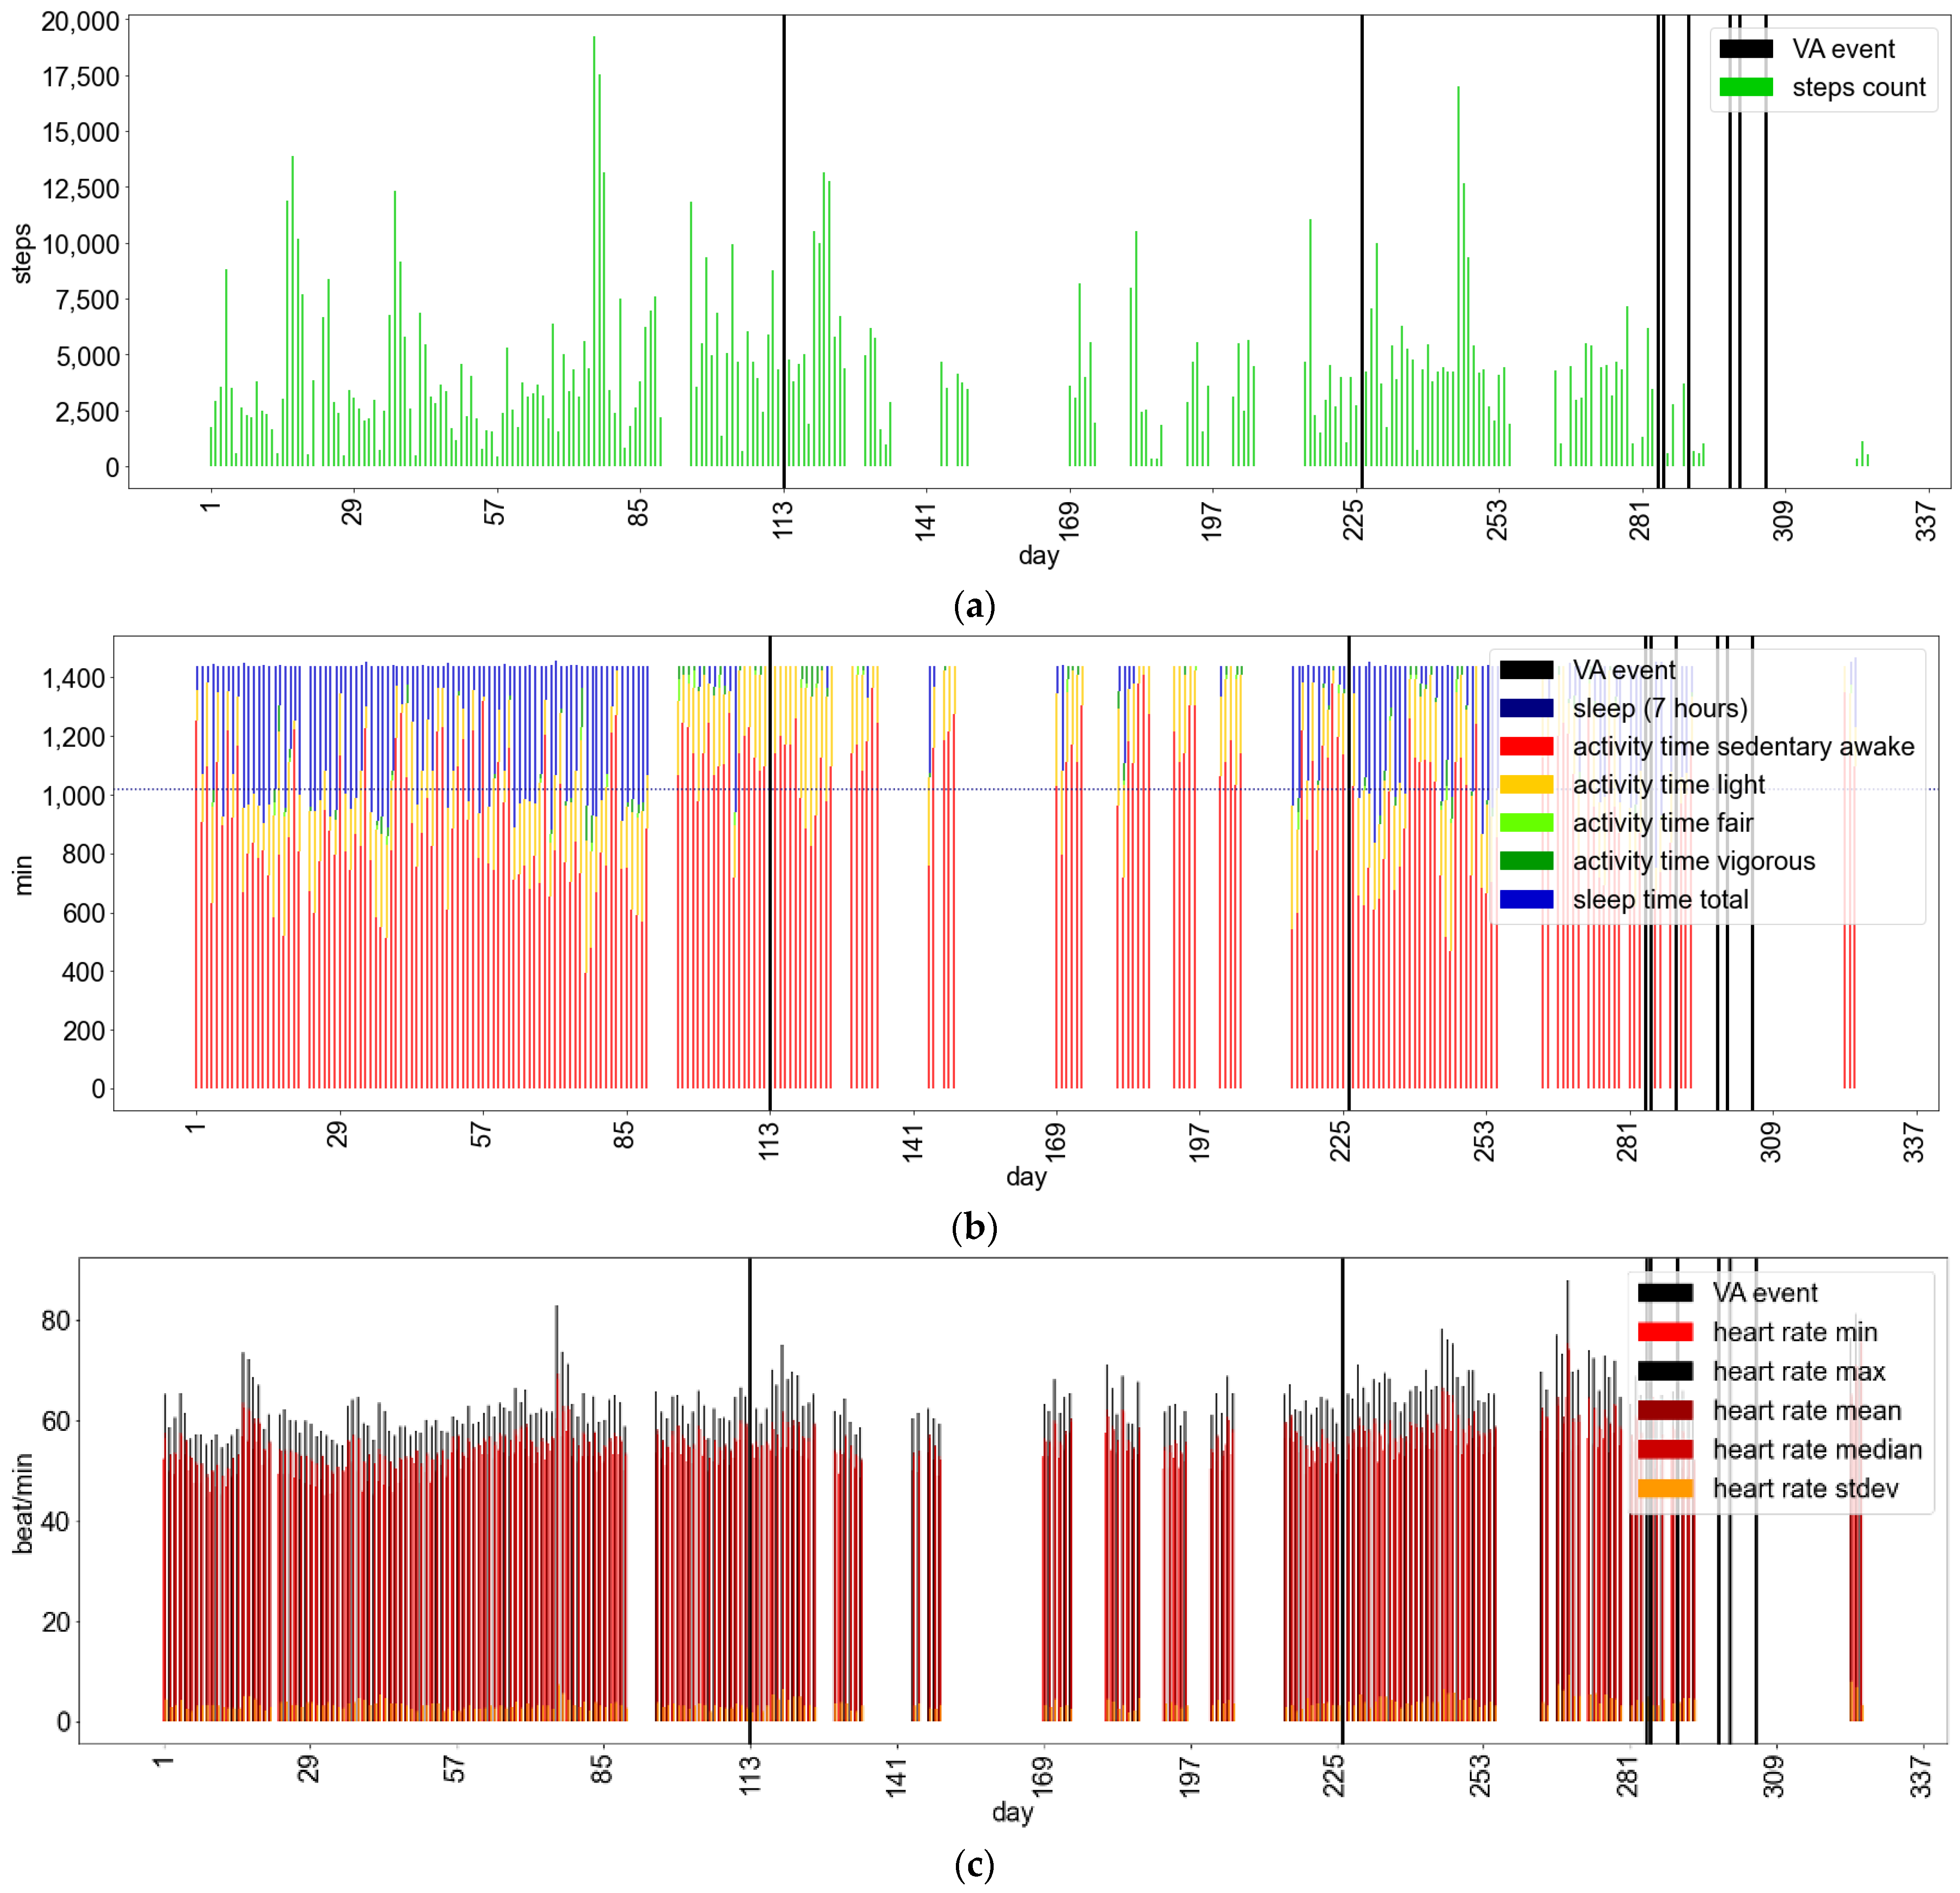
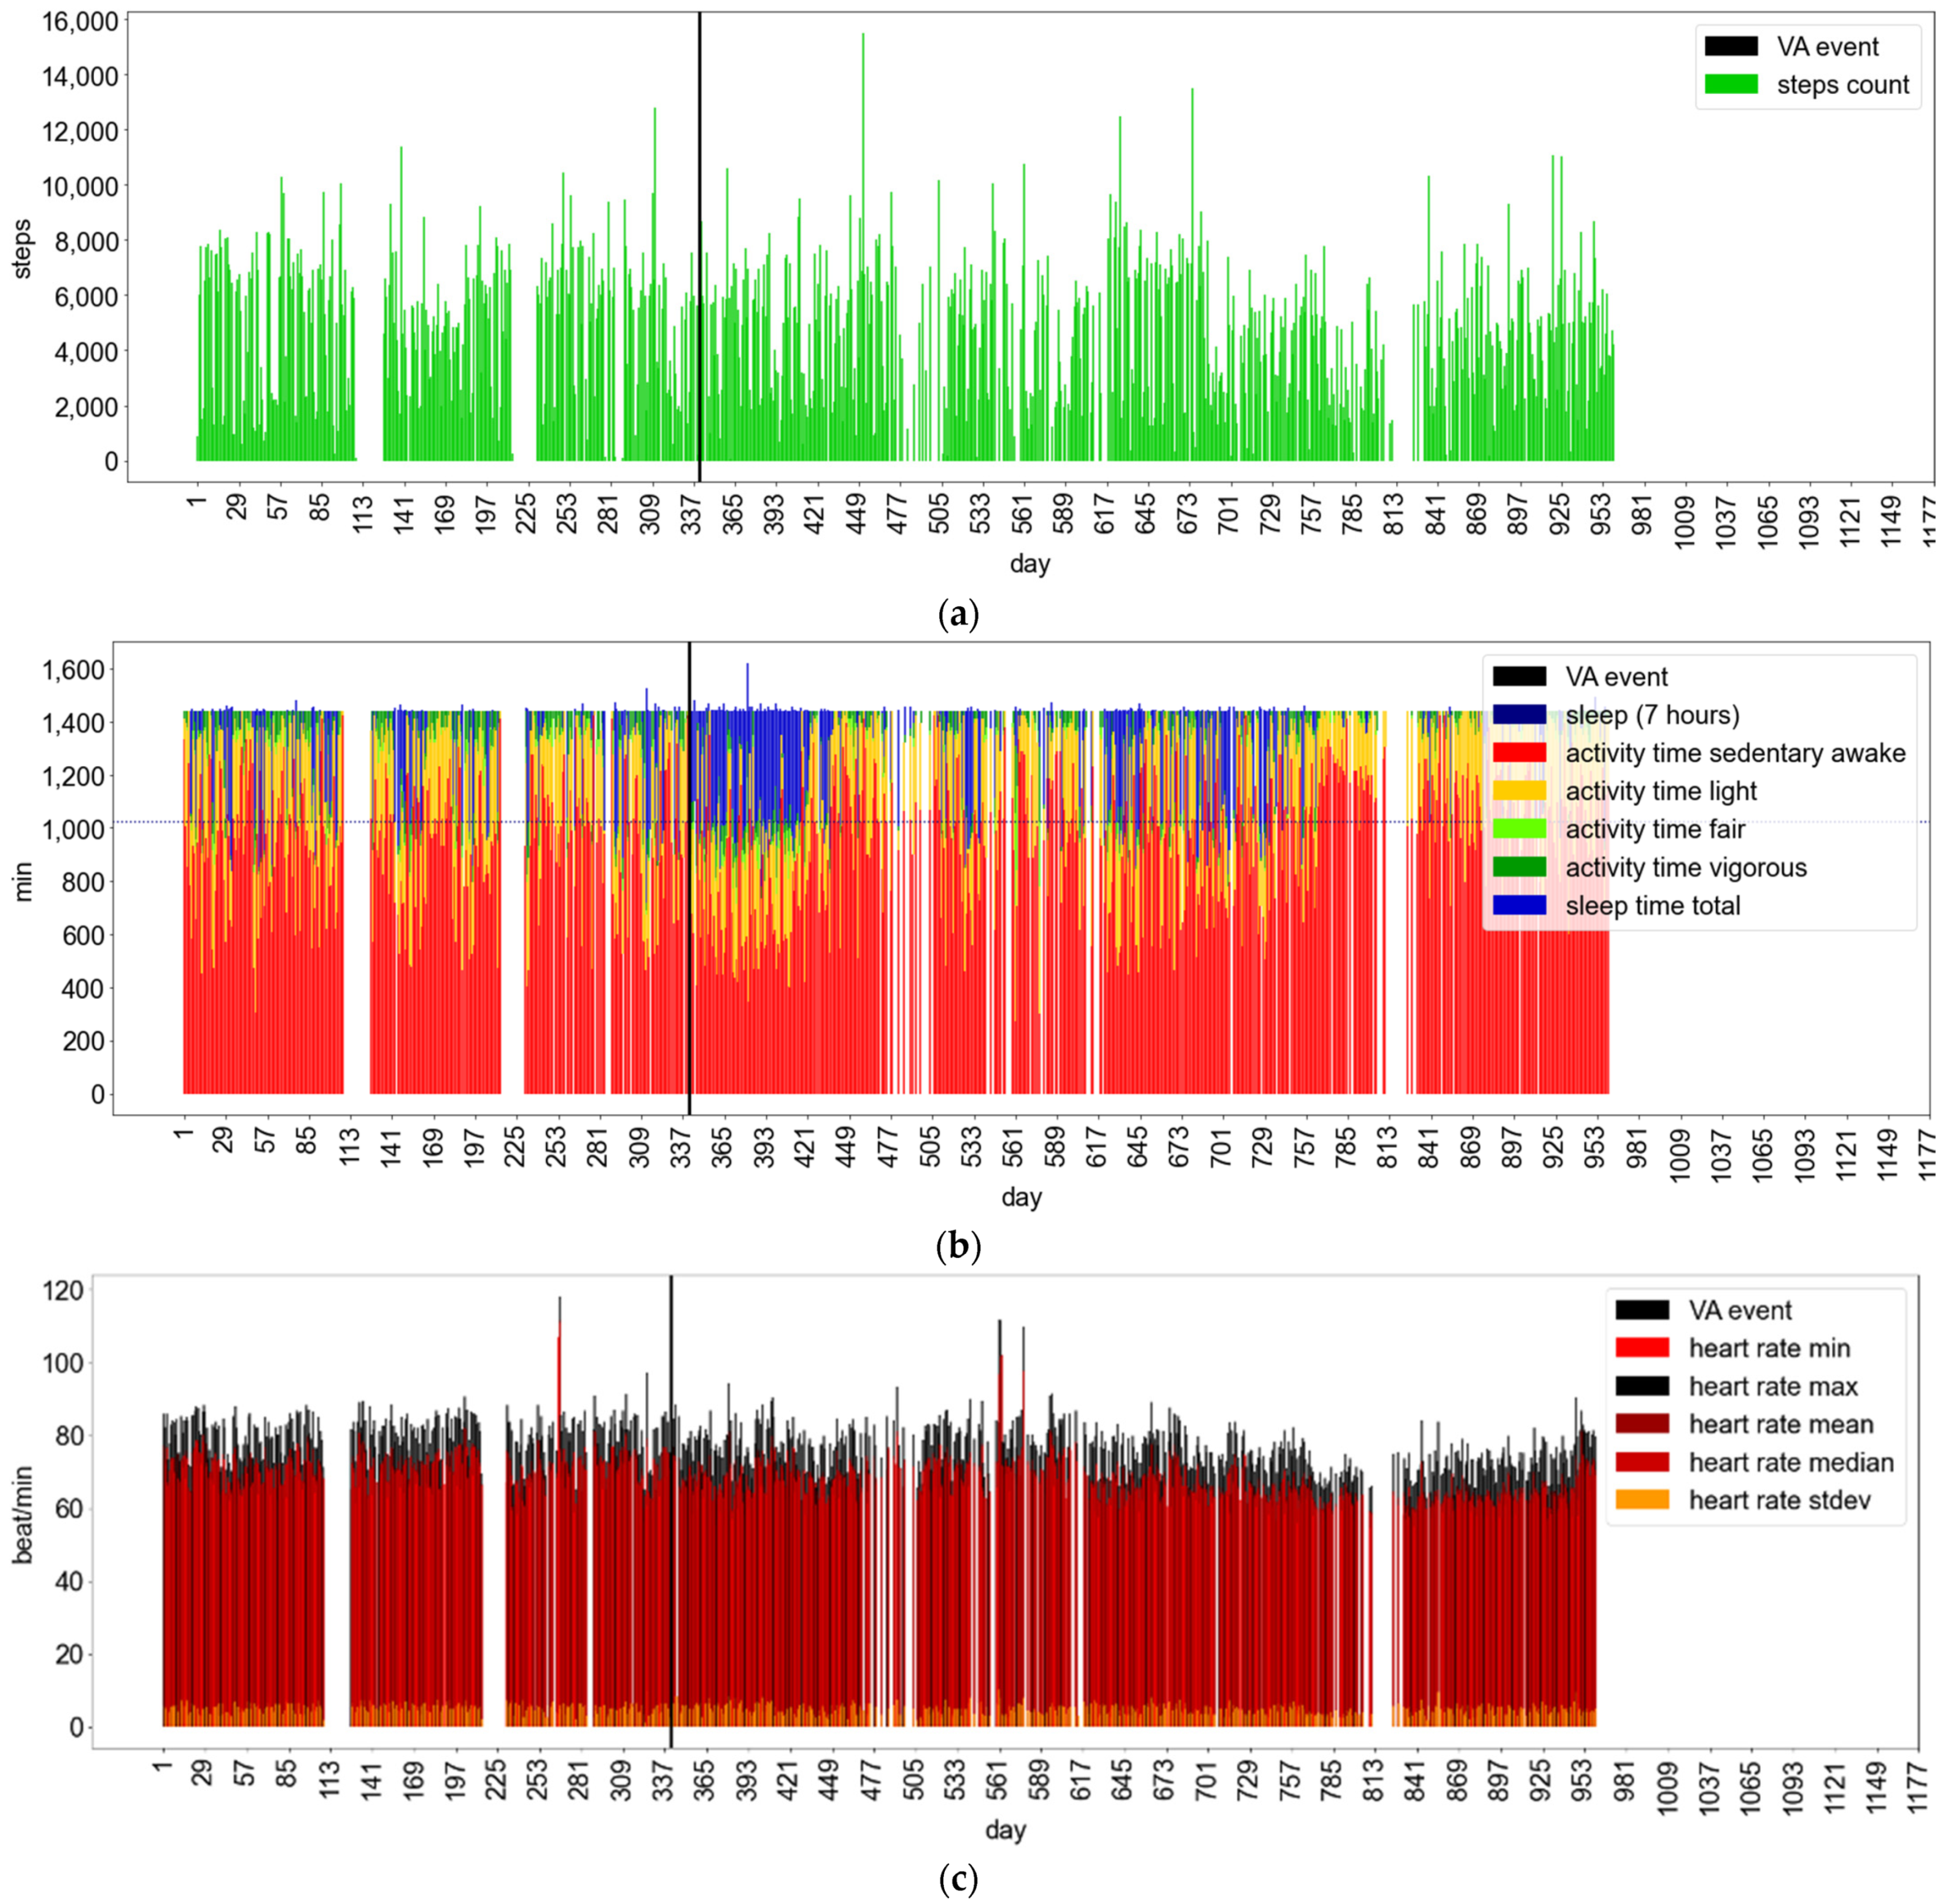
Appendix B.1.3. Fitbit Wear and VA Events: Examples of Patient Behavioral Patterns


Appendix B.2. Inferential Analysis
| Behavior | Separate | Combined | Result | ||
|---|---|---|---|---|---|
| OR | p | OR | p | OR | |
| Steps | - | - | 1.000 | <0.001 | Inconclusive |
| Sed 1 | - | - | 1.004 | 0.003 | OR > 1 |
| Sed + Light 1 | - | - | 1.004 | 0.003 | OR > 1 |
| Light | 1.013 | 0.008 | 1.004 | 0.003 | OR > 1 |
| Light + Fair | 1.012 | 0.012 | 1.008 | <0.001 | OR > 1 |
| Fair | - | - | - | - | Inconclusive |
| Fair + Vig | - | - | - | - | Inconclusive |
| Vig | - | - | - | - | Inconclusive |
| Asleep | - | - | - | - | Inconclusive |
| Awake | - | - | 0.800 | 0.001 | OR < 1 |
| Restless | - | - | - | - | Inconclusive |
| Asleep + Awake | - | - | 0.800 | 0.001 | OR < 1 |
| Awake + Restless | - | - | 0.802 | 0.001 | OR < 1 |
| Asleep + Restless | - | - | - | - | Inconclusive |
| Sleep | 0.014 | 0.023 | 0.991 | <0.001 | OR < 1 |
| MinHR | 2.307 | 0.003 | 1.119 | <0.001 | OR > 1 |
| MeanHR | 1.591 | 0.002 | 1.126 | <0.001 | OR > 1 |
| MedianHR | 1.605 | 0.010 | 1.129 | <0.001 | OR > 1 |
| MaxHR | 33.909 | <0.001 | 1.045 | <0.001 | OR > 1 |
| SDHR | - | - | - | - | Inconclusive |
| Behavior | Separate | Combined | Result | ||
|---|---|---|---|---|---|
| OR | p | OR | p | OR | |
| Steps | - | - | 1.000 | <0.001 | Inconclusive |
| Sed 1 | - | - | 1.004 | 0.007 | OR > 1 |
| Sed + Light 1 | - | - | 1.004 | 0.006 | OR > 1 |
| Light | 1.013 | 0.014 | 1.009 | <0.001 | OR > 1 |
| Light + Fair | 1.012 | 0.019 | 1.008 | <0.001 | OR > 1 |
| Fair | - | - | - | - | Inconclusive |
| Fair + Vig | - | - | - | - | Inconclusive |
| Vig | - | - | - | - | Inconclusive |
| Asleep | - | - | - | - | Inconclusive |
| Awake | - | - | 0.815 | 0.003 | OR < 1 |
| Restless | - | - | - | - | Inconclusive |
| Asleep + Awake | - | - | 0.802 | 0.001 | OR < 1 |
| Awake + Restless | - | - | 0.817 | 0.001 | OR < 1 |
| Asleep + Restless | - | - | - | - | Inconclusive |
| Sleep | 0.014 | 0.023 | 0.991 | <0.001 | OR < 1 |
| MinHR | 2.307 | 0.003 | 1.119 | <0.001 | OR > 1 |
| MeanHR | 1.591 | 0.002 | 1.126 | <0.001 | OR > 1 |
| MedianHR | 1.605 | 0.010 | 1.129 | <0.001 | OR > 1 |
| MaxHR | 33.909 | <0.001 | 1.046 | <0.001 | OR > 1 |
| SDHR | - | - | - | - | Inconclusive |
| Behavior | Separate | Combined | Result | ||
|---|---|---|---|---|---|
| OR | p | OR | p | OR | |
| Steps | 0.987 | <0.001 | 1.000 | 0.002 | Inconclusive |
| Sed 1 | 0.065 | <0.001 | 1.004 | 0.007 | Inconclusive |
| Sed + Light 1 | 0.063 | 0.012 | 1.004 | 0.006 | Inconclusive |
| Light | 1.009 | 0.017 | 1.010 | <0.001 | OR > 1 |
| Light + Fair | 1.008 | 0.025 | 1.010 | <0.001 | OR > 1 |
| Fair | 0.001 | <0.001 | 0.973 | 0.016 | OR < 1 |
| Fair + Vig | 0.260 | <0.001 | 0.991 | 0.013 | OR < 1 |
| Vig | 0.104 | <0.001 | 0.988 | 0.024 | OR < 1 |
| Asleep | - | - | - | - | Inconclusive |
| Awake | - | - | 0.788 | 0.003 | OR < 1 |
| Restless | - | - | - | - | Inconclusive |
| Asleep + Awake | - | - | 0.788 | 0.003 | OR < 1 |
| Awake + Restless | - | - | 0.791 | 0.003 | OR < 1 |
| Asleep + Restless | - | - | - | - | Inconclusive |
| Sleep | 0.001 | <0.001 | 0.991 | 0.001 | OR < 1 |
| MinHR | 1.107 | 0.046 | 1.119 | <0.001 | OR > 1 |
| MeanHR | 1.270 | 0.003 | 1.139 | <0.001 | OR > 1 |
| MedianHR | 1.244 | 0.016 | 1.140 | <0.001 | OR > 1 |
| MaxHR | 1.072 | 0.048 | 1.048 | <0.001 | OR > 1 |
| SDHR | - | - | - | - | Inconclusive |
| Behavior | Scenario Type 1 | Scenario Type 2 | Scenario Type 3 | Result |
|---|---|---|---|---|
| OR | OR | OR | OR | |
| Steps | Inconclusive | Inconclusive | Inconclusive | Inconclusive |
| Sed 1 | OR > 1 | OR > 1 | Inconclusive | OR > 1 |
| Sed + Light 1 | OR > 1 | OR > 1 | Inconclusive | OR > 1 |
| Light | OR > 1 | OR > 1 | OR > 1 | OR > 1 |
| Light + Fair | OR > 1 | OR > 1 | OR > 1 | OR > 1 |
| Fair | Inconclusive | Inconclusive | OR < 1 | OR < 1 |
| Fair + Vig | Inconclusive | Inconclusive | OR < 1 | OR < 1 |
| Vig | Inconclusive | Inconclusive | OR < 1 | OR < 1 |
| Asleep | Inconclusive | Inconclusive | Inconclusive | Inconclusive |
| Awake | OR < 1 | OR < 1 | OR < 1 | OR < 1 |
| Restless | Inconclusive | Inconclusive | Inconclusive | Inconclusive |
| Asleep + Awake | OR < 1 | OR < 1 | OR < 1 | OR < 1 |
| Awake + Restless | OR < 1 | OR < 1 | OR < 1 | OR < 1 |
| Asleep + Restless | Inconclusive | Inconclusive | Inconclusive | Inconclusive |
| Sleep | OR < 1 | OR < 1 | OR < 1 | OR < 1 |
| MeanHR | OR > 1 | OR > 1 | OR > 1 | OR > 1 |
| MedianHR | OR > 1 | OR > 1 | OR > 1 | OR > 1 |
| MinHR | OR > 1 | OR > 1 | OR > 1 | OR > 1 |
| MaxHR | OR > 1 | OR > 1 | OR > 1 | OR > 1 |
| SDHR | Inconclusive | Inconclusive | Inconclusive | Inconclusive |
| Behavior | Duration | Separate | Combined | ||||
|---|---|---|---|---|---|---|---|
| OR | p | Model | OR | p | Model | ||
| Steps | 4 weeks | - | - | - | 1.000 | 0.036 | 2 |
| 5 weeks | - | - | - | 1.000 | 0.019 | 2 | |
| 6 weeks | 0.997 | <0.001 | 2 | 1.000 | 0.008 | 2 | |
| 7 weeks | 0.987 | <0.001 | 2 | 1.000 | 0.002 | 2 | |
| 8 weeks | - | - | - | 1.000 | 0.002 | 2 | |
| Light | 1 weeks | 1.006 | 0.033 | 2 | 1.006 | 0.033 | 2 |
| 2 weeks | 1.009 | 0.017 | 3 | 1.008 | 0.001 | 2 | |
| 3 weeks | 1.013 | 0.038 | 3 | 1.009 | <0.001 | 3 | |
| 4 weeks | - | - | - | 1.010 | <0.001 | 1 | |
| 5 weeks | - | - | - | 1.010 | <0.001 | 1 | |
| 6 weeks | - | - | - | 1.008 | <0.001 | 3 | |
| 7 weeks | - | - | - | 1.009 | <0.001 | 3 | |
| 8 weeks | - | - | - | 1.009 | <0.001 | 3 | |
| Light + Fair | 1 weeks | 1.006 | 0.048 | 2 | 1.006 | 0.048 | 2 |
| 2 weeks | 1.008 | 0.025 | 2 | 1.008 | 0.002 | 2 | |
| 3 weeks | - | - | - | 1.008 | <0.001 | 2 | |
| 4 weeks | - | - | - | 1.009 | <0.001 | 1 | |
| 5 weeks | - | - | - | 1.010 | <0.001 | 1 | |
| 6 weeks | - | - | - | 1.008 | <0.001 | 3 | |
| 7 weeks | 1.076 | 0.015 | 1 | 1.008 | <0.001 | 3 | |
| 8 weeks | - | - | - | 1.008 | <0.001 | 3 | |
| Fair | 4 weeks | - | - | - | 0.972 | 0.033 | 1 |
| 5 weeks | - | - | - | 0.972 | 0.022 | 1 | |
| 6 weeks | 0.001 | <0.001 | 2 | 0.974 | 0.021 | 1 | |
| 7 weeks | 0.028 | <0.001 | 2 | 0.975 | 0.021 | 1 | |
| 8 weeks | - | - | - | 0.973 | 0.016 | 1 | |
| Fair + Vig | 2 weeks | - | - | - | 0.988 | 0.042 | 1 |
| 3 weeks | - | - | - | 0.989 | 0.029 | 1 | |
| 4 weeks | - | - | - | 0.990 | 0.021 | 1 | |
| 5 weeks | - | - | - | 0.990 | 0.015 | 1 | |
| 6 weeks | 0.819 | <0.001 | 2 | 0.991 | 0.017 | 1 | |
| 7 weeks | 0.260 | <0.001 | 2 | 0.991 | 0.019 | 1 | |
| 8 weeks | - | - | - | 0.991 | 0.013 | 1 | |
| Vig | 2 weeks | - | - | - | 0.984 | 0.044 | 3 |
| 3 weeks | - | - | - | 0.986 | 0.036 | 3 | |
| 4 weeks | - | - | - | 0.987 | 0.029 | 1 | |
| 5 weeks | - | - | - | 0.987 | 0.025 | 1 | |
| 6 weeks | - | - | - | 0.988 | 0.028 | 1 | |
| 7 weeks | 0.104 | <0.001 | 2 | 0.989 | 0.034 | 1 | |
| 8 weeks | - | - | - | 0.988 | 0.024 | 1 | |
| Awake | 3 weeks | - | - | - | 0.831 | 0.031 | 2 |
| 4 weeks | - | - | - | 0.823 | 0.019 | 3 | |
| 5 weeks | - | - | - | 0.813 | 0.011 | 3 | |
| 6 weeks | - | - | - | 0.803 | 0.007 | 3 | |
| 7 weeks | - | - | - | 0.793 | 0.004 | 3 | |
| 8 weeks | - | - | - | 0.788 | 0.003 | 3 | |
| Asleep + Awake | 3 weeks | - | - | - | 0.831 | 0.031 | 2 |
| 4 weeks | - | - | - | 0.823 | 0.019 | 3 | |
| 5 weeks | - | - | - | 0.813 | 0.011 | 3 | |
| 6 weeks | - | - | - | 0.803 | 0.007 | 3 | |
| 7 weeks | - | - | - | 0.793 | 0.004 | 3 | |
| 8 weeks | - | - | - | 0.788 | 0.003 | 3 | |
| Awake + Restless | 3 weeks | - | - | - | 0.834 | 0.031 | 2 |
| 4 weeks | - | - | - | 0.826 | 0.019 | 3 | |
| 5 weeks | - | - | - | 0.816 | 0.011 | 3 | |
| 6 weeks | - | - | - | 0.806 | 0.007 | 3 | |
| 7 weeks | - | - | - | 0.796 | 0.004 | 3 | |
| 8 weeks | - | - | - | 0.791 | 0.003 | 3 | |
| Sleep | 3 weeks | - | - | - | 0.993 | 0.025 | 2 |
| 4 weeks | - | - | - | 0.993 | 0.013 | 1 | |
| 5 weeks | - | - | - | 0.992 | 0.007 | 3 | |
| 6 weeks | - | - | - | 0.991 | 0.004 | 3 | |
| 7 weeks | 0.001 | <0.001 | 2 | 0.991 | 0.002 | 3 | |
| 8 weeks | - | - | - | 0.991 | 0.001 | 3 | |
| MinHR | 1 weeks | 1.107 | 0.046 | 2 | 1.107 | 0.046 | 2 |
| 2 weeks | - | - | - | 1.108 | 0.011 | 1 | |
| 3 weeks | - | - | - | 1.114 | 0.003 | 1 | |
| 4 weeks | - | - | - | 1.119 | 0.001 | 3 | |
| 5 weeks | - | - | - | 1.119 | <0.001 | 3 | |
| 6 weeks | - | - | - | 1.118 | <0.001 | 3 | |
| 7 weeks | - | - | - | 1.116 | <0.001 | 3 | |
| 8 weeks | - | - | - | 1.116 | <0.001 | 3 | |
| MeanHR | 2 weeks | 1.165 | 0.036 | 3 | 1.104 | 0.015 | 2 |
| 3 weeks | 1.270 | 0.031 | 2 | 1.122 | 0.002 | 2 | |
| 4 weeks | - | - | - | 1.128 | <0.001 | 3 | |
| 5 weeks | - | - | - | 1.133 | <0.001 | 3 | |
| 6 weeks | - | - | - | 1.136 | <0.001 | 3 | |
| 7 weeks | - | - | - | 1.137 | <0.001 | 3 | |
| 8 weeks | - | - | - | 1.139 | <0.001 | 3 | |
| MedianHR | 2 weeks | 1.171 | 0.016 | 3 | 1.111 | 0.003 | 1 |
| 3 weeks | 1.244 | 0.016 | 3 | 1.125 | <0.001 | 1 | |
| 4 weeks | 1.322 | 0.040 | 3 | 1.131 | <0.001 | 3 | |
| 5 weeks | - | - | - | 1.134 | <0.001 | 3 | |
| 6 weeks | - | - | - | 1.136 | <0.001 | 3 | |
| 7 weeks | - | - | - | 1.137 | <0.001 | 3 | |
| 8 weeks | - | - | - | 1.140 | <0.001 | 3 | |
| MaxHR | 2 weeks | 1.072 | 0.048 | 2 | 1.040 | 0.006 | 2 |
| 3 weeks | - | - | - | 1.047 | 0.001 | 2 | |
| 4 weeks | - | - | - | 1.048 | <0.001 | 2 | |
| 5 weeks | - | - | - | 1.038 | <0.001 | 2 | |
| 6 weeks | - | - | - | 1.041 | <0.001 | 2 | |
| 7 weeks | - | - | - | 1.044 | <0.001 | 2 | |
| 8 weeks | - | - | - | 1.045 | <0.001 | 2 | |
References
- Bardy, G.H.; Lee, K.L.; Mark, D.; Poole, J.E.; Packer, D.L.; Boineau, R.; Domanski, M.; Troutman, C.; Anderson, J.; Johnson, G.; et al. Amiodarone or an Implantable Cardioverter–Defibrillator for Congestive Heart Failure. N. Engl. J. Med. 2005, 352, 225–237. [Google Scholar] [CrossRef] [PubMed]
- Koller, M.T.; Schaer, B.; Wolbers, M.; Sticherling, C.; Bucher, H.C.; Osswald, S. Death Without Prior Appropriate Implantable Car-dioverter-Defibrillator Therapy: A Competing Risk Study. Circulation 2008, 117, 1918–1926. [Google Scholar] [CrossRef] [PubMed] [Green Version]
- Crossley, G.H.; Boyle, A.; Vitense, H.; Chang, Y.; Mead, R.H. The CONNECT (Clinical Evaluation of Remote Notification to Reduce Time to Clinical Decision) Trial: The Value of Wireless Remote Monitoring with Automatic Clinician Alerts. J. Am. Coll. Cardiol. 2011, 57, 1181–1189. [Google Scholar] [CrossRef] [PubMed] [Green Version]
- Landolina, M.; Perego, G.B.; Lunati, M.; Curnis, A.; Guenzati, G.; Vicentini, A.; Parati, G.; Borghi, G.; Zanaboni, P.; Valsecchi, S.; et al. Remote Monitoring Reduces Healthcare Use and Improves Quality of Care in Heart Failure Patients with Im-plantable Defibrillators. Circ. Am. Heart Assoc. 2012, 125, 2985–2992. [Google Scholar] [CrossRef] [Green Version]
- Epstein, A.E.; DiMarco, J.P.; Ellenbogen, K.A.; Estes, N.A.M.; Freedman, R.A.; Gettes, L.S.; Gillinov, A.M.; Gregoratos, G.; Hammill, S.C.; Hayes, D.L.; et al. 2012 ACCF/AHA/HRS focused update incor-porated into the ACCF/AHA/HRS 2008 guidelines for device-based therapy of cardiac rhythm abnormalities: A report of the American College of Cardiology Foundation/American Heart Association Task Force on Practice Guidelines and the Heart Rhythm Society. J. Am. Coll. Cardiol. 2013, 61, e6-75. [Google Scholar] [PubMed]
- Piwek, L.; Ellis, D.A.; Andrews, S.; Joinson, A. The Rise of Consumer Health Wearables: Promises and Barriers. PLoS Med. Public Libr. Sci. 2016, 13, e1001953. [Google Scholar] [CrossRef]
- Bayoumy, K.; Gaber, M.; Elshafeey, A.; Mhaimeed, O.; Dineen, E.H.; Marvel, F.A.; Martin, S.S.; Muse, E.D.; Turakhia, M.P.; Tarakji, K.G.; et al. Smart wearable devices in cardiovascular care: Where we are and how to move forward. Nat. Rev. Cardiol. 2021, 18, 581–599. [Google Scholar] [CrossRef]
- Yang, C.-C.; Hsu, Y.-L. A Review of Accelerometry-Based Wearable Motion Detectors for Physical Activity Monitoring. Sensors 2010, 10, 7772–7788. [Google Scholar] [CrossRef] [PubMed]
- Hammond-Haley, M.; Allen, C.; Han, J.; Patterson, T.; Marber, M.; Redwood, S. Utility of wearable physical activity monitors in cardiovascular disease: A systematic review of 11 464 patients and recommendations for optimal use. Eur. Heart J. Digit. Health 2021, 2, 231–243. [Google Scholar] [CrossRef]
- Perez, M.V.; Mahaffey, K.W.; Hedlin, H.; Rumsfeld, J.S.; Garcia, A.; Ferris, T.; Balasubramanian, V.; Russo, A.M.; Rajmane, A.; Cheung, L.; et al. Large-Scale Assessment of a Smartwatch to Identify Atrial Fibrillation. N. Engl. J. Med. 2019, 381, 1909–1917. [Google Scholar] [CrossRef]
- Wang, L.; Nielsen, K.; Goldberg, J.; Brown, J.R.; Rumsfeld, J.S.; Steinberg, B.A.; Zhang, Y.; Matheny, M.E.; Shah, R.U. Association of Wearable Device Use with Pulse Rate and Health Care Use in Adults with Atrial Fibrillation. JAMA Netw. Open 2021, 4, e215821. [Google Scholar] [CrossRef] [PubMed]
- Melin, M.; Hagerman, I.; Gonon, A.; Gustafsson, T.; Rullman, E. Variability in Physical Activity Assessed with Accelerometer Is an Independent Predictor of Mortality in CHF Patients. PLoS ONE 2016, 11, e0153036. [Google Scholar] [CrossRef] [PubMed] [Green Version]
- Baril, J.-F.; Bromberg, S.; Moayedi, Y.; Taati, B.; Manlhiot, C.; Ross, H.J.; Cafazzo, J. Use of Free-Living Step Count Monitoring for Heart Failure Functional Classification: Validation Study. JMIR Cardio 2019, 3, e12122. [Google Scholar] [CrossRef] [PubMed]
- Evangelista, L.S.; Hamilton, M.A.; Fonarow, G.C.; Dracup, K. Is Exercise Adherence Associated with Clinical Outcomes in Patients with Advanced Heart Failure? Phys. Sportsmed. 2010, 38, 28–36. [Google Scholar] [CrossRef] [PubMed] [Green Version]
- Tan, K.H.M.; Wong, J.; Bakrania, K.; Abdullahi, Y.; Harling, L.; Casula, R.; Rowlands, A.; Athanasiou, T.; Jarral, O.A. Can activity monitors predict outcomes in patients with heart failure? A systematic review. Eur. Heart J. Qual. Care Clin. Outcomes 2018, 5, 11–21. [Google Scholar] [CrossRef]
- Vetrovsky, T.; Clark, C.; Bisi, M.C.; Siranec, M.; Linhart, A.; Tufano, J.J.; Duncan, M.; Belohlavek, J. Advances in accelerometry for cardiovascular patients: A systematic review with practical recommendations. ESC Heart Fail. 2020, 7, 2021–2031. [Google Scholar] [CrossRef]
- Andersen, T.O.; Nielsen, K.D.; Moll, J.; Svendsen, J.H. Unpacking telemonitoring work: Workload and telephone calls to patients in implanted cardiac device care. Int. J. Med. Inform. 2019, 129, 381–387. [Google Scholar] [CrossRef]
- Andersen, T.O.; Bansler, J.P.; Kensing, F.; Moll, J.; Mønsted, T.; Nielsen, K.D.; Nielsen, O.W.; Petersen, H.H.; Svendsen, J.H. Aligning Concerns in Telecare: Three Concepts to Guide the Design of Patient-Centred E-Health. Comput. Support. Coop. Work 2018, 27, 1181–1214. [Google Scholar] [CrossRef] [Green Version]
- Andersen, T.O.; Langstrup, H.; Lomborg, S. Experiences with Wearable Activity Data During Self-Care by Chronic Heart Pa-tients: Qualitative Study. J. Med. Internet Res. 2020, 22, e15873. [Google Scholar] [CrossRef]
- Lomborg, S.; Langstrup, H.; Andersen, T.O. Interpretation as luxury: Heart patients living with data doubt, hope, and anxiety. Big Data Soc. SAGE Publ. Ltd. 2020, 7, 2053951720924436. [Google Scholar] [CrossRef]
- PLATFORM ISF. Wearables: The Comprehensive List of Wearables on The Market|inKin. Available online: https://www.inkin.com/wearables/ (accessed on 7 May 2022).
- McMahon, S.K.; Lewis, B.; Oakes, M.; Guan, W.; Wyman, J.F.; Rothman, A.J. Older Adults’ Experiences Using a Commercially Available Monitor to Self-Track Their Physical Activity. JMIR mHealth uHealth 2016, 4, e35. [Google Scholar] [CrossRef] [PubMed]
- Steinert, A.; Haesner, M.; Steinhagen-Thiessen, E. Activity-tracking devices for older adults: Comparison and preferences. Univers. Access Inf. Soc. 2017, 17, 411–419. [Google Scholar] [CrossRef]
- Fitbit Official Site for Activity Trackers and More. Available online: https://www.fitbit.com (accessed on 7 May 2022).
- Ferguson, T.; Rowlands, A.V.; Olds, T.; Maher, C. The validity of consumer-level, activity monitors in healthy adults worn in free-living conditions: A cross-sectional study. Int. J. Behav. Nutr. Phys. Act. 2015, 12, 1–9. [Google Scholar] [CrossRef] [PubMed] [Green Version]
- Brewer, W.; Swanson, B.T.; Ortiz, A. Validity of Fitbit’s active minutes as compared with a research-grade accelerometer and self-reported measures. BMJ Open Sport Exerc. Med. 2017, 3, e000254. [Google Scholar] [CrossRef] [Green Version]
- Kooiman, T.J.M.; Dontje, M.L.; Sprenger, S.R.; Krijnen, W.P.; van der Schans, C.P.; de Groot, M. Reliability and validity of ten consumer activity trackers. BMC Sports Sci. Med. Rehabil. 2015, 7, 1–11. [Google Scholar] [CrossRef] [PubMed] [Green Version]
- Keill, A.K.; An, H.-S.; Dinkel, D.M.; Lee, J.-M. Validity of Wearable Fitness Trackers on Sleep Measure: 106 Board #4 June 1, 9. Med. Sci. Sports Exerc. 2016, 48, 10. [Google Scholar] [CrossRef] [Green Version]
- Lee, J.-M.; Byun, W.; Keill, A.; Dinkel, D.; Seo, Y. Comparison of Wearable Trackers’ Ability to Estimate Sleep. Int. J. Environ. Res. Public Health 2018, 15, 1265. [Google Scholar] [CrossRef] [Green Version]
- U.S. Food and Drug Administration. Digital Health Software Precertification (Pre-Cert) Program. FDA. Available online: https://www.fda.gov/medical-devices/digital-health-center-excellence/digital-health-software-precertification-pre-cert-program (accessed on 7 May 2022).
- Medtronic. Medtronic CareLink® Network—Part of Cardiac Device Data Connectivity. Available online: https://www.medtronic.com/ca-en/healthcare-professionals/products/cardiac-rhythm/patient-management-carelink/mainspring-data-express.html (accessed on 7 May 2022).
- Fitbit Development: Web API. Available online: https://dev.fitbit.com/build/reference/web-api/ (accessed on 7 May 2022).
- What are Active Zone Minutes or active minutes on my Fitbit device? Available online: https://help.fitbit.com/articles/en_US/Help_article/1379.htm (accessed on 7 May 2022).
- Welcome to Python.org. Python.org. Available online: https://www.python.org/ (accessed on 3 April 2022).
- Anaconda: Where Packages, Notebooks, Projects, and Environments Are Shared. Available online: https://anaconda.org/ (accessed on 14 April 2022).
- R Core Team. European Environment Agency. 2020. Available online: https://www.eea.europa.eu/data-and-maps/indicators/oxygen-consuming-substances-in-rivers/r-development-core-team-2006 (accessed on 14 April 2022).
- RStudio (2022)—Open Source & Professional Software for Data Science Teams. Available online: https://www.rstudio.com/ (accessed on 7 May 2022).
- Survival—A Package for Survival Analysis in R. 2020. Available online: https://cran.r-project.org/web/packages/survival/citation.html (accessed on 14 April 2022).
- Manea, V.; Wac, K. Co-Calibrating Physical and Psychological Outcomes and Consumer Wearable Activity Outcomes in Older Adults: An Evaluation of the coQoL Method. J. Pers. Med. 2020, 10, 203. [Google Scholar] [CrossRef]
- Low, C.A.; Dey, A.K.; Ferreira, D.; Kamarck, T.; Sun, W.; Bae, S.; Doryab, A. Estimation of Symptom Severity during Chemotherapy from Passively Sensed Data: Exploratory Study. J. Med. Internet Res. 2017, 19, e420. [Google Scholar] [CrossRef]
- Katzan, I.; Schuster, A.; Kinzy, T. Physical Activity Monitoring Using a Fitbit Device in Ischemic Stroke Patients: Prospective Cohort Feasibility Study. JMIR mHealth uHealth 2021, 9, e14494. [Google Scholar] [CrossRef]
- Zhang, Z. Case-crossover design and its implementation in R. Ann. Transl. Med. 2016, 4, 341. [Google Scholar] [CrossRef] [PubMed] [Green Version]
- Wang, X.; Wang, S.; Kindzierski, W. Time-stratified case-crossover design applied with conditional logistic regression is not free from overlap bias. Stat. Methods Med. Res. 2019, 29, 2036–2037. [Google Scholar] [CrossRef] [PubMed]
- Bonnesen, M.P.; Frodi, D.M.; Haugan, K.J.; Kronborg, C.; Graff, C.; Højberg, S.; Køber, L.; Krieger, D.; Brandes, A.; Svendsen, J.H.; et al. Day-to-day measurement of physical activity and risk of atrial fibrillation. Eur. Heart J. 2021, 42, 3979–3988. [Google Scholar] [CrossRef] [PubMed]
- Blond, K.; Brinkløv, C.F.; Ried-Larsen, M.; Crippa, A.; Grøntved, A. Association of high amounts of physical activity with mortality risk: A systematic review and meta-analysis. Br. J. Sports Med. 2019, 54, 1195–1201. [Google Scholar] [CrossRef]
- Rosero, S.Z.; Younis, A.; Jones, P.; McNitt, S.; Goldenberg, I.; Zareba, W.; Stein, K.; Kutyifa, V. Utility of cardiovascular implantable electronic device–derived patient activity to predict clinical outcomes. Heart Rhythm 2021, 18, 1344–1351. [Google Scholar] [CrossRef]
- Jędrzejczyk-Patej, E.; Kowalski, O.; Sredniawa, B.; Pruszkowska, P.; Sokal, A.; Szulik, M.; Mazurek, M.; Kowalczyk, J.; Kalarus, Z.; Lenarczyk, R. Trying to predict the unpredictable: Variations in device-based daily monitored diagnostic parameters can predict malignant arrhythmic events in patients undergoing cardiac resynchronization therapy. Cardiol. J. 2014, 21, 405–412. [Google Scholar] [CrossRef] [Green Version]
- Ramakrishnan, R.; Doherty, A.; Smith-Byrne, K.; Rahimi, K.; Bennett, D.; Woodward, M.; Walmsley, R.; Dwyer, T. Accelerometer measured physical activity and the incidence of cardiovascular disease: Evidence from the UK Biobank cohort study. PLoS Med. Public Libr. Sci. 2021, 18, e1003487. [Google Scholar] [CrossRef]
- Werhahn, S.M.; Dathe, H.; Rottmann, T.; Franke, T.; Vahdat, D.; Hasenfuß, G.; Seidler, T. Designing meaningful outcome parameters using mobile technology: A new mobile application for telemonitoring of patients with heart failure. ESC Heart Fail. 2019, 6, 516–525. [Google Scholar] [CrossRef] [PubMed]
- Curtis, A.F.; Roth, A.J.; Sears, S.F.; Conti, J.B.; Berry, R.B.; Dzierzewski, J.M.; McCrae, C.S. Associations between pain, objective sleep efficiency and cognition in patients with implantable cardioverter defibrillators. Sleep Med. 2020, 72, 122–125. [Google Scholar] [CrossRef]
- Rosenberger, M.E.; Fulton, J.E.; Buman, M.; Troiano, R.P.; Grandner, M.A.; Buchner, D.M.; Haskell, W.L. The 24-Hour Activity Cycle: A New Paradigm for Physical Activity. Med. Sci. Sports Exerc. 2019, 51, 454–464. [Google Scholar] [CrossRef]
- Klompstra, L.; Kyriakou, M.; Lambrinou, E.; Piepoli, M.F.; Coats, A.J.S.; Cohen-Solal, A.; Cornelis, J.; Gellen, B.; Marques-Sule, E.; Niederseer, D.; et al. Measuring physical activity with activity monitors in patients with heart failure: From literature to practice. A position paper from the Committee on Exercise Physiology and Training of the Heart Failure Association of the European Society of Car-diology. Eur. J. Heart Fail. 2021, 23, 83–91. [Google Scholar] [CrossRef] [PubMed]
- Henriksen, A.; Mikalsen, M.H.; Woldaregay, A.Z.; Muzny, M.; Hartvigsen, G.; Hopstock, L.A.; Grimsgaard, S. Using Fitness Trackers and Smartwatches to Measure Physical Activity in Research: Analysis of Consumer Wrist-Worn Wearables. J. Med. Internet Res. 2018, 20, e110. [Google Scholar] [CrossRef] [PubMed]
- De Bleser, L.; De Geest, S.; Vandenbroeck, S.; Vanhaecke, J.; Dobbels, F. How accurate are electronic monitoring devices? A la-boratory study testing two devices to measure medication adherence. Sensors 2010, 10, 1652–1660. [Google Scholar] [CrossRef] [PubMed]
- Mayo, N.E.; Figueiredo, S.; Ahmed, S.; Bartlett, S.J. Montreal Accord on Patient-Reported Outcomes (PROs) use series—Paper 2: Terminology proposed to measure what matters in health. J. Clin. Epidemiol. 2017, 89, 119–124. [Google Scholar] [CrossRef] [PubMed]


| VA Event Type | Description |
|---|---|
| VT | Ventricular tachycardia is a very fast heart rhythm that begins in the ventricles. It is defined as a heart rate of more than 100 beats/min with at least three irregular heartbeats in a row. |
| VT1 | Ventricular Tachycardia Zone 1: Medtronic has an option to divide VTs into heart-rate zones. This division allows physicians to program different treatments for the different zones. For example, Zone 1 may range from 100 to 180 beats/min. |
| VT2 | Ventricular Tachycardia Zone 2: Zone 2 is similar to VT1, but with a different beat-per-minute interval. |
| VF-VT | Ventricular fibrillation into ventricular tachycardia: VT is potentially lethal, VF even more so. In ventricular fibrillation, the ventricular rates are higher than in VT. |
| Measurement | Derived Variable | |||
|---|---|---|---|---|
| Name | Unit | Name | Abbreviation | Unit |
| Steps | count | Steps | Steps | count |
| Sedentary | yes/no | (Excluded from analysis) | ||
| Sedentary, Light | yes/no | (Excluded from analysis) | ||
| Light | yes/no | Light activity duration | Light | min |
| Light, Fair | yes/no | Cumulative light and fair activity duration | Light + Fair | min |
| Fair | yes/no | Fair activity duration | Fair | min |
| Fair, Vigorous | yes/no | Cumulative fair and vigorous activity duration | Fair + Vig | min |
| Vigorous | yes/no | Vigorous activity duration | Vig | min |
| Light, Fair, Vigorous | yes/no | Cumulative active duration | Active | min |
| Asleep | yes/no | Asleep sleep duration | Asleep | min |
| Awake | yes/no | Awake sleep duration | Awake | min |
| Restless | yes/no | Restless sleep duration | Restless | min |
| Unknown | yes/no | (Excluded from analysis) | ||
| Asleep, Awake | yes/no | Cumulative asleep and awake sleep duration | Asleep + Awake | min |
| Asleep, Restless | yes/no | Cumulative asleep and restless sleep duration | Asleep + Restless | min |
| Awake, Restless | yes/no | Cumulative awake and restless sleep duration | Awake + Restless | min |
| Asleep, Awake, Restless, Unknown | yes/no | Cumulative sleep duration | Sleep | min |
| Heart rate | bpm 1 | Minimum heart rate | MinHR | bpm |
| Heart rate | bpm 1 | Mean heart rate | MeanHR | bpm |
| Heart rate | bpm 1 | Median heart rate | MedianHR | bpm |
| Heart rate | bpm 1 | Maximum heart rate | MaxHR | bpm |
| Heart rate | bpm 1 | Standard deviation of heart rate | SDHR | bpm |
| Formula | Predictors Defining the Scenarios | VA Outcome |
|---|---|---|
| 1 | (a) behavior aggregate, (b) season, weekday status | event (yes/no) |
| 2 | (a) behavior aggregate, (b) season, day of week | event (yes/no) |
| 3 | (a) behavior aggregate, (b) season | event (yes/no) |
| Participant ID | Gender | Age | VA Events 1 | Fitbit Days 2 | Device Type 3 |
|---|---|---|---|---|---|
| 1 | Male | 67 | 6 | 193 | ICD |
| 2 | Male | 61 | 0 | 966 | Not specified |
| 3 | Male | 41 | 0 | 120 | Not specified |
| 4 | Male | 55 | 1 | 960 | ICD |
| 5 | Male | 66 | 6 | 364 | ICD |
| 6 | Male | 67 | 0 | 79 | Not specified |
| 7 | Male | 28 | 1 | 65 | ICD |
| 8 | Male | 69 | 0 | 567 | Not specified |
| 9 | Male | 47 | 1 | 519 | ICD |
| 10 | Male | 61 | 0 | 261 | Not specified |
| 11 | Male | 59 | 5 | 60 | ICD |
| 12 | Male | 66 | 23 | 647 | CRT-D |
| 13 | Male | 58 | 5 | 357 | CRT-D |
| 14 | Male | 67 | 1 | 317 | ICD |
| 15 | Male | 56 | 6 | 332 | ICD |
| 16 | Female | 52 | 11 | 980 | ICD |
| 17 | Female | 61 | 0 | 99 | Not specified |
| 18 | Male | 47 | 20 | 326 | ICD |
| 19 | Male | 45 | 45 | 450 | ICD |
| 20 | Male | 67 | 127 | 801 | ICD |
| 21 | Male | 66 | 0 | 148 | Not specified |
| 22 | Male | 69 | 1 | 395 | ICD |
| 23 | Male | 38 | 0 | 98 | Not specified |
| 24 | Male | 59 | 0 | 136 | Not specified |
| 25 | Male | 51 | 3 | 842 | ICD |
| 26 | Male | 49 | 0 | 891 | Not specified |
| 27 | Male | 74 | 0 | 796 | Not specified |
| Behavior | Separate Models | Combined Models | Result | ||||
|---|---|---|---|---|---|---|---|
| OR | p | Duration | OR | p | Duration | OR | |
| Steps | 0.987 | <0.001 | 7 | 1.000 | 0.002 | 7–8 | Inconclusive |
| Light | 1.009 | 0.017 | 2–3 | 1.010 | <0.001 | 4–5 | OR > 1 |
| Light + Fair | 1.008 | 0.025 | 2 | 1.010 | <0.001 | 5 | OR > 1 |
| Fair | 0.001 | <0.001 | 6 | 0.973 | 0.016 | 4–5, 8 | OR < 1 |
| Fair + Vig | 0.260 | <0.001 | 7 | 0.991 | 0.013 | 2–8 | OR < 1 |
| Vig | 0.104 | <0.001 | 7 | 0.988 | 0.024 | 2–6, 8 | OR < 1 |
| Asleep | - | - | - | - | - | - | Inconclusive |
| Awake | - | - | - | 0.788 | 0.003 | 8 | OR < 1 |
| Restless | - | - | - | - | - | - | Inconclusive |
| Asleep + Awake | - | - | - | 0.788 | 0.003 | 8 | OR < 1 |
| Awake + Restless | - | - | - | 0.791 | 0.003 | 8 | OR < 1 |
| Asleep + Restless | - | - | - | - | - | - | Inconclusive |
| Sleep | 0.001 | <0.001 | 7 | 0.991 | 0.001 | 6–8 | OR < 1 |
| MinHR | 1.107 | 0.046 | 1 | 1.119 | <0.001 | 4–8 | OR > 1 |
| MeanHR | 1.270 | 0.003 | 3 | 1.139 | <0.001 | 8 | OR > 1 |
| MedianHR | 1.244 | 0.016 | 3–4 | 1.140 | <0.001 | 8 | OR > 1 |
| MaxHR | 1.072 | 0.048 | 2 | 1.048 | <0.001 | 4 | OR > 1 |
| SDHR | - | - | - | - | - | - | Inconclusive |
Publisher’s Note: MDPI stays neutral with regard to jurisdictional claims in published maps and institutional affiliations. |
© 2022 by the authors. Licensee MDPI, Basel, Switzerland. This article is an open access article distributed under the terms and conditions of the Creative Commons Attribution (CC BY) license (https://creativecommons.org/licenses/by/4.0/).
Share and Cite
Frodi, D.M.; Manea, V.; Diederichsen, S.Z.; Svendsen, J.H.; Wac, K.; Andersen, T.O. Using Consumer-Wearable Activity Trackers for Risk Prediction of Life-Threatening Heart Arrhythmia in Patients with an Implantable Cardioverter-Defibrillator: An Exploratory Observational Study. J. Pers. Med. 2022, 12, 942. https://doi.org/10.3390/jpm12060942
Frodi DM, Manea V, Diederichsen SZ, Svendsen JH, Wac K, Andersen TO. Using Consumer-Wearable Activity Trackers for Risk Prediction of Life-Threatening Heart Arrhythmia in Patients with an Implantable Cardioverter-Defibrillator: An Exploratory Observational Study. Journal of Personalized Medicine. 2022; 12(6):942. https://doi.org/10.3390/jpm12060942
Chicago/Turabian StyleFrodi, Diana My, Vlad Manea, Søren Zöga Diederichsen, Jesper Hastrup Svendsen, Katarzyna Wac, and Tariq Osman Andersen. 2022. "Using Consumer-Wearable Activity Trackers for Risk Prediction of Life-Threatening Heart Arrhythmia in Patients with an Implantable Cardioverter-Defibrillator: An Exploratory Observational Study" Journal of Personalized Medicine 12, no. 6: 942. https://doi.org/10.3390/jpm12060942
APA StyleFrodi, D. M., Manea, V., Diederichsen, S. Z., Svendsen, J. H., Wac, K., & Andersen, T. O. (2022). Using Consumer-Wearable Activity Trackers for Risk Prediction of Life-Threatening Heart Arrhythmia in Patients with an Implantable Cardioverter-Defibrillator: An Exploratory Observational Study. Journal of Personalized Medicine, 12(6), 942. https://doi.org/10.3390/jpm12060942