

New Strategies to Optimize Hemodynamics for Sepsis-Associated Encephalopathy


Abstract
:1. Introduction
2. Materials and Methods
2.1. Study Settings
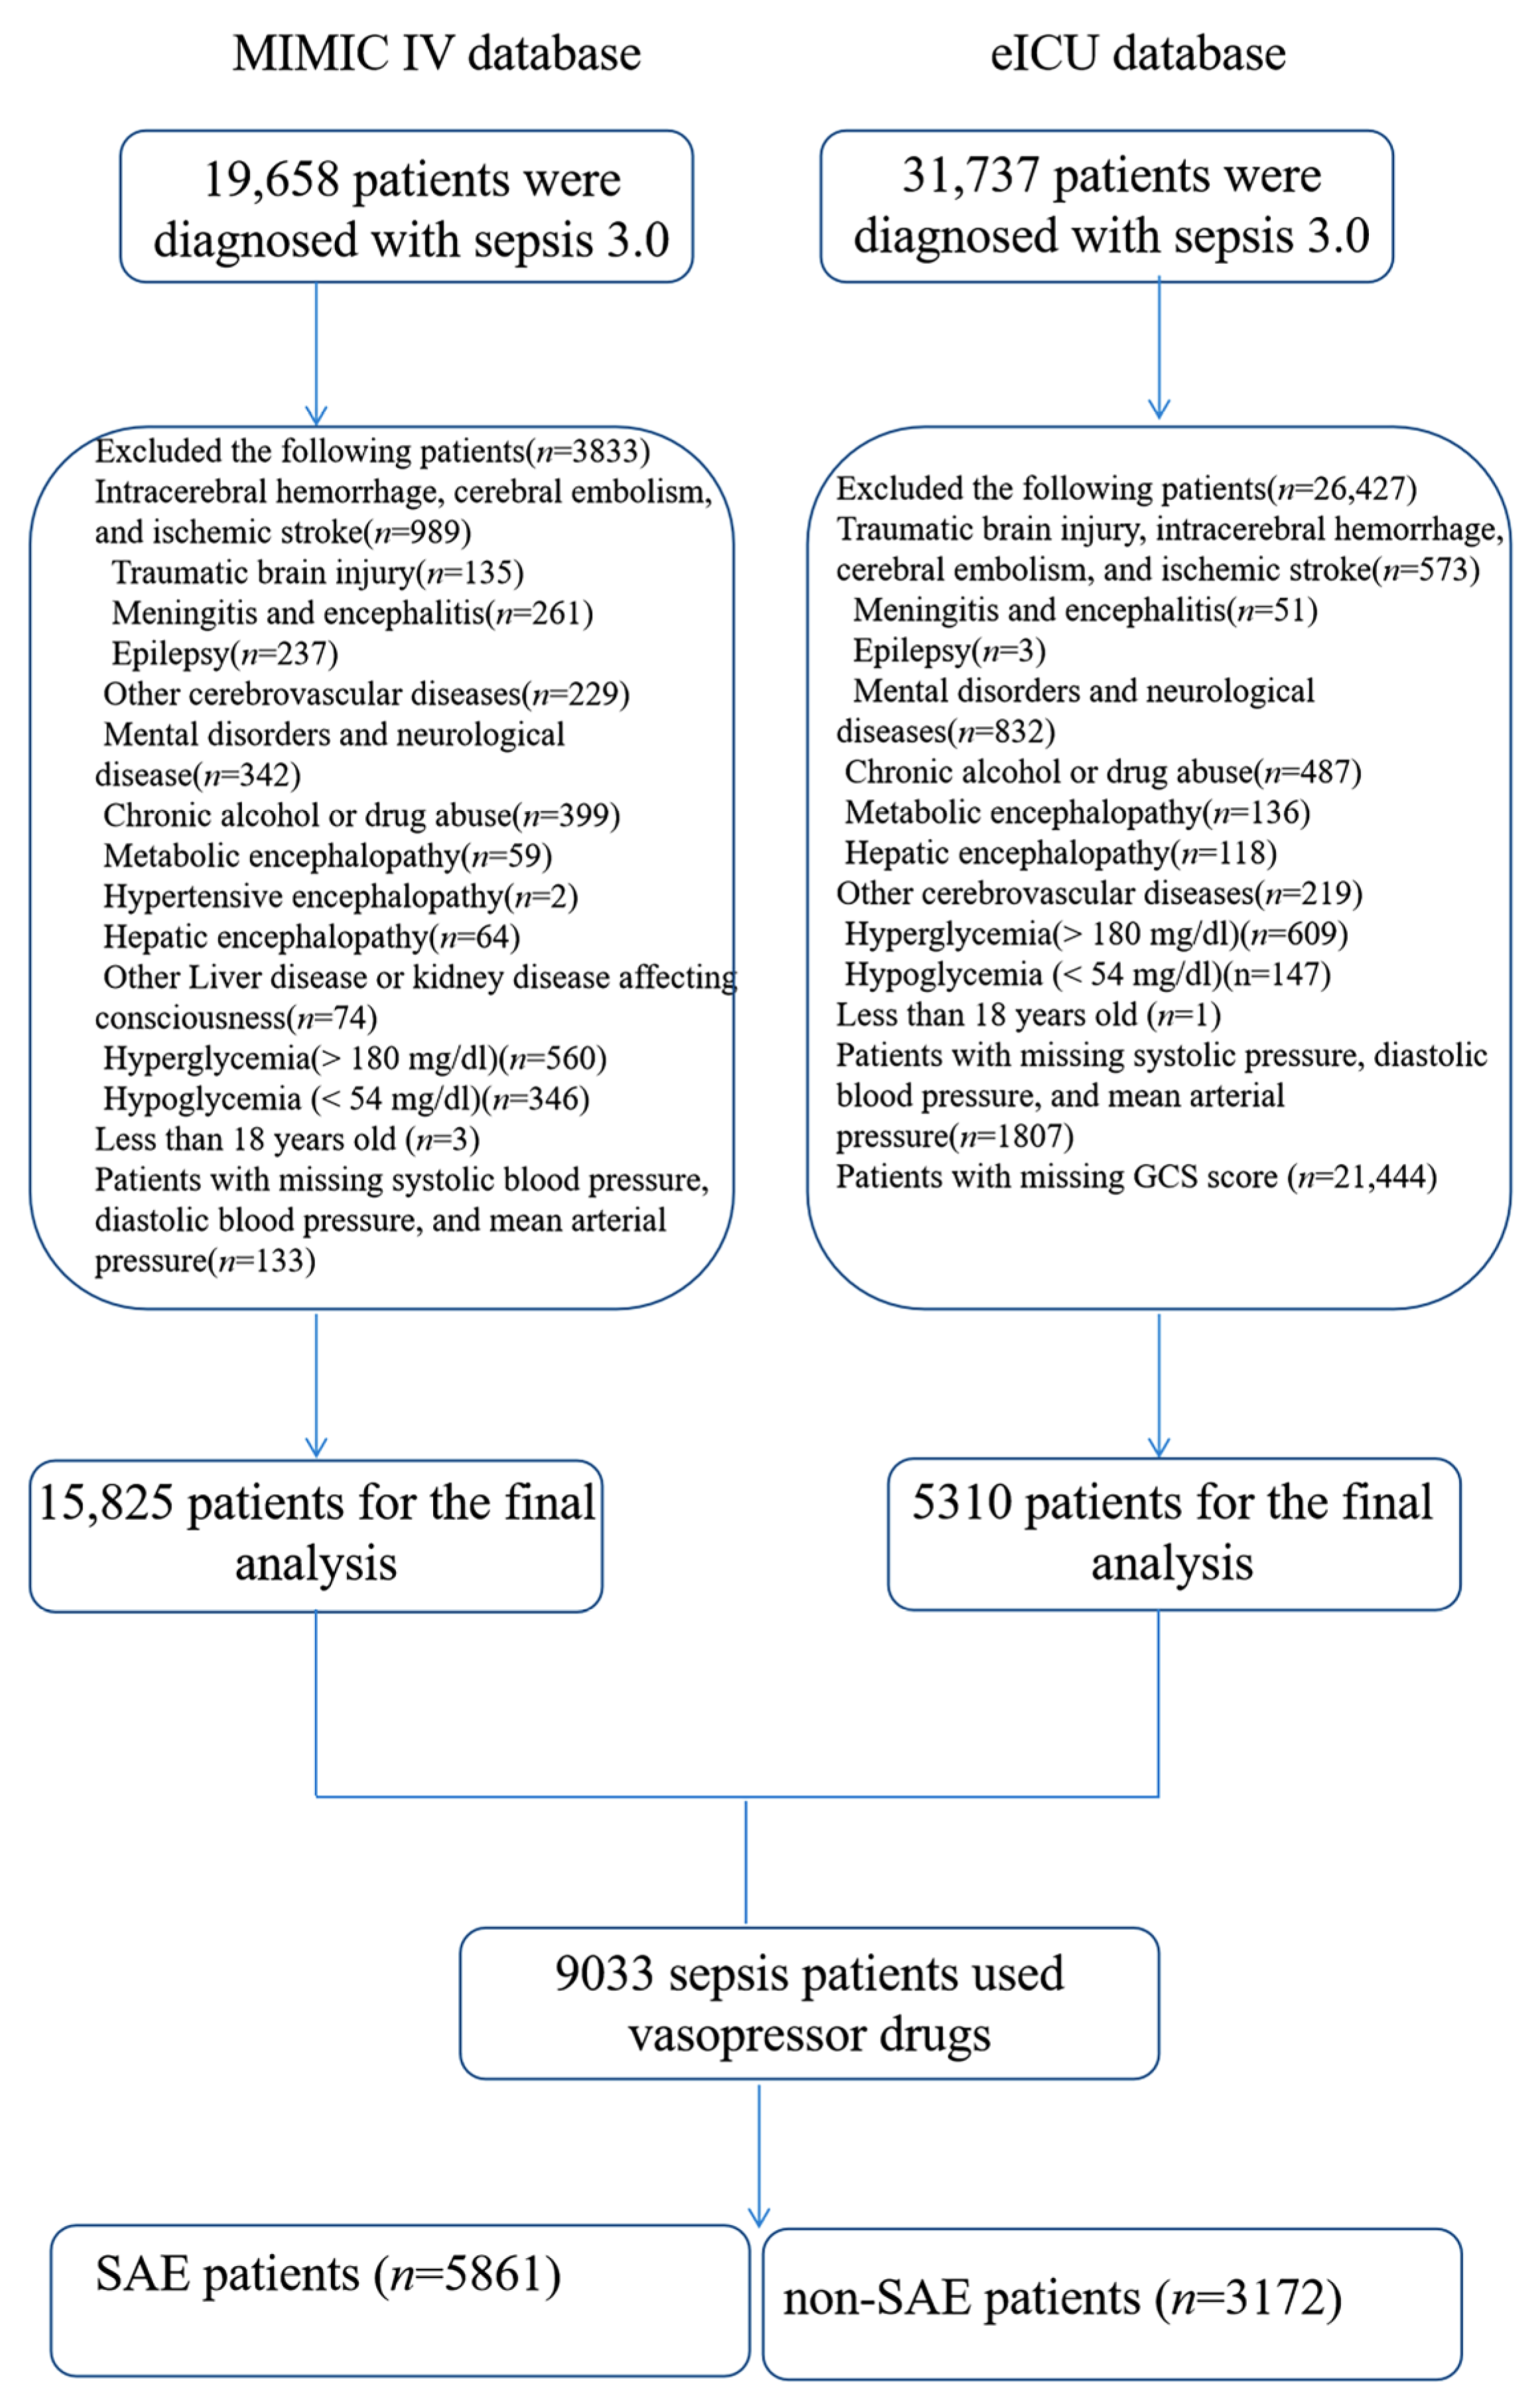
2.2. Patients
2.3. Data Collection
2.4. Statistical Analysis
3. Results
3.1. Baseline Characteristics
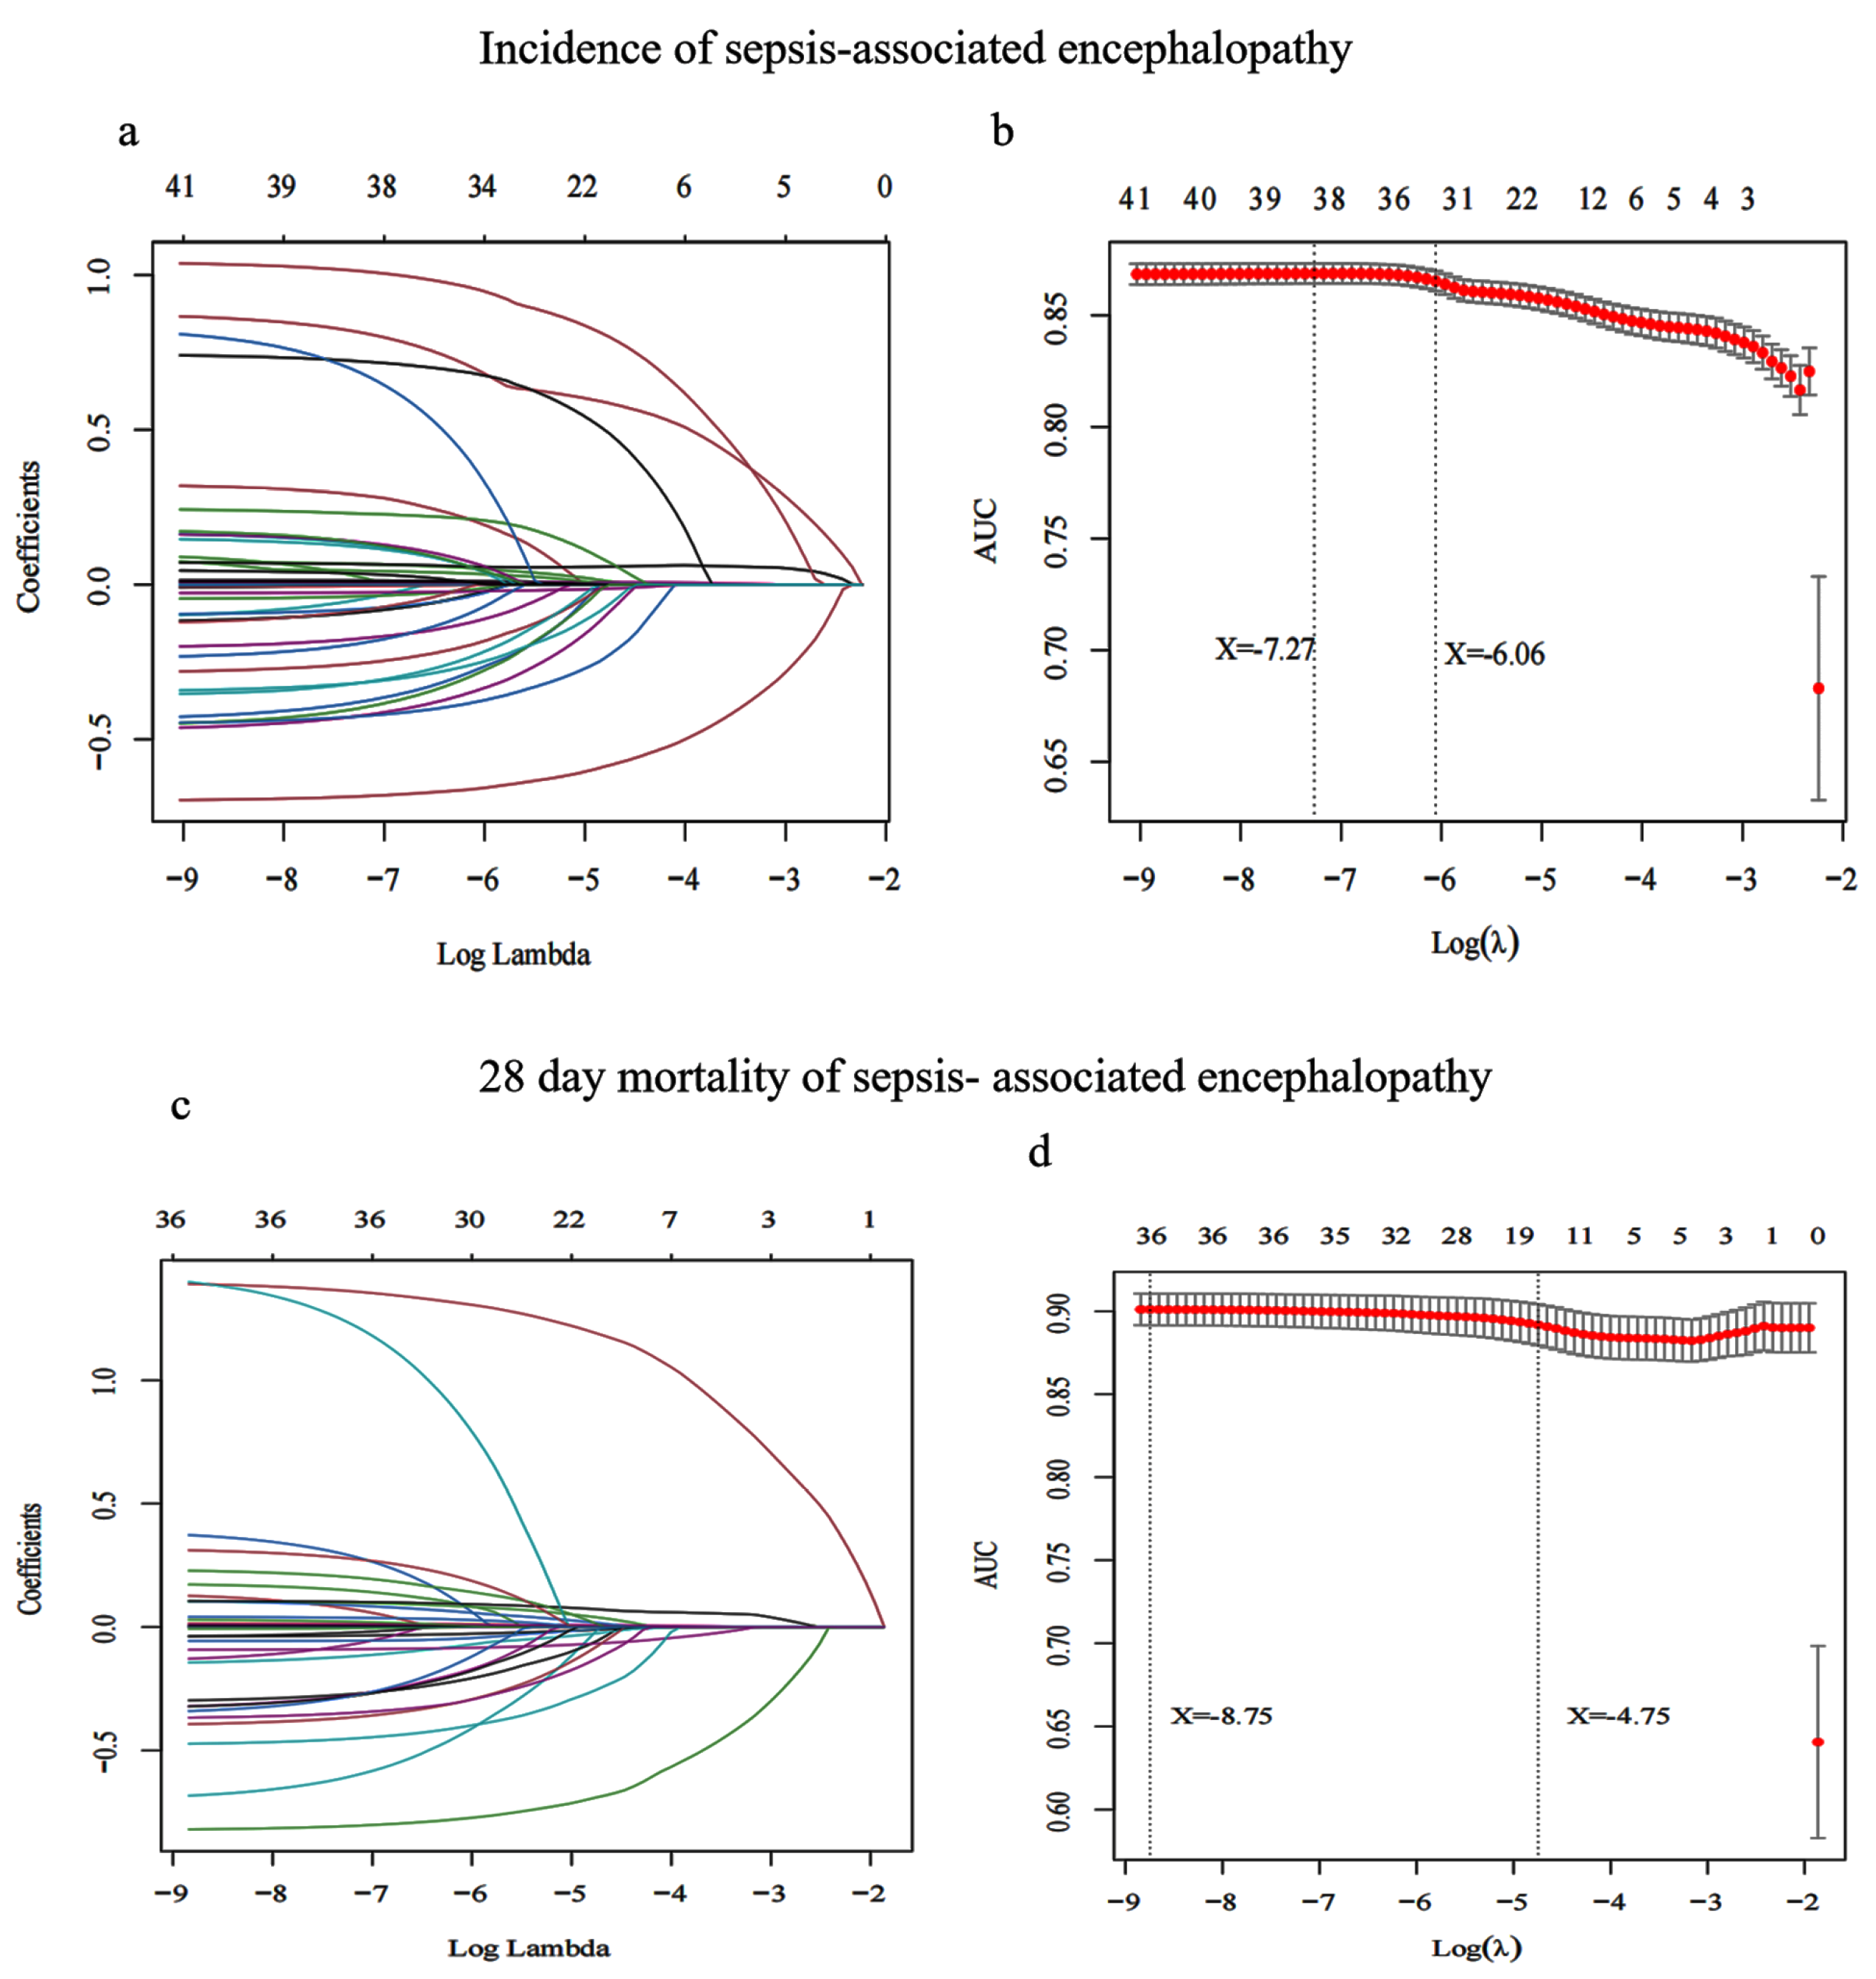
3.2. Screening Characteristic Variables for SAE Incidence
3.3. Multiple Model Analysis of Risk Factors for SAE Incidence
3.4. Screening Characteristic Variables for 28-Day Mortality of SAE
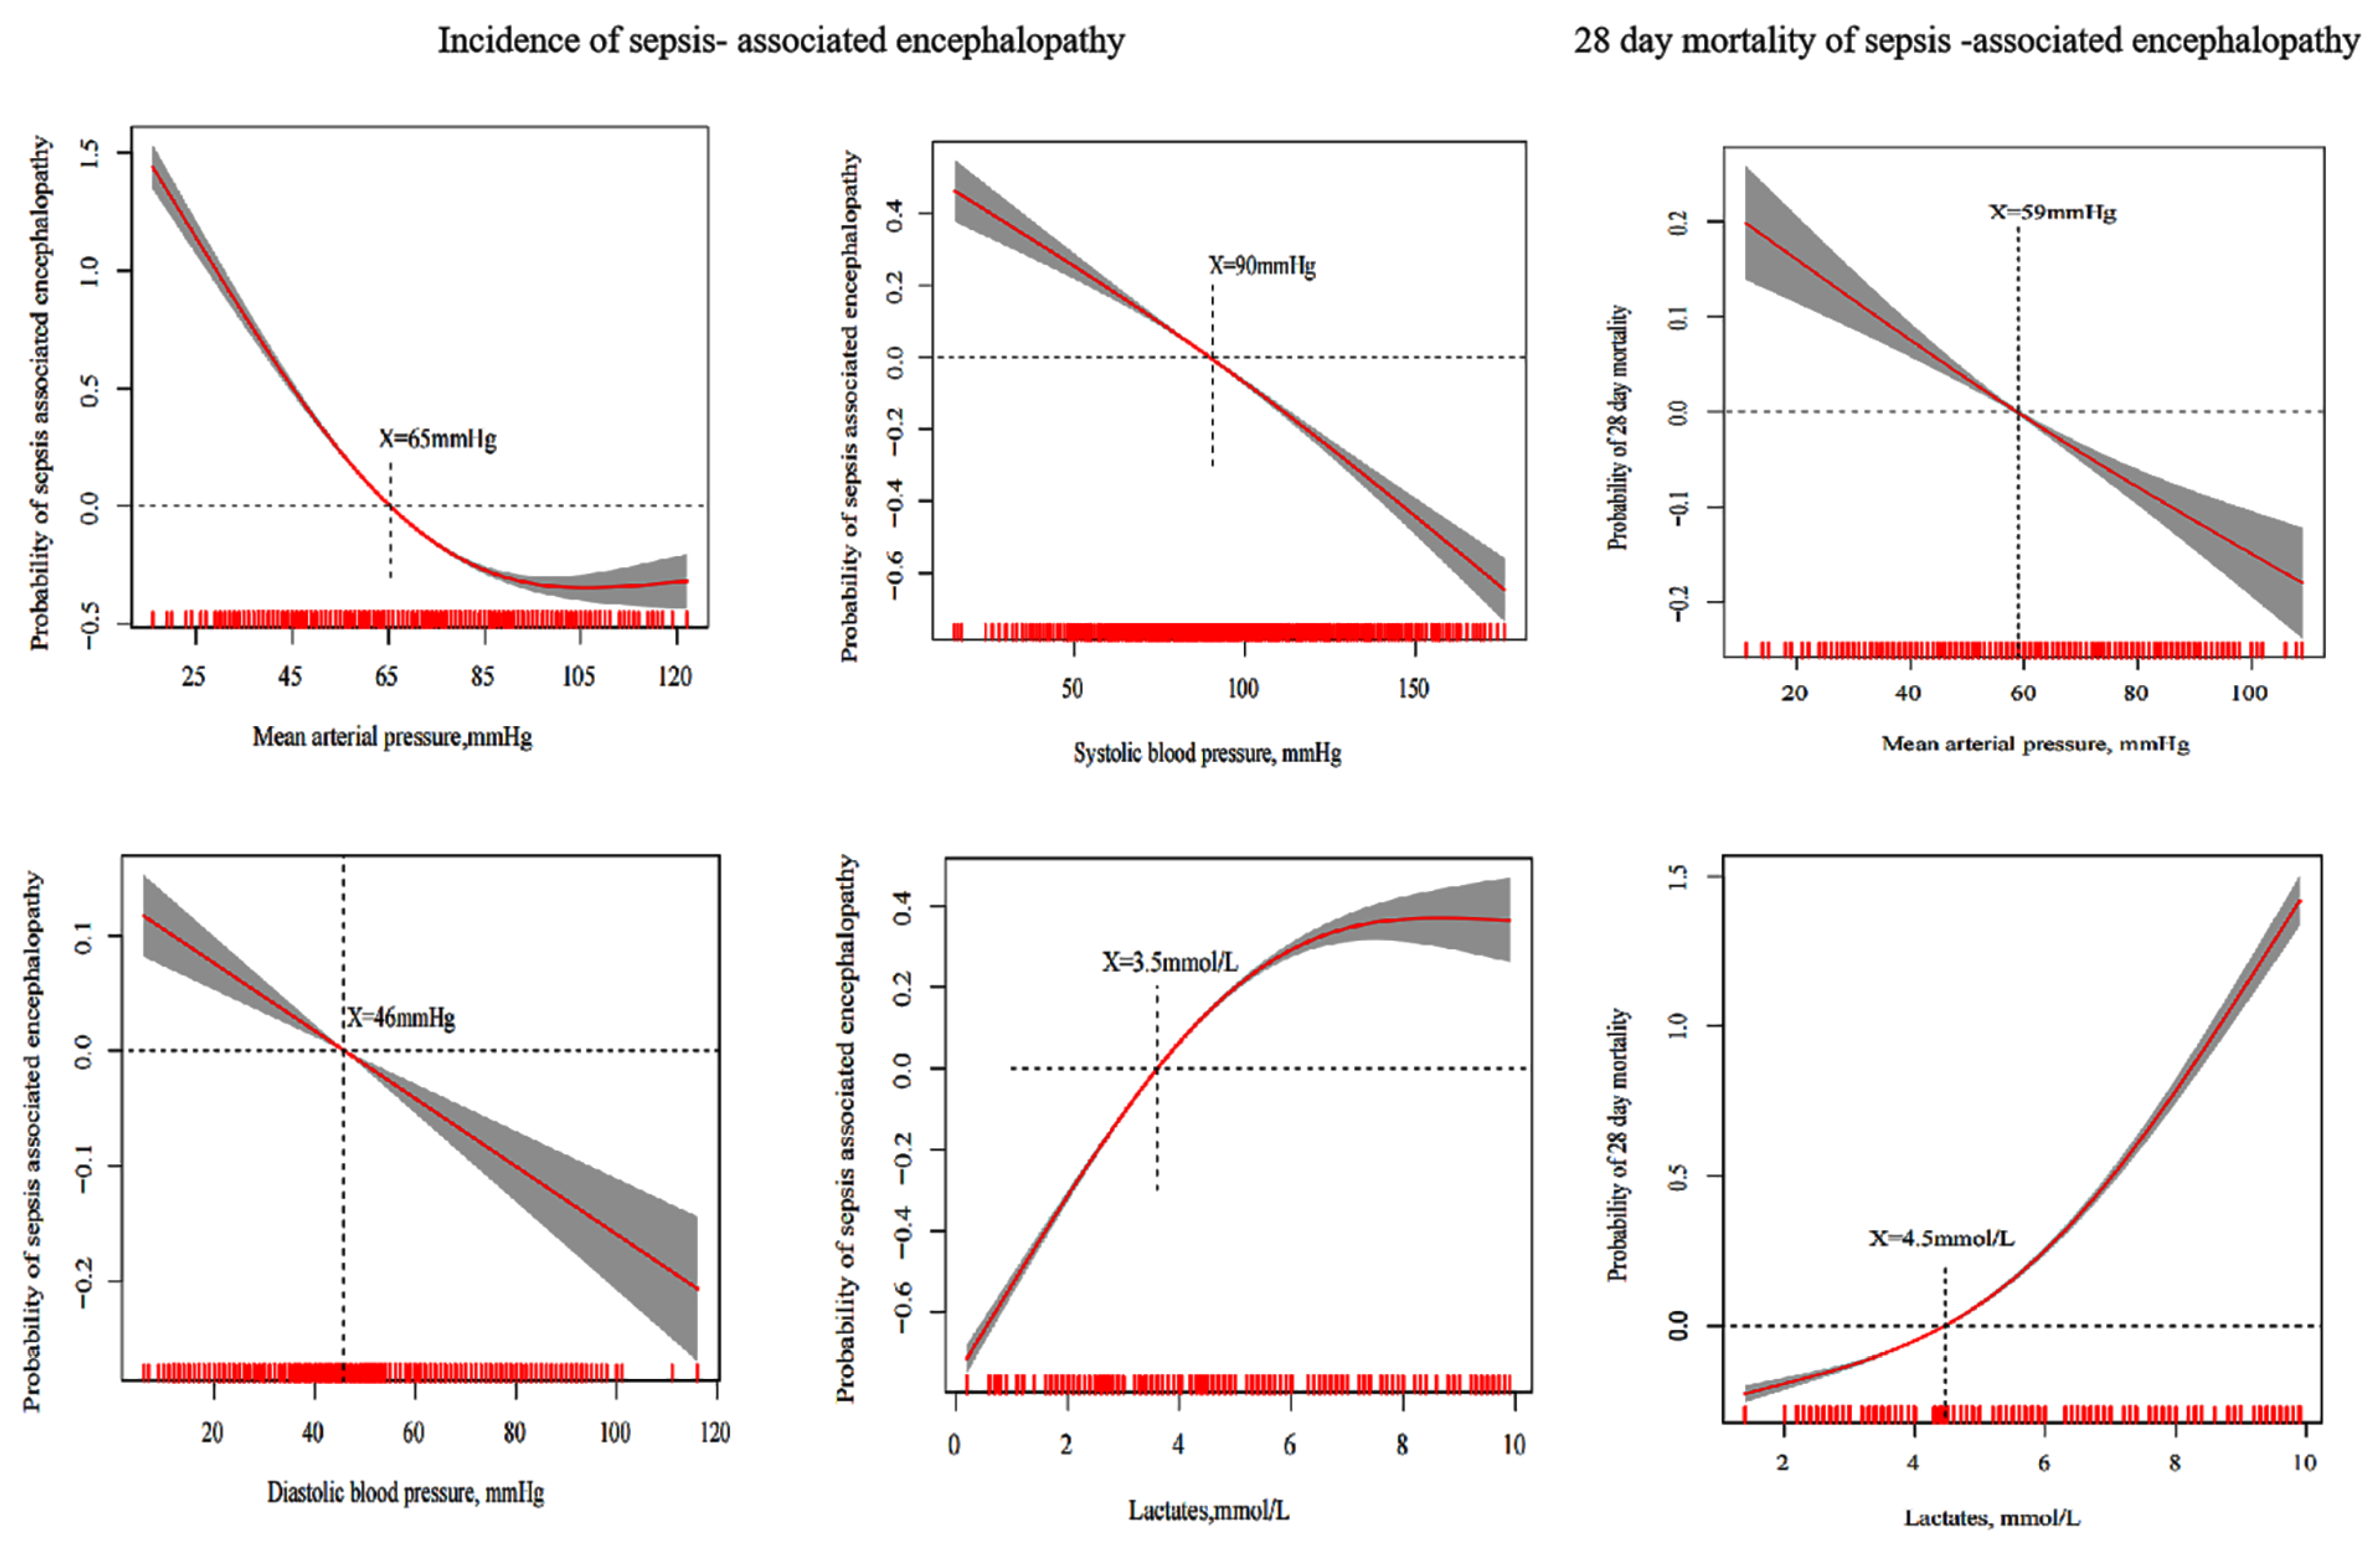
3.5. Generalized Additive Model to Estimate the Optimal Hemodynamic Targets for 28-Day Mortality of SAE
3.6. Multiple Model Analysis of Risk Factors for SAE Hospital Mortality
4. Discussion
5. Limitations
6. Conclusions
Supplementary Materials
Author Contributions
Funding
Institutional Review Board Statement
Informed Consent Statement
Data Availability Statement
Conflicts of Interest
Abbreviations
| GCS | Glasgow coma scale |
| MIMIC-IV | Medical Information Mart for Intensive Care IV |
| ICU | Intensive care unit |
| INR | International normalized ratio |
| PT | Prothrombin time |
| PTT | Partial thromboplastin time |
| SOFA | Sequential organ failure assessment |
| SAE | Sepsis-associated encephalopathy |
| IPW | Inverse probability weighting |
| SMD | Standardized mean differences |
| SSC | Surviving Sepsis Campaign |
References
- Eidelman, L.A.; Putterman, D.; Putterman, C.; Sprung, C.L. The spectrum of septic encephalopathy. Definitions, etiologies, and mortalities. JAMA J. Am. Med. Assoc. 1996, 275, 470–473. [Google Scholar] [CrossRef]
- Ely, W.E. Delirium as a Predictor of Mortality in Mechanically Ventilated Patients in the Intensive Care Unit. JAMA 2004, 291, 1753. [Google Scholar] [CrossRef] [Green Version]
- Sonneville, R.; de Montmollin, E.; Poujade, J.; Garrouste-Orgeas, M.; Souweine, B.; Darmon, M.; Mariotte, E.; Argaud, L.; Barbier, F.; Goldgran-Toledano, D.; et al. Potentially modifiable factors contributing to sepsis-associated encephalopathy. Intensive Care Med. 2017, 43, 1075–1084. [Google Scholar] [CrossRef]
- Zhao, L.; Li, Y.; Wang, Y.; Gao, Q.; Ge, Z.; Sun, X.; Li, Y. Development and Validation of a Nomogram for the Prediction of Hospital Mortality of Patients with Encephalopathy Caused by Microbial Infection:A Retrospective Cohort Study. Front Microbiol. 2021, 12, 737066. [Google Scholar] [CrossRef]
- Iwashyna, T.J.; Ely, E.W.; Smith, D.M.; Langa, K.M. Long-term Cognitive Impairment and Functional Disability Among Survivors of Severe Sepsis. JAMA 2010, 304, 1787. [Google Scholar] [CrossRef] [Green Version]
- Singh, S.; Evans, T.W. Organ dysfunction during sepsis. Intensive Care Med. 2006, 32, 349–360. [Google Scholar] [CrossRef] [PubMed]
- Pierrakos, C.; Attou, R.; Decorte, L.; Velissaris, D.; Bels, D.D. Cerebral perfusion alterations and cognitive decline in critically ill sepsis survivors. Acta Clin. Belg. 2016, 72, 39–44. [Google Scholar] [CrossRef]
- Rivera-Lara, L. The role of impaired brain perfusion in septic encephalopathy. Crit. Care 2019, 23, 54. [Google Scholar] [CrossRef] [PubMed] [Green Version]
- Young, G.B.; Bolton, C.F.; Archibald, Y.M.; Austin, T.W.; Wells, G.A. The electroencephalogram in sepsis-associated encephalopathy. J. Clin. Neurophysiol. 1992, 9, 145–152. [Google Scholar] [CrossRef]
- Taccone, F.S.; Su, F.; Pierrakos, C.; He, X. Cerebral microcirculation is impaired during sepsis: An experimental study. Crit. Care 2010, 14, R140. [Google Scholar] [CrossRef]
- Singer, M.; Deutschman, C.S.; Seymour, C.W.; Shankar-Hari, M.; Annane, D.; Bauer, M.; Bellomo, R.; Bernard, G.R.; Chiche, J.D.; Coopersmith, C.M.; et al. The Third International Consensus Definitions for Sepsis and Septic Shock (Sepsis-3). JAMA 2016, 315, 801–810. [Google Scholar] [CrossRef] [PubMed]
- Rosenblatt, K.; Walker, K.A.; Goodson, C.; Olson, E.; Maher, D.; Brown, C.H.T.; Nyquist, P. Cerebral Autoregulation-Guided Optimal Blood Pressure in Sepsis-Associated Encephalopathy: A Case Series. J. Intensive Care Med. 2020, 35, 1453–1464. [Google Scholar] [CrossRef] [PubMed]
- Yang, Y.; Liang, S.; Geng, J.; Wang, Q.; Wang, P.; Cao, Y.; Li, R.; Gao, G.; Li, L. Development of a nomogram to predict 30-day mortality of patients with sepsis-associated encephalopathy: A retrospective cohort study. J. Intensive Care 2020, 8, 45. [Google Scholar] [CrossRef]
- Tibshirani, R. Regression shrinking and selection via the Lasso. J. R. Stat. Soc. Ser. B Methodol. 1996, 58, 267–288. [Google Scholar]
- Stasinopoulos, M. Generalized Additive Models: An Introduction with R. by S. N. WOOD. Biometrics 2007, 63, 1298–1299. [Google Scholar] [CrossRef]
- Mccaffrey, D.F.; Griffin, B.A.; Almirall, D.; Slaughter, M.E.; Burgette, L.F. A tutorial on propensity score estimation for multiple treatments using generalized boosted models. Stat. Med. 2015, 32, 3388–3414. [Google Scholar] [CrossRef] [Green Version]
- Cole, S.R.; Hernan, M.A. Constructing inverse probability weights for marginal structural models. Am. J. Epidemiol. 2008, 168, 656–664. [Google Scholar] [CrossRef]
- Burkhart, C.S.; Siegemund, M.; Steiner, L.A. Cerebral perfusion in sepsis. Crit. Care 2010, 14, 215. [Google Scholar] [CrossRef] [Green Version]
- Mgab, C.; Idab, D.; Rna, B.; Gre, F.; Opab, G.; Bhab, H.; Jpka, B. Experimental sepsis-associated encephalopathy is accompanied by altered cerebral blood perfusion and water diffusion and related to changes in cyclooxygenase-2 expression and glial cell morphology but not to blood-brain barrier breakdown. Brain Behav. Immun. 2020, 83, 200–213. [Google Scholar]
- Sharshar, T.; Annane, D.; de la Grandmaison, G.L.; Brouland, J.P.; Hopkinson, N.S.; Francoise, G. The neuropathology of septic shock. Brain Pathol. 2004, 14, 21–33. [Google Scholar] [CrossRef]
- LeDoux, D.; Astiz, M.E.; Carpati, C.M.; Rackow, E.C. Effects of perfusion pressure on tissue perfusion in septic shock. Crit. Care Med. 2000, 28, 2729–2732. [Google Scholar] [CrossRef]
- Zhao, L.; Wang, Y.; Ge, Z.; Zhu, H.; Li, Y. Mechanical Learning for Prediction of Sepsis-Associated Encephalopathy. Front. Comput. Neurosci. 2021, 15, 739265. [Google Scholar] [CrossRef] [PubMed]
- Yamamoto, T.; Mizobata, Y.; Kawazoe, Y.; Miyamoto, K.; Ohta, Y.; Morimoto, T.; Yamamura, H. Incidence, risk factors, and outcomes for sepsis-associated delirium in patients with mechanical ventilation: A sub-analysis of a multicenter randomized controlled trial. J. Crit. Care 2020, 56, 140–144. [Google Scholar] [CrossRef]
- Feng, Q.; Ai, Y.H.; Gong, H.; Wu, L.; Ai, M.L.; Deng, S.Y.; Huang, L.; Peng, Q.Y.; Zhang, L.N. Characterization of Sepsis and Sepsis-Associated Encephalopathy. J. Intensive Care Med. 2019, 34, 938–945. [Google Scholar] [CrossRef] [PubMed]
- Chen, J.; Shi, X.; Diao, M.; Jin, G.; Zhu, Y.; Hu, W.; Xi, S. A retrospective study of sepsis-associated encephalopathy: Epidemiology, clinical features and adverse outcomes. BMC Emerg. Med. 2020, 20, 77. [Google Scholar] [CrossRef]
- Ebersoldt, M.; Sharshar, T.; Annane, D. Sepsis-associated delirium. Intensive Care Med. 2007, 33, 941–950. [Google Scholar] [CrossRef] [PubMed]
- Elizabeth, M.; David, M.C.; Daniel, L.; Ann, V.D.B.; Rebecca, F.; Gail, H. Point-of-care lactate testing for sepsis at presentation to health care: A systematic review of patient outcomes. Br. J. Gen. Pract. J. R. Coll. Gen. Pract. 2018, 67, e859–e870. [Google Scholar]
- Borthwick, H.A.; Brunt, L.K.; Mitchem, K.L.; Chaloner, C. Does lactate measurement performed on admission predict clinical outcome on the intensive care unit? A concise systematic review. Ann. Clin. Biochem. 2012, 49, 391. [Google Scholar] [CrossRef] [PubMed]
- Liu, G.; Lv, H.; An, Y.; Wei, X.; Yi, H. Early actate levelsfor prediction of mortality in patients with sepsis or septic shock: A meta-analysis. Int. J. Clin. Exp. Med. 2017, 10, 37–47. [Google Scholar]

| Original Cohort | Match Cohort | |||||
|---|---|---|---|---|---|---|
| Non-SAE Patients (n = 3172) | SAE Patients (n = 5861) | p | Non-SAE Patients (n = 2777) | SAE Patients (n = 2777) | p | |
| Baseline variables | ||||||
| Age (years) (median [IQR]) | 68.00 [60.00, 76.00] | 70.00 [61.00, 79.00] | <0.001 | 69.00 [60.00, 77.00] | 67.00 [58.00, 77.00] | <0.001 |
| Gender, (M (%)) | 2115 (66.7) | 3475 (59.3) | <0.001 | 1801 (64.9) | 1824 (65.7) | 0.535 |
| Coexisting illness, (n (%)) | ||||||
| Hypertension | 478 (15.1) | 895 (15.3) | 0.823 | 437 (15.7) | 391 (14.1) | 0.09 |
| Diabetes | 645 (20.3) | 1356 (23.1) | 0.002 | 599 (21.6) | 529 (19.0) | 0.021 |
| Respiration | 751 (23.7) | 1383 (23.6) | 0.953 | 724 (26.1) | 391 (14.1) | <0.001 |
| Renal | 1272 (40.1) | 2578 (44.0) | <0.001 | 1106 (39.8) | 1067 (38.4) | 0.296 |
| Site of infection, (n (%)) | ||||||
| Urinary | 214 (6.7) | 440 (7.5) | 0.197 | 197 (7.1) | 197 (7.1) | 1 |
| Lung | 128 (4.0) | 391 (6.7) | <0.001 | 120 (4.3) | 140 (5.0) | 0.227 |
| Catheter | 20 (0.6) | 110 (1.9) | <0.001 | 20 (0.7) | 23 (0.8) | 0.759 |
| Skin and soft tissue | 111 (3.5) | 214 (3.7) | 0.756 | 99 (3.6) | 90 (3.2) | 0.554 |
| Abdominal cavity | 91 (2.9) | 189 (3.2) | 0.385 | 88 (3.2) | 77 (2.8) | 0.429 |
| Microbiology type, (n (%)) | ||||||
| Acinetobacter baumannii | 3 (0.1) | 21 (0.4) | 0.035 | 3 (0.1) | 2 (0.1) | 1 |
| Klebsiella | 139 (4.4) | 355 (6.1) | 0.001 | 130 (4.7) | 114 (4.1) | 0.326 |
| Escherichia Coli | 263 (8.3) | 683 (11.7) | <0.001 | 256 (9.2) | 213 (7.7) | 0.043 |
| Pseudomonas aeruginosa | 85 (2.7) | 244 (4.2) | <0.001 | 82 (3.0) | 59 (2.1) | 0.061 |
| Staphylococcus aureus | 652 (20.6) | 1283 (21.9) | 0.147 | 575 (20.7) | 510 (18.4) | 0.03 |
| Fungus | 240 (7.6) | 914 (15.6) | <0.001 | 238 (8.6) | 187 (6.7) | 0.012 |
| Vital signs, (median [IQR]) | ||||||
| Heart rate (bpm) | 94.00 [86.00, 107.00] | 98.00 [88.00, 113.00] | <0.001 | 95.00 [87.00, 108.00] | 95.00 [86.00, 108.00] | 0.082 |
| Respiratory rate (bpm) | 25.25 [22.00, 29.00] | 26.00 [22.50, 31.00] | <0.001 | 26.00 [22.00, 30.00] | 25.00 [21.00, 29.00] | <0.001 |
| Systolic blood pressure (mmHg) | 90.00 [82.00, 101.00] | 86.00 [78.00, 95.00] | <0.001 | 92.00 [85.00, 102.00] | 90.00 [82.00, 101.00] | 0.026 |
| Diastolic blood pressure (mmHg) | 45.00 [40.00, 52.00] | 45.00 [39.00, 51.00] | <0.001 | 49.00 [43.00, 56.00] | 45.00 [40.00, 52.00] | <0.001 |
| Mean arterial pressure (mmHg) | 66.00 [63.00, 69.00] | 58.00 [53.00, 64.00] | <0.001 | 66.00 [63.00, 69.00] | 64.00 [59.00, 71.00] | <0.001 |
| Laboratory parameters (median [IQR]) | ||||||
| White blood cell (×109 /L) | 14.80 [10.90, 19.60] | 14.60 [10.70, 19.60] | 0.241 | 14.70 [10.90, 19.82] | 14.20 [10.50, 18.80] | <0.001 |
| Hemoglobin (g/dL) | 9.30 [8.10, 10.60] | 9.20 [7.90, 10.60] | 0.004 | 9.30 [8.10, 10.60] | 9.50 [8.20, 10.90] | <0.001 |
| Platelet (×109 /L) | 137.00 [105.00, 189.00] | 147.00 [105.00, 209.00] | <0.001 | 138.00 [105.00, 193.00] | 149.00 [110.00, 201.00] | <0.001 |
| INR | 1.40 [1.30,1.70] | 1.50 [1.20, 1.70] | 0.026 | 1.40 [1.30, 1.70] | 1.40 [1.20, 1.69] | 0.119 |
| PT(s) | 15.70 [14.10, 18.30] | 16.10 [14.00, 18.70] | 0.070 | 15.80[14.10, 18.30] | 15.80 [13.90, 18.20] | 0.192 |
| PTT(s) | 35.20 [30.20, 42.12] | 36.80 [30.50, 44.30] | <0.001 | 35.50[30.30, 42.90] | 35.60 [30.10, 42.90] | 0.635 |
| Creatinine (mg/dL) | 1.10 [0.80, 1.60] | 1.10 [0.80, 1.70] | 0.183 | 1.10 [0.80, 1.68] | 1.05 [0.80, 1.50] | 0.005 |
| Blood urea nitrogen (mg/dL) | 20.00 [15.00, 31.00] | 22.00 [15.00, 36.00] | <0.001 | 20.00 [15.00, 32.00] | 20.00 [15.00, 33.00] | 0.655 |
| Albumin (g/dL) | 3.60 [2.90, 4.20] | 3.40 [2.70, 4.00] | <0.001 | 3.60 [2.80, 4.20] | 3.40 [2.70, 4.10] | <0.001 |
| Glucose (mg/dL) | 130.00 [111.00, 162.00] | 137.00 [114.00, 174.00] | <0.001 | 131.00 [111.00, 163.00] | 135.00 [113.00, 169.00] | 0.013 |
| Sodium (mmol/L) | 139.00 [136.00, 141.00] | 139.00 [137.00, 142.00] | <0.001 | 139.00 [136.00, 141.00] | 139.00 [136.00, 141.00] | 0.602 |
| Lactates (mmol/L) | 3.30 [1.90, 4.20] | 4.40 [4.00, 4.80] | <0.001 | 3.30 [1.90, 4.20] | 4.40 [3.80, 4.80] | <0.001 |
| The score system, (median [IQR]) | ||||||
| SOFA | 4.00 [3.00, 6.00] | 6.00 [4.00, 9.00] | <0.001 | 5.00 [3.00, 7.00] | 5.00 [3.00, 7.00] | 0.001 |
| GCS | 15.00 [15.00, 15.00] | 12.00 [7.00, 14.00] | <0.001 | 15.00 [15.00, 15.00] | 13.00 [10.00, 14.00] | <0.001 |
| Mechanical ventilation, (n (%)) | 2344 (73.9) | 4617 (78.8) | <0.001 | 2079 (74.9) | 1989 (71.6) | 0.007 |
| Use of vasopressors, (n (%) | ||||||
| Epinephrine, (n (%)) | 478 (15.1) | 888 (15.2) | 0.942 | 456 (16.4) | 274 (9.9) | <0.001 |
| Phenylephrine, (n (%)) | 1952 (61.5) | 3602 (61.5) | 0.958 | 1685 (60.7) | 1673 (60.2) | 0.763 |
| Dobutamine, (n (%)) | 122 (3.8) | 204 (3.5) | 0.407 | 101 (3.6) | 80 (2.9) | 0.131 |
| Dopamine, (n (%)) | 180 (5.7) | 359 (6.1) | 0.414 | 159 (5.7) | 127 (4.6) | 0.06 |
| Norepinephrine, (n (%)) | 1319 (41.6) | 2954 (50.4) | <0.001 | 1190 (42.9) | 1261 (45.4) | 0.059 |
| Length of hospital stays, days (median [IQR]) | 2.30 [1.30, 5.00] | 4.20 [2.10, 9.70] | <0.001 | 2.30 [1.30, 5.10] | 4.10 [1.80, 10.00] | <0.001 |
| Hospital mortality, (n (%)) | 226 (7.1) | 898 (15.3) | <0.001 | 213 (7.7) | 267 (9.6) | 0.011 |
| 28-day mortality | 214 (6.7) | 839 (14.3) | <0.001 | 0.07 (0.26) | 203 (7.3) | <0.001 |
| Models | OR | CI | p | |
|---|---|---|---|---|
| 2.5% | 97.5% | |||
| Lasso regression + Multivariate Logistic analysis (Original cohort) | ||||
| Mean arterial pressure ≥ 65 mmHg | 0.26 | 0.23 | 0.30 | <0.001 |
| Diastolic blood pressure ≥ 46 mmHg | 0.94 | 0.83 | 1.05 | 0.258 |
| Systolic blood pressure ≥ 90 mmHg | 0.60 | 0.53 | 0.68 | <0.001 |
| Lactates ≤ 3.5 (mmol/L) | 0.20 | 0.18 | 0.23 | <0.001 |
| Propensity score matching | ||||
| Mean arterial pressure ≥ 65 mmHg | 0.34 | 0.30 | 0.38 | <0.001 |
| Diastolic blood pressure ≥ 46 mmHg | 0.98 | 0.88 | 1.08 | 0.648 |
| Systolic blood pressure ≥ 90 mmHg | 0.60 | 0.54 | 0.66 | <0.001 |
| Lactates ≤ 3.5 (mmol/L) | 0.29 | 0.26 | 0.32 | <0.001 |
| Propensity score IPW | ||||
| Mean arterial pressure ≥ 65 mmHg | 0.33 | 0.30 | 0.36 | <0.001 |
| Diastolic blood pressure ≥ 46 mmHg | 0.93 | 0.85 | 1.02 | 0.122 |
| Systolic blood pressure ≥ 90 mmHg | 0.64 | 0.58 | 0.70 | <0.001 |
| Lactates ≤ 3.5 (mmol/L) | 0.30 | 0.27 | 0.33 | <0.001 |
| Doubly robustestimation with all covariates | ||||
| Mean arterial pressure ≥ 65 mmHg | 0.63 | 0.60 | 0.67 | <0.001 |
| Diastolic blood pressure ≥ 46 mmHg | 0.97 | 0.93 | 1.00 | 0.063 |
| Systolic blood pressure ≥ 90 mmHg | 0.86 | 0.83 | 0.89 | <0.001 |
| Lactates ≤ 3.5(mmol/L) | 0.63 | 0.59 | 0.66 | <0.001 |
| Models | OR | CI | p | |
|---|---|---|---|---|
| 2.5% | 97.5% | |||
| Lasso regression + Multivariate Logistic analysis (Original cohort) | ||||
| Mean arterial pressure ≥ 59 mmHg | 0.79 | 0.64 | 0.97 | 0.023 |
| Lactates ≤ 4.5 (mmol/L) | 0.068 | 0.055 | 0.084 | <0.001 |
| Propensity score matching | ||||
| Mean arterial pressure ≥ 59 mmHg | 0.75 | 0.62 | 0.91 | <0.003 |
| Lactates ≤ 4.5 (mmol/L) | 0.35 | 0.29 | 0.43 | <0.001 |
| Propensity score IPW | ||||
| Mean arterial pressure ≥ 59 mmHg | 0.73 | 0.62 | 0.86 | <0.001 |
| Lactates ≤ 4.5 (mmol/L) | 0.33 | 0.28 | 0.39 | <0.001 |
| Doubly robust estimationwith all covariates | ||||
| Mean arterial pressure ≥ 59 mmHg | 0.79 | 0.69 | 0.90 | 0.001 |
| Lactates ≤ 4.5 (mmol/L) | 0.50 | 0.44 | 0.57 | <0.001 |
Publisher’s Note: MDPI stays neutral with regard to jurisdictional claims in published maps and institutional affiliations. |
© 2022 by the authors. Licensee MDPI, Basel, Switzerland. This article is an open access article distributed under the terms and conditions of the Creative Commons Attribution (CC BY) license (https://creativecommons.org/licenses/by/4.0/).
Share and Cite
Zhao, L.; Liu, B.; Wang, Y.; Wang, Z.; Xie, K.; Li, Y. New Strategies to Optimize Hemodynamics for Sepsis-Associated Encephalopathy. J. Pers. Med. 2022, 12, 1967. https://doi.org/10.3390/jpm12121967
Zhao L, Liu B, Wang Y, Wang Z, Xie K, Li Y. New Strategies to Optimize Hemodynamics for Sepsis-Associated Encephalopathy. Journal of Personalized Medicine. 2022; 12(12):1967. https://doi.org/10.3390/jpm12121967
Chicago/Turabian StyleZhao, Lina, Bin Liu, Yunying Wang, Zhiwei Wang, Keliang Xie, and Yun Li. 2022. "New Strategies to Optimize Hemodynamics for Sepsis-Associated Encephalopathy" Journal of Personalized Medicine 12, no. 12: 1967. https://doi.org/10.3390/jpm12121967
APA StyleZhao, L., Liu, B., Wang, Y., Wang, Z., Xie, K., & Li, Y. (2022). New Strategies to Optimize Hemodynamics for Sepsis-Associated Encephalopathy. Journal of Personalized Medicine, 12(12), 1967. https://doi.org/10.3390/jpm12121967