
Monocyte Distribution Width, Neutrophil-to-Lymphocyte Ratio, and Platelet-to-Lymphocyte Ratio Improves Early Prediction for Sepsis at the Emergency

 ,
,  , and
, and 
Abstract
:1. Introduction
2. Materials and Methods
2.1. The Study Design and Data Collection
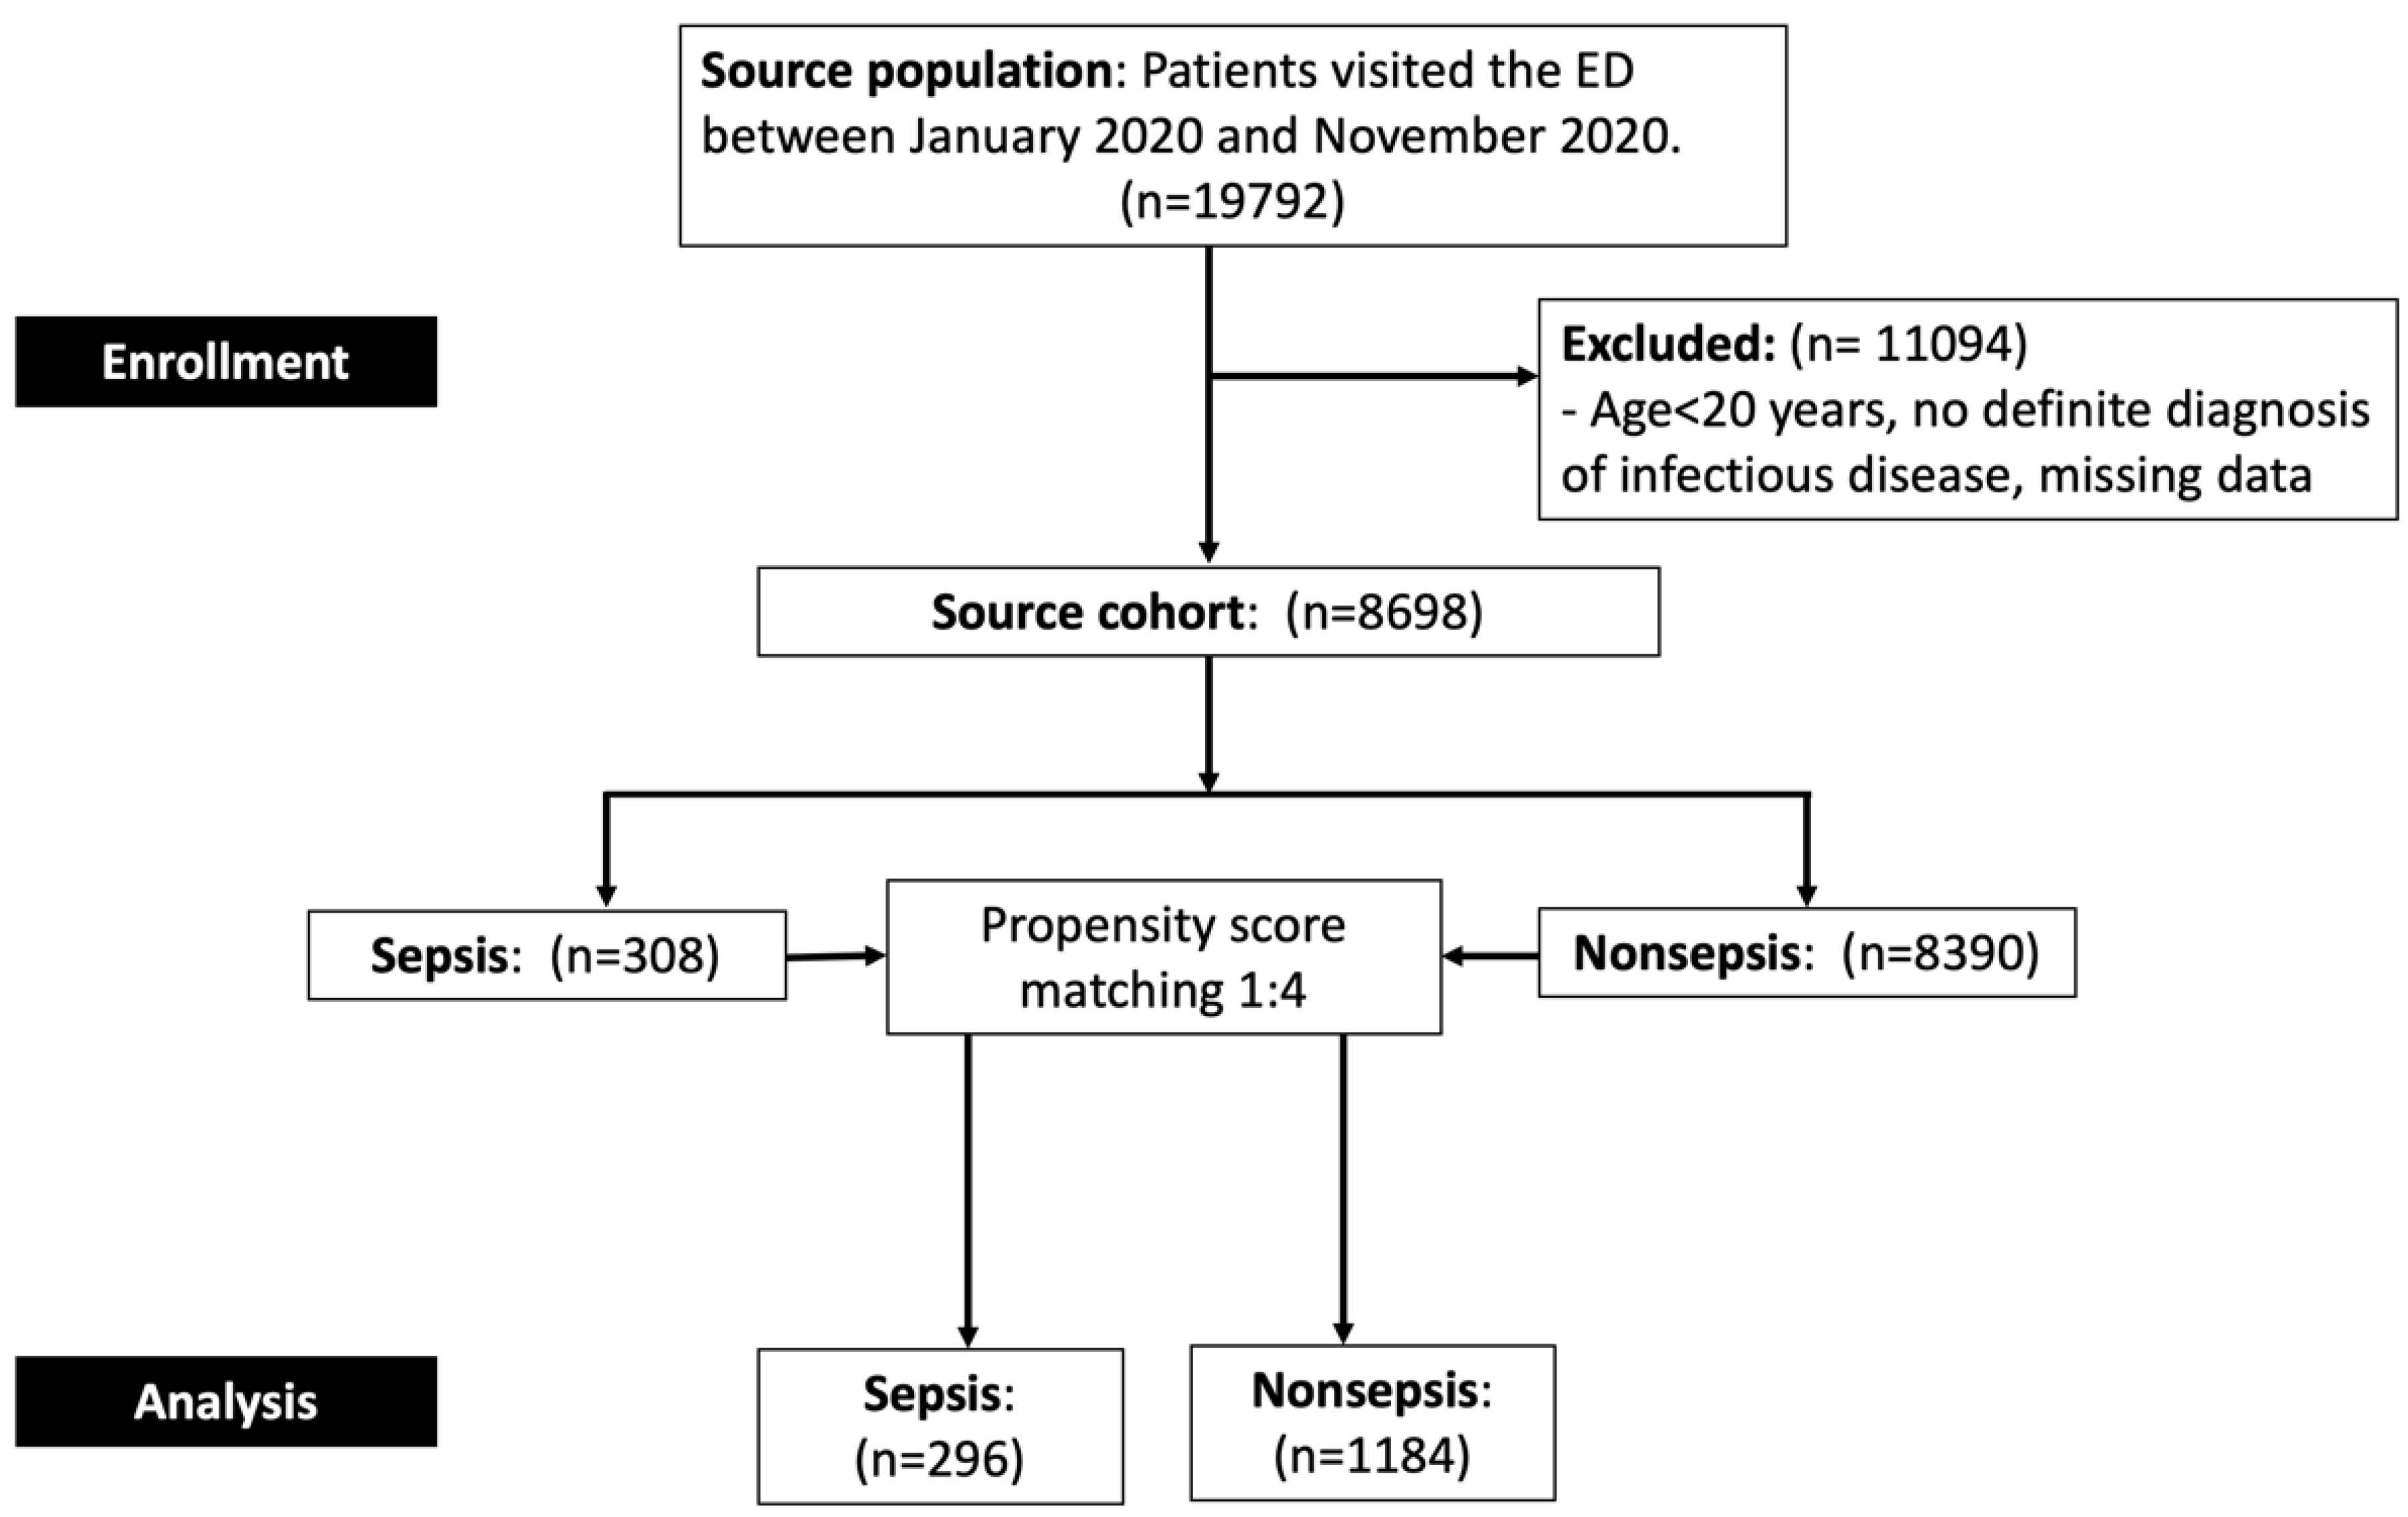
2.2. Participants
2.3. Outcome Measures
2.4. New Biomarker Measurement
2.5. Statistical Analysis
3. Results
3.1. Characteristics of Enrolled Participants
3.2. Predictors for Sepsis
3.3. Multivariate Models for Predicting Sepsis
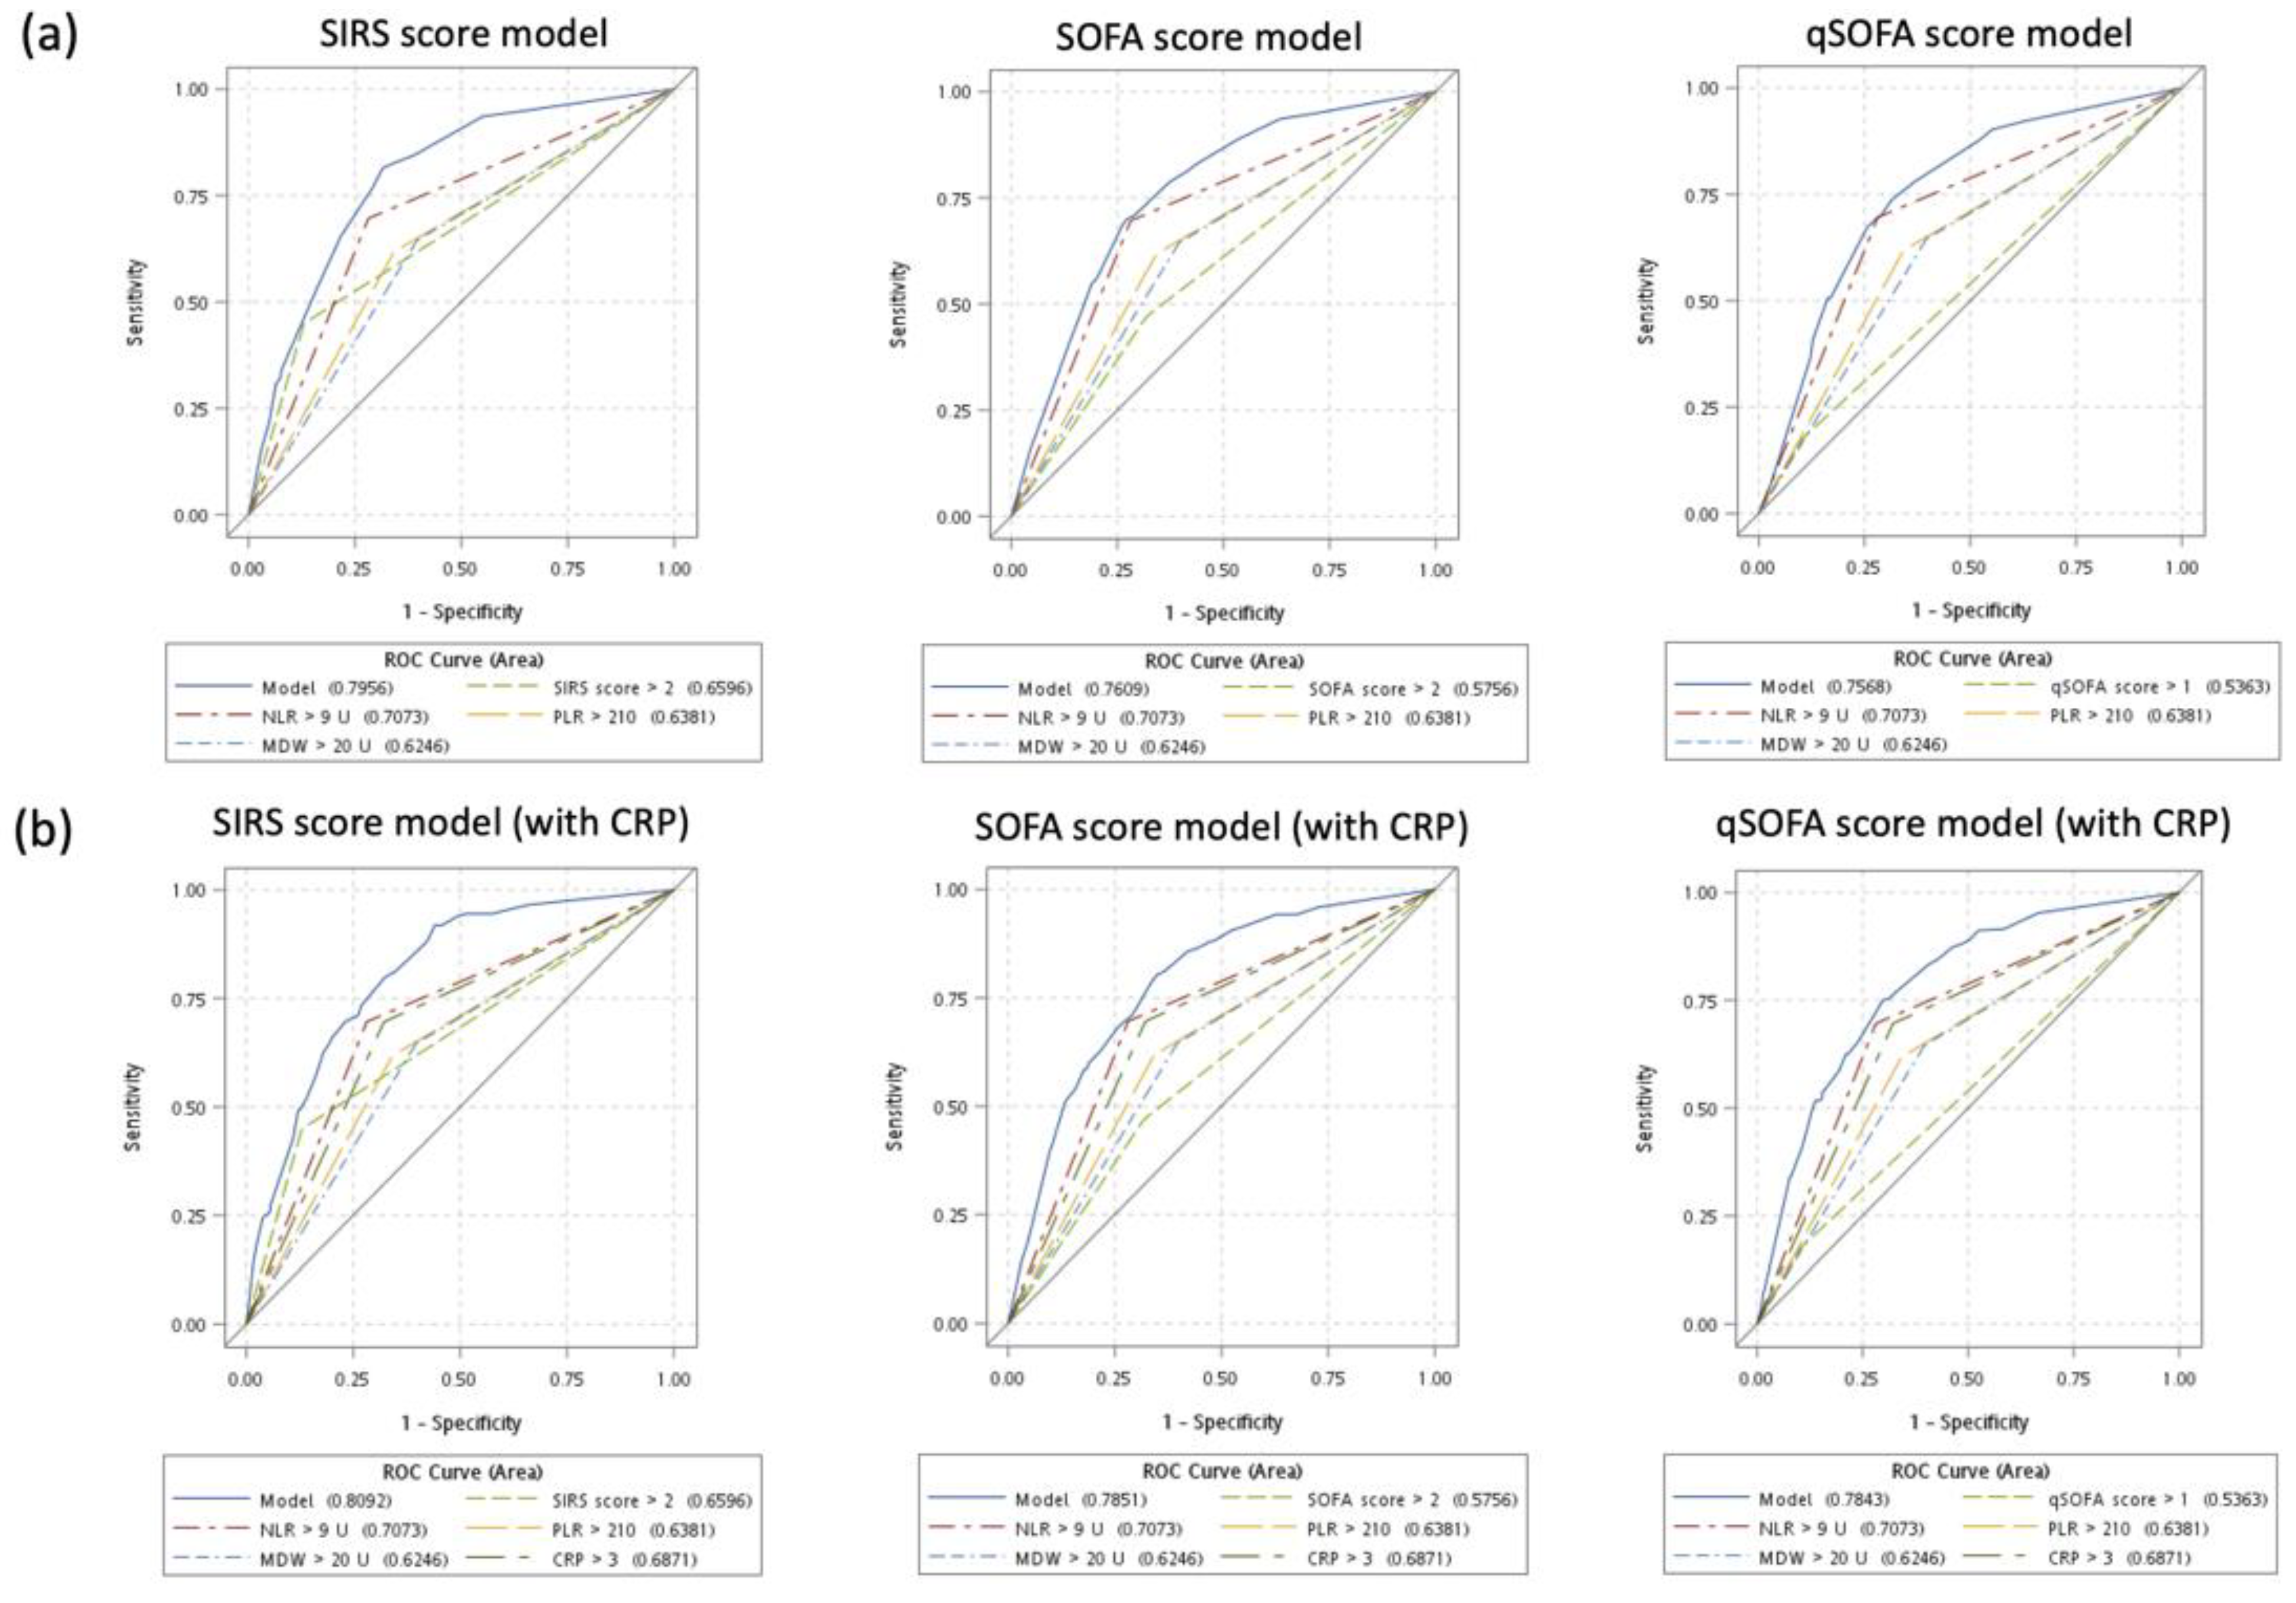
3.4. Sensitivity Analysis: Diagnostic Performance of Multivariate Models without and with CRP
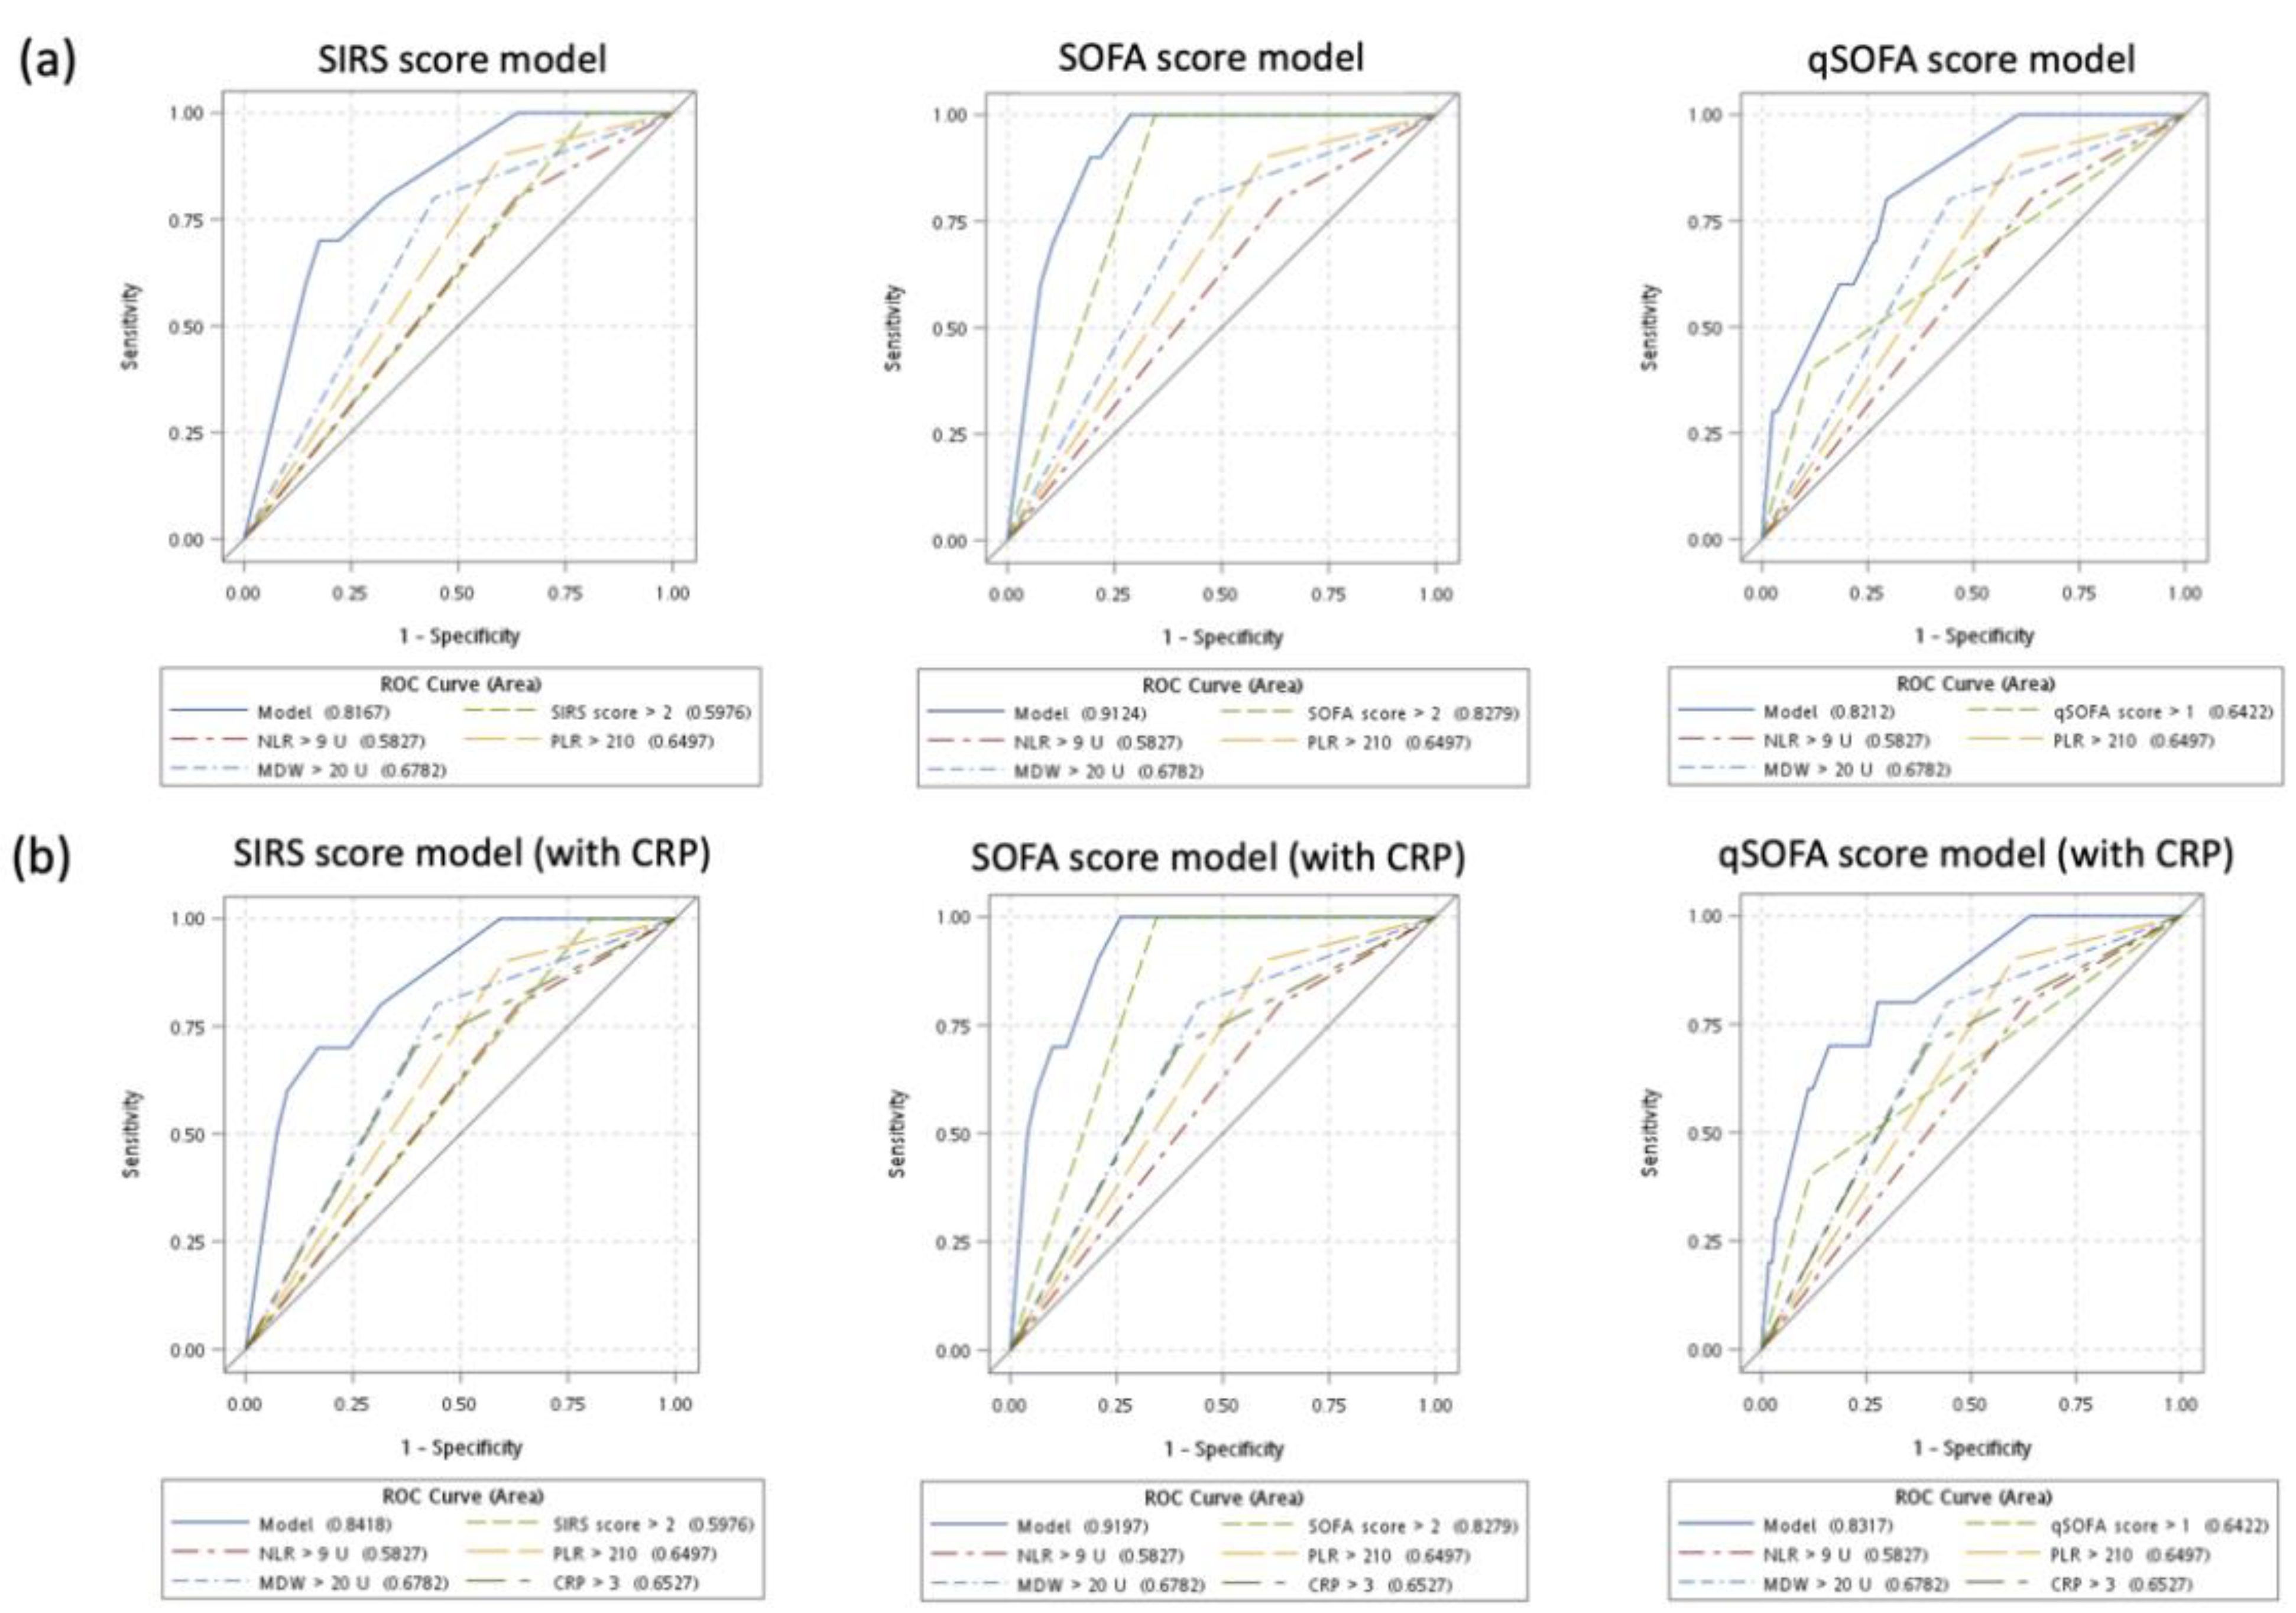
3.5. Secondary Outcome: Predicting Mortality for Patients with Sepsis
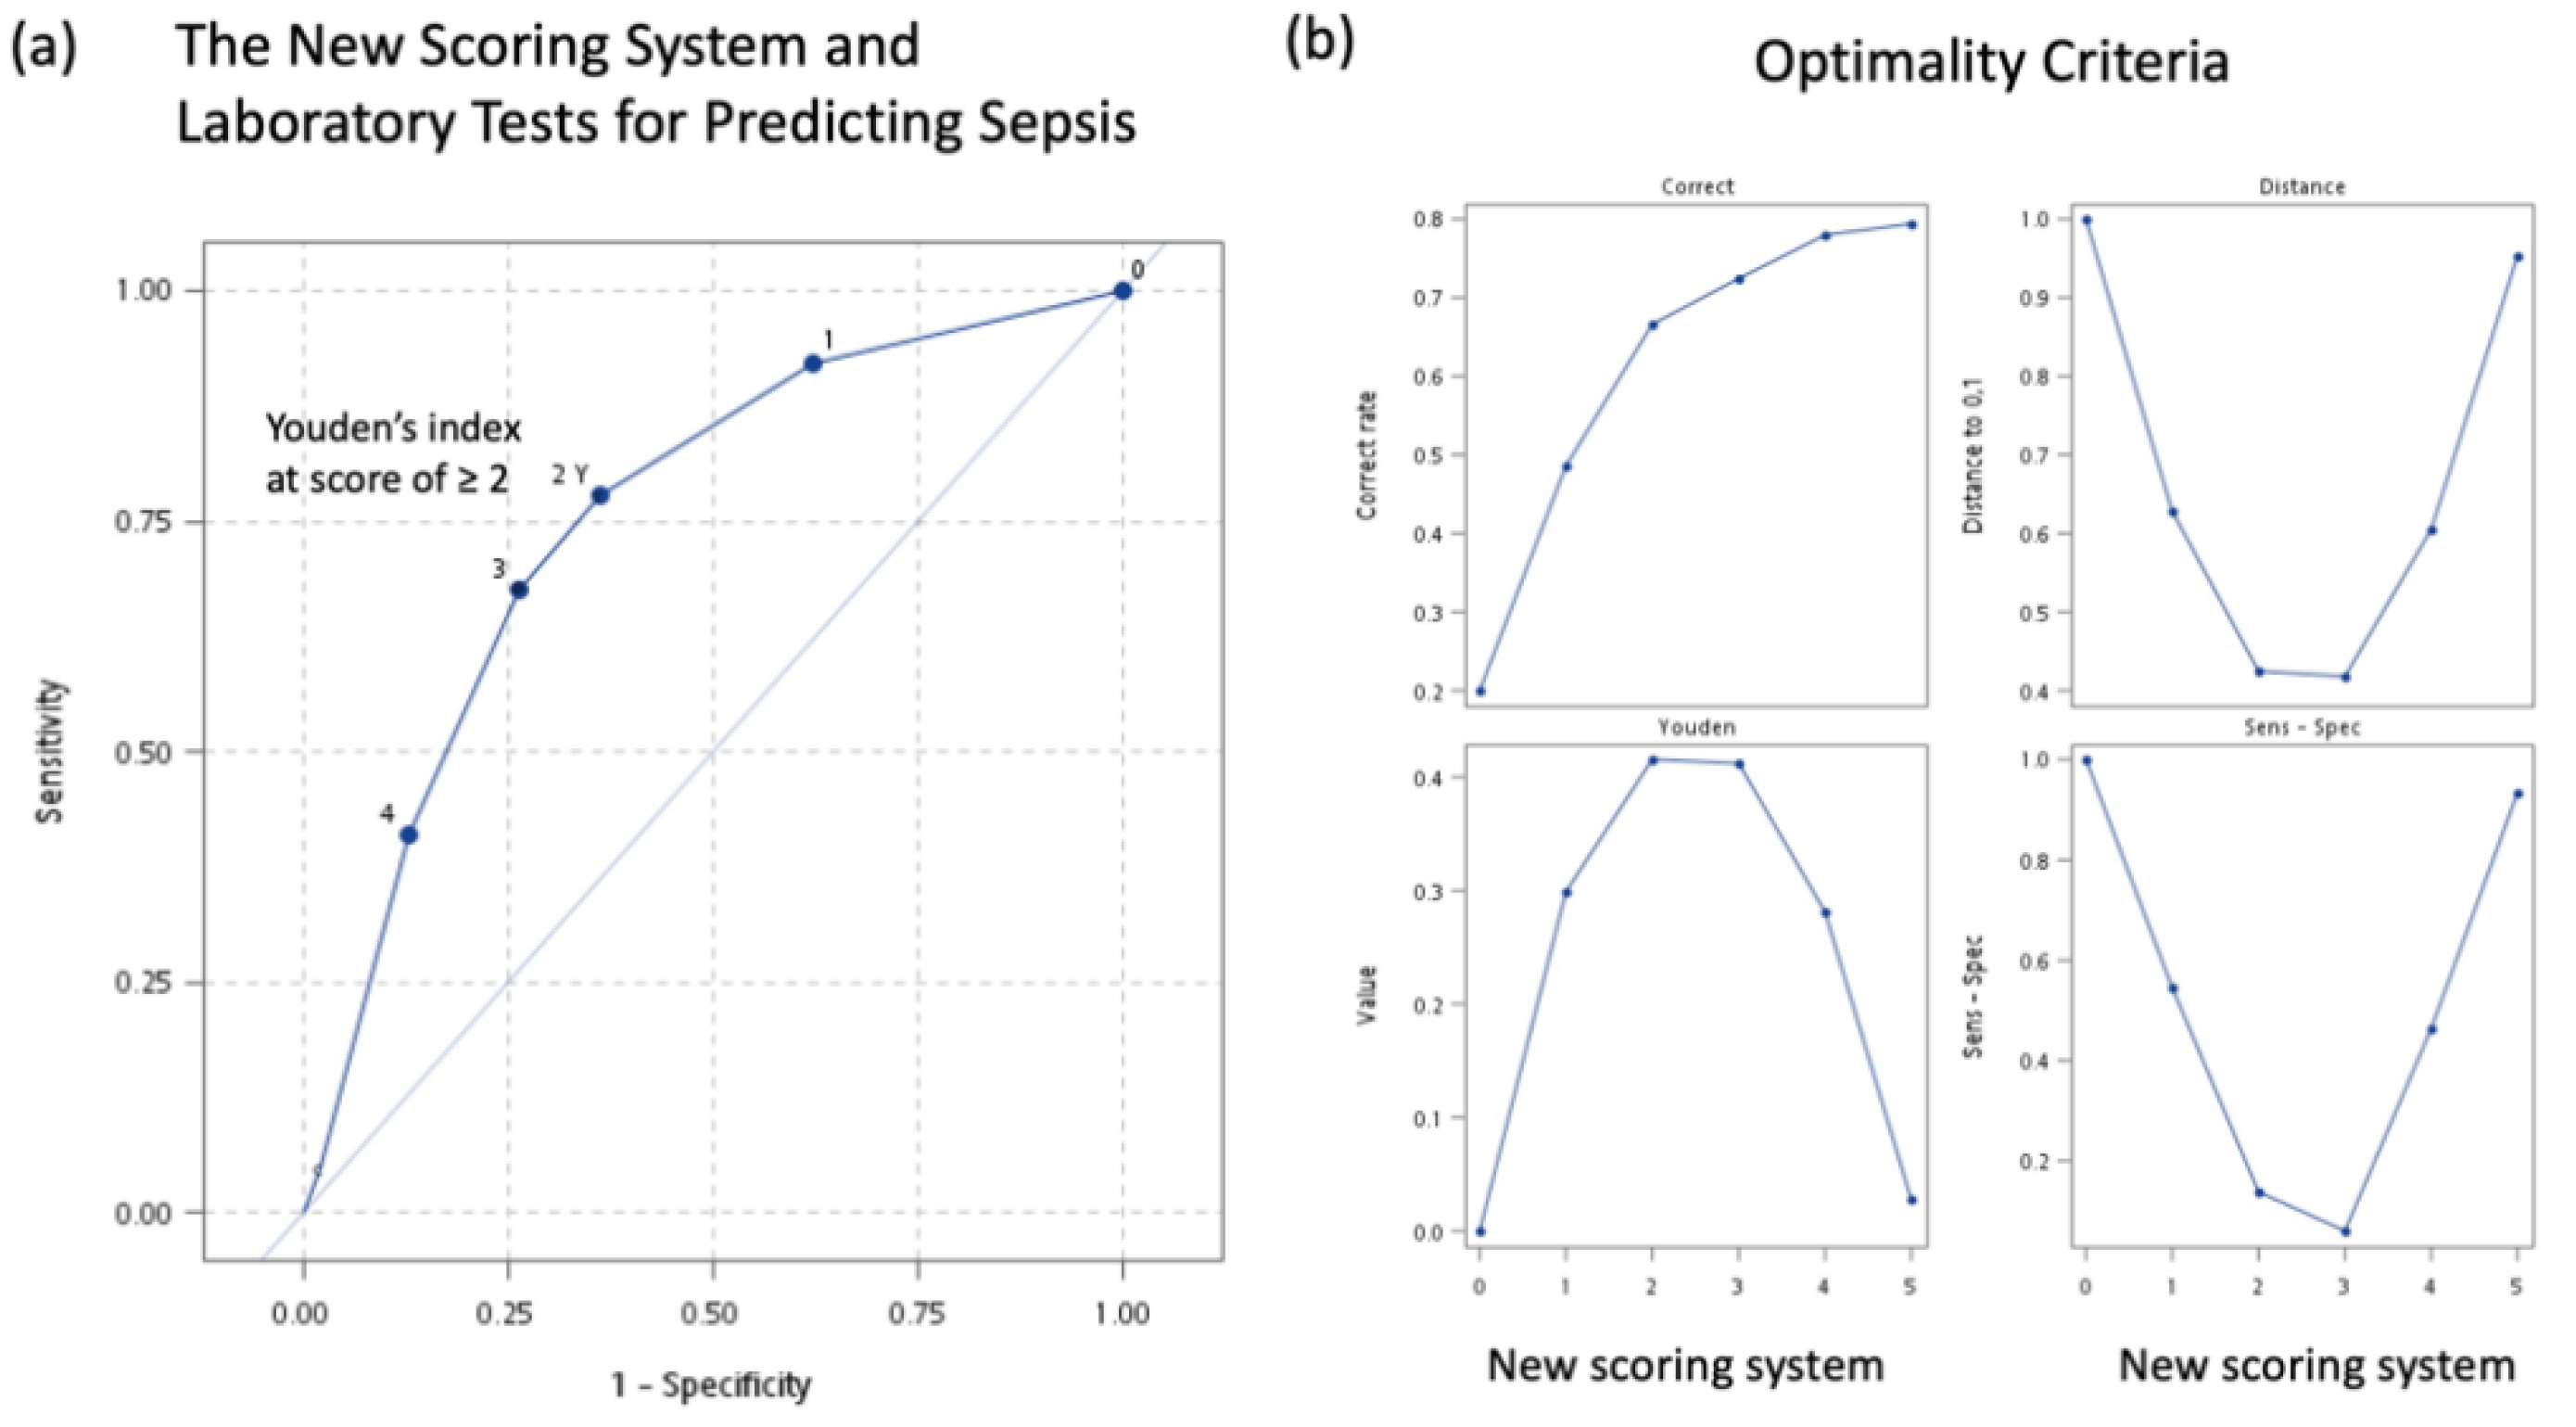
3.6. A New Simple Scoring System for Predicting Sepsis
4. Discussion
5. Conclusions
Supplementary Materials
Author Contributions
Funding
Institutional Review Board Statement
Informed Consent Statement
Data Availability Statement
Acknowledgments
Conflicts of Interest
References
- Martin, G.S.; Mannino, D.M.; Eaton, S.; Moss, M. The epidemiology of sepsis in the United States from 1979 through 2000. N. Engl. J. Med. 2003, 348, 1546–1554. [Google Scholar] [CrossRef] [PubMed] [Green Version]
- Peake, S.L.; Bailey, M.; Bellomo, R.; Cameron, P.A.; Cross, A.; Delaney, A.; Finfer, S.; Higgins, A.; Jones, D.A.; Myburgh, J.A. Australasian resuscitation of sepsis evaluation (ARISE): A multi-centre, prospective, inception cohort study. Resuscitation 2009, 80, 811–818. [Google Scholar] [CrossRef]
- Dombrovskiy, V.Y.; Martin, A.A.; Sunderram, J.; Paz, H.L. Rapid increase in hospitalization and mortality rates for severe sepsis in the United States: A trend analysis from 1993 to 2003. Crit. Care Med. 2007, 35, 1244–1250. [Google Scholar] [CrossRef]
- Vincent, J.-L.; Marshall, J.C.; Ñamendys-Silva, S.A.; François, B.; Martin-Loeches, I.; Lipman, J.; Reinhart, K.; Antonelli, M.; Pickkers, P.; Njimi, H. Assessment of the worldwide burden of critical illness: The intensive care over nations (ICON) audit. Lancet Respir. Med. 2014, 2, 380–386. [Google Scholar] [CrossRef]
- Fleischmann, C.; Scherag, A.; Adhikari, N.K.; Hartog, C.S.; Tsaganos, T.; Schlattmann, P.; Angus, D.C.; Reinhart, K. Assessment of global incidence and mortality of hospital-treated sepsis. Current estimates and limitations. Am. J. Respir. Crit. Care Med. 2016, 193, 259–272. [Google Scholar] [CrossRef]
- Yang, X.-J.; Liu, D.; Ren, H.-Y.; Zhang, X.-Y.; Zhang, J.; Yang, X.-J. Effects of sepsis and its treatment measures on intestinal flora structure in critical care patients. World J. Gastroenterol. 2021, 27, 2376. [Google Scholar] [CrossRef]
- Daniels, R. Surviving the first hours in sepsis: Getting the basics right (an intensivist’s perspective). J. Antimicrob. Chemother. 2011, 66 (Suppl. 2), ii11–ii23. [Google Scholar] [CrossRef] [Green Version]
- Sherwin, R.; Winters, M.E.; Vilke, G.M.; Wardi, G. Does Early and Appropriate Antibiotic Administration Improve Mortality in Emergency Department Patients with Severe Sepsis or Septic Shock? J. Emerg. Med. 2017, 53, 588–595. [Google Scholar] [CrossRef] [PubMed]
- Crouser, E.D.; Parrillo, J.E.; Seymour, C.; Angus, D.C.; Bicking, K.; Tejidor, L.; Magari, R.; Careaga, D.; Williams, J.; Closser, D.R.; et al. Improved Early Detection of Sepsis in the ED With a Novel Monocyte Distribution Width Biomarker. Chest 2017, 152, 518–526. [Google Scholar] [CrossRef] [PubMed]
- Peltan, I.D.; Brown, S.M.; Bledsoe, J.R.; Sorensen, J.; Samore, M.H.; Allen, T.L.; Hough, C.L. ED Door-to-Antibiotic Time and Long-term Mortality in Sepsis. Chest 2019, 155, 938–946. [Google Scholar] [CrossRef] [PubMed]
- Bone, R.C.; Balk, R.A.; Cerra, F.B.; Dellinger, R.P.; Fein, A.M.; Knaus, W.A.; Schein, R.M.; Sibbald, W.J. Definitions for sepsis and organ failure and guidelines for the use of innovative therapies in sepsis. The ACCP/SCCM Consensus Conference Committee. American College of Chest Physicians/Society of Critical Care Medicine. Chest 1992, 101, 1644–1655. [Google Scholar] [CrossRef] [PubMed] [Green Version]
- Seymour, C.W.; Liu, V.X.; Iwashyna, T.J.; Brunkhorst, F.M.; Rea, T.D.; Scherag, A.; Rubenfeld, G.; Kahn, J.M.; Shankar-Hari, M.; Singer, M. Assessment of clinical criteria for sepsis: For the Third International Consensus Definitions for Sepsis and Septic Shock (Sepsis-3). JAMA 2016, 315, 762–774. [Google Scholar] [CrossRef] [PubMed] [Green Version]
- Vincent, J.-L.; Moreno, R.; Takala, J.; Willatts, S.; De Mendonça, A.; Bruining, H.; Reinhart, C.; Suter, P.; Thijs, L.G. The SOFA (Sepsis-Related Organ Failure Assessment) Score to Describe Organ Dysfunction/Failure; Springer: Berlin/Heidelberg, Germany, 1996. [Google Scholar]
- Singer, M.; Deutschman, C.S.; Seymour, C.W.; Shankar-Hari, M.; Annane, D.; Bauer, M.; Bellomo, R.; Bernard, G.R.; Chiche, J.D.; Coopersmith, C.M.; et al. The Third International Consensus Definitions for Sepsis and Septic Shock (Sepsis-3). JAMA 2016, 315, 801–810. [Google Scholar] [CrossRef]
- Agnello, L.; Sasso, B.L.; Giglio, R.V.; Bivona, G.; Gambino, C.M.; Cortegiani, A.; Ciaccio, A.M.; Vidali, M.; Ciaccio, M. Monocyte distribution width as a biomarker of sepsis in the intensive care unit: A pilot study. Ann. Clin. Biochem. 2021, 58, 70–72. [Google Scholar] [CrossRef]
- Nam, M.; Son, B.H.; Seo, J.E.; Kim, I.R.; Park, C.K.; Kim, H.K. Improved Diagnostic and Prognostic Power of Combined Delta Neutrophil Index and Mean Platelet Volume in Pediatric Sepsis. Ann. Clin. Lab. Sci. 2018, 48, 223–230. [Google Scholar]
- Ljungström, L.; Pernestig, A.K.; Jacobsson, G.; Andersson, R.; Usener, B.; Tilevik, D. Diagnostic accuracy of procalcitonin, neutrophil-lymphocyte count ratio, C-reactive protein, and lactate in patients with suspected bacterial sepsis. PLoS ONE 2017, 12, e0181704. [Google Scholar] [CrossRef]
- Pierce, R.; Bigham, M.T.; Giuliano, J.S., Jr. Use of procalcitonin for the prediction and treatment of acute bacterial infection in children. Curr. Opin. Pediatr. 2014, 26, 292–298. [Google Scholar] [CrossRef] [PubMed]
- Schuetz, P.; Albrich, W.; Christ-Crain, M.; Chastre, J.; Mueller, B. Procalcitonin for guidance of antibiotic therapy. Expert Rev. Anti-Infect. Ther. 2010, 8, 575–587. [Google Scholar] [CrossRef] [PubMed]
- Rey, C.; Los Arcos, M.; Concha, A.; Medina, A.; Prieto, S.; Martinez, P.; Prieto, B. Procalcitonin and C-reactive protein as markers of systemic inflammatory response syndrome severity in critically ill children. Intensive Care Med. 2007, 33, 477–484. [Google Scholar] [CrossRef] [PubMed]
- Zurek, J.; Vavrina, M. Procalcitonin biomarker kinetics to predict multiorgan dysfunction syndrome in children with sepsis and systemic inflammatory response syndrome. Iran. J. Pediatrics 2015, 25, e324. [Google Scholar]
- Arkader, R.; Troster, E.J.; Lopes, M.R.; Júnior, R.R.; Carcillo, J.A.; Leone, C.; Okay, T.S. Procalcitonin does discriminate between sepsis and systemic inflammatory response syndrome. Arch. Dis. Child. 2006, 91, 117–120. [Google Scholar] [CrossRef]
- Hawkins, R.C. Laboratory turnaround time. Clin. Biochem. Rev. 2007, 28, 179. [Google Scholar]
- Lee, E.J.; Do Shin, S.; Song, K.J.; Kim, S.C.; Cho, J.S.; Lee, S.C.; Park, J.O.; Cha, W.C. A point-of-care chemistry test for reduction of turnaround and clinical decision time. Am. J. Emerg. Med. 2011, 29, 489–495. [Google Scholar] [CrossRef]
- Kankaanpää, M.; Raitakari, M.; Muukkonen, L.; Gustafsson, S.; Heitto, M.; Palomäki, A.; Suojanen, K.; Harjola, V.-P. Use of point-of-care testing and early assessment model reduces length of stay for ambulatory patients in an emergency department. Scand. J. Trauma Resusc. Emerg. Med. 2016, 24, 125. [Google Scholar] [CrossRef] [PubMed] [Green Version]
- Woo, A.l.; Oh, D.K.; Park, C.-J.; Hong, S.-B. Monocyte distribution width compared with C-reactive protein and procalcitonin for early sepsis detection in the emergency department. PLoS ONE 2021, 16, e0250101. [Google Scholar] [CrossRef]
- Lämmermann, T.; Afonso, P.V.; Angermann, B.R.; Wang, J.M.; Kastenmüller, W.; Parent, C.A.; Germain, R.N. Neutrophil swarms require LTB4 and integrins at sites of cell death in vivo. Nature 2013, 498, 371–375. [Google Scholar] [CrossRef]
- Tan, S.-Y.; Weninger, W. Neutrophil migration in inflammation: Intercellular signal relay and crosstalk. Curr. Opin. Immunol. 2017, 44, 34–42. [Google Scholar] [CrossRef] [PubMed]
- Lin, H.-A.; Lin, S.-F.; Chang, H.-W.; Lee, Y.-J.; Chen, R.-J.; Hou, S.-K. Clinical impact of monocyte distribution width and neutrophil-to-lymphocyte ratio for distinguishing COVID-19 and influenza from other upper respiratory tract infections: A pilot study. PLoS ONE 2020, 15, e0241262. [Google Scholar] [CrossRef] [PubMed]
- Huang, Z.; Fu, Z.; Huang, W.; Huang, K. Prognostic value of neutrophil-to-lymphocyte ratio in sepsis: A meta-analysis. Am. J. Emerg. Med. 2020, 38, 641–647. [Google Scholar] [CrossRef]
- Djordjevic, D.; Rondovic, G.; Surbatovic, M.; Stanojevic, I.; Udovicic, I.; Andjelic, T.; Zeba, S.; Milosavljevic, S.; Stankovic, N.; Abazovic, D. Neutrophil-to-lymphocyte ratio, monocyte-to-lymphocyte ratio, platelet-to-lymphocyte ratio, and mean platelet volume-to-platelet count ratio as biomarkers in critically ill and injured patients: Which ratio to choose to predict outcome and nature of bacteremia? Mediat. Inflamm. 2018, 2018, 3758068. [Google Scholar]
- Shen, Y.; Huang, X.; Zhang, W. Platelet-to-lymphocyte ratio as a prognostic predictor of mortality for sepsis: Interaction effect with disease severity—a retrospective study. BMJ Open 2019, 9, e022896. [Google Scholar] [CrossRef]
- Arcagok, B.C.; Karabulut, B. Platelet to lymphocyte ratio in neonates: A predictor of early onset neonatal sepsis. Mediterr. J. Hematol. Infect. Dis. 2019, 11, e2019055. [Google Scholar]
- Pencina, M.J.; D’Agostino, R.B., Sr.; Demler, O.V. Novel metrics for evaluating improvement in discrimination: Net reclassification and integrated discrimination improvement for normal variables and nested models. Stat. Med. 2012, 31, 101–113. [Google Scholar] [CrossRef] [Green Version]
- Dellinger, R.P.; Levy, M.M.; Rhodes, A.; Annane, D.; Gerlach, H.; Opal, S.M.; Sevransky, J.E.; Sprung, C.L.; Douglas, I.S.; Jaeschke, R. Surviving Sepsis Campaign: International guidelines for management of severe sepsis and septic shock, 2012. Intensive Care Med. 2013, 39, 165–228. [Google Scholar] [CrossRef]
- Ferrer, R.; Artigas, A.; Suarez, D.; Palencia, E.; Levy, M.M.; Arenzana, A.; Pérez, X.L.; Sirvent, J.-M. Effectiveness of treatments for severe sepsis: A prospective, multicenter, observational study. Am. J. Respir. Crit. Care Med. 2009, 180, 861–866. [Google Scholar] [CrossRef] [Green Version]
- Barie, P.S.; Hydo, L.J.; Shou, J.; Larone, D.H.; Eachempati, S.R. Influence of antibiotic therapy on mortality of critical surgical illness caused or complicated by infection. Surg. Infect. 2005, 6, 41–54. [Google Scholar] [CrossRef] [PubMed]
- Castellanos-Ortega, Á.; Suberviola, B.; García-Astudillo, L.A.; Holanda, M.S.; Ortiz, F.; Llorca, J.; Delgado-Rodríguez, M. Impact of the Surviving Sepsis Campaign protocols on hospital length of stay and mortality in septic shock patients: Results of a three-year follow-up quasi-experimental study. Crit. Care Med. 2010, 38, 1036–1043. [Google Scholar] [CrossRef] [PubMed]
- KIM, M.J.; Cheng, G.; Agrawal, D.K. Cl–channels are expressed in human normal monocytes: A functional role in migration, adhesion and volume change. Clin. Exp. Immunol. 2004, 138, 453–459. [Google Scholar] [CrossRef] [PubMed]
- Goasguen, J.E.; Bennett, J.M.; Bain, B.J.; Vallespi, T.; Brunning, R.; Mufti, G.J. Morphological evaluation of monocytes and their precursors. Haematologica 2009, 94, 994. [Google Scholar] [CrossRef] [PubMed] [Green Version]
- Tak, T.; Van Groenendael, R.; Pickkers, P.; Koenderman, L. Monocyte subsets are differentially lost from the circulation during acute inflammation induced by human experimental endotoxemia. J. Innate Immun. 2017, 9, 464–474. [Google Scholar] [CrossRef]
- Agnello, L.; Bivona, G.; Vidali, M.; Scazzone, C.; Giglio, R.V.; Iacolino, G.; Iacona, A.; Mancuso, S.; Ciaccio, A.M.; Sasso, B.L. Monocyte distribution width (MDW) as a screening tool for sepsis in the Emergency Department. Clin. Chem. Lab. Med. (CCLM) 2020, 58, 1951–1957. [Google Scholar] [CrossRef]
- Crouser, E.D.; Parrillo, J.E.; Martin, G.S.; Huang, D.T.; Hausfater, P.; Grigorov, I.; Careaga, D.; Osborn, T.; Hasan, M.; Tejidor, L. Monocyte distribution width enhances early sepsis detection in the emergency department beyond SIRS and qSOFA. J. Intensive Care 2020, 8, 33. [Google Scholar] [CrossRef] [PubMed]
- Crouser, E.D.; Parrillo, J.E.; Seymour, C.W.; Angus, D.C.; Bicking, K.; Esguerra, V.G.; Peck-Palmer, O.M.; Magari, R.T.; Julian, M.W.; Kleven, J.M.; et al. Monocyte Distribution Width: A Novel Indicator of Sepsis-2 and Sepsis-3 in High-Risk Emergency Department Patients. Crit. Care Med. 2019, 47, 1018–1025. [Google Scholar] [CrossRef] [PubMed] [Green Version]
- Ognibene, A.; Lorubbio, M.; Magliocca, P.; Tripodo, E.; Vaggelli, G.; Iannelli, G.; Feri, M.; Scala, R.; Tartaglia, A.P.; Galano, A.; et al. Elevated monocyte distribution width in COVID-19 patients: The contribution of the novel sepsis indicator. Clin. Chim. Acta 2020, 509, 22–24. [Google Scholar] [CrossRef] [PubMed]
- Velavan, T.P.; Meyer, C.G. Mild versus severe COVID-19: Laboratory markers. Int. J. Infect. Dis. 2020, 95, 304–307. [Google Scholar] [CrossRef] [PubMed]
- Polilli, E.; Sozio, F.; Frattari, A.; Persichitti, L.; Sensi, M.; Posata, R.; Di Gregorio, M.; Sciacca, A.; Flacco, M.E.; Manzoli, L. Comparison of Monocyte Distribution Width (MDW) and Procalcitonin for early recognition of sepsis. PLoS ONE 2020, 15, e0227300. [Google Scholar] [CrossRef] [PubMed]
- Piva, E.; Zuin, J.; Pelloso, M.; Tosato, F.; Fogar, P.; Plebani, M. Monocyte distribution width (MDW) parameter as a sepsis indicator in intensive care units. Clin. Chem. Lab. Med. (CCLM) 2021, 59, 1307–1314. [Google Scholar] [CrossRef] [PubMed]
- Ni, J.; Wang, H.; Li, Y.; Shu, Y.; Liu, Y. Neutrophil to lymphocyte ratio (NLR) as a prognostic marker for in-hospital mortality of patients with sepsis: A secondary analysis based on a single-center, retrospective, cohort study. Medicine 2019, 98, e18029. [Google Scholar] [CrossRef]
- Tamelytė, E.; Vaičekauskienė, G.; Dagys, A.; Lapinskas, T.; Jankauskaitė, L. Early blood biomarkers to improve sepsis/bacteremia diagnostics in pediatric emergency settings. Medicina 2019, 55, 99. [Google Scholar] [CrossRef] [PubMed] [Green Version]
- Orak, M.; Karakoç, Y.; Üstündag, M.; Yildirim, Y.; Celen, M.; Güloglu, C. An investigation of the effects of the mean platelet volume, platelet distribution width, platelet/lymphocyte ratio, and platelet counts on mortality in patents with sepsis who applied to the emergency department. Niger. J. Clin. Pract. 2018, 21, 667–671. [Google Scholar] [PubMed]
- Liu, X.; Shen, Y.; Wang, H.; Ge, Q.; Fei, A.; Pan, S. Prognostic significance of neutrophil-to-lymphocyte ratio in patients with sepsis: A prospective observational study. Mediat. Inflamm. 2016, 2016, 8191254. [Google Scholar] [CrossRef] [Green Version]
- Park, K.S.; Lee, S.H.; Yun, S.J.; Ryu, S.; Kim, K. Neutrophil-to-lymphocyte ratio as a feasible prognostic marker for pyogenic liver abscess in the emergency department. Eur. J. Trauma Emerg. Surg. 2019, 45, 343–351. [Google Scholar] [CrossRef] [PubMed]
- Jianyun, X.; Fuxiang, X.; Zhu, Y.; Shen, J. Evaluation value of dynamic monitoring of neutrophil/lymphocyte ratio in peripheral blood in severity of illness and prognosis of bacterial sepsis. Clin. Med. China 2017, 33, 130–133. [Google Scholar]
- Chen, J.; Zhou, X.; Wang, X. Value of neutrophil to lymphocyte ratio in predicting the prognosis of patients with sepsis. Chin. Gen. Pract. 2017, 20, 533–537. [Google Scholar]
- Zhao, C.; Wei, Y.; Chen, D.; Jin, J.; Chen, H. Prognostic value of an inflammatory biomarker-based clinical algorithm in septic patients in the emergency department: An observational study. Int. Immunopharmacol. 2020, 80, 106145. [Google Scholar] [CrossRef]
- Zhong, X.; Ma, A.; Zhang, Z.; Liu, Y.; Liang, G. Neutrophil-to-lymphocyte ratio as a predictive marker for severe pediatric sepsis. Transl. Pediatrics 2021, 10, 657–665. [Google Scholar] [CrossRef]
- Jiang, J.; Yang, J.; Mei, J.; Jin, Y.; Lu, Y. Head-to-head comparison of qSOFA and SIRS criteria in predicting the mortality of infected patients in the emergency department: A meta-analysis. Scand. J. Trauma Resusc. Emerg. Med. 2018, 26, 56. [Google Scholar] [CrossRef] [Green Version]
- Franchini, S.; Scarallo, L.; Carlucci, M.; Cabrini, L.; Tresoldi, M. SIRS or qSOFA? Is that the question? Clinical and methodological observations from a meta-analysis and critical review on the prognostication of patients with suspected sepsis outside the ICU. Intern. Emerg. Med. 2019, 14, 593–602. [Google Scholar] [CrossRef] [PubMed]
- Liu, Y.-C.; Luo, Y.-Y.; Zhang, X.; Shou, S.-T.; Gao, Y.-L.; Lu, B.; Li, C.; Chai, Y.-F. Quick sequential organ failure assessment as a prognostic factor for infected patients outside the intensive care unit: A systematic review and meta-analysis. Intern. Emerg. Med. 2019, 14, 603–615. [Google Scholar] [CrossRef]
- Raith, E.P.; Udy, A.A.; Bailey, M.; McGloughlin, S.; MacIsaac, C.; Bellomo, R.; Pilcher, D.V. Prognostic accuracy of the SOFA score, SIRS criteria, and qSOFA score for in-hospital mortality among adults with suspected infection admitted to the intensive care unit. JAMA 2017, 317, 290–300. [Google Scholar] [CrossRef]
- Haydar, S.; Spanier, M.; Weems, P.; Wood, S.; Strout, T. Comparison of QSOFA score and SIRS criteria as screening mechanisms for emergency department sepsis. Am. J. Emerg. Med. 2017, 35, 1730–1733. [Google Scholar] [CrossRef] [PubMed]
- Gando, S.; Shiraishi, A.; Abe, T.; Kushimoto, S.; Mayumi, T.; Fujishima, S.; Hagiwara, A.; Shiino, Y.; Shiraishi, S.-i.; Hifumi, T. The SIRS criteria have better performance for predicting infection than qSOFA scores in the emergency department. Sci. Rep. 2020, 10, 8095. [Google Scholar] [CrossRef] [PubMed]
- Askim, Å.; Moser, F.; Gustad, L.T.; Stene, H.; Gundersen, M.; Åsvold, B.O.; Dale, J.; Bjørnsen, L.P.; Damås, J.K.; Solligård, E. Poor performance of quick-SOFA (qSOFA) score in predicting severe sepsis and mortality–a prospective study of patients admitted with infection to the emergency department. Scand. J. Trauma Resusc. Emerg. Med. 2017, 25, 56. [Google Scholar] [CrossRef] [PubMed]


| Before PS Matching (n = 8698) | After PS Matching (n =1480) | |||||
|---|---|---|---|---|---|---|
| Variables | Sepsis | Nonsepsis | SMD | Sepsis | Nonsepsis | SMD |
| Number (n) | 308 | 8390 | 296 | 1184 | ||
| Age (years) | 68.7 ± 17.4 | 58.5 ± 21.1 | 0.531 | 68.6 ± 17.7 | 69.4 ± 18.0 | −0.040 |
| Age subgroups n, (%) | ||||||
| 20–29 years | 11 (3.6%) | 938 (11.2%) | 11 (3.7%) | 39 (3.3%) | ||
| 30–39 years | 12 (3.9%) | 1074 (12.8%) | 12 (4.1%) | 51 (4.3%) | ||
| 40–49 years | 22 (7.1%) | 1055 (12.6%) | 22 (7.4%) | 91 (7.7%) | ||
| 50–59 years | 40 (13.0%) | 1103 (13.2%) | 39 (13.2%) | 141 (11.9%) | ||
| 60–69 years | 52 (16.9%) | 1334 (15.9%) | 47 (15.9%) | 183 (15.5%) | ||
| 70–79 years | 87 (28.3%) | 1191 (14.2%) | 82 (27.7%) | 276 (23.3%) | ||
| ≥80 years | 84 (27.3%) | 1695 (20.2%) | 83 (28.0%) | 403 (34.0%) | ||
| Gender, n (%) | 0.017 | 0.000 | ||||
| Female | 165 (53.6%) | 4470 (53.3%) | 161 (54.4%) | 644 (54.4%) | ||
| Male | 143 (47.4%) | 3920 (46.7%) | 135 (45.6%) | 540 (45.6%) | ||
| Glasgow coma scale (score) | 13.5 ± 2.9 | 14.5 ± 1.8 | −0.404 | 13.5 ± 2.9 | 13.7 ± 2.7 | −0.082 |
| Eye | 3.7 ± 0.8 | 3.9 ± 0.4 | −0.289 | 3.8 ± 0.7 | 3.8 ± 0.7 | −0.072 |
| Verbal | 4.1 ± 1.5 | 4.7 ± 1.0 | −0.410 | 4.2 ± 1.4 | 4.3 ± 1.3 | −0.079 |
| Motor | 5.5 ± 1.1 | 5.8 ± 0.7 | −0.366 | 5.5 ± 1.0 | 5.6 ± 1.0 | −0.071 |
| Triage levels (score) | 2.2 ± 0.7 | 2.7 ± 0.6 | −0.735 | 2.2 ± 0.7 | 2.2 ± 0.7 | −0.015 |
| Triage subgroups, n (%) | ||||||
| Level 1 | 42 (13.6%) | 366 (4.4%) | 40 (13.5%) | 157 (13.3%) | ||
| Level 2 | 162 (52.6%) | 2170 (25.9%) | 152 (51.4%) | 605 (51.1%) | ||
| Level 3 | 104 (33.8%) | 5843 (69.6%) | 104 (35.1%) | 420 (35.5%) | ||
| Level 4 | 0 (0%) | 11 (0.1%) | 0 (0%) | 2 (0.2%) | ||
| Medical comorbidities, n (%) | ||||||
| Hypertension | 149 (48.4%) | 2885 (34.4%) | 0.293 | 143 (48.3%) | 608 (51.4%) | −0.062 |
| Diabetes mellitus | 109 (35.9%) | 1741 (20.8%) | 0.345 | 106 (35.8%) | 424 (35.3%) | 0.000 |
| Coronary artery disease | 86 (27.9%) | 1764 (21.0%) | 0.152 | 81 (27.4%) | 326 (27.5%) | −0.003 |
| Cerebrovascular disease | 26 (8.4%) | 321 (3.8%) | 0.198 | 25 (8.5%) | 76 (6.4%) | 0.085 |
| End-stage renal disease | 16 (5.2%) | 209 (2.5%) | 0.108 | 13 (4.4%) | 59 (5.0%) | −0.033 |
| Pulmonary disease | 3 (1.0%) | 59 (0.7%) | 0.037 | 3 (1.0%) | 16 (1.4%) | −0.037 |
| Malignant disease | 14 (4.6%) | 292 (3.5%) | 0.068 | 14 (4.7%) | 53 (4.5%) | 0.012 |
| Models | OR (95% CI) | p-Value | Area under Curve (95% CI) | Cutoff | Sensitivity (95% CI) | Specificity (95% CI) |
|---|---|---|---|---|---|---|
| Score systems (per score increase) | ||||||
| SIRS score system | 3.82 (3.24–4.56) | <0.0001 * | 0.831 (0.812–0.849) | |||
| SIRS score ≥ 3 | 5.46 (4.11–7.26) | <0.0001 * | 0.660 (0.630–0.690) | 3 | 44.9% (39.3–50.1%) | 87.0% (85.1–88.9%) |
| SOFA score system | 1.16 (1.11–1.22) | <0.0001 * | 0.636 (0.604–0.668) | |||
| SOFA score ≥ 3 | 1.90 (1.46–2.46) | <0.0001 * | 0.576 (0.544–0.607) | 3 | 47.0% (41.3–52.6%) | 68.2% (65.6–70.8%) |
| qSOFA score system | 1.49 (1.27–1.76) | <0.0001 * | 0.580 (0.546–0.613) | |||
| qSOFA score ≥ 2 | 1.86 (1.30–2.64) | 0.0006 * | 0.536 (0.513–0.560) | 2 | 17.6% (13.2–21.9%) | 89.7% (88.0–91.4%) |
| Laboratory tests | ||||||
| WBC (per 103/µL) | 1.08 (1.06–1.10) | <0.0001 * | 0.624 (0.585–0.664) | |||
| WBC > 12 | 3.38 (2.59–4.52) | <0.0001 * | 0.648 (0.585–0.664) | 12 | 64.2% (58.7–69.7%) | 65.4% (62.7–68.1%) |
| NLR (per U) | 1.07 (1.05–1.08) | <0.0001 * | 0.765 (0.735–0.795) | |||
| NLR > 9 | 5.85 (4.43–7.73) | <0.0001 * | 0.707 (0.678–0.737) | 9 | 69.6% (69.4–74.8%) | 71.9% (69.3–74.4%) |
| PLR (per 10 U) | 1.02 (1.01–1.03) | <0.0001 * | 0.666 (0.631–0.702) | |||
| PLR > 160 | 2.61 (1.97–3.46) | <0.0001 * | 0.610 (0.581–0.639) | 160 | 73.3% (68.3–78.4%) | 48.7% (45.9–51.6%) |
| PLR > 210 | 3.12 (2.39–4.05) | <0.0001 * | 0.638 (0.607–0.669) | 210 | 61.8% (56.3–67.4%) | 65.8% (63.1–68.5%) |
| CRP (per mg/dL) | 1.11 (1.09–1.13) | <0.0001 * | 0.745 (0.721–0.779) | |||
| CRP > 3 | 4.82 (3.66–6.36) | <0.0001 * | 0.687 (0.658–0.717) | 3 | 69.6% (64.4–74.8%) | 67.8% (65.2–70.5%) |
| MDW (per U) | 1.03 (1.01–1.05) | 0.0056 * | 0.639 (0.596–0.682) | |||
| MDW > 20 | 2.77 (2.13–3.62) | <0.0001 * | 0.625 (0.594–0.655) | 22.1 | 64.5% (59.1–70.0%) | 60.4% (57.6–63.2%) |
| Characteristics | Multivariate Analysis(Model 1 on SIRS Score) | Multivariate Analysis(Model 2 on SOFA Score) | Multivariate Analysis(Model 3 on qSOFA Score) | |||
|---|---|---|---|---|---|---|
| OR (95% CI) | p-Value | OR (95% CI) | p-Value | OR (95% CI) | p-Value | |
| Multivariate Models without CRP | ||||||
| SIRS score ≥ 3 | 3.72 (2.73–5.06) | <0.0001 * | ||||
| SOFA score ≥ 3 | 1.57 (1.19–2.08) | 0.0016 * | ||||
| qSOFA score ≥ 2 | 1.57 (1.07–2.30) | 0.0210 * | ||||
| NLR > 9 U | 3.25 (2.31–4.58) | <0.0001 * | 4.11 (2.94–5.74) | <0.0001 * | 4.27 (3.08–5.97) | <0.0001 * |
| PLR > 210 | 1.48 (1.06–2.07) | 0.0209 * | 1.41 (1.01–1.95) | 0.0413 * | 1.36 (0.98–1.88) | 0.0633 |
| MDW > 20 U | 1.90 (1.42–2.55) | <0.0001 * | 1.95 (1.47–2.59) | <0.0001 * | 1.98 (1.50–2.64) | <0.0001 * |
| Area under curve (95% CI) | 0.796 (0.769–0.822) | 0.761 (0.732–0.790) | 0.757 (0.728–0.786) | |||
| Hosmer-Lemeshow test | 17.64 (9 groups) | 0.0137 * | 6.73 (8 groups) | 0.3466 | 5.85 (7 groups) | 0.3215 |
| Multivariate Models with CRP | ||||||
| SIRS score ≥ 3 | 3.45 (2.53–4.72) | <0.0001 * | ||||
| SOFA score ≥ 3 | 1.49 (1.12–1.99) | 0.0065 * | ||||
| qSOFA score ≥ 2 | 1.46 (0.99–2.15) | 0.0597 | ||||
| NLR > 9 U | 2.88 (2.04–4.08) | <0.0001 * | 3.53 (2.52–4.95) | <0.0001 * | 3.66 (2.63–5.14) | <0.0001 * |
| PLR > 210 | 1.46 (1.04–2.04) | 0.0274 * | 1.39 (0.99–1.93) | 0.0521 | 1.35 (0.97–1.87) | 0.0744 |
| MDW > 20 U | 1.26 (0.91–1.74) | 0.1622 | 1.27 (0.92–1.74) | 0.1437 | 1.28 (0.93–1.75) | 0.1281 |
| CRP > 3 mg/dL | 2.85 (2.06–3.94) | <0.0001 * | 3.01 (2.20–4.15) | <0.0001 * | 3.04 (2.22–4.19) | <0.0001 * |
| Area under curve (95% CI) | 0.809 (0.784–0.835) | 0.785 (0.757–0.813) | 0.784 (0.757–0.812) | |||
| Hosmer-Lemeshow test | 16.18 (8 groups) | 0.0128 * | 5.43 (10 groups) | 0.7109 | 5.60 (10 groups) | 0.4692 |
| Model comparison of IDI (%) | −1.93 (−3.33–−0.54) | 0.0182 * | 0.91 (−0.34–−2.17) | 0.1924 | 0.70 (−0.57–−1.97) | 0.3202 |
| Characteristics | Multivariate Analysis(Model 1 on SIRS Score) | Multivariate Analysis(Model 2 on SOFA Score) | Multivariate Analysis(Model 3 on qSOFA Score) | |||
|---|---|---|---|---|---|---|
| OR (95% CI) | p-Value | OR (95% CI) | p-Value | OR (95% CI) | p-Value | |
| Multivariate Models without CRP | ||||||
| SIRS score ≥ 3 | 3.72 (2.73–5.06) | 0.1051 † | ||||
| SOFA score ≥ 3 | 3.06 (1.46–∞) | 0.0001 *,† | ||||
| qSOFA score ≥ 2 | 4.19 (1.15–15.35) | 0.0304 * | ||||
| NLR > 9 U | 0.94 (0.17–5.23) | 0.9446 | 0.49 (0.09–2.85) | <0.0001 * | 0.58 (0.11–3.19) | 0.5339 |
| PLR > 210 | 0.15 (0.02–1.42) | 0.0975 | 0.24 (0.02–2.40) | 0.0413 * | 0.18 (0.02–1.64) | 0.1265 |
| MDW > 20 U | 7.16 (1.49–34.51) | 0.0141 * | 4.00 (0.83–19.32) | <0.0001 * | 5.63 (1.16–27.40) | 0.0325 * |
| Area under curve (95% CI) | 0.817 (0.710–0.923) | 0.912 (0.865–0.960) | 0.821 (0.715–0.927) | |||
| Hosmer-Lemeshow test | 0.69 (7 groups) | 0.9837 | 0.05 (4 groups) | 0.9727 | 1.26 (7 groups) | 0.9389 |
| Multivariate Models with CRP | ||||||
| SIRS score ≥ 3 | −1.44 (−∞–0.21) | 0.0802 * | ||||
| SOFA score ≥ 3 | 3.04 (1.44–∞) | 0.0001 * | ||||
| qSOFA score ≥ 2 | 3.82 (1.03–14.11) | 0.0445 * | ||||
| NLR > 9 U | 0.75 (0.13–4.17) | 0.7402 | 0.41 (0.05–2.01) | 0.3276 | 0.50 (0.09–2.71) | 0.4192 |
| LR > 210 | 0.15 (0.02–1.37) | 0.0925 | 0.22 (0.01–1.62) | 0.1996 | 0.17 (0.02–1.57) | 0.1186 |
| MDW > 20 U | 4.23 (0.75–23.69) | 0.1011 | 2.71 (0.58–19.66) | 0.2450 | 3.69 (0.65–21.07) | 0.1417 |
| CRP >3 | 3.22 (0.70–14.78) | 0.1326 | 2.65 (0.65–13.84) | 0.1996 | 2.49 (0.53–11.68) | 0.2469 |
| Area under curve (95% CI) | 0.842 (0.784–0.835) | 0.920 (0.869–0.970) | 0.832 (0.713–0.951) | |||
| Hosmer-Lemeshow test | 1.37 (7 groups) | 0.9272 | 1.48 (4 groups) | 0.4773 | 2.95 (8 groups) | 0.4692 |
| OR (95% CI) | p Value | Score | Sensitivity (95% CI) | Specificity (95% CI) | |
|---|---|---|---|---|---|
| Adopted model for building new scoring system | |||||
| qSOFA score > 1 | 1.57 (1.07–2.30) | 0.0210 * | 1 | ||
| NLR > 9 U | 4.27 (3.08–5.97) | <0.0001 * | 2 | ||
| PLR > 210 | 1.36 (0.98–1.88) | 0.0633 | 1 | ||
| MDW > 20 U | 1.98 (1.50–2.64) | <0.0001 * | 1 | ||
| Area under curve (95% CI) | 0.757 (0.728–0.786) | ||||
| Hosmer–Lemeshow test | 5.85 (7 groups) | 0.3215 | |||
| New scoring system | |||||
| Score of ≥ 1 | 7.17 (4.61–11.15) | <0.0001 * | 92.2% (89.2–95.3%) | 37.7% (34.9–40.4%) | |
| Score of ≥ 2 | 6.16 (4.57–8.30) | <0.0001 * | 77.7% (73.0–82.4%) | 63.9% (61.1–66.6%) | |
| Score of ≥ 3 | 5.82 (4.42–7.67) | <0.0001 * | 67.6% (62.2–72.9%) | 73.7% (71.1–76.2%) | |
| Score of ≥ 4 | 4.73 (3.55–6.31) | <0.0001 * | 40.9% (35.3–46.5%) | 87.3% (85.4–89.2%) | |
| Score of ≥ 5 | 2.51 (1.27–4.93) | 0.0078 * | 4.8% (2.3–7.2%) | 98.1% (97.3–98.8%) | |
| Area under curve (95% CI) | 0.755 (0.726–0.784) | ||||
| Hosmer–Lemeshow test | 3.65 (5 groups) | 0.3020 | |||
Publisher’s Note: MDPI stays neutral with regard to jurisdictional claims in published maps and institutional affiliations. |
© 2021 by the authors. Licensee MDPI, Basel, Switzerland. This article is an open access article distributed under the terms and conditions of the Creative Commons Attribution (CC BY) license (https://creativecommons.org/licenses/by/4.0/).
Share and Cite
Hou, S.-K.; Lin, H.-A.; Chen, S.-C.; Lin, C.-F.; Lin, S.-F. Monocyte Distribution Width, Neutrophil-to-Lymphocyte Ratio, and Platelet-to-Lymphocyte Ratio Improves Early Prediction for Sepsis at the Emergency. J. Pers. Med. 2021, 11, 732. https://doi.org/10.3390/jpm11080732
Hou S-K, Lin H-A, Chen S-C, Lin C-F, Lin S-F. Monocyte Distribution Width, Neutrophil-to-Lymphocyte Ratio, and Platelet-to-Lymphocyte Ratio Improves Early Prediction for Sepsis at the Emergency. Journal of Personalized Medicine. 2021; 11(8):732. https://doi.org/10.3390/jpm11080732
Chicago/Turabian StyleHou, Sen-Kuang, Hui-An Lin, Shao-Chun Chen, Chiou-Feng Lin, and Sheng-Feng Lin. 2021. "Monocyte Distribution Width, Neutrophil-to-Lymphocyte Ratio, and Platelet-to-Lymphocyte Ratio Improves Early Prediction for Sepsis at the Emergency" Journal of Personalized Medicine 11, no. 8: 732. https://doi.org/10.3390/jpm11080732
APA StyleHou, S.-K., Lin, H.-A., Chen, S.-C., Lin, C.-F., & Lin, S.-F. (2021). Monocyte Distribution Width, Neutrophil-to-Lymphocyte Ratio, and Platelet-to-Lymphocyte Ratio Improves Early Prediction for Sepsis at the Emergency. Journal of Personalized Medicine, 11(8), 732. https://doi.org/10.3390/jpm11080732