Article

Improved Quantification of 18F-FDG PET during 131I-Rituximab Therapy on Mouse Lymphoma Models after 131I Prompt Emission Correction

1
Division of RI Application, Korea Institute Radiological and Medical Sciences, Seoul 01812, Korea
2
Division of Radiation Regulation, Department of Medical Radiation Safety, Korea Institute of Nuclear Safety, Daejeon 34142, Korea
3
Department of Radiation Convergence Engineering and Research Institute of Health Science, Yonsei University, Wonju 26493, Korea
4
Radiological and Medico-Oncological Sciences, University of Science and Technology, Seoul 01812, Korea
*
Author to whom correspondence should be addressed.
Diagnostics 2019, 9(4), 144; https://doi.org/10.3390/diagnostics9040144
Submission received: 17 September 2019 / Accepted: 7 October 2019 / Published: 8 October 2019
(This article belongs to the Special Issue Imaging of Early Response in Cancer Management 2019)

Abstract

:
18F-FDG Positron Emission Tomography (PET) is used to monitor tumor response to 131I-therapy, but is confounded by prompt emissions (284, 364, 637, and 723 keV) from 131I, particularly in animal PET imaging. We propose a method for correcting this emission in 18F-FDG PET. The 131I prompt emission effect was assessed within various energy windows and various activities. We applied a single gamma correction method to a phantom and in vivo mouse model. The 131I prompt emission fraction was 12% when 300 µCi of 131I and 100 µCi of FDG were administered, and increased exponentially with escalating 131I activity for all energy windows. The difference in spill-over ratio was reduced to <5% after 131I prompt emission correction. In the mouse model, the standard uptake value (SUV) did not differ significantly between FDG PET only (gold standard) and FDG PET after 131I prompt emission-correction, whereas it was overestimated by 38% before correction. Contrast was improved by 18% after 131I prompt emission correction. We first found that count contamination on 18F-FDG follow-up scans due to 131I spilled-over count after 131I rituximab tumor targeted therapy. Our developed 131I prompt emission-correction method increased accuracy during measurement of standard uptake values on 18F-FDG PET.

1. Introduction

Radioimmunotherapy (RIT), such as 131I labelled tositumomab (Bexxar) and 131I labelled rituximab [1,2], is used for targeted treatment of cancer and involves selective delivery of radionuclide-labelled monoclonal antibodies (mAbs) [1,3]. Imaging mAb using Positron Emission Tomography (PET) or Single-photon emission computed tomography (SPECT) was applied to quantitatively estimate expression of accessible antigens in the target tissue [4,5,6]. A gamma camera or SPECT imaging was used for 131I imaging [7]. A conventional gamma camera is limited in terms of detection of differentiated thyroid carcinoma, owing to the biokinetics in the lesion and background in individual patients [8]. 124I PET has been used to image the residual thyroid lesion after 131I thyroid therapy [9] and can provide the dosimetry data for the activity of 131I administered for therapy of differentiated thyroid cancer [10]. The 124I PET-based response rates of small lymph node metastases and thyroid remnants in a minimum high-absorbed radiation dose group matched the histological data after administration of therapeutic 131I [11]. 124I PET imaging for the assessment of 131I therapy was superior to the use of 18F-FDG PET because 124I and 131I had the same chemical properties due to their isotope relationship. However, conventional 18F-FDG PET was still used for monitoring of the therapeutic effect of 131I [12], this was due to the easy accessibility of 18F-FDG PET in clinics. For example, the use of 18F-FDG PET was reported for the short temporal response of Hodgkin’s disease to RIT [13]. The clinical significance of 18F-FDG uptake by primary sites in patients with diffuse large B cell lymphoma in the head and neck, or in cervical lymph nodes, was reported [14,15]. The use of 18F-FDG PET imaging of early response to predict prognosis in the first-line management of follicular non-Hodgkin lymphoma with 131I Rituximab RIT was reported [16]. The value of 18F-FDG PET/CT for the staging of primary extranodal head and neck lymphomas was also reported [17]. In clinics, the early response to a therapy was performed about 12 weeks after administration of 131I rituximab. However, in a preclinical mouse model, tumor size increases faster than in humans, while their maximum life span is much shorter than humans. The tumor in lymphoma mouse model grew from 200 mm3 to 100 mm3 within 10 days. In preclinical study, therefore, there was a necessity of a 18F-FDG PET follow-up scan immediately after 131I therapy.
131I emits gamma rays (284 keV (6%), 364 keV (82%), 637 keV (7%), and 723 keV (2%)) and beta rays (334 keV (7%), and 606 keV (90%)) for therapy. When 131I rituximab therapy is monitored using 18F-FDG PET, findings may be contaminated by the inclusion of prompt emissions (364 keV (82%) and 637 keV (7.16%)) from 131I. This phenomenon is particularly prominent during animal PET, because wider energy windows, such as 250–750 keV or 350–750 keV, are used to increase the sensitivity of animal PET imaging. The high energy of the most abundant gammas can cause down scatter issues within the energy window of the 511 keV annihilation photons of PET imaging. Whether the low energy due to 131I could also contaminate 18F-FDG PET scans is unknown. The effect of 131I prompt emission required assessment, because 364 keV and 637 keV emissions from gamma photons are within the conventional PET acquisition energy windows. During a 18F-FDG follow-up study, we should check the possibility of inclusion of 131I within PET acquisition.
The motivation of our study was the necessity of a quantification method of 18F-FDG PET during 131I therapy. To the best of our knowledge, there has been no report on the assessment of 131I prompt emission or the development of 131I prompt emission-correction for 18F-FDG PET imaging. Our data showed that our 131I prompt emission-correction method was feasible for use in 18F-FDG follow-up after 131I therapy in a preclinical study.
This study aimed to assess the count contamination on 18F-FDG follow-up scans due to 131I spill-over count after 131I rituximab tumor targeted therapy. We measured the effect of 131I prompt emission with various activity levels and energy windows using a phantom and animal model. We found count contamination on 18F-FDG follow-up scans due to 131I spill-over count after 131I rituximab tumor targeted therapy. To limit this contamination, we developed the 131I prompt emission correction method during 18F-FDG PET.

2. Materials and Methods

In this study, we identified the effect of 131I therapy during FDG PET scanning. For this purpose, we performed GATE Monte Carlo simulation, phantom study, and actual in vivo study using lymphoma mouse model. All mice-related experiments were performed under a protocol approved by IACUC (number KIRAMS 2013-104, date of approval: 6 January 2014) of the Korea Institute of Radiological and Medical Sciences (KIRAMS).

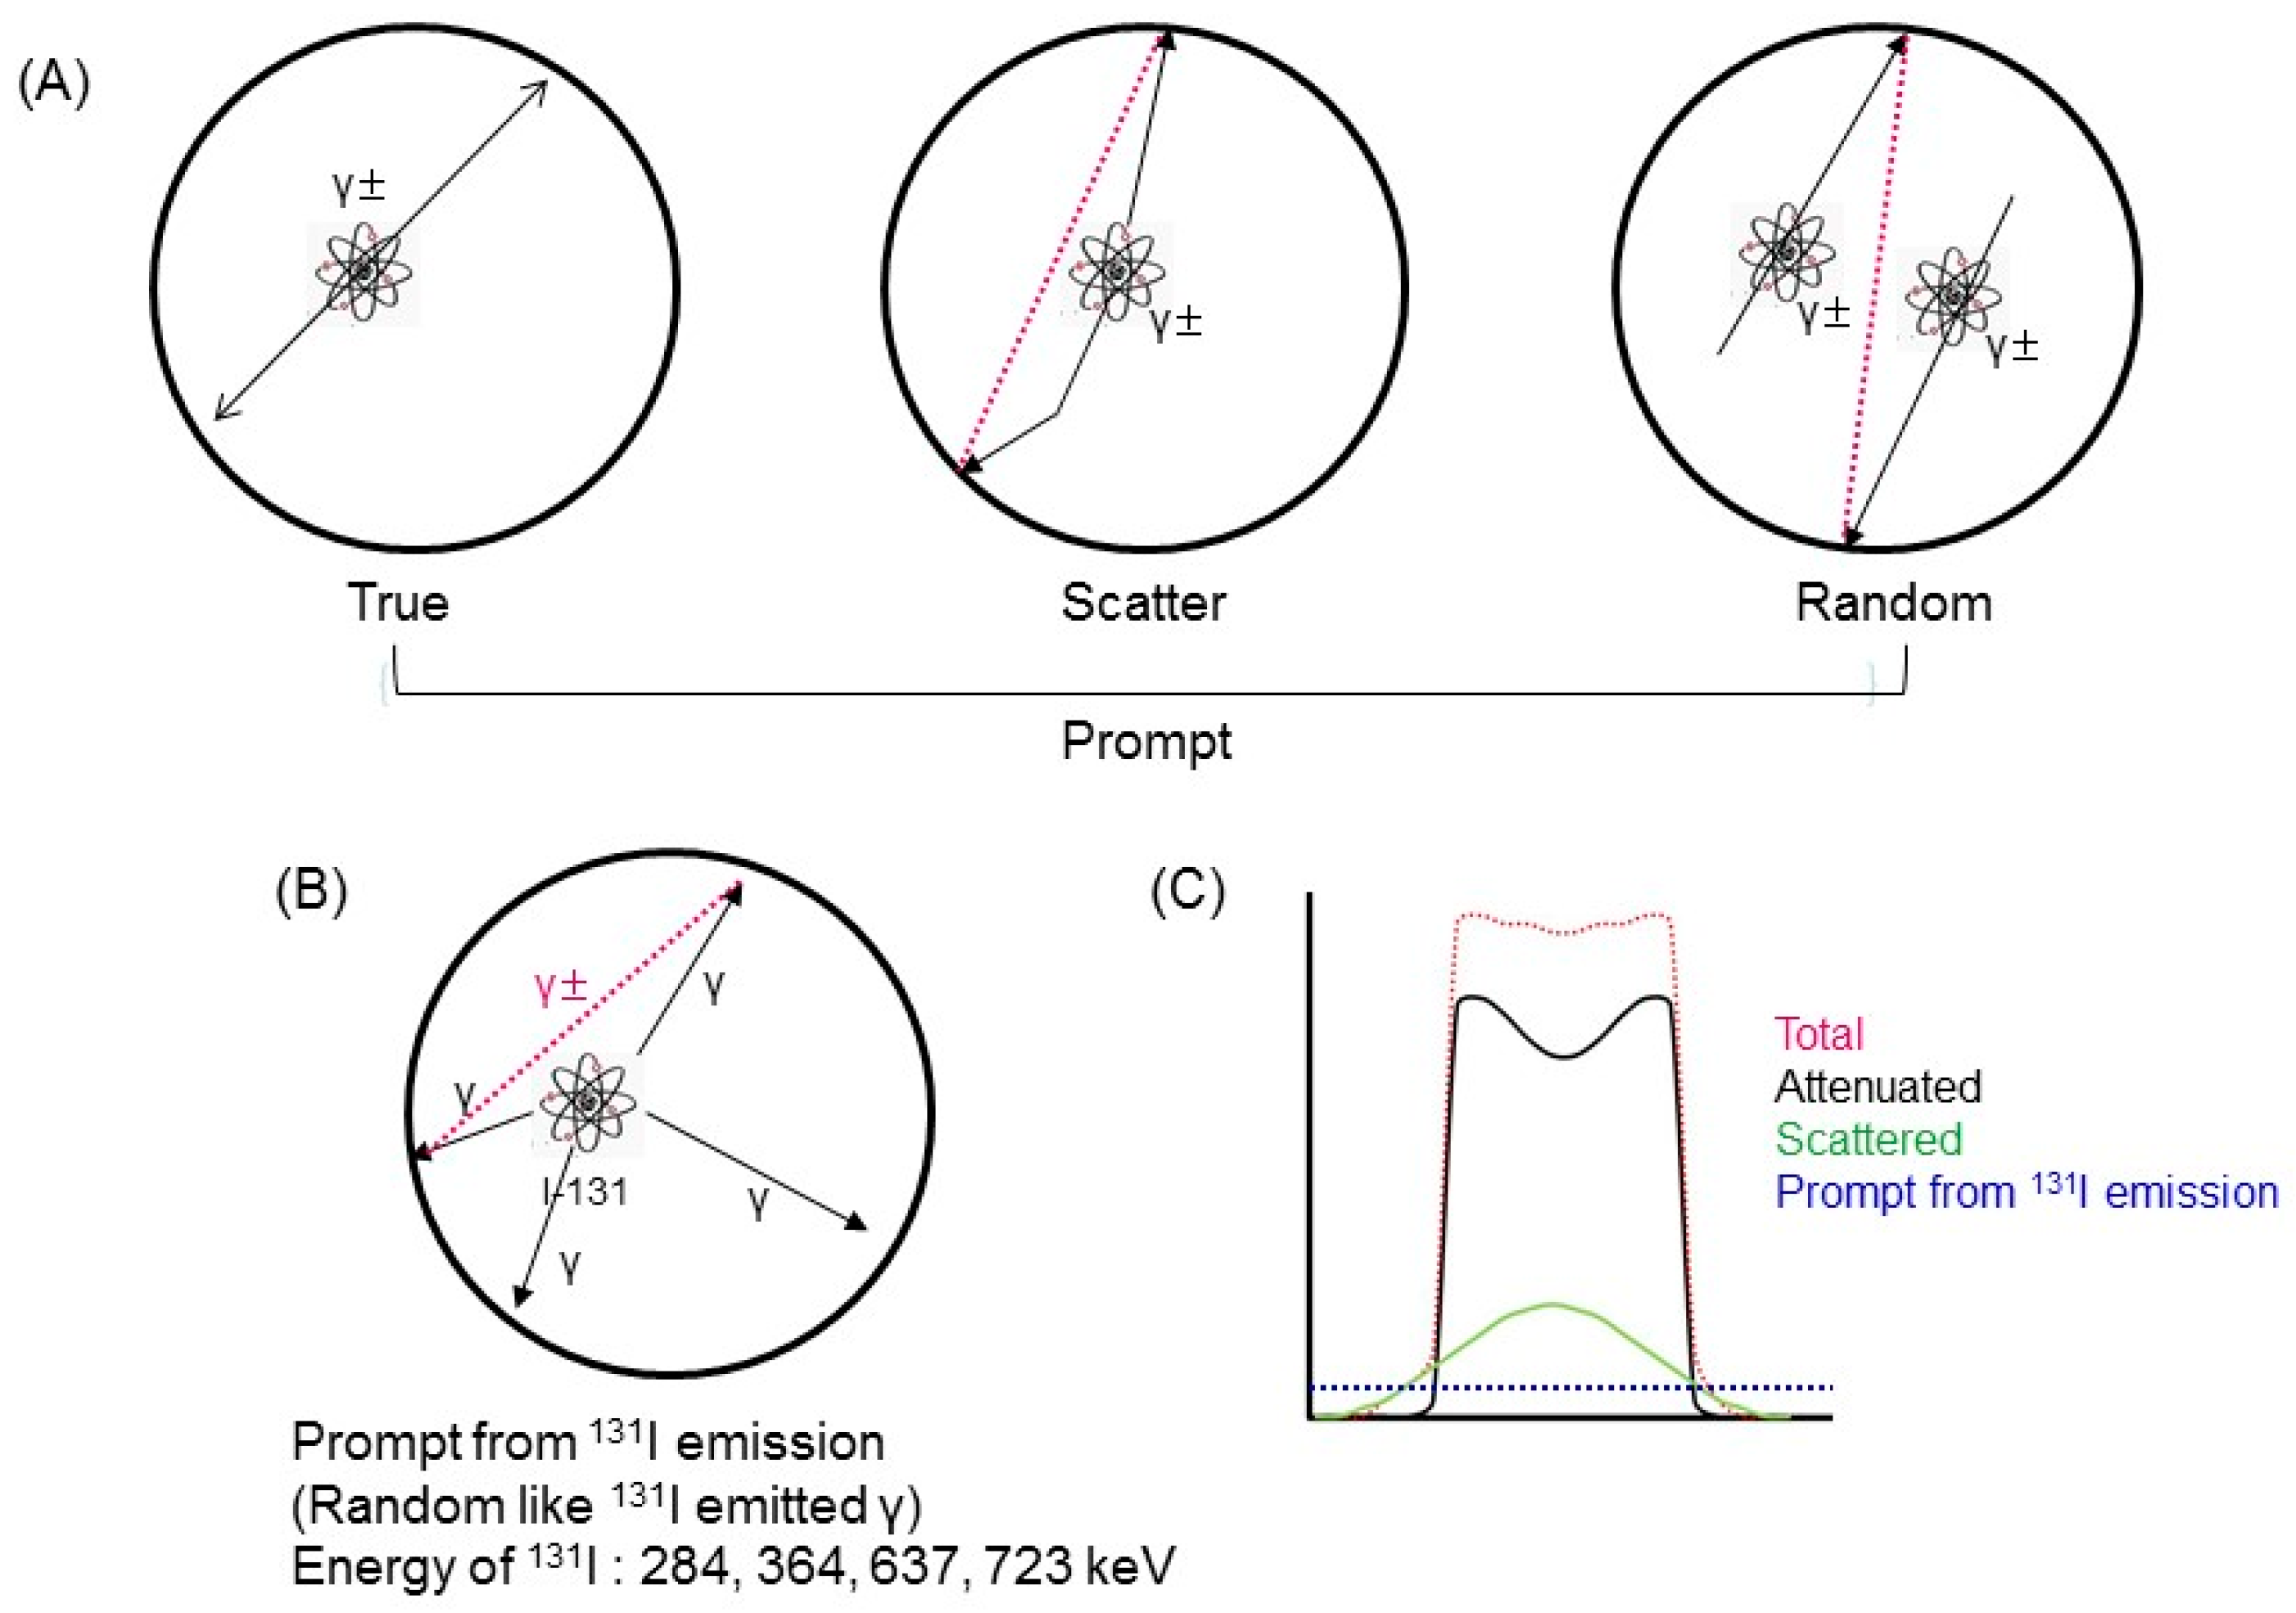
2.1. 131I Prompt Emissions during PET

Figure 1A shows a schematic illustration of PET emissions, such as true, scatter, and random emissions during annihilation. Figure 1B shows the prompt emissions due to 131I. 131I emitted 284, 364, 637, and 723 keV gamma rays. We previously developed a method for correction of 124I single gamma ray emissions, such as those at 622 and 723 keV [18,19]. 124I prompt emissions create background noise [20] (shown in Figure 2 in [20]). The characteristics of 131I prompt emissions were similar to those of 124I. Therefore, 131I prompt emissions were also distributed as background noise (Figure 1C). A Siemens Inveon PET scanner (Siemens, Erlangen, Germany) was used for monitoring.

2.2. GATE Simulation

We calculated the fraction of 131I prompt emissions due to 131I by GATE simulation, with various energy windows and various activity levels. We applied our 131I prompt emission-correction method to 18F-FDG PET in both a phantom and animal study.

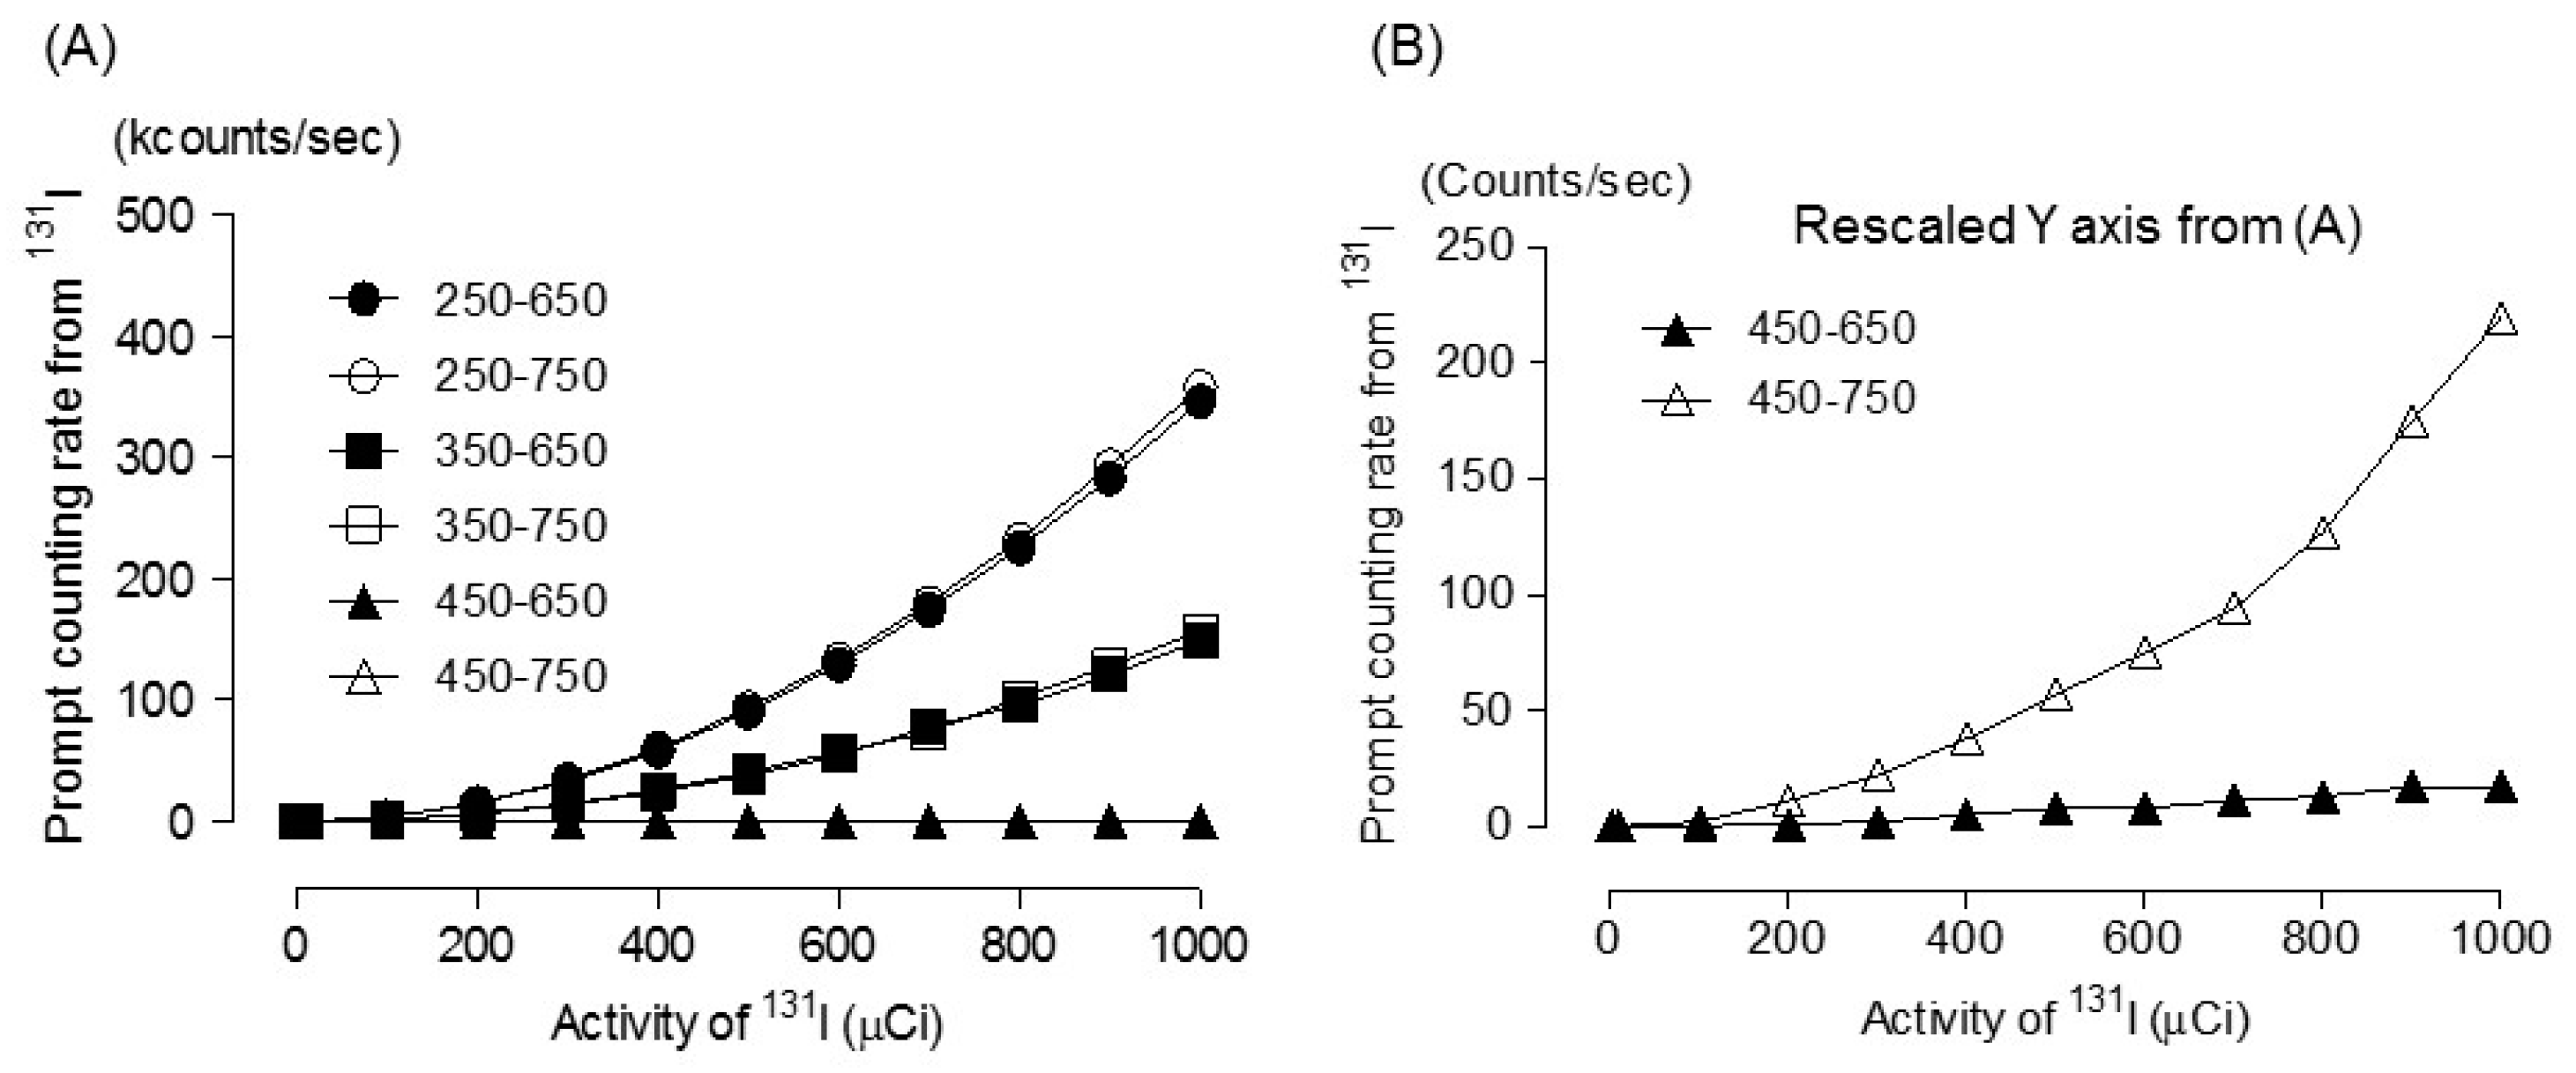
2.3. Estimation of Prompt Emission Counting Rate due to A Single Gamma Photon from 131I

The prompt emission counting rate was estimated using GATE simulation. The prompt emission due to 131I would increase with increasing activities of 131I. Therefore, activities were set from 100 µCi to 1000 µCi in steps of 100 µCi. The energy windows were 250–650 keV, 250–750 keV, 350–650 keV, 350–750 keV, 450–650 keV, and 450–750 keV, respectively. A lower energy level discriminator setting of 350 keV and 450 keV was used to assess the effect of 364 keV 131I prompt emissions. An upper energy level discriminator setting of 750 keV was used to assess the effect of 637 keV 131I prompt emissions. To estimate the prompt emission counting rate due to 131I prompt emissions in GATE simulation, the output file was saved in ASCII format. The ASCII output file was an interfile with coded integers in 4 bytes without a header. The prompt emission counting rate due to 131I prompt emissions was extracted from the ASCII file.

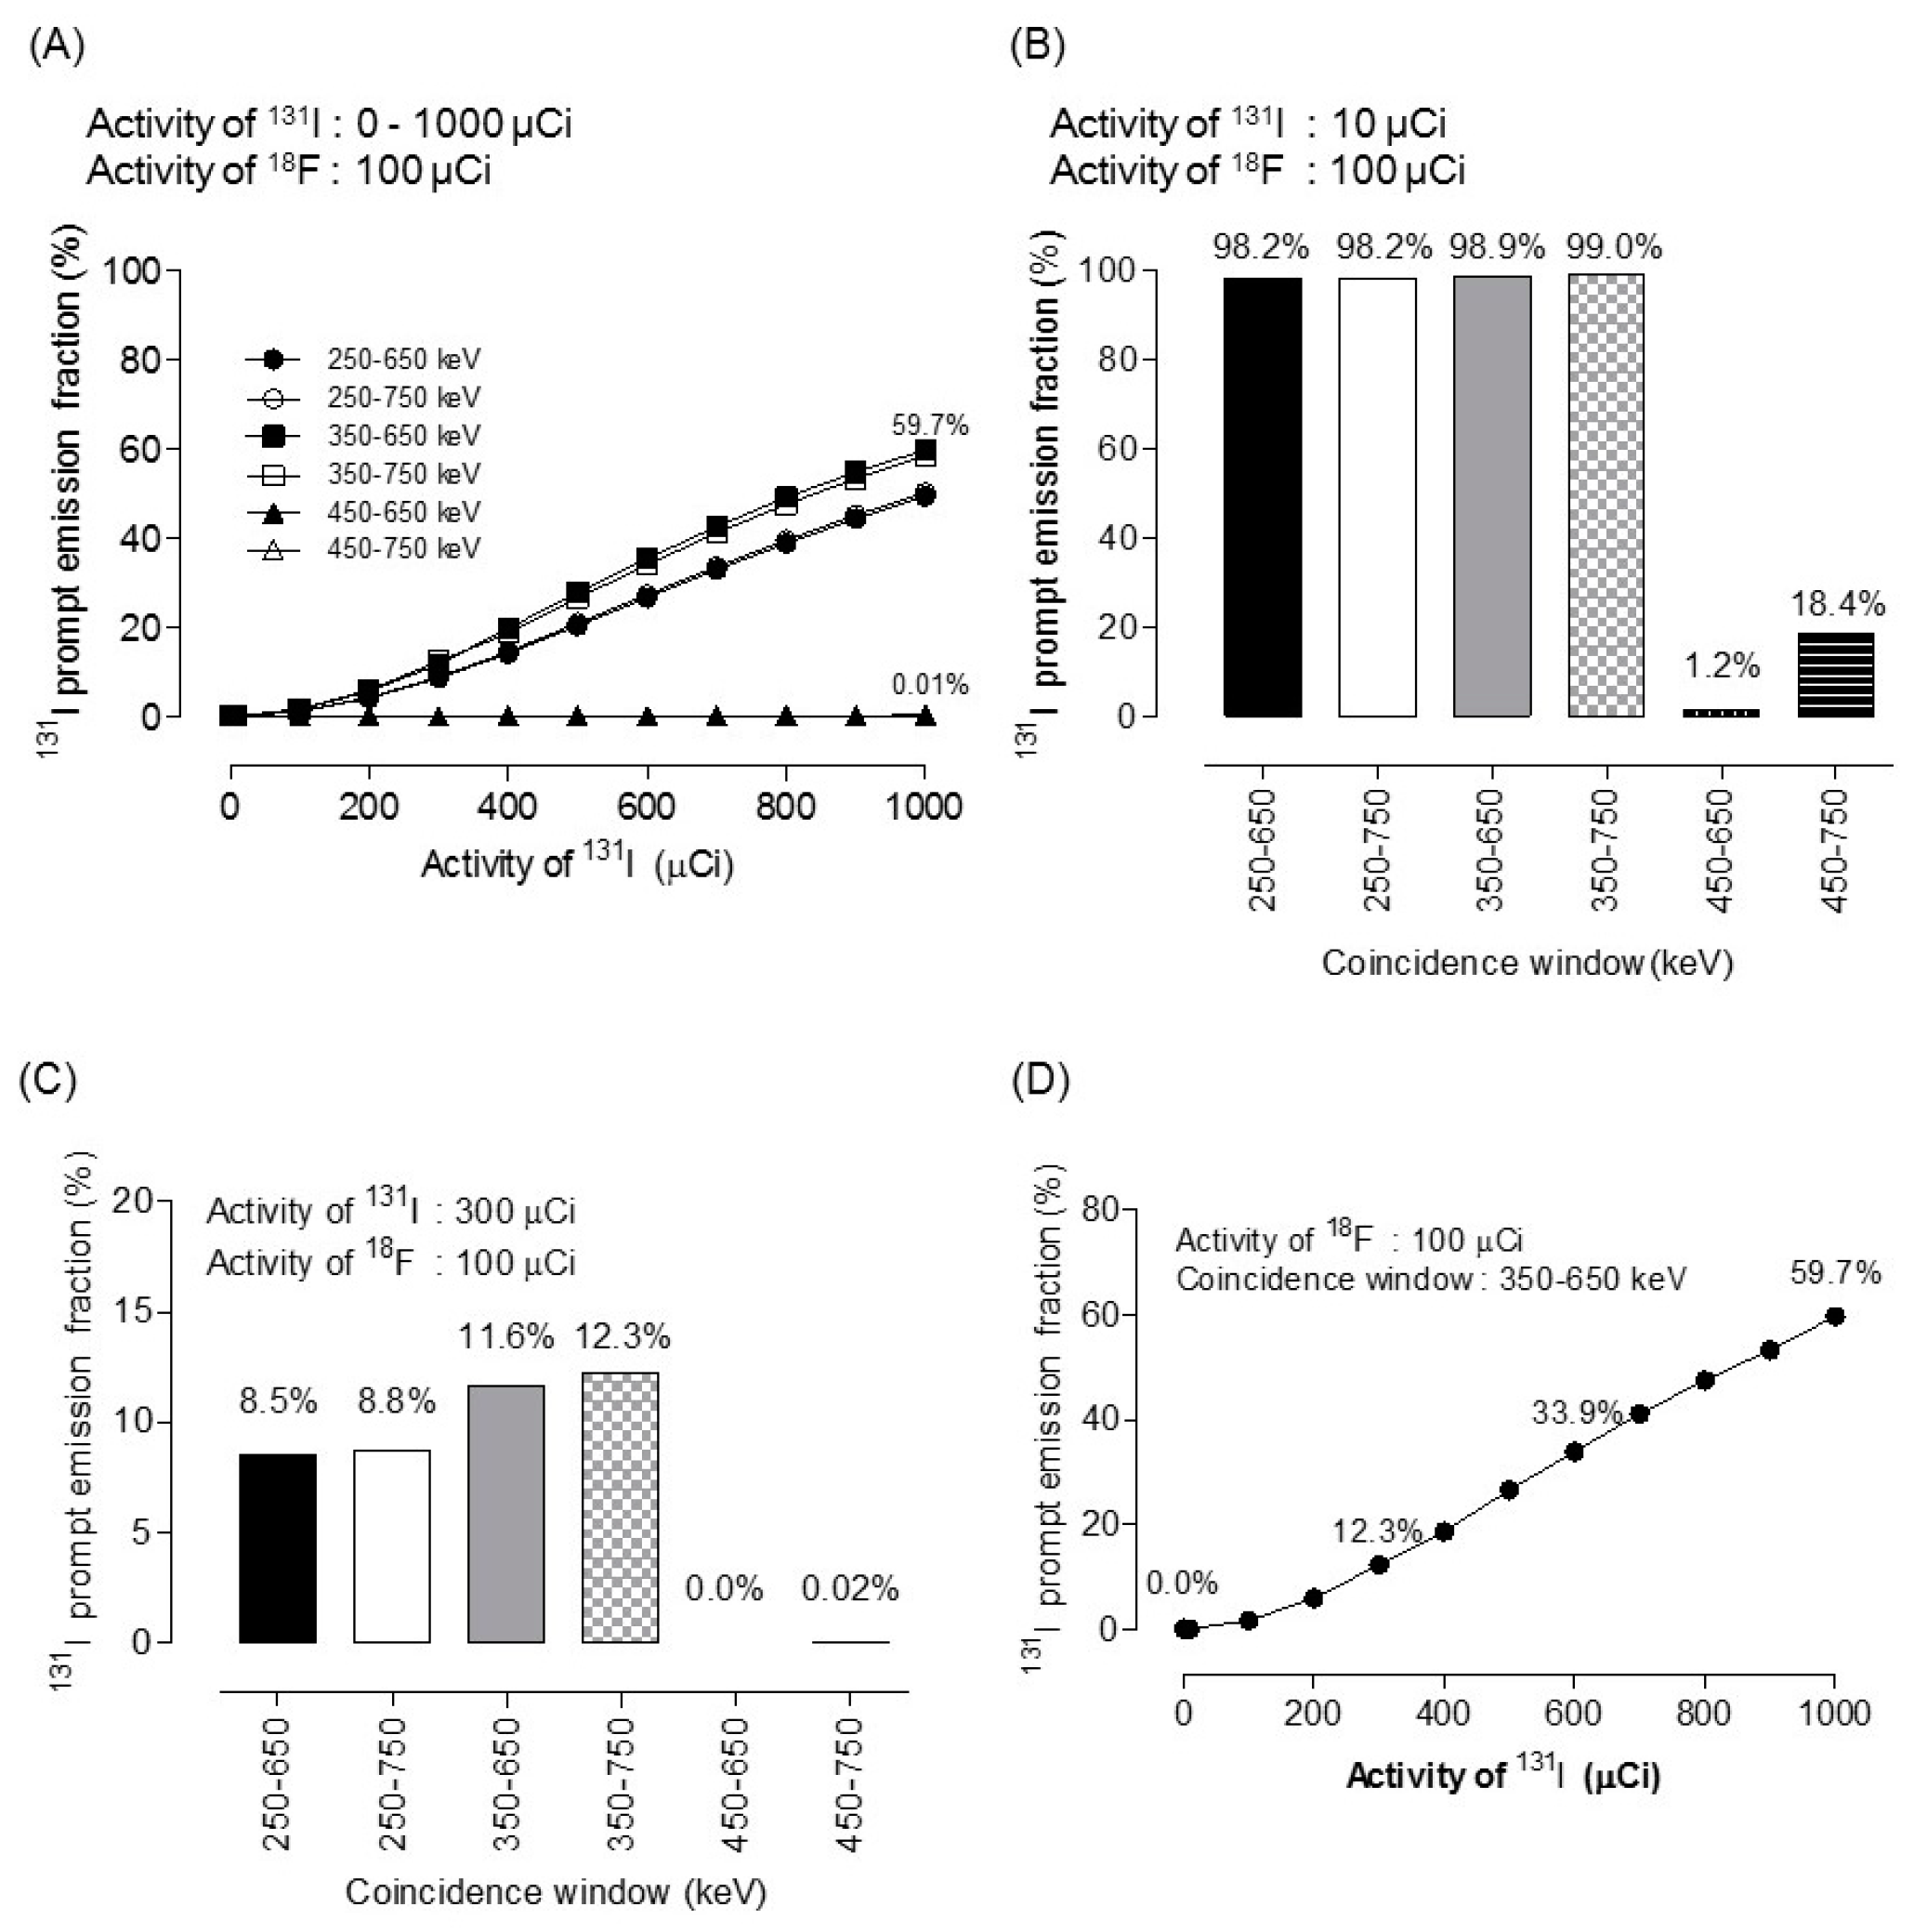
2.4. 131 I Prompt Emission Fraction

When 18F-FDG and 131I were imaged simultaneously, 131I prompt emission would contaminate 18F-FDG PET images. The effect of count contamination due to 131I prompt emission would escalate as 131I activity increases. In this study, the 131I prompt emission fraction was defined as “131I prompt emission / (18F prompt + 131I prompt emission)”. The activity of 18F-FDG was set to 100 µCi and the 131I activities of 1 µCi, 10 µCi, 100 µCi to 1000 µCi (in steps of 100 µCi), and 10 mCi, were assessed.

2.5. Correction of 131I Prompt Emission on 18F-FDG PET Imaging

The distribution of 131I prompt gamma was nearly uniform because the angle of emission of the prompt gamma was uncorrelated with the angle of the annihilation photons [21,22]. For the correction of 131I prompt gamma, first, the scatter sinogram was generated using a single scatter simulation scatter correction algorithm [23]. The edge of the scatter sinogram was identified by thresholding. The data outside the body was then calculated. 131I prompt gamma was calculated using following equation.
131I prompt gamma signogram = scatter sinogram × scale factor
where scale factor = 131I prompt emission fraction.
The prompt gamma and scatter distributions were subtracted from the uncorrected sinogram. The 131I prompt emission-corrected sinogram was reconstructed with correction processes, such as attenuation, scatter, deadtime correction, and normalization. The rebinning and reconstruction were performed using the IAW program (ver. 1.4.3.6) provided by Siemens (Erlangen, Bavaria, Germany).

2.6. Phantom Study (Spill-Over Ratio)

131I prompt emission-correction was applied to a phantom image. A NEMA NU4-2008 image-quality phantom was used to validate the prompt emission-photon correction. The activities were 1 mCi for 131I and 100 μCi for 18F-FDG. PET data were acquired for 20 min of emission and 15 min of transmission using an INVEON PET scanner. Transmission data were acquired using a 57Co source within an energy window of 120–125 keV. The energy window of the emission scan was 350–650 keV. PET data were reconstructed with filtered back-projection (FBP) algorithms. To assess the effect of 131I prompt emission-correction, image quality was assessed in terms of the spill-over ratio (SOR) according to the NEMA NU4-2008 guidelines. The SOR was defined as the ratio between the mean value of a cold cylinder and the mean value of the uniform area. The upper part of the uniform region was a cold region consisting of two empty cylinders (length: 15 mm, inner diameter: 8 mm, outer diameter: 10 mm). One space was filled with air and the other space with nonradioactive water. To calculate the SOR, 2 cylindrical VOIs (length: 7.5 mm, diameter: 4 mm) were drawn in the air- and water-filled compartments. We compared the SOR before and after prompt emission-photon correction. For the phantom study, we compared the results of pre- and post-131I prompt emission fraction correction for a NEMA NU4-2008 image quality phantom [24]. To calculate the SOR, the volumes of interest (VOIs) were drawn on the nonradioactive region using a diameter 75% of that of the nonradioactive region. PET data were reconstructed using FBP. Normalization, dead-time, attenuation and scatter corrections have been applied to all PET raw data. However, partial volume correction was not applied during measurement of SOR because diameter of water filled- and air filled cylinder was relatively large (length: 15 mm, inner diameter: 8 mm, outer diameter: 10 mm) to avoid the partial volume effect.

2.7. In Vivo Study

2.7.1. Lymphoma Animal Model

We applied our developed prompt emission-photon-correction method to a mouse lymphoma model. To generate the mouse lymphoma model, human Burkitt CD20+ (Raji) cells were obtained from the American Type Culture Collection (Manassas, VA, USA), and maintained in roswell park memorial istitute (RPMI) medium containing 10% fetal bovine serum and antibiotics (Sigma, St Louis MO, USA). Cells were kept at 37 °C in a humidified 5% CO2 incubator. Raji cells (1 × 10⁷) were subcutaneously injected into female NOD/SCID mice (n = 10) (Animal Resource Centre, Murdoch, WA, Australia). The tumor volume was calculated using the formula (width2 × length × 0.4).

2.7.2. Preparation of 131I Rituximab

Precoated iodination tubes (Thermo Scientific, Waltham, MA, USA) were used for preparing 131I rituximab for treating the lymphoma model mice. For radiolabeling, the Pierce precoated iodination tube was wet with 1 mL Tris iodination buffer, which was then again decanted, after which 60 µL (1.0 mCi) of 131I was added to the iodination tube. Iodide was activated for 6 min at room temperature, then, 200 μg of rituximab was added and reacted with the iodide for 6–9 min at room temperature. Instant thin-layer chromatography (solvent: 100% acetone, C3H6O) showed that 131I rituximab had a radiochemical purity >95%.

2.7.3. PET Imaging of Lymphoma Mouse Model

After confirmation of the 131I rituximab uptake to tumor region, we made additional lymphoma tumor model (n = 5). When the tumor size reached 300 mm3, an 18F-FDG PET scan of the lymphoma model was acquired as a gold standard to assess the standard uptake value (SUV) before administration of 131I rituximab. After 10 half-lives of 18F-FDG, 131I rituximab was administered intravenously. After 48 h, 18F-FDG PET was acquired. The activity of 131I rituximab was 300 µCi/75 mg. The activity of 18F-FDG was 100 µCi. PET data was reconstructed using FBP. The 131I prompt emission-correction was applied to the data. All corrections, such as attenuation correction, scatter correction, dead-time correction, and normalization was performed. To assess the effect of 131I prompt emission, an ROI (20–30 mm2) was drawn on the tumor region in reconstruction trans-axial PET images both before and after 131I prompt emission-correction. Contrast was also assessed within the tumor region. An ROI was drawn on the necrotic area in a cold region and on the tumor area in a hot region. Contrast was defined as the SUV of the hot region/the SUV of the cold region. The maximal value of SUV was measured for minimizing partial volume effect.

3. Results

The GATE code for the Inveon PET scanner simulation was modelled in our previous study [25]. The photoelectric effect, as well as Compton and Rayleigh interactions, were modelled. Energy cuts were performed on all simulated models. Energy blurring was set to 11% resolution. All physical processes of emission and interaction for 131I and 18F point sources were simulated.
Figure 2 shows the Monte Carlo simulation result of the prompt emission counting rate for 131I during PET scans using various PET energy windows. Although the prompt emission counting rate at 300 µCi 131I was <15 kcps, the prompt emission counting rate reached 149 kcps and 10,117 kcps (not shown in graph) when the activity was 1000 µCi and 10,000 mCi 131I, respectively, within a window of 350–650 keV. However, the prompt emission counting rate, even at 1000 µCi 131I was nearly 0 (2 cps) within a window of 450–650 keV. This result demonstrated that 364 keV and 637 keV of a prompt emission-photon from 131I was not influential within the 450–650 keV windows.
Figure 3 shows the prompt emission counting rate for 18F. Activities were set to 1, 10, 100, 100, and 10,000 µCi. A lower energy level discriminator setting of 350 keV and 450 keV was used to assess the effect of 364 keV of 131I prompt emission. An upper energy level discriminator setting of 650 keV and 750 keV was used to assess the effect of 637 keV and 723 keV of 131I prompt emission. Although the prompt emission counting rate at 300 µCi of 131I was <15 kcps, the coincidence reached 157 kcps and 10 Mcps when the activity was 1 mCi and 10 mCi of 131I within 350–650 keV, respectively. However, the coincidence rate with 300 µCi 131I was nearly 0 (2 cps) within the 450–650 keV window. This demonstrated that the 131I prompt emission at 364 keV and 637 keV had been discarded within the 450–650 keV window. Table 1 and Figure 4 shows the 131I prompt emission fraction within various energy windows. Figure 4D shows that, within a 350–650 keV window, the 131I prompt emission fraction was 12% when 300 µCi 131I and 100 µCi 18F-FDG were administered. The 131I prompt emission fraction reached 59.7% and 99% when 1 mCi 131 I and 10 mCi 131I were administered, respectively. The 131I prompt emission fraction increased with increasing 131I activity for all energy windows. The relationship between the 131I prompt emission fraction and 131I activity within the 350–650 keV window was as follows:
131I prompt emission fraction = 0.06 × (activity of 131I [µCi]) − 6.72 (R2 = 0.99)
The 131I prompt emission fraction was defined as the “coincidence from 131I/(coincidence from 18F-FDG + coincidence from 131I)”. The 131I prompt emission fraction was 12% when 300 µCi of 131I and 100 µCi of 18F-FDG were co-administered. 131I prompt emission fraction reached 59.7% when 1 mCi of 131I was administered.
To correct 131I prompt emission, we applied our developed 131I prompt emission-correction method to both a phantom and an in vivo mouse lymphoma model.
Figure 5A shows the representative PET image of NEMA NU4-2008 image quality phantom and Figure 5B shows the SOR results compared with the gold standard (18F-FDG), before 131I prompt emission and after 131I prompt emission. SOR was 13.7% for 18F-FDG PET. After administration of 131I, SOR was 16.9% and 14.4% before and after 131I prompt emission correction, respectively. The percentage difference was <5% between 18F-FDG only and after 131I prompt emission-correction.
When our 131I prompt emission-correction method was applied to the in vivo mouse model (shown in Figure 5C), the SUV of the tumor region was 2.74 ± 0.13 for 18F-FDG PET only, 2.97 ± 0.18 after 131I prompt emission-correction, and 3.78 ± 0.2 before 131I prompt emission-correction (shown in Figure 5D. Contrast was improved by 18% after 131I prompt emission-correction. Before 131I prompt emission-correction, SUV was overestimated by 38% (* p < 0.05). However, there was no statistically significant difference between SUV for 18F-FDG and after correction of 131I prompt emission.

4. Discussion

Prompt correction method of nonpure positron emitters including 82Rb [21,22], 124I [18,26,27], 76Br [28,29], and 86Y [29] were introduced. This prompt gamma can directly contribute or indirectly scatter down into the primary energy window [26]. The high energy of gammas can cause down scatter issues within the energy window of the 511 keV annihilation photons of PET imaging. We investigated whether low energy due to 131I could also contaminate 18F-FDG PET scans. We found count contamination on 18F-FDG follow-up scans due to 131I spill-over count after 131I rituximab tumor targeted therapy. For this reason, we developed a PET image correction method to address the inclusion of 131I during 18F-FDG PET scans. When our developed method was applied to the measurement of SOR using the NEMA NU4 image quality phantom, 131I prompt correction provided the similar level of SOR (the percentage difference was <5% between 18F-FDG only and after 131I prompt emission-correction). When our 131I prompt emission-correction method was applied to the in vivo mouse model, the SUV of the tumor region was 2.74 ± 0.13 for 18F-FDG PET only, 2.97 ± 0.18 after 131I prompt emission-correction, and 3.78 ± 0.2 before 131I prompt emission-correction. We found that our developed 131I prompt correction method was applicable for both phantom and actual mouse study. Our 131I prompt emission-correction method increased accuracy during measurement of standard uptake value on 18F-FDG PET as well as spill-over ratio in phantom study.
We assessed the effect of 131I in terms of SOR in a phantom and also applied it to a mouse model that had received 131I rituximab. Our data showed that count contamination due to 131I prompt emission was prominent when 131I at higher activities was administered (at 10 mCi 131I, the 131I prompt emission fraction reached 99%). In addition, we found that there was a negligible effect of 131I prompt emission within an energy window of 450–650 keV. Therefore, this energy window would be useful for 18F-FDG follow-up scans. However, in a narrow energy window, such as 450–650 keV, the sensitivity would be significantly decreased when the conventional 350–650 keV energy window is used in a preclinical study. According to our Monte Carlo simulation study for the Inveon PET scanner, the sensitivities were 7.0% for 350–650 keV, 7.3% for 350–750 keV, 5.8% for 450–650 keV, and 6.0% for 450–750 keV windows. The sensitivity within the 450–650 keV window was degraded by 26% as compared to that of the 350–650 keV window. Decreased sensitivity in a PET scan indicates a decreased signal-to-noise ratio in PET. Therefore, there was a trade-off between count contamination due to 131I prompt emissions and the signal-to-noise ratio between a narrow energy window (450–650 keV) and the conventional energy window (350–650 keV) in 18F-FDG PET after 131I administration. With application of our 131I prompt correction method, a wider energy window, such as 350–650 keV would be advantageous over a 450–650 keV energy window.
The main limitation of this study was, given that our developed method was applicable to animal study, we used a wide energy window during PET scanning to improve sensitivity. However, narrower energy windows are typically used in a clinical setting and a low energy of 131I would be negligible during 18F-FDG scanning. In summary, although these findings have a limited application for clinical use, our developed method could be feasible in animal studies, especially in 18F-FDG PET assessment of the therapeutic efficacy of RIT, such as 131I rituximab.

5. Conclusions

In conclusion, we developed an 131I prompt emission-correction method for 18F-FDG PET imaging after 131I rituximab therapy and applied it to an in vivo mouse model. Our method will facilitate monitoring of the therapeutic efficacy of newly developed drugs in 18F-FDG PET follow-up after 131I-rituximab therapy.

Author Contributions

Conceptualization, J.S.K. and Y.S.L.; methodology, J.S.K. and Y.S.L.; software, Y.S.L.; validation, J.S.K. and Y.S.L.; formal analysis, Y.S.L.; investigation, J.S.K. and Y.S.L.; resources, J.S.K.; data curation, Y.S.L.; writing—original draft preparation, Y.S.L.; writing—review and editing, J.S.K. and H.-J.K.; visualization, J.S.K. and Y.S.L.; supervision, J.S.K.; project administration, J.S.K.; funding acquisition, J.S.K.

Funding

This work was supported by Ministry of health and welfare (No HO15C0003, PI: Jin Su Kim) and KIRAMS (No 50461-2019, PI: Kyo Chul Lee). Research support for this study (including salaries, equipment, supplies, and other expenses) was provided by the Ministry of Health and Welfare and Korea Institute of Radiological and Medical Sciences. However, the funders played no role in the conceptualization, design, data collection and analysis, or decision to publish.

Conflicts of Interest

The authors declare no conflict of interest.

References

  1. Verel, I.; Visser, G.W.; van Dongen, G.A. The promise of immuno-PET in radioimmunotherapy. J. Nucl. Med. 2005, 46, 164S–171S. [Google Scholar] [PubMed]
  2. Pouget, J.P.; Navarro-Teulon, I.; Bardies, M.; Chouin, N.; Cartron, G.; Pelegrin, A.; Azria, D. Clinical radioimmunotherapy—The role of radiobiology. Nat. Rev. Clin. Oncol. 2011, 8, 720–734. [Google Scholar] [CrossRef] [PubMed]
  3. Kim, J.S. Combination Radioimmunotherapy Approaches and Quantification of Immuno-PET. Nucl. Med. Mol. Imaging 2016, 50, 104–111. [Google Scholar] [CrossRef] [PubMed]
  4. Boerman, O.C.; Oyen, W.J. Immuno-PET of cancer: A revival of antibody imaging. J. Nucl. Med. 2011, 52, 1171–1172. [Google Scholar] [CrossRef] [PubMed]
  5. Kang, H.J.; Lee, S.S.; Byun, B.H.; Kim, K.M.; Lim, I.; Choi, C.W.; Suh, C.; Kim, W.S.; Nam, S.H.; Lee, S.I.; et al. Repeated radioimmunotherapy with I-131-rituximab for patients with low-grade and aggressive relapsed or refractory B cell non-Hodgkin lymphoma. Cancer Chemother. Pharmacol. 2013, 71, 945–953. [Google Scholar] [CrossRef] [PubMed]
  6. Quackenbush, R.C.; Horner, T.J.; Williams, V.C.; Giampietro, P.; Lin, T.S. Patients with relapsed follicular lymphoma treated with rituximab versus tositumomab and iodine 131I tositumomab. Leuk. Lymphoma 2015, 56, 779–781. [Google Scholar] [CrossRef]
  7. Kobayashi, M.; Wakabayashi, H.; Kayano, D.; Konishi, T.; Kojima, H.; Yoneyama, H.; Okuda, K.; Tsushima, H.; Onoguchi, M.; Kawai, K.; et al. Application of a medium-energy collimator for 131I imaging after ablation treatment of differentiated thyroid cancer. Ann. Nucl. Med. 2014, 28, 551–558. [Google Scholar] [CrossRef]
  8. Hanscheid, H.; Lassmann, M.; Buck, A.K.; Reiners, C.; Verburg, F.A. The limit of detection in scintigraphic imaging with 131I in patients with differentiated thyroid carcinoma. Phys. Med. Biol. 2014, 59, 2353–2368. [Google Scholar] [CrossRef]
  9. Erdi, Y.E.; Macapinlac, H.; Larson, S.M.; Erdi, A.K.; Yeung, H.; Furhang, E.E.; Humm, J.L. Radiation Dose Assessment for 131I Therapy of Thyroid Cancer Using 124I PET Imaging. Clin. Positron Imaging 1999, 2, 41–46. [Google Scholar] [CrossRef]
  10. Jentzen, W.; Hobbs, R.F.; Stahl, A.; Knust, J.; Sgouros, G.; Bockisch, A. Pre-therapeutic 124I PET(/CT) dosimetry confirms low average absorbed doses per administered 131I activity to the salivary glands in radioiodine therapy of differentiated thyroid cancer. Eur. J. Nucl. Med. Mol. Imaging 2010, 37, 884–895. [Google Scholar] [CrossRef]
  11. Jentzen, W.; Hoppenbrouwers, J.; van Leeuwen, P.; van der Velden, D.; van de Kolk, R.; Poeppel, T.D.; Nagarajah, J.; Brandau, W.; Bockisch, A.; Rosenbaum-Krumme, S. Assessment of lesion response in the initial radioiodine treatment of differentiated thyroid cancer using 124I PET imaging. J. Nucl. Med. 2014, 55, 1759–1765. [Google Scholar] [CrossRef] [PubMed]
  12. Maruoka, Y.; Abe, K.; Baba, S.; Isoda, T.; Kitamura, Y.; Mizoguchi, N.; Akamatsu, G.; Sasaki, M.; Honda, H. Usefulness of partial volume effect-corrected 18F FDG PET/CT for predicting 131I accumulation in the metastatic lymph nodes of patients with thyroid carcinoma. Ann. Nucl. Med. 2013, 27, 873–879. [Google Scholar] [CrossRef] [PubMed]
  13. Nowosinska, E.; Chan, P.S.; Buscombe, J.R. Use of 18F FDG PET and the short temporal response of Hodgkin’s disease to RIT. World J. Nucl. Med. 2018, 17, 171–177. [Google Scholar] [CrossRef] [PubMed]
  14. Byun, B.H.; Na, I.I.; Cheon, G.J.; Kang, H.J.; Kim, K.M.; Lee, S.S.; Ryoo, B.Y.; Choi, C.W.; Lim, S.M.; Yang, S.H. Clinical significance of 18F FDG uptake by primary sites in patients with diffuse large B cell lymphoma in the head and neck: A pilot study. Ann. Nucl. Med. 2008, 22, 645–651. [Google Scholar] [CrossRef]
  15. An, Y.S.; Yoon, J.K.; Lee, S.J.; Jeong, S.H.; Lee, H.W. Clinical significance of post-treatment 18F fluorodeoxyglucose uptake in cervical lymph nodes in patients with diffuse large B-cell lymphoma. Eur. Radiol. 2016, 26, 4632–4639. [Google Scholar] [CrossRef]
  16. Kesavan, M.; Boucek, J.; MacDonald, W.; McQuillan, A.; Turner, J.H. Imaging of Early Response to Predict Prognosis in the First-Line Management of Follicular Non-Hodgkin Lymphoma with 131I -Rituximab Radioimmunotherapy. Diagnostics 2017, 7, 26. [Google Scholar] [CrossRef]
  17. Schrepfer, T.; Haerle, S.K.; Strobel, K.; Schaefer, N.; Halg, R.A.; Huber, G.F. The value of 18F fluorodeoxyglucose positron emission tomography/computed tomography for staging of primary extranodal head and neck lymphomas. Laryngoscope 2010, 120, 937–944. [Google Scholar] [CrossRef]
  18. Kim, J.S.; Yu, A.R. Determination of single gamma photon fraction of 124I PET. J. Instrum. 2015, 10. [Google Scholar] [CrossRef]
  19. Yu, A.R.; Kim, H.J.; Lim, S.M.; Kim, J.S. Comparison of Imaging Characteristics of 124I PET for Determination of Optimal Energy Window on the Siemens Inveon PET. Biomed. Res. Int. 2016, 2016. [Google Scholar] [CrossRef]
  20. Gregory, R.A.; Hooker, C.A.; Partridge, M.; Flux, G.D. Optimization and assessment of quantitative 124I imaging on a Philips Gemini dual GS PET/CT system. Eur. J. Nucl. Med. Mol. Imaging 2009, 36, 1037–1048. [Google Scholar] [CrossRef]
  21. Moncayo, V.M.; Garcia, E.V. Prompt-gamma compensation in 82Rb myocardial perfusion 3D PET/CT: Effect on clinical practice. J. Nucl. Cardiol. 2018, 25, 606–608. [Google Scholar] [CrossRef] [PubMed]
  22. Esteves, F.P.; Nye, J.A.; Khan, A.; Folks, R.D.; Halkar, R.K.; Garcia, E.V.; Schuster, D.M.; Lerakis, S.; Raggi, P.; Votaw, J.R. Prompt-gamma compensation in 82Rb myocardial perfusion 3D PET/CT. J. Nucl. Cardiol. 2010, 17, 247–253. [Google Scholar] [CrossRef] [PubMed]
  23. Werling, A.; Bublitz, O.; Doll, J.; Adam, L.E.; Brix, G. Fast implementation of the single scatter simulation algorithm and its use in iterative image reconstruction of PET data. Phys. Med. Biol. 2002, 47, 2947–2960. [Google Scholar] [CrossRef] [PubMed]
  24. National Electrical Manufacturers Association. Performance Measurements of Small Animal Positron Emission Tomographs. In NEMA Standards Publication NU 4-2008; NEMA: Rosslyn, VA, USA, 2008. [Google Scholar]
  25. Kim, J.S.; Lee, J.S.; Park, M.J.; Hong, S.J.; Lee, D.S. Comparative evaluation of three microPET series systems using Monte Carlo simulation: Sensitivity and scatter fraction. In Proceedings of the IEEE Nuclear Science Symposium Conference Record (NSS ’07), Honolulu, HI, USA, 26 October–3 November 2007; pp. 4534–4535. [Google Scholar]
  26. Lin, H.H.; Chuang, K.S.; Chen, S.Y.; Jan, M.L. Recovering the triple coincidence of non-pure positron emitters in preclinical PET. Phys. Med. Biol. 2016, 61, 1904–1931. [Google Scholar] [CrossRef]
  27. Wierts, R.; Conti, M.; Claessen, A.G.; Herrmann, K.; Kemerink, G.J.; Binse, I.; Wildberger, J.E.; Mottaghy, F.M.; Backes, W.H.; Jentzen, W. Impact of prompt gamma coincidence correction on absorbed dose estimation in differentiated thyroid cancer using 124I PET/CT imaging. Nucl. Med. Commun. 2018, 39, 1156–1164. [Google Scholar] [CrossRef]
  28. Laforest, R.; Liu, X. Cascade removal and microPET imaging with 76Br. Phys. Med. Biol. 2009, 54, 1503–1531. [Google Scholar] [CrossRef]
  29. Beattie, B.J.; Finn, R.D.; Rowland, D.J.; Pentlow, K.S. Quantitative imaging of 76Br and 86Y with PET: A method for the removal of spurious activity introduced by cascade gamma rays. Med. Phys. 2003, 30, 2410–2423. [Google Scholar] [CrossRef]
Figure 1. Schematic illustration of emissions. (A) Schematic of Positron Emission Tomography (PET) emissions, such as true, scatter, and random emissions during annihilation. (B) 131I prompt emission. 131I emitted 284, 364, 637, and 723 keV gamma rays. (C) Schematic of 131I prompt emission profile.
Diagnostics 09 00144 g001
Figure 2. (A) Prompt emission counting rate due to 131I within various energy windows. (B) Rescaled Y axis from Figure 2A. The value between “450 and 650 keV” and “450 and 750 keV” was not discernible in the scale of Kcounts/sec in Figure 2A. Therefore, we rescaled the Y-axis for the visibility of “450–650 keV” and “450–750 keV” in Figure 2B.
Diagnostics 09 00144 g002
Figure 3. (A) Prompt emission counting rate due to 18F within various energy windows. (B) Rescaled Y axis from Figure 3A. Activities were set to 1, 10, 100, 100, 10,000 µCi.
Diagnostics 09 00144 g003
Figure 4. 131I prompt emission fraction within various energy windows. (A) Activity of 131I was set to 0 to 1000 µCi in steps of 100 µCi with 100 µCi 18F activity. (B) 10 µCi of 131I with 100 µCi of 18F. (C) 300 µCi of 131I with 100 µCi of 18F (D) 131I prompt emission fraction within 350–650 keV at the level of 100 µCi of 18F.
Diagnostics 09 00144 g004
Figure 5. (A) Positron Emission Tomography (PET) image of NEMA image quality phantom, (B) spill-over ration of NEMA image quality phantom, (C) Representative PET data of mouse image, arrow sign indicates tumor region, (D) SUV in tumors, * p < 0.05.
Diagnostics 09 00144 g005
Table 1. 131I prompt emission fraction with various energy windows and activities.
Activity of 131I * (µCi)Energy Window (keV)
350–650350–750450–650450–750
10.000.000.000.00
100.010.010.000.00
1001.451.600.000.00
2005.595.880.000.01
30011.6412.250.000.02
40019.7018.650.000.04
50027.8526.530.010.05
60035.3133.920.010.07
70042.5341.120.010.09
80049.0847.540.010.12
90054.8153.300.020.17
100058.5059.740.020.21
10,00098.9699.011.2818.48
* In this GATE simulation for the calculation of the 131I prompt emission fraction, the activity of 18F was set to 100 µCi.

