Very Early Response Evaluation by PET/MR in Patients with Lung Cancer—Timing and Feasibility

 ,
, 

Abstract
:1. Introduction
2. Methods
2.1. Study Population
2.2. Imaging
2.3. PET/MRI Reading and Data Extraction
2.4. Statistical Analysis
3. Results
3.1. Patients
3.2. PET/MR-Scans
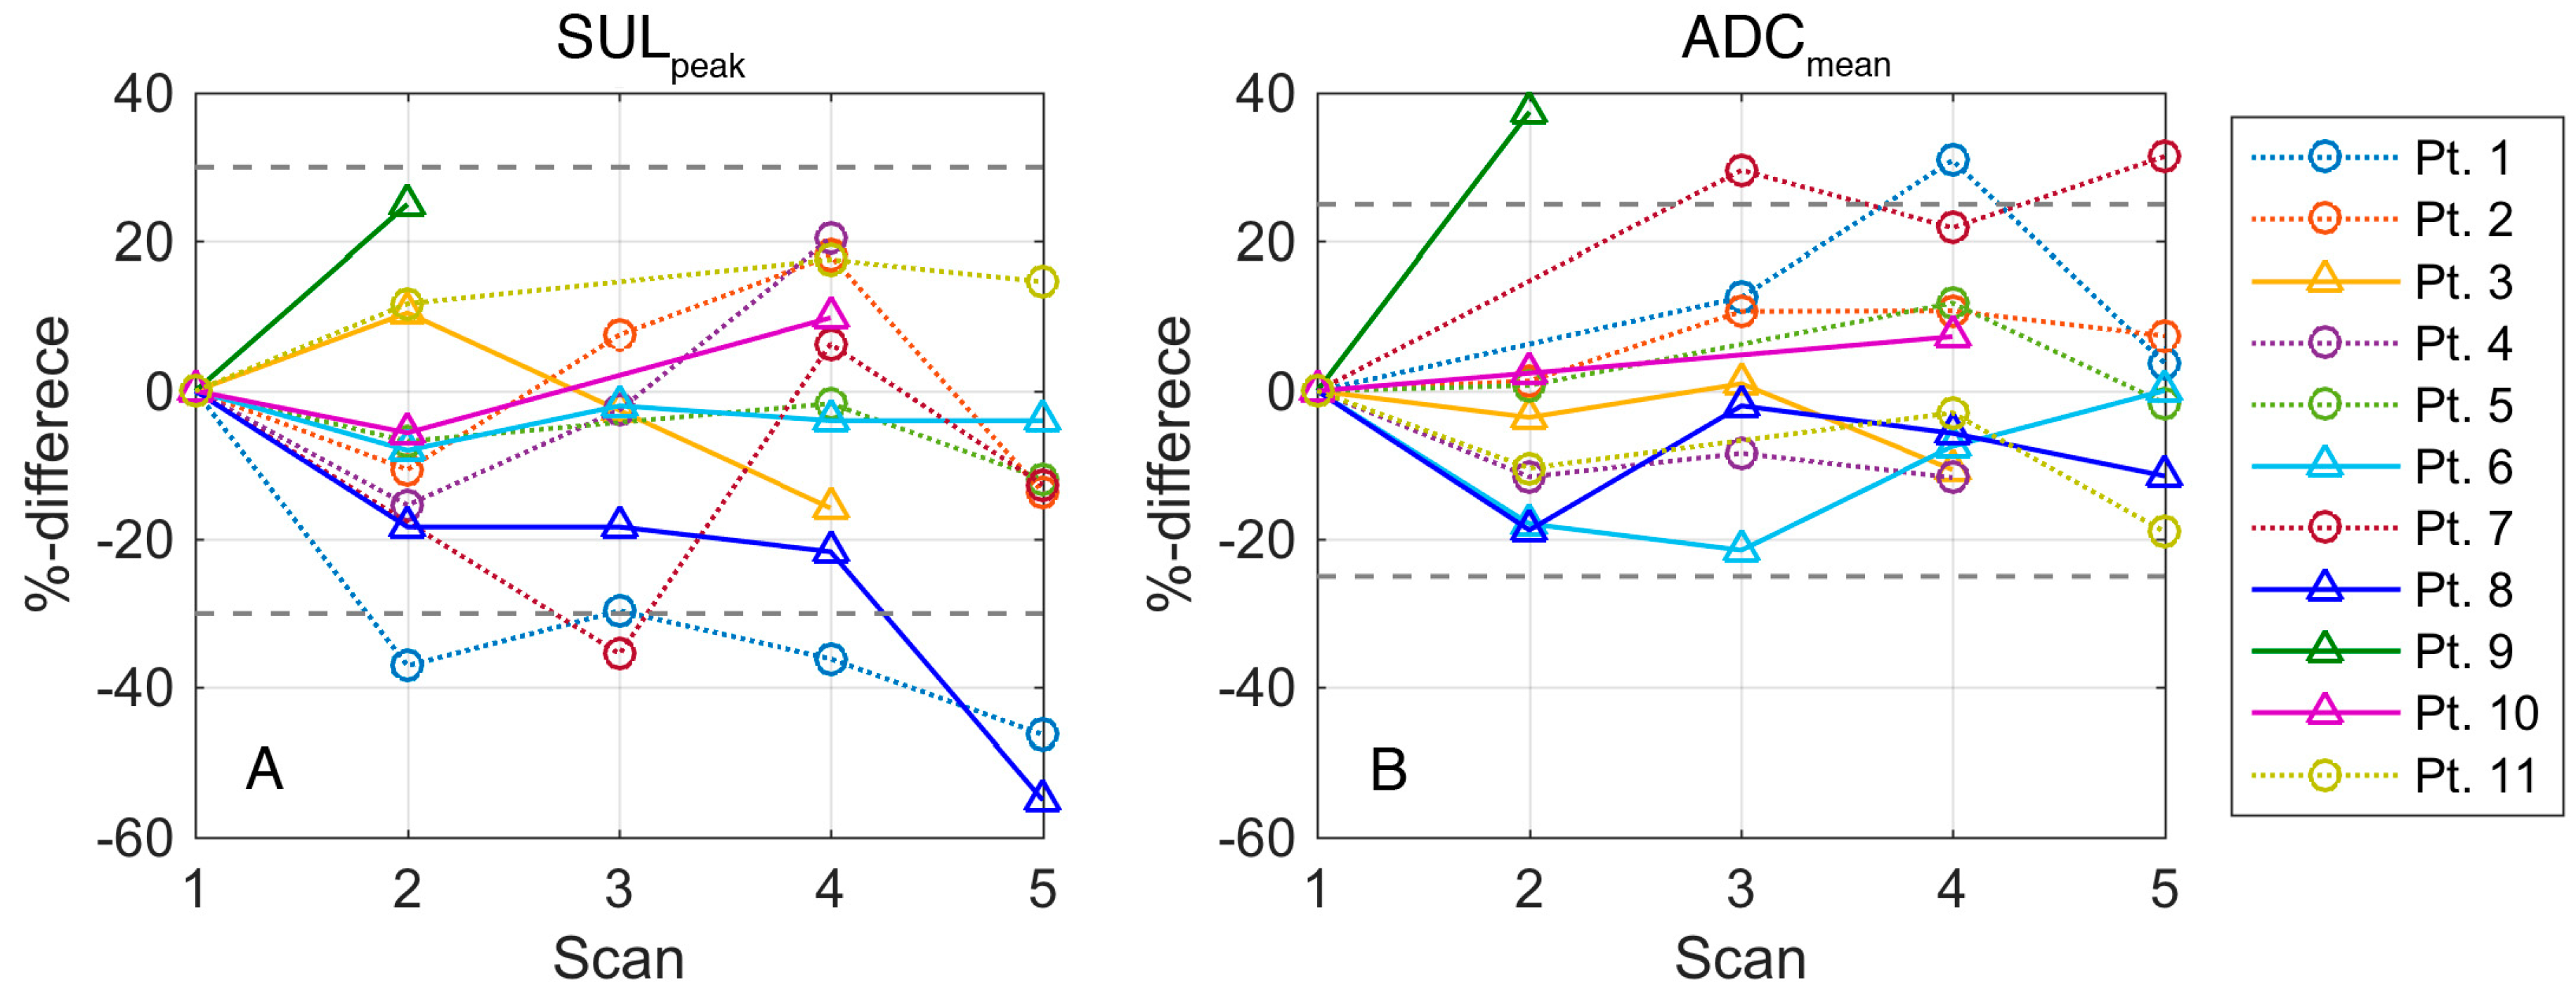
3.3. Changes in SUV
3.4. Changes in ADC
4. Discussion
4.1. Feasibility
4.2. Response Patterns and Flare
Supplementary Materials
Author Contributions
Funding
Acknowledgments
Conflicts of Interest
References
- Danish Lung Cancer Registry, Lungecancer, Visitation, Diagnose og Stadieinddeling. Available online: http://lungecancer.dk/documents/BB655853-A6AB-4D15-8741-F5100FFB0247.pdf (accessed on 1 March 2017).
- Eisenhauer, E.A.; Therasse, P.; Bogaerts, J.; Schwartz, L.H.; Sargent, D.; Ford, R.; Dancey, J.; Arbuck, S.; Gwyther, S.; Mooney, M.; et al. New response evaluation criteria in solid tumours: Revised recist guideline (version 1.1). Eur. J. Cancer 2009, 45, 228–247. [Google Scholar] [CrossRef] [PubMed]
- Stahel, R.; Peters, S.; Baas, P.; Brambilla, E.; Cappuzzo, F.; De Ruysscher, D.; Eberhardt, W.E.; Felip, E.; Fennell, D.; Marchetti, A.; et al. Strategies for improving outcomes in nsclc: A look to the future. Lung Cancer 2013, 82, 375–382. [Google Scholar] [CrossRef]
- Beyer, T.; Townsend, D.W.; Brun, T.; Kinahan, P.E.; Charron, M.; Roddy, R.; Jerin, J.; Young, J.; Byars, L.; Nutt, R. A combined pet/ct scanner for clinical oncology. J. Nucl. Med. 2000, 41, 1369–1379. [Google Scholar] [PubMed]
- Kelloff, G.J.; Krohn, K.A.; Larson, S.M.; Weissleder, R.; Mankoff, D.A.; Hoffman, J.M.; Link, J.M.; Guyton, K.Z.; Eckelman, W.C.; Scher, H.I.; et al. The progress and promise of molecular imaging probes in oncologic drug development. Clin. Cancer Res. 2005, 11, 7967–7985. [Google Scholar] [CrossRef]
- Czernin, J.; Ta, L.; Herrmann, K. Does pet/mr imaging improve cancer assessments? Literature evidence from more than 900 patients. J. Nucl. Med. 2014, 55, 59s–62s. [Google Scholar] [CrossRef]
- Silvestri, G.A.; Gonzalez, A.V.; Jantz, M.A.; Margolis, M.L.; Gould, M.K.; Tanoue, L.T.; Harris, L.J.; Detterbeck, F.C. Methods for staging non-small cell lung cancer: Diagnosis and management of lung cancer, 3rd ed: American college of chest physicians evidence-based clinical practice guidelines. Chest 2013, 143, e211S–e250S. [Google Scholar] [CrossRef]
- Langer, N.H.; Christensen, T.N.; Langer, S.W.; Kjaer, A.; Fischer, B.M. Pet/ct in therapy evaluation of patients with lung cancer. Expert Rev. Anticancer Ther. 2014, 14, 595–620. [Google Scholar] [CrossRef]
- Boellaard, R. Need for standardization of 18f-fdg pet/ct for treatment response assessments. J. Nucl. Med. 2011, 52 (Suppl. 2), 93s–100s. [Google Scholar] [CrossRef]
- Lodge, M.A. Repeatability of suv in oncologic (18)f-fdg pet. J. Nucl. Med. 2017, 58, 523–532. [Google Scholar] [CrossRef] [PubMed]
- Kurland, B.F.; Muzi, M.; Peterson, L.M.; Doot, R.K.; Wangerin, K.A.; Mankoff, D.A.; Linden, H.M.; Kinahan, P.E. Multicenter clinical trials using 18f-fdg pet to measure early response to oncologic therapy: Effects of injection-to-acquisition time variability on required sample size. J. Nucl. Med. 2016, 57, 226–230. [Google Scholar] [CrossRef] [PubMed]
- Basu, S.; Alavi, A. Defining co-related parameters between ‘metabolic’ flare and ‘clinical’, ‘biochemical’, and ‘osteoblastic’ flare and establishing guidelines for assessing response to treatment in cancer. Eur. J. Nucl. Med. Mol. Imaging 2007, 34, 441–443. [Google Scholar] [CrossRef] [PubMed]
- Dehdashti, F.; Flanagan, F.L.; Mortimer, J.E.; Katzenellenbogen, J.A.; Welch, M.J.; Siegel, B.A. Positron emission tomographic assessment of “metabolic flare” to predict response of metastatic breast cancer to antiestrogen therapy. Eur. J. Nucl. Med. 1999, 26, 51–56. [Google Scholar] [CrossRef] [PubMed]
- Aliaga, A.; Rousseau, J.A.; Cadorette, J.; Croteau, E.; van Lier, J.E.; Lecomte, R.; Benard, F. A small animal positron emission tomography study of the effect of chemotherapy and hormonal therapy on the uptake of 2-deoxy-2-[f-18]fluoro-d-glucose in murine models of breast cancer. Mol. Imaging Biol. 2007, 9, 144–150. [Google Scholar] [CrossRef] [PubMed]
- Spaepen, K.; Stroobants, S.; Dupont, P.; Bormans, G.; Balzarini, J.; Verhoef, G.; Mortelmans, L.; Vandenberghe, P.; De Wolf-Peeters, C. [(18)f]fdg pet monitoring of tumour response to chemotherapy: Does [(18)f]fdg uptake correlate with the viable tumour cell fraction? Eur. J. Nucl. Med. Mol. Imaging 2003, 30, 682–688. [Google Scholar] [CrossRef]
- Bjurberg, M.; Henriksson, E.; Brun, E.; Ekblad, L.; Ohlsson, T.; Brun, A.; Kjellen, E. Early changes in 2-deoxy-2-[18f]fluoro-d-glucose metabolism in squamous-cell carcinoma during chemotherapy in vivo and in vitro. Cancer Biother. Radiopharm. 2009, 24, 327–332. [Google Scholar] [CrossRef] [PubMed]
- Bjurberg, M.; Abedinpour, P.; Brun, E.; Baldetorp, B.; Borgstrom, P.; Wennerberg, J.; Kjellen, E. Early metabolic flare in squamous cell carcinoma after chemotherapy is a marker of treatment sensitivity in vitro. Nucl. Med. Mol. Imaging 2010, 44, 165–169. [Google Scholar] [CrossRef] [PubMed]
- Engles, J.M.; Quarless, S.A.; Mambo, E.; Ishimori, T.; Cho, S.Y.; Wahl, R.L. Stunning and its effect on 3h-fdg uptake and key gene expression in breast cancer cells undergoing chemotherapy. J. Nucl. Med. 2006, 47, 603–608. [Google Scholar]
- Wehrl, H.F.; Sauter, A.W.; Judenhofer, M.S.; Pichler, B.J. Combined pet/mr imaging—Technology and applications. Technol. Cancer Res. Treat. 2010, 9, 5–20. [Google Scholar] [CrossRef]
- Schiepers, C.; Dahlbom, M. Molecular imaging in oncology: The acceptance of pet/ct and the emergence of mr/pet imaging. Eur. Radiol. 2011, 21, 548–554. [Google Scholar] [CrossRef]
- Balyasnikova, S.; Lofgren, J.; de Nijs, R.; Zamogilnaya, Y.; Hojgaard, L.; Fischer, B.M. Pet/mr in oncology: An introduction with focus on mr and future perspectives for hybrid imaging. Am. J. Nucl. Med. Mol. Imaging 2012, 2, 458–474. [Google Scholar]
- Sauter, A.W.; Wehrl, H.F.; Kolb, A.; Judenhofer, M.S.; Pichler, B.J. Combined pet/mri: One step further in multimodality imaging. Trends Mol. Med. 2010, 16, 508–515. [Google Scholar] [CrossRef]
- Samarin, A.; Burger, C.; Wollenweber, S.D.; Crook, D.W.; Burger, I.A.; Schmid, D.T.; von Schulthess, G.K.; Kuhn, F.P. Pet/mr imaging of bone lesions--implications for pet quantification from imperfect attenuation correction. Eur. J. Nucl. Med. Mol. Imaging 2012, 39, 1154–1160. [Google Scholar] [CrossRef] [PubMed]
- Yabuuchi, H.; Hatakenaka, M.; Takayama, K.; Matsuo, Y.; Sunami, S.; Kamitani, T.; Jinnouchi, M.; Sakai, S.; Nakanishi, Y.; Honda, H. Non-small cell lung cancer: Detection of early response to chemotherapy by using contrast-enhanced dynamic and diffusion-weighted mr imaging. Radiology 2011, 261, 598–604. [Google Scholar] [CrossRef]
- Nakayama, J.; Miyasaka, K.; Omatsu, T.; Onodera, Y.; Terae, S.; Matsuno, Y.; Cho, Y.; Hida, Y.; Kaga, K.; Shirato, H. Metastases in mediastinal and hilar lymph nodes in patients with non-small cell lung cancer: Quantitative assessment with diffusion-weighted magnetic resonance imaging and apparent diffusion coefficient. J. Comput. Assist. Tomogr. 2010, 34, 1–8. [Google Scholar] [CrossRef]
- Nomori, H.; Mori, T.; Ikeda, K.; Kawanaka, K.; Shiraishi, S.; Katahira, K.; Yamashita, Y. Diffusion-weighted magnetic resonance imaging can be used in place of positron emission tomography for n staging of non-small cell lung cancer with fewer false-positive results. J. Thorac. Cardiovasc. Surg. 2008, 135, 816–822. [Google Scholar] [CrossRef]
- Kwee, T.C.; Takahara, T.; Ochiai, R.; Nievelstein, R.A.; Luijten, P.R. Diffusion-weighted whole-body imaging with background body signal suppression (dwibs): Features and potential applications in oncology. Eur. Radiol. 2008, 18, 1937–1952. [Google Scholar] [CrossRef] [PubMed]
- Olin, A.; Ladefoged, C.N.; Langer, N.H.; Keller, S.H.; Lofgren, J.; Hansen, A.E.; Kjaer, A.; Langer, S.W.; Fischer, B.M.; Andersen, F.L. Reproducibility of mr-based attenuation maps in pet/mri and the impact on pet quantification in lung cancer. J. Nucl. Med. 2018, 59, 999–1004. [Google Scholar] [CrossRef] [PubMed]
- O, J.H.; Lodge, M.A.; Wahl, R.L. Practical percist: A simplified guide to pet response criteria in solid tumors 1.0. Radiology 2016, 280, 576–584. [Google Scholar] [CrossRef]
- Weller, A.; Papoutsaki, M.V.; Waterton, J.C.; Chiti, A.; Stroobants, S.; Kuijer, J.; Blackledge, M.; Morgan, V.; deSouza, N.M. Diffusion-weighted (dw) mri in lung cancers: Adc test-retest repeatability. Eur. Radiol. 2017, 27, 4552–4562. [Google Scholar] [CrossRef]
- Tellmann, L.; Quick, H.H.; Bockisch, A.; Herzog, H.; Beyer, T. The effect of mr surface coils on pet quantification in whole-body pet/mr: Results from a pseudo-pet/mr phantom study. Med. Phys. 2011, 38, 2795–2805. [Google Scholar] [CrossRef] [PubMed]
- Paulus, D.H.; Braun, H.; Aklan, B.; Quick, H.H. Simultaneous pet/mr imaging: Mr-based attenuation correction of local radiofrequency surface coils. Med. Phys. 2012, 39, 4306–4315. [Google Scholar] [CrossRef]
- Eldib, M.; Bini, J.; Faul, D.D.; Oesingmann, N.; Tsoumpas, C.; Fayad, Z.A. Attenuation correction for magnetic resonance coils in combined pet/mr imaging: A review. Pet Clin. 2016, 11, 151–160. [Google Scholar] [CrossRef]
- Young, H.; Baum, R.; Cremerius, U.; Herholz, K.; Hoekstra, O.; Lammertsma, A.A.; Pruim, J.; Price, P. Measurement of clinical and subclinical tumour response using [18f]-fluorodeoxyglucose and positron emission tomography: Review and 1999 eortc recommendations. European organization for research and treatment of cancer (eortc) pet study group. Eur. J. Cancer 1999, 35, 1773–1782. [Google Scholar] [CrossRef]
- Wahl, R.L.; Jacene, H.; Kasamon, Y.; Lodge, M.A. From recist to percist: Evolving considerations for pet response criteria in solid tumors. J. Nucl. Med. 2009, 50 (Suppl. 1), 122S–150S. [Google Scholar] [CrossRef]
- Fledelius, J.; Khalil, A.; Hjorthaug, K.; Frokiaer, J. Inter-observer agreement improves with percist 1.0 as opposed to qualitative evaluation in non-small cell lung cancer patients evaluated with f-18-fdg pet/ct early in the course of chemo-radiotherapy. Ejnmmi Res. 2016, 6, 71. [Google Scholar] [CrossRef]
- Fledelius, J.; Khalil, A.A.; Hjorthaug, K.; Frokiaer, J. Using positron emission tomography (pet) response criteria in solid tumours (percist) 1.0 for evaluation of 2′-deoxy-2′-[18f] fluoro-d-glucose-pet/ct scans to predict survival early during treatment of locally advanced non-small cell lung cancer (nsclc). J. Med Imaging Radiat. Oncol. 2016, 60, 231–238. [Google Scholar] [CrossRef]
- Shang, J.; Ling, X.; Zhang, L.; Tang, Y.; Xiao, Z.; Cheng, Y.; Guo, B.; Gong, J.; Huang, L.; Xu, H. Comparison of recist, eortc criteria and percist for evaluation of early response to chemotherapy in patients with non-small-cell lung cancer. Eur. J. Nucl. Med. Mol. Imaging 2016, 43, 1945–1953. [Google Scholar] [CrossRef]
- Pinker, K.; Riedl, C.; Weber, W.A. Evaluating tumor response with fdg pet: Updates on percist, comparison with eortc criteria and clues to future developments. Eur. J. Nucl. Med. Mol. Imaging 2017, 44, 55–66. [Google Scholar] [CrossRef] [PubMed]
- Keller, S.H.; Holm, S.; Hansen, A.E.; Sattler, B.; Andersen, F.; Klausen, T.L.; Hojgaard, L.; Kjaer, A.; Beyer, T. Image artifacts from mr-based attenuation correction in clinical, whole-body pet/mri. Magma 2013, 26, 173–181. [Google Scholar] [CrossRef]
- Mayerhoefer, M.E.; Raderer, M.; Jaeger, U.; Staber, P.; Kiesewetter, B.; Senn, D.; Gallagher, F.A.; Brindle, K.; Porpaczy, E.; Weber, M.; et al. Ultra-early response assessment in lymphoma treatment: [(18)f]fdg pet/mr captures changes in glucose metabolism and cell density within the first 72 hours of treatment. Eur. J. Nucl. Med. Mol. Imaging 2018, 45, 931–940. [Google Scholar] [CrossRef] [PubMed]
- Freudenberg, L.S.; Rosenbaum, S.J.; Beyer, T.; Bockisch, A.; Antoch, G. Pet versus pet/ct dual-modality imaging in evaluation of lung cancer. Thoracic Surg. Clin. 2010, 20, 25–30. [Google Scholar] [CrossRef] [PubMed]
- Al-Nabhani, K.; Syed, R.; Haroon, A.; Almukhailed, O.; Bomanji, J. Flare response versus disease progression in patients with non-small cell lung cancer. J. Radiol. Case Rep. 2012, 6, 34–42. [Google Scholar] [PubMed]
- Guldbrandsen, K.F.; Hendel, H.W.; Langer, S.W.; Fischer, B.M. Nuclear molecular imaging strategies in immune checkpoint inhibitor therapy. Diagnostics 2017, 7, 23. [Google Scholar] [CrossRef]
- Cho, S.Y.; Lipson, E.J.; Im, H.J.; Rowe, S.P.; Gonzalez, E.M.; Blackford, A.; Chirindel, A.; Pardoll, D.M.; Topalian, S.L.; Wahl, R.L. Prediction of response to immune checkpoint inhibitor therapy using early-time-point 18f-fdg pet/ct imaging in patients with advanced melanoma. J. Nucl. Med. 2017, 58, 1421–1428. [Google Scholar] [CrossRef] [PubMed]
- Galban, C.J.; Hoff, B.A.; Chenevert, T.L.; Ross, B.D. Diffusion mri in early cancer therapeutic response assessment. Nmr Biomed. 2016. [Google Scholar] [CrossRef] [PubMed]
- Yu, J.; Li, W.; Zhang, Z.; Yu, T.; Li, D. Prediction of early response to chemotherapy in lung cancer by using diffusion-weighted mr imaging. Sci. World J. 2014, 2014, 135841. [Google Scholar] [CrossRef]
- Tsuchida, T.; Morikawa, M.; Demura, Y.; Umeda, Y.; Okazawa, H.; Kimura, H. Imaging the early response to chemotherapy in advanced lung cancer with diffusion-weighted magnetic resonance imaging compared to fluorine-18 fluorodeoxyglucose positron emission tomography and computed tomography. J. Magn. Reson. Imaging 2013, 38, 80–88. [Google Scholar] [CrossRef] [PubMed]
- Weiss, E.; Ford, J.C.; Olsen, K.M.; Karki, K.; Saraiya, S.; Groves, R.; Hugo, G.D. Apparent diffusion coefficient (adc) change on repeated diffusion-weighted magnetic resonance imaging during radiochemotherapy for non-small cell lung cancer: A pilot study. Lung Cancer 2016, 96, 113–119. [Google Scholar] [CrossRef]
- Nahmias, C.; Hanna, W.T.; Wahl, L.M.; Long, M.J.; Hubner, K.F.; Townsend, D.W. Time course of early response to chemotherapy in non-small cell lung cancer patients with 18f-fdg pet/ct. J. Nucl. Med. 2007, 48, 744–751. [Google Scholar] [CrossRef] [PubMed]

| Patient Data | N (%) |
|---|---|
| Sex (male/female) | 7 (64)/4 (36) |
| Mean age (range) | 62 years (52–73) |
| Histology (Adenocarcinoma/squamous cell carcinoma) | 7 (64)/4 (36) |
| Chemotherapy cycle (first/second) | 6 (54)/5 (46) |
| Response at CT evaluation (CR /PR /SD /PD) * | 0 (0)/1 (9)/5 (45)/5 (45) |
| Day | −3 | −2 | −1 | 0 | 1 | 2 | 3 | 4 | 5 | 6 | 7 | 8 | 9 | 10 | 11 | 12 | 13 | 14 | 15 | 16 | 17 | 18 | 19 | 20 | 21 |
|---|---|---|---|---|---|---|---|---|---|---|---|---|---|---|---|---|---|---|---|---|---|---|---|---|---|
| week | 1 | 2 | 3 | ||||||||||||||||||||||
| Car a | X | ||||||||||||||||||||||||
| Vin b | X | X | |||||||||||||||||||||||
| PET/MR | Scan 1 | Scan 2 | Scan 3 | Scan 4 | Scan 5 | ||||||||||||||||||||
| N (%) | 11 (100) | 10 (91) | 7 (64) | 10 (91) | 7 (64) | ||||||||||||||||||||
| Med c | −1 (−3 to 0) | 1 (1 to 3) | 6 (6 to 7) | 10 (8–11) | 19 (16–21) | ||||||||||||||||||||
| SUVmax Mean (SD) | All Patients n = 11 | 1. Cycle n = 6 | 2. Cycle n = 5 | PR a n = 1 | SD b n = 5 | PD c n = 5 |
| Scan 1 | 9.9 (3.6) | 10.6 (2.9) | 9.0 (4.6) | 15.2 | 9.8 (4.4) | 8.8 (2.2) |
| Scan 2 | 8.5 (1.9) | 9.8 (1.2) | 6.5 (0.9) | 10.6 | 7.6 (2.2) | 8.7 (1.8) |
| Scan 3 | 8.7 (2.1) | 10.4 (1.7) | 7.4 (1.4) | 10.9 | 9.1 (2.9) | 7.6 (0.9) |
| Scan 4 | 9.9 (3.4) | 10.8 (1.9) | 9.0 (3.4) | 10.3 | 10.9 (3.8) | 8.5 (3.2) |
| Scan 5 | 8.6 (2.8) | 9.0 (1.3) | 8.2 (4.5) | 8.3 | 9.9 (2.6) | 6.3 (3.0) |
| SULpeak Mean (SD) | All Patients n = 11 | 1. Cycle n = 6 | 2. Cycle n = 5 | PR n = 1 | SD n = 5 | PD n= 5 |
| Scan 1 | 5.8 (2.3) | 6.5 (2.4) | 5.1 (2.0) | 10.8 | 5.5 (1.9) | 5.1 (1.5) |
| Scan 2 | 5.0 (1.2) | 5.7 (1.0) | 4.1 (0.7) | 6.8 | 4.6 (1.3) | 5.0 (1.0) |
| Scan 3 | 5.3 (1.5) | 6.5 (1.4) | 4.4 (0.7) | 7.6 | 5.3 (1.7) | 4.5 (0.7) |
| Scan 4 | 5.8 (1.8) | 6.6 (1.3) | 5.0 (2.0) | 6.9 | 6.1 (1.9) | 5.1 (1.9) |
| Scan 5 | 5.0 (1.4) | 5.4 (0.5) | 4.5 (2.2) | 5.8 | 5.4 (1.2) | 3.8 (1.5) |
| Patient | Survival * | RECIST ^ | Early ADC † | Early SUV ‡ | Late ADC § | Late SUV ** |
|---|---|---|---|---|---|---|
| 5 | Alive | NC | ||||
| 4 | 15 | NC | ||||
| 1 | 12 | PR | ||||
| 10 | 20 | PD | ||||
| 2 | 10 | NC | ||||
| 7 | 8 | NC | ||||
| 11 | 6 | NC | ||||
| 8 | 3 | PD | ||||
| 9 | 3 | PD | NA | NA | ||
| 6 | 2 | PD | ||||
| 3 | 1 | PD |
| ADCmedian †† Median (Q1; Q3) | All Patients n = 11 | 1. Cycle n = 6 | 2. Cycle n = 5 |
| Scan 1 | 1153 (1081; 1207) | 1190 (1038; 1348) | 1122 (1029; 1454) |
| Scan 2 | 1201 (964; 1439) | 1216 (1048; 1547) | 1058 (906; 1339) |
| Scan 3 | 1312 (1133; 1401) | 1312 (1231; na **) | 1267 (954; 1640) |
| Scan 4 | 1315 (987; 1483) | 1350 (1126; 1535) | 1119 (933; 1486) |
| Scan 5 | 1273 (1134; 1553) | 1230 (1147; 1647) | 1421 (934; na) |
| ADCmedian Median (Q1; Q3) | PR n = 1 | SD n = 5 | PD n = 5 |
| Scan 1 | 1093 | 1153 (1029; 1196) | 1194 (998; 1762) |
| Scan 2 | - * | 1117 (906; 1212) | 1425 (989; 1547) |
| Scan 3 | 1231 | 1312 (894; na) | 1390 (1133; na) |
| Scan 4 | 1431 | 1313 (991; 1334) | 1321 (954; 1650) |
| Scan 5 | 1134 | 1230 (997; 1385) | 1662 (1553; na) |
© 2019 by the authors. Licensee MDPI, Basel, Switzerland. This article is an open access article distributed under the terms and conditions of the Creative Commons Attribution (CC BY) license (http://creativecommons.org/licenses/by/4.0/).
Share and Cite
Langer, N.H.; Langer, S.W.; Johannesen, H.H.; Hansen, A.E.; Costa, J.; Klausen, T.L.; Forman, J.; Olin, A.; Rasmussen, S.H.; Sørensen, J.B.; et al. Very Early Response Evaluation by PET/MR in Patients with Lung Cancer—Timing and Feasibility. Diagnostics 2019, 9, 35. https://doi.org/10.3390/diagnostics9010035
Langer NH, Langer SW, Johannesen HH, Hansen AE, Costa J, Klausen TL, Forman J, Olin A, Rasmussen SH, Sørensen JB, et al. Very Early Response Evaluation by PET/MR in Patients with Lung Cancer—Timing and Feasibility. Diagnostics. 2019; 9(1):35. https://doi.org/10.3390/diagnostics9010035
Chicago/Turabian StyleLanger, Natasha Hemicke, Seppo W. Langer, Helle Hjorth Johannesen, Adam Espe Hansen, Junia Costa, Thomas Levin Klausen, Julie Forman, Anders Olin, Sine Hvid Rasmussen, Jens Benn Sørensen, and et al. 2019. "Very Early Response Evaluation by PET/MR in Patients with Lung Cancer—Timing and Feasibility" Diagnostics 9, no. 1: 35. https://doi.org/10.3390/diagnostics9010035
APA StyleLanger, N. H., Langer, S. W., Johannesen, H. H., Hansen, A. E., Costa, J., Klausen, T. L., Forman, J., Olin, A., Rasmussen, S. H., Sørensen, J. B., Löfgren, J., Kjær, A., & Fischer, B. M. (2019). Very Early Response Evaluation by PET/MR in Patients with Lung Cancer—Timing and Feasibility. Diagnostics, 9(1), 35. https://doi.org/10.3390/diagnostics9010035