Deep Learning–Based Choroidal Boundary Detection in Geographic Atrophy Using Spectral-Domain Optical Coherence Tomography

 , ,
, , 
Abstract
1. Introduction
2. Materials and Methods
2.1. Data and Imaging
2.2. Imaging Acquisition
2.3. Segmentation Model and Pipeline
2.4. Performance Evaluation and Classification Metrics
2.5. Workflow Efficiency Assessment
2.6. Statistical Analysis
3. Results
3.1. Choroidal Boundary Segmentation Performance and Failure Analysis
3.2. Failure Mode Characterization
3.3. Workflow Efficiency and Clinical Utility
4. Discussion
4.1. Limitations
4.2. Prospective Trajectories
5. Conclusions
Author Contributions
Funding
Institutional Review Board Statement
Informed Consent Statement
Data Availability Statement
Conflicts of Interest
Abbreviations
| GA | Geographic atrophy |
| SD-OCT | Spectral domain optical coherence tomography |
| CIB | Choroidal inner boundary |
| COB | Choroidal outer boundary |
| NMI | NetraMind Innovations |
| AI | Artificial Intelligence |
| AMD | Age related macular degeneration |
| RPE | Retinal pigment epithelium |
| CSI | Choroidoscleral interface |
| ICC | Intraclass coefficient |
| cRORA | complete RPE and outer retinal atrophy |
| CAM | Classification of Atrophy Meetings |
References
- Wong, W.L.; Su, X.; Li, X.; Cheung, C.M.G.; Klein, R.; Cheng, C.Y.; Wong, T.Y. Global prevalence of age-related macular degeneration and disease burden projection for 2020 and 2040: A systematic review and meta-analysis. Lancet Glob. Health 2014, 2, e106–e116. [Google Scholar] [CrossRef] [Scilit]
- Sadeghi, E.; Valsecchi, N.; Rahmanipour, E.; Ejlalidiz, M.; Hasan, N.; Vupparaboina, K.K.; Ibrahim, M.N.; Rasheed, M.A.; Baek, J.; Iannetta, D.; et al. Choroidal biomarkers in age-related macular degeneration. Surv. Ophthalmol. 2025, 70, 167–183. [Google Scholar] [CrossRef] [Scilit]
- Takahashi, A.; Ooto, S.; Yamashiro, K.; Tamura, H.; Oishi, A.; Miyata, M.; Hata, M.; Yoshikawa, M.; Yoshimura, N.; Tsujikawa, A. Pachychoroid Geographic Atrophy: Clinical and Genetic Characteristics. Ophthalmol. Retina 2018, 2, 295–305. [Google Scholar] [CrossRef] [Scilit] [PubMed]
- Sacconi, R.M.; Battista, M.; Borrelli, E.M.; Senni, C.; Tombolini, B.; Grosso, D.; Querques, L.; Bandello, F.M.; Querques, G. Choroidal vascularity index is associated with geographic atrophy progression. Retina 2022, 42, 381–387. [Google Scholar] [CrossRef] [Scilit] [PubMed]
- Querques, G.; Costanzo, E.; Miere, A.; Capuano, V.; Souied, E.H. Choroidal Caverns: A Novel Optical Coherence Tomography Finding in Geographic Atrophy. Investig. Ophthalmol. Vis. Sci. 2016, 57, 2578–2582. [Google Scholar] [CrossRef] [Scilit] [PubMed]
- Arora, S.; Singh, S.R.; Rosario, B.; Ibrahim, M.N.; Selvam, A.; Zarnegar, A.; Harihar, S.; Sant, V.; Sahel, J.A.; Vupparaboina, K.K.; et al. Three-dimensional choroidal contour mapping in healthy population. Sci. Rep. 2024, 14, 6210. [Google Scholar] [CrossRef] [Scilit]
- Valsecchi, N.; Sadeghi, E.; Davis, E.; Ibrahim, M.N.; Hasan, N.; Bollepalli, S.C.; Singh, S.R.; Fontana, L.; Sahel, J.A.; Vupparaboina, K.K.; et al. Assessment of choroidal vessels in healthy eyes using 3-dimensional vascular maps and a semi-automated deep learning approach. Sci. Rep. 2025, 15, 714. [Google Scholar] [CrossRef] [Scilit]
- Al-Khersan, H.; Sodhi, S.K.; Cao, J.A.; Saju, S.M.; Pattathil, N.; Zhou, A.W.; Choudhry, N.; Russakoff, D.B.; Oakley, J.D.; Boyer, D.; et al. Deep Learning-Based Segmentation of Geographic Atrophy: A Multi-Center, Multi-Device Validation in a Real-World Clinical Cohort. Diagnostics 2025, 15, 2580. [Google Scholar] [CrossRef] [Scilit]
- Zhang, G.; Fu, D.J.; Liefers, B.; Faes, L.; Glinton, S.; Wagner, S.; Struyven, R.; Pontikos, N.; A Keane, P.; Balaskas, K. Clinically relevant deep learning for detection and quantification of geographic atrophy from optical coherence tomography: A model development and external validation study. Lancet Digit. Health 2021, 3, e665–e675. [Google Scholar] [CrossRef] [Scilit]
- Mazzaferri, J.; Beaton, L.; Hounye, G.; Sayah, D.N.; Costantino, S. Open-source algorithm for automatic choroid segmentation of OCT volume reconstructions. Sci. Rep. 2017, 7, 42112. [Google Scholar] [CrossRef] [Scilit]
- Niu, S.; de Sisternes, L.; Chen, Q.; Leng, T.; Rubin, D.L. Automated geographic atrophy segmentation for SD-OCT images using region-based CV model via local similarity factor. Biomed. Opt. Express 2016, 7, 581–600. [Google Scholar] [CrossRef] [Scilit]
- Fleckenstein, M.; Mitchell, P.; Freund, K.B.; Sadda, S.; Holz, F.G.; Brittain, C.; Henry, E.C.; Ferrara, D. The Progression of Geographic Atrophy Secondary to Age-Related Macular Degeneration. Ophthalmology 2018, 125, 369–390. [Google Scholar] [CrossRef] [Scilit]
- Derradji, Y.; Mosinska, A.; Apostolopoulos, S.; Ciller, C.; De Zanet, S.; Mantel, I. Fully-automated atrophy segmentation in dry age-related macular degeneration in optical coherence tomography. Sci. Rep. 2021, 11, 21893. [Google Scholar] [CrossRef] [Scilit]
- Klein, R.; Meuer, S.M.; Knudtson, M.D.; Klein, B.E. The epidemiology of progression of pure geographic atrophy: The Beaver Dam Eye Study. Am. J. Ophthalmol. 2008, 146, 692–699. [Google Scholar] [CrossRef] [Scilit]
- Ibrahim, M.N.; Bollepalli, S.C.; Selvam, A.; Sant, V.; Harihar, S.; Sahel, J.A.; Chhablani, J.; Vupparaboina, K.K. Accurate Detection of 3D Choroidal Vasculature Using Swept-Source OCT Volumetric Scans Based on Phansalkar Thresholding. In Proceedings of the 2023 IEEE EMBS International Conference on Biomedical and Health Informatics (BHI), Pittsburgh, PA, USA, 15–18 October 2023; pp. 1–4. [Google Scholar]
- Cao, G.; Wu, Y.; Peng, Z.; Zhou, Z.; Dai, C. Self-attention CNN for retinal layer segmentation in OCT. Biomed. Opt. Express 2024, 15, 1605–1617. [Google Scholar] [CrossRef] [Scilit] [PubMed]
- Sadda, S.R.; Chakravarthy, U.; Birch, D.G.; Staurenghi, G.; Henry, E.C.; Brittain, C. Clinical endpoints for the study of geographic atrophy secondary to age-related macular degeneration. Retina 2016, 36, 1806–1822. [Google Scholar] [CrossRef] [Scilit] [PubMed]
- Vallino, V.; Berni, A.; Coletto, A.; Serafino, S.; Bandello, F.; Reibaldi, M.; Borrelli, E. Structural OCT and OCT angiography biomarkers associated with the development and progression of geographic atrophy in AMD. Graefe’s Arch. Clin. Exp. Ophthalmol. 2024, 262, 3421–3436. [Google Scholar] [CrossRef] [Scilit]
- Enzendorfer, M.L.; Tratnig-Frankl, M.; Eidenberger, A.; Schrittwieser, J.; Kuchernig, L.; Schmidt-Erfurth, U. Rethinking Clinical Trials in Age-Related Macular Degeneration: How AI-Based OCT Analysis Can Support Successful Outcomes. Pharmaceuticals 2025, 18, 284. [Google Scholar] [CrossRef] [Scilit] [PubMed]
- Fu, D.J.; Glinton, S.; Lipkova, V.; Faes, L.; Liefers, B.; Zhang, G.; Pontikos, N.; McKeown, A.; Scheibler, L.; Patel, P.J.; et al. Deep-learning automated quantification of longitudinal OCT scans demonstrates reduced RPE loss rate, preservation of intact macular area and predictive value of isolated photoreceptor degeneration in geographic atrophy patients receiving C3 inhibition treatment. Br. J. Ophthalmol. 2024, 108, 536–545. [Google Scholar] [PubMed]
- Rahmanipour, E.; Afazel, S.; Ashrafi, S.; Sadeghi, E.; Ghorbani, M.; Zarranz-Ventura, J.; Chhablani, J. Artificial intelligence in ophthalmology clinical trials: A narrative review. Graefe’s Arch. Clin. Exp. Ophthalmol. 2025, 264, 1–17. [Google Scholar] [CrossRef] [Scilit]
- Guymer, R.H.; Rosenfeld, P.J.; Curcio, C.A.; Holz, F.G.; Staurenghi, G.; Freund, K.B.; Schmitz-Valckenberg, S.; Sparrow, J.; Spaide, R.F.; Tufail, A.; et al. Incomplete Retinal Pigment Epithelial and Outer Retinal Atrophy in Age-Related Macular Degeneration: Classification of Atrophy Meeting Report 4. Ophthalmology 2020, 127, 394–409. [Google Scholar] [CrossRef] [Scilit]
- He, K.; Zhang, X.; Ren, S.; Sun, J. Deep residual learning for image recognition. In Proceedings of the IEEE Conference on Computer Vision and Pattern Recognition, Las Vegas, NV, USA, 27–30 June 2016; pp. 770–778. [Google Scholar]
- Sahoo, J.; Saini, S.K.; Singh, S.; Saxena, A.K.; Sharma, S.; Awasthi, A.; Rajalakshmi, R. Residual learning for segmentation of the medical images in healthcare. Meas. Sens. 2024, 32, 100998. [Google Scholar] [CrossRef] [Scilit]
- Soni, T.; Gupta, S.; Almogren, A.; Altameem, A.; Rehman, A.U.; Hussen, S.; Bharany, S. ARCUNet: Enhancing skin lesion segmentation with residual convolutions and attention mechanisms for improved accuracy and robustness. Sci. Rep. 2025, 15, 9262. [Google Scholar] [CrossRef] [Scilit] [PubMed]
- Xie, Y.; Yang, B.; Guan, Q.; Zhang, J.; Wu, Q.; Xia, Y. Attention mechanisms in medical image segmentation: A survey. arXiv 2023, arXiv:2305.17937. [Google Scholar] [CrossRef] [Scilit]



| Choroidal inner boundary | ||
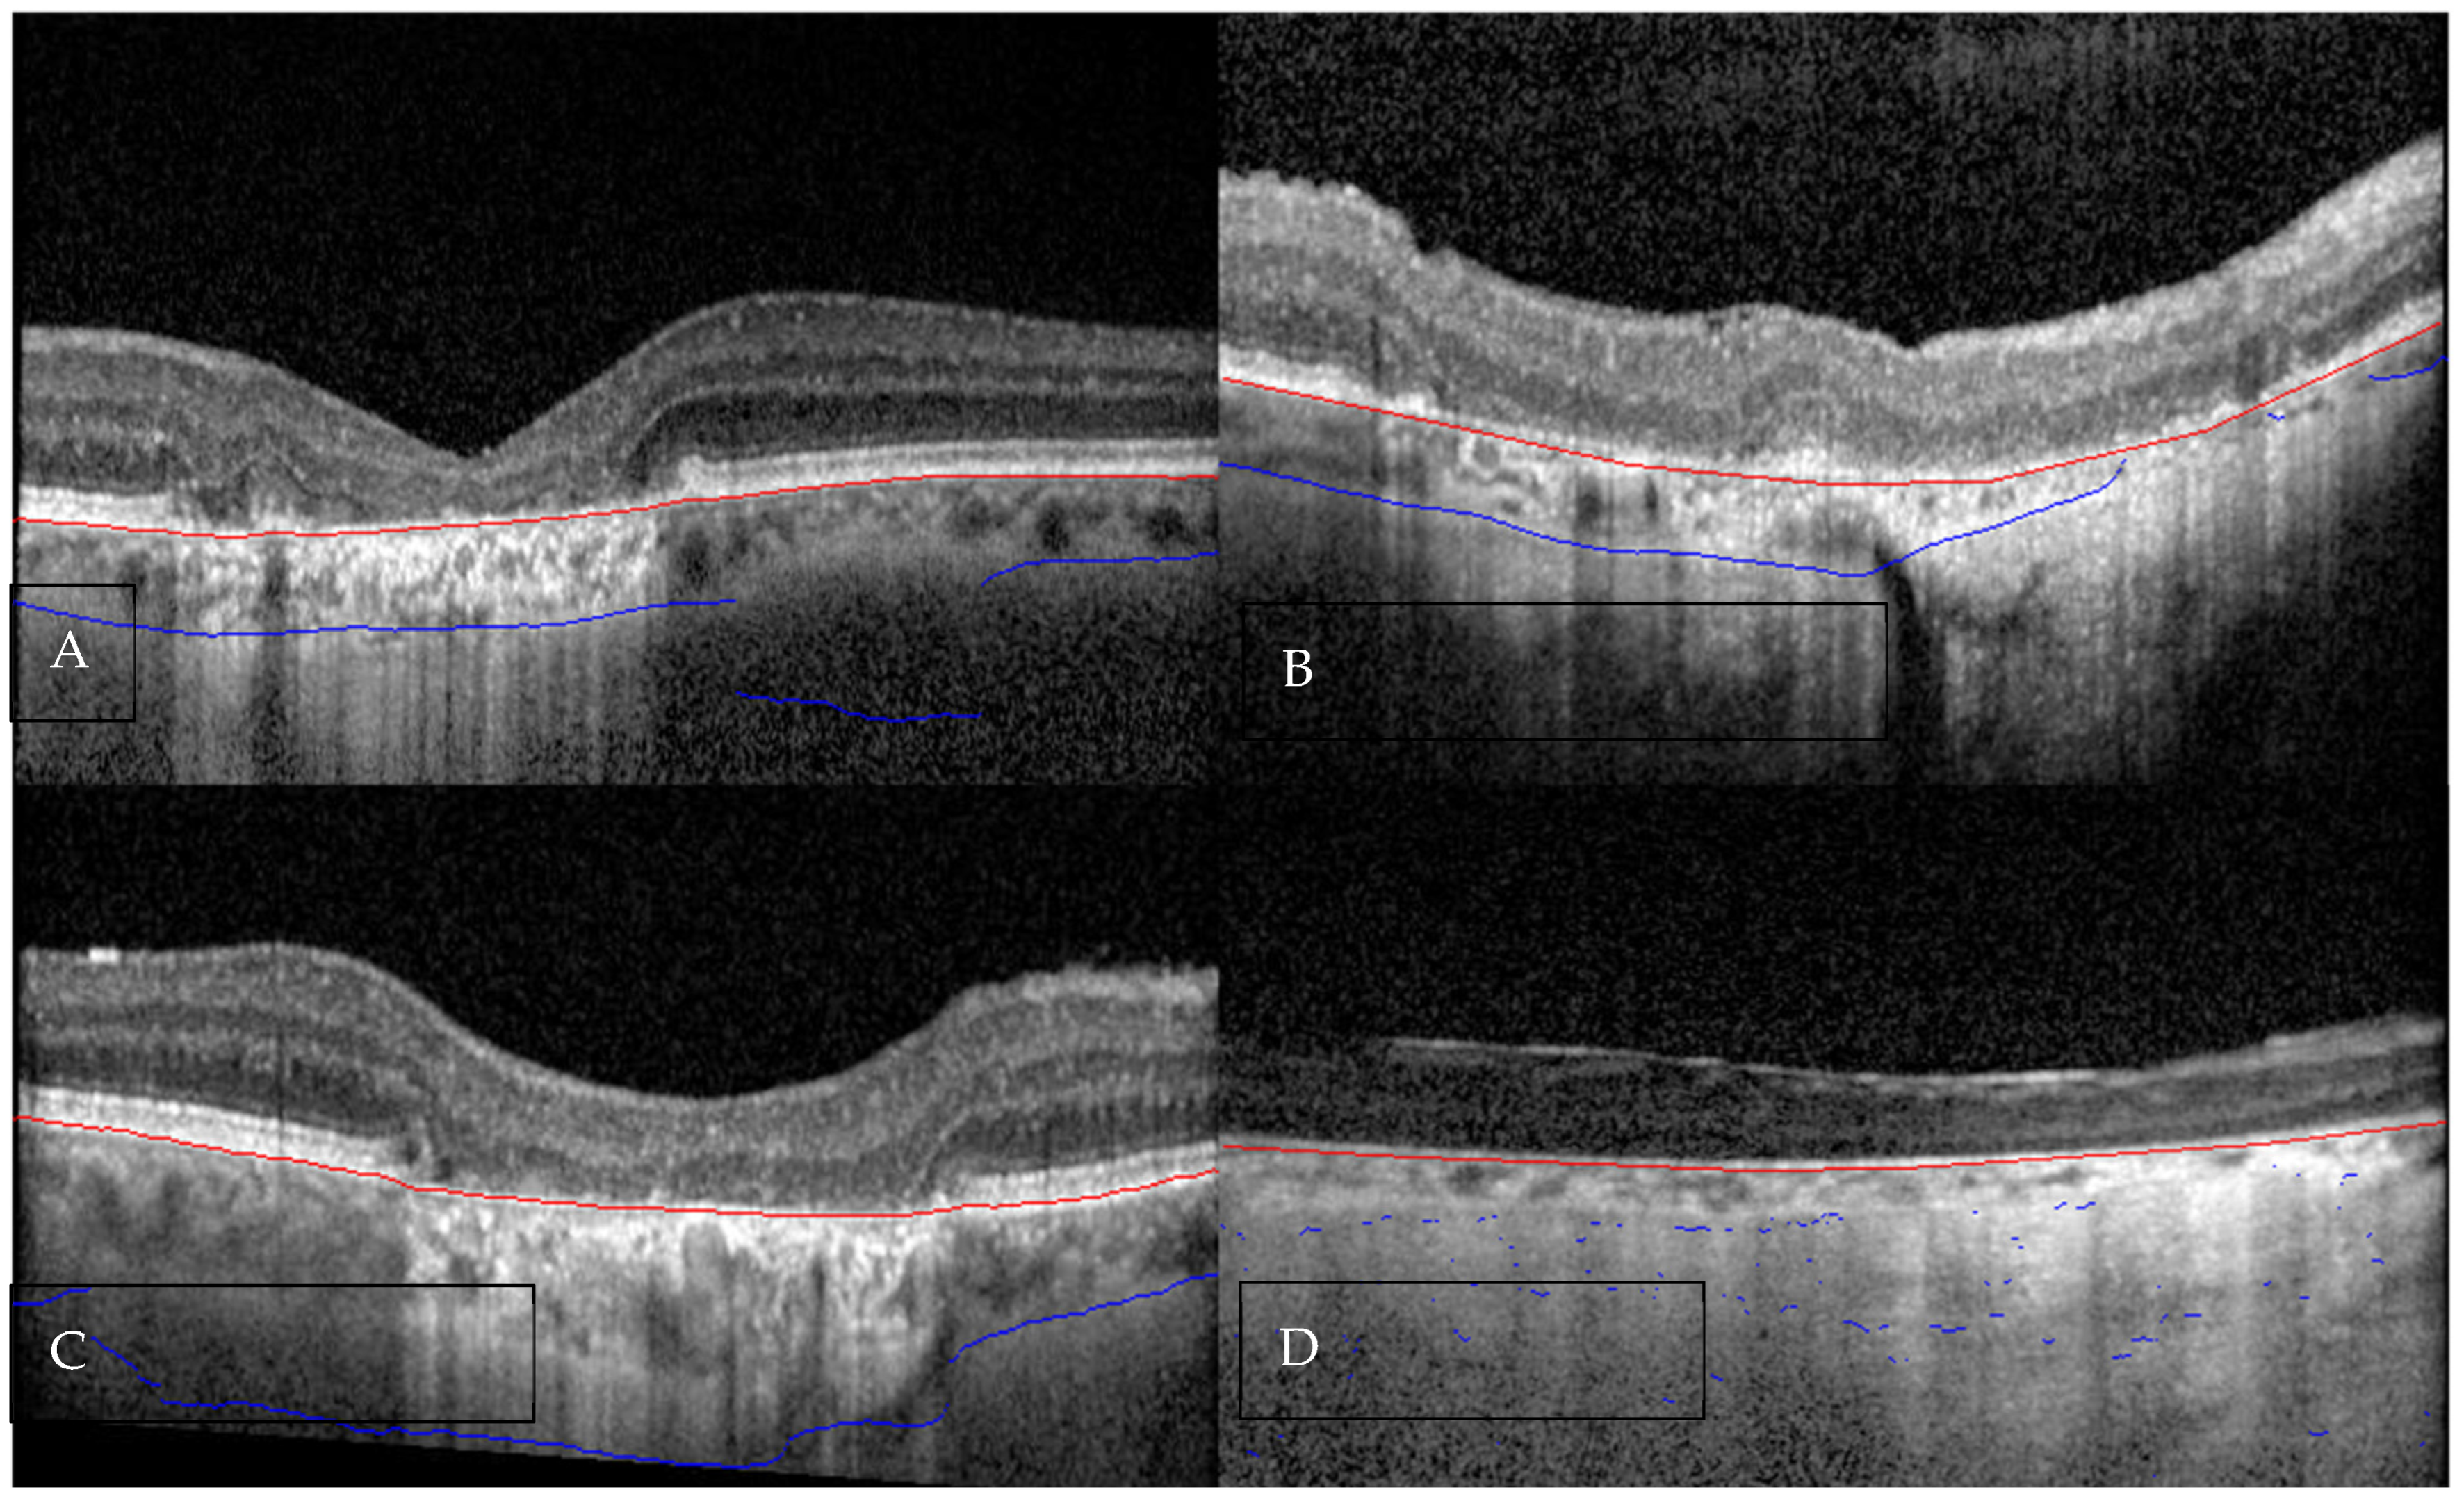
| Low image quality/signal loss | ~45% | Degraded scan contrast, media opacities, or defocus led to blurred definition of the RPE–choroid interface. |
| Sudden change in RPE curvature | ~30% | Abrupt topographic variations in the RPE, particularly in parafoveal regions or near drusen, caused local mis-registration of the CIB line. |
| Fixation change/motion artifact | ~20% | Horizontal eye movement between adjacent B-scans slightly displaced the inner choroidal contour, particularly near the disk margin. |
| Combined effects (e.g., curvature + signal drop-off) | ~5% | Compounded quality issues or irregular RPE slopes caused limited regional deviations. |
| Choroidal outer boundary | ||
| Signal washout/Hyper-transmission | ~40% | Hyper-transmission artifacts beneath the atrophic RPE caused the choroidal–scleral interface to fade or become indistinguishable from the sclera. |
| Fixation change/motion artifact | ~25% | Minor eye movement between scans distorted local curvature of the choroid–sclera interface. |
| Presence of large posterior ciliary vessels | ~20% | These vessels create local discontinuities or high-contrast streaks that confuse the model’s estimate of the scleral border. |
| Combined low quality + motion | ~15% | Concurrent factors caused larger regional deviations (>66%). |
| Study (Year) | Target Population | Segmentation Target | Imaging Modality | Methodology | Key Findings and Relevance to Our Study |
|---|---|---|---|---|---|
| Current study (2026) | GA | COB, CIB | SD-OCT | ResUNet + Mandatory Human Verification | CIB Accuracy: 94.8%; Strict COB Accuracy: 81.0% (Lenient: 94.2%). Demonstrates that GA-specific hyper-transmission inherently limits autonomous COB detection |
| Valsecchi et al. (2025) [7] | Healthy Eyes | Choroidal Vessels | SD-OCT | Semi-automated Deep Learning | Achieved robust vascular mapping in normal eyes; however, lacks validation under GA conditions where deep-signal washout obscures boundaries. |
| Arora et al. (2024) [6] | Healthy Eyes | Choroidal Contour | SD-OCT | Automated 3D Mapping | Provided precise 3D choroidal contours in healthy cohorts does not account for GA-specific RPE loss and signal attenuation. |
| Cao et al. (2024) [16] | Various Pathologies | Retinal Layers | SD-OCT | Self-attention CNN | High accuracy in superficial retinal layers but did not address the deeper choroidoscleral interface (COB) which degrades in advanced atrophy. |
| Vupparaboina et al. (2023) [15] | General/Healthy | Choroidal Vasculature | SS-OCT | Phansalkar Thresholding | Utilized SS-OCT for deeper tissue penetration, highlighting the physical limits of SD-OCT (used in our study) for deep choroidal features in pathology. |
Disclaimer/Publisher’s Note: The statements, opinions and data contained in all publications are solely those of the individual author(s) and contributor(s) and not of MDPI and/or the editor(s). MDPI and/or the editor(s) disclaim responsibility for any injury to people or property resulting from any ideas, methods, instructions or products referred to in the content. |
© 2026 by the authors. Licensee MDPI, Basel, Switzerland. This article is an open access article distributed under the terms and conditions of the Creative Commons Attribution (CC BY) license.
Share and Cite
Rahmanipour, E.; Hasan, N.; Gadari, A.; Whitley, J.; Sharma, S.; Lall, S.; Santos, C.d.l.; Sadeghi, E.; Bollepalli, S.C.; Vupparaboina, K.K.; et al. Deep Learning–Based Choroidal Boundary Detection in Geographic Atrophy Using Spectral-Domain Optical Coherence Tomography. Diagnostics 2026, 16, 737. https://doi.org/10.3390/diagnostics16050737
Rahmanipour E, Hasan N, Gadari A, Whitley J, Sharma S, Lall S, Santos Cdl, Sadeghi E, Bollepalli SC, Vupparaboina KK, et al. Deep Learning–Based Choroidal Boundary Detection in Geographic Atrophy Using Spectral-Domain Optical Coherence Tomography. Diagnostics. 2026; 16(5):737. https://doi.org/10.3390/diagnostics16050737
Chicago/Turabian StyleRahmanipour, Elham, Nasiq Hasan, Adarsh Gadari, James Whitley, Soumya Sharma, Shreyaa Lall, Cristian de los Santos, Elham Sadeghi, Sandeep Chandra Bollepalli, Kiran Kumar Vupparaboina, and et al. 2026. "Deep Learning–Based Choroidal Boundary Detection in Geographic Atrophy Using Spectral-Domain Optical Coherence Tomography" Diagnostics 16, no. 5: 737. https://doi.org/10.3390/diagnostics16050737
APA StyleRahmanipour, E., Hasan, N., Gadari, A., Whitley, J., Sharma, S., Lall, S., Santos, C. d. l., Sadeghi, E., Bollepalli, S. C., Vupparaboina, K. K., Savaria, M. J., & Chhablani, J. (2026). Deep Learning–Based Choroidal Boundary Detection in Geographic Atrophy Using Spectral-Domain Optical Coherence Tomography. Diagnostics, 16(5), 737. https://doi.org/10.3390/diagnostics16050737