
Biventricular Tissue Tracking with Cardiovascular Magnetic Resonance: Reference Values of Left- and Right-Ventricular Strain

 , , , , ,
  ,
,  , ,
, ,  ,
,  and
and 
Abstract
:1. Introduction
2. Materials and Methods
2.1. Subjects’ Recruitment
2.2. CMR Protocol
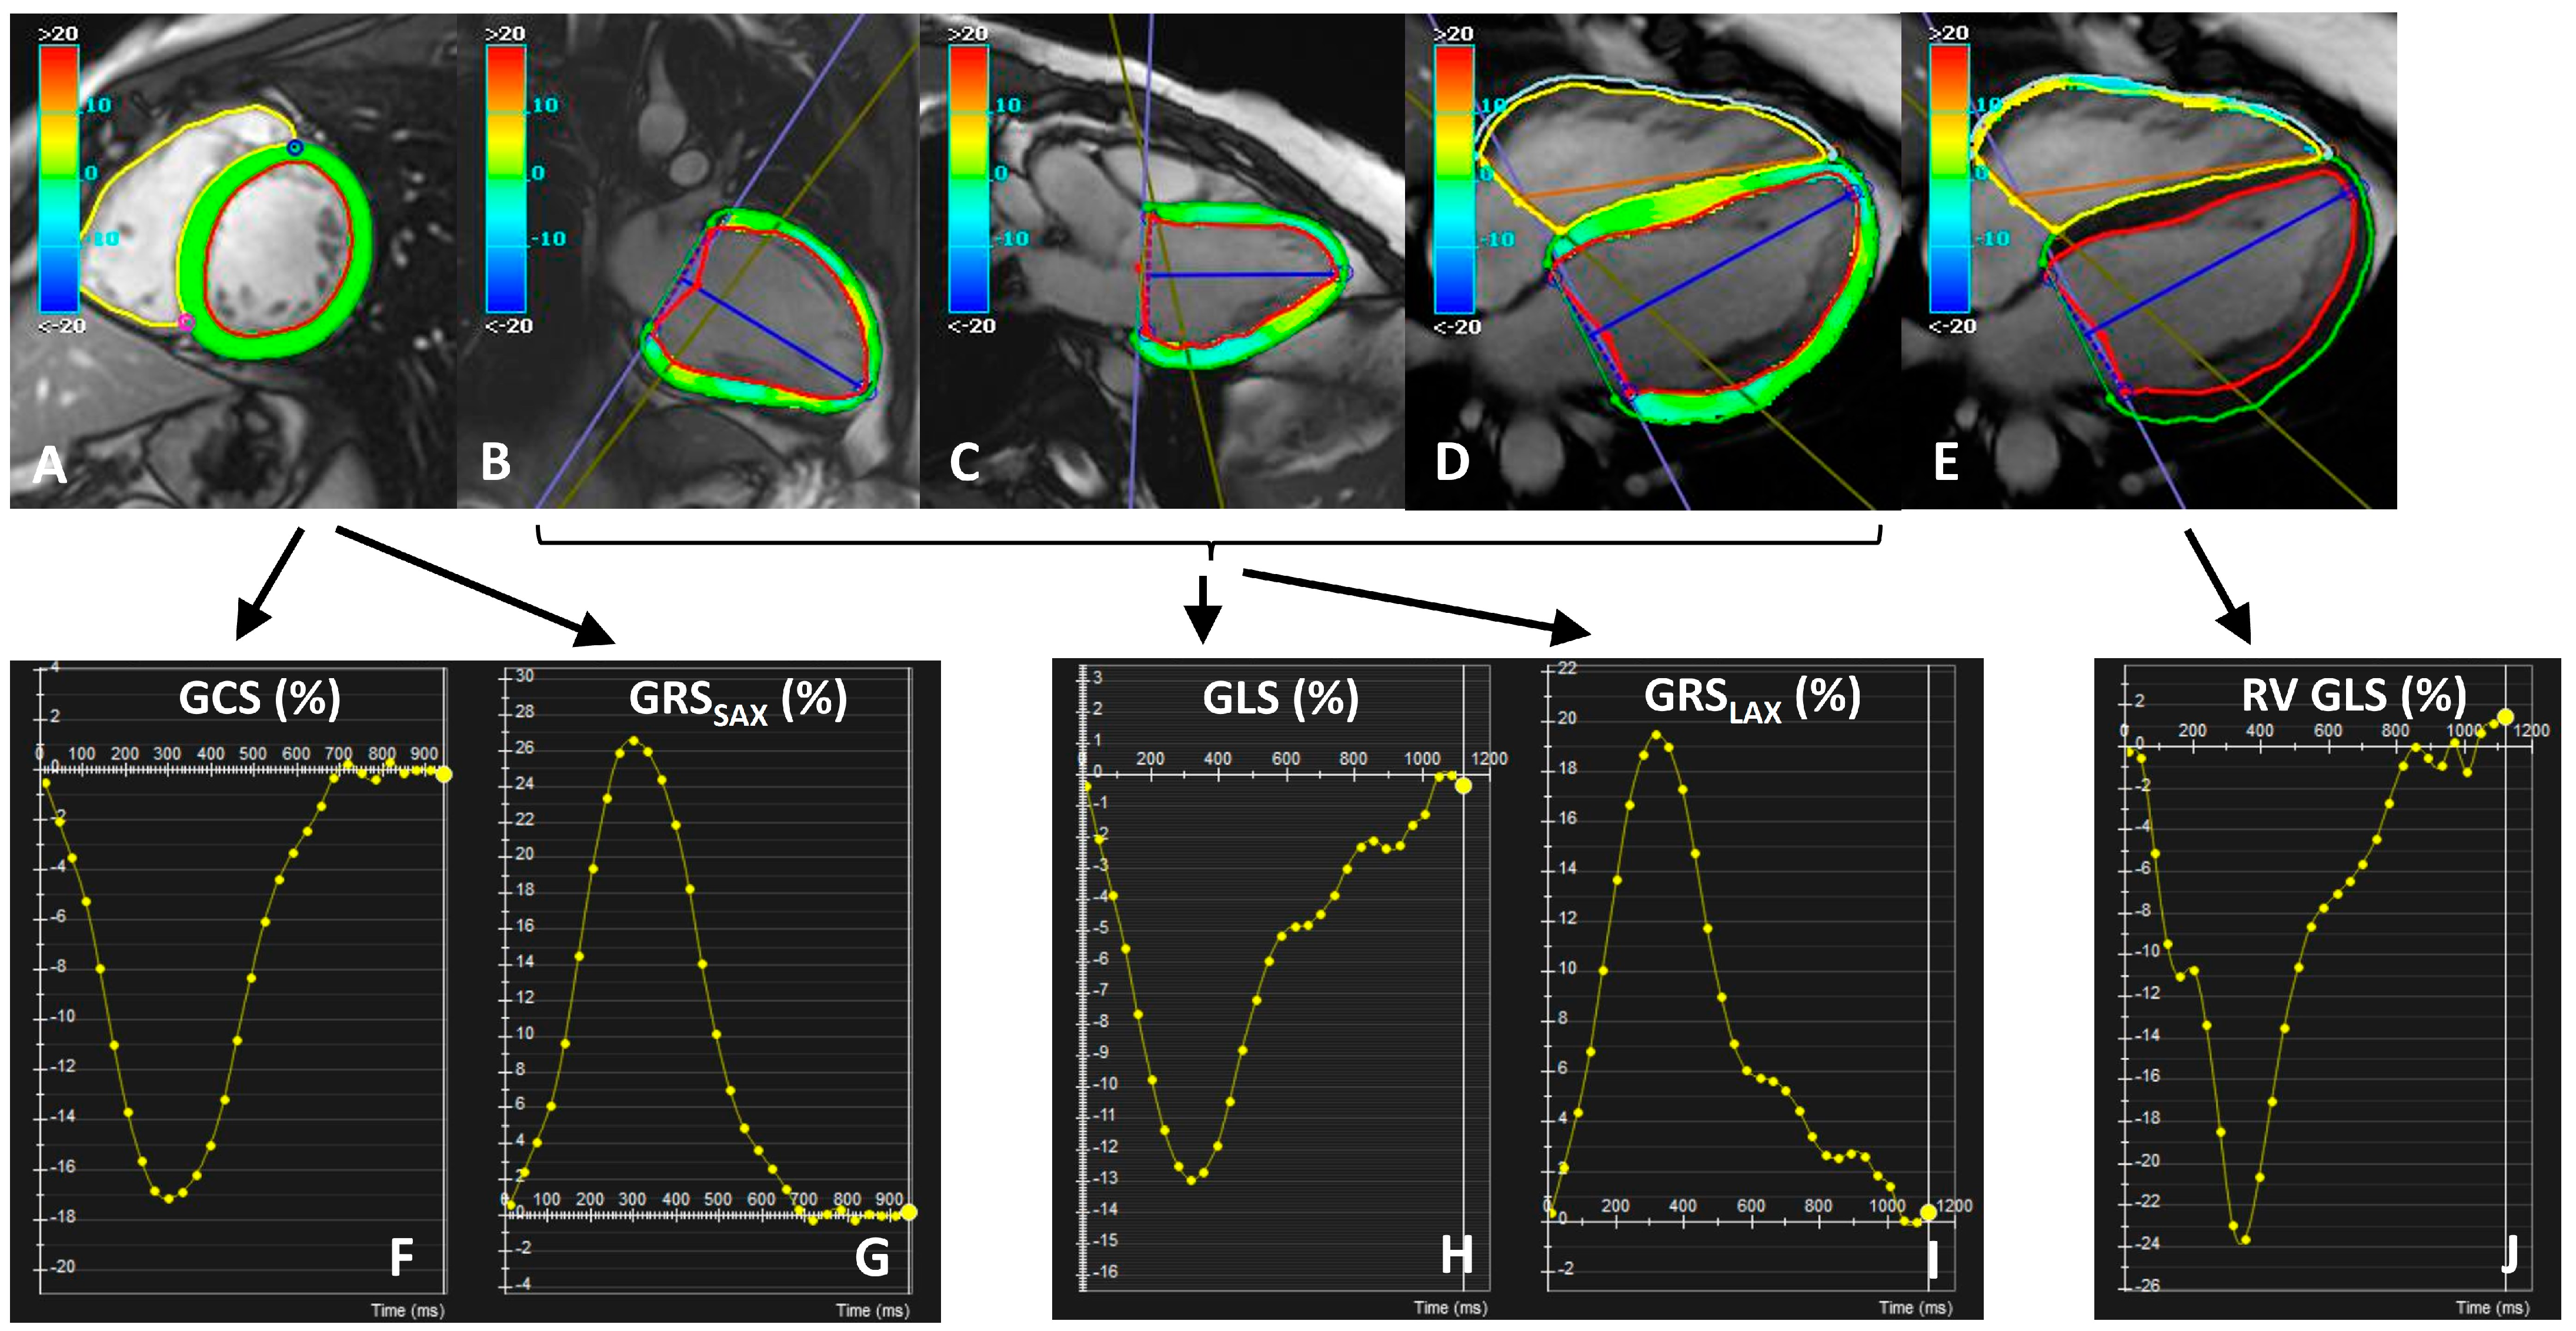
2.3. Image Analysis
2.4. Statistical Analysis
2.5. Reproducibility Analysis
3. Results
3.1. Study Population
3.2. Physiological Correlates of Global Strain Measures
3.3. Correlation between Strain and Other Measures of Systolic Function
3.4. Reproducibility Results
3.5. Reference Ranges for Global Strain Values
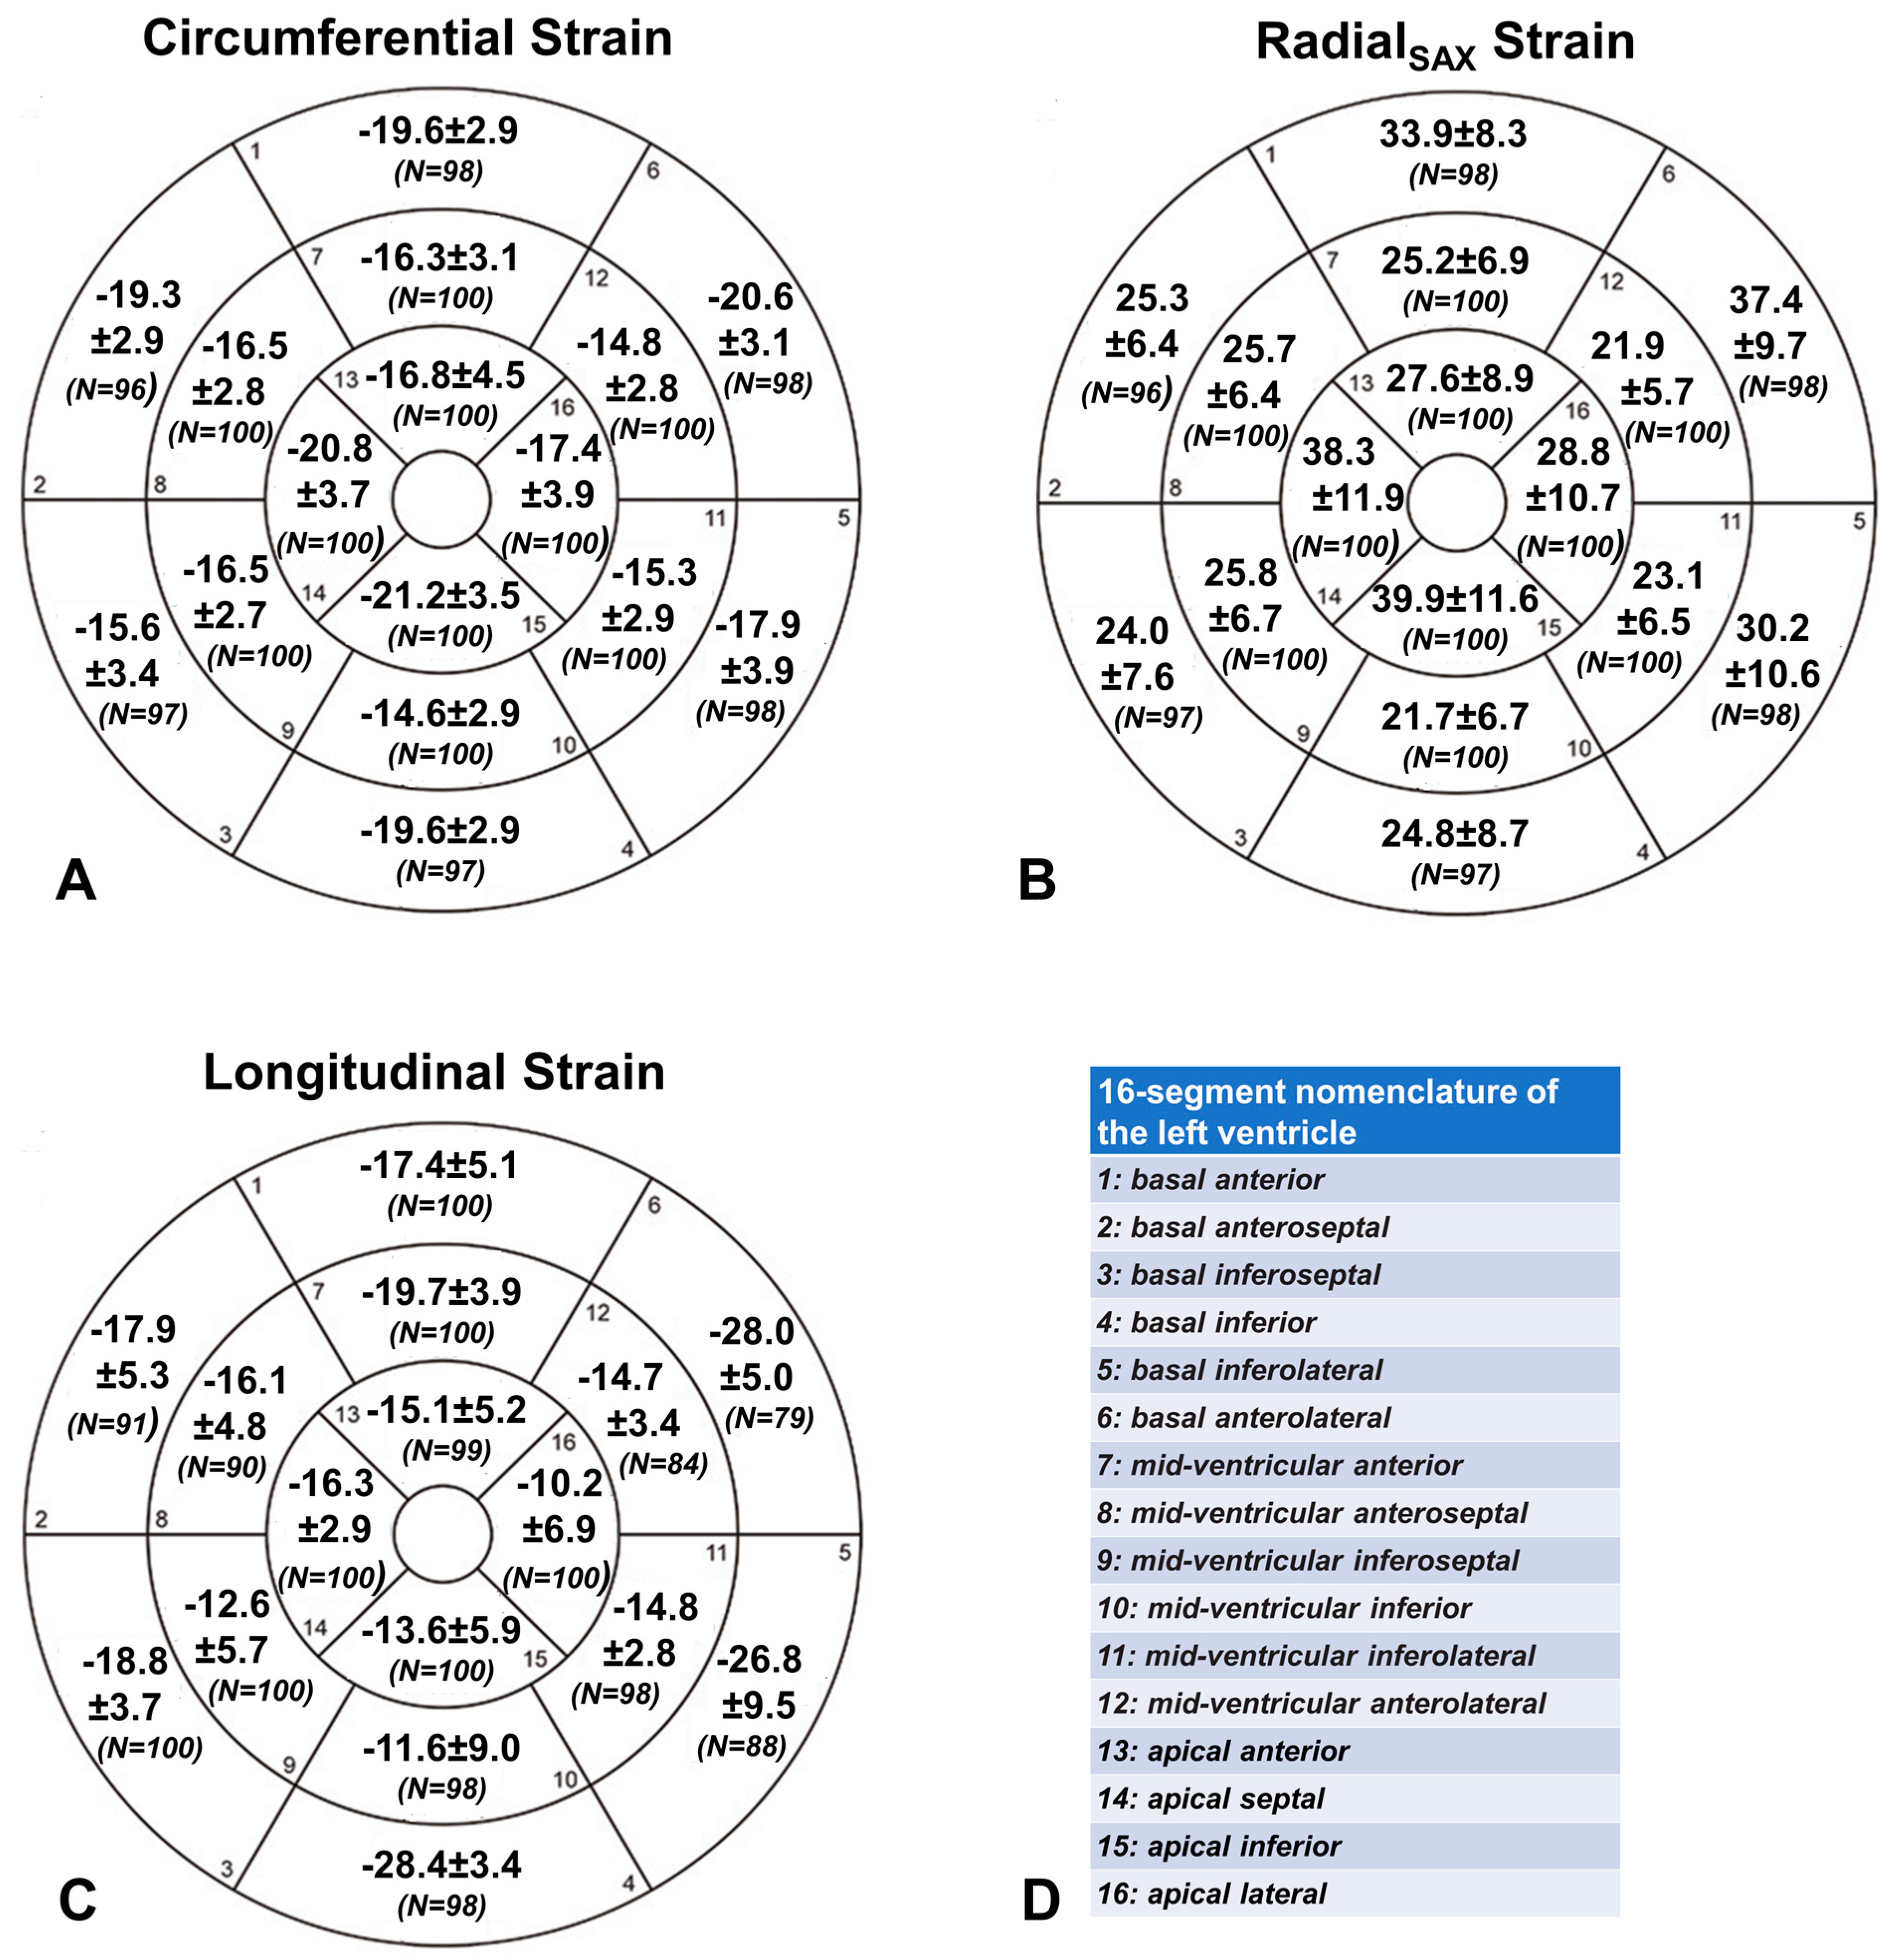
3.6. Segmental Strain Values
4. Discussion
Limitations
5. Conclusions
Author Contributions
Funding
Institutional Review Board Statement
Informed Consent Statement
Data Availability Statement
Acknowledgments
Conflicts of Interest
References
- Scatteia, A.; Baritussio, A.; Bucciarelli-Ducci, C. Strain imaging using cardiac magnetic resonance. Heart Fail. Rev. 2017, 22, 465–476. [Google Scholar] [CrossRef]
- Brady, B.; King, G.; Murphy, R.T.; Walsh, D. Myocardial strain: A clinical review. Ir. J. Med. Sci. (1971-) 2022, 192, 1649–1656. [Google Scholar] [CrossRef]
- Merlo, M.; Gagno, G.; Baritussio, A.; Bauce, B.; Biagini, E.; Canepa, M.; Cipriani, A.; Castelletti, S.; Dellegrottaglie, S.; Guaricci, A.I.; et al. Clinical application of CMR in cardiomyopathies: Evolving concepts and techniques: A position paper of myocardial and pericardial diseases and cardiac magnetic resonance working groups of Italian society of cardiology. Heart Fail. Rev. 2023, 28, 77–95. [Google Scholar] [CrossRef]
- Zlibut, A.; Cojocaru, C.; Onciul, S.; Agoston-Coldea, L. Cardiac Magnetic Resonance Imaging in Appraising Myocardial Strain and Biomechanics: A Current Overview. Diagnostics 2023, 13, 553. [Google Scholar] [CrossRef]
- Hor, K.N.; Gottliebson, W.M.; Carson, C.; Wash, E.; Cnota, J.; Fleck, R.; Wansapura, J.; Klimeczek, P.; Al-Khalidi, H.R.; Chung, E.S.; et al. Comparison of Magnetic Resonance Feature Tracking for Strain Calculation With Harmonic Phase Imaging Analysis. JACC Cardiovasc. Imaging 2010, 3, 144–151. [Google Scholar] [CrossRef]
- Amzulescu, M.S.; De Craene, M.; Langet, H.; Pasquet, A.; Vancraeynest, D.; Pouleur, A.C.; Vanoverschelde, J.L.; Gerber, B.L. Myocardial strain imaging: Review of general principles, validation, and sources of discrepancies. Eur. Heart J. Cardiovasc. Imaging 2019, 20, 605–619. [Google Scholar] [CrossRef] [PubMed]
- Pryds, K.; Larsen, A.H.; Hansen, M.S.; Grøndal, A.Y.K.; Tougaard, R.S.; Hansson, N.H.; Clemmensen, T.S.; Løgstrup, B.B.; Wiggers, H.; Kim, W.Y.; et al. Myocardial strain assessed by feature tracking cardiac magnetic resonance in patients with a variety of cardiovascular diseases—A comparison with echocardiography. Sci. Rep. 2019, 9, 11296. [Google Scholar] [CrossRef] [PubMed]
- Cerqueira, M.D.; Weissman, N.J.; Dilsizian, V.; Jacobs, A.K.; Kaul, S.; Laskey, W.K.; Pennell, D.J.; Rumberger, J.A.; Ryan, T.; Verani, M.S. Standardized myocardial segmentation and nomenclature for tomographic imaging of the heart: A statement for healthcare professionals from the Cardiac Imaging Committee of the Council on Clinical Cardiology of the American Heart Association. Circulation 2002, 105, 539–542. [Google Scholar] [PubMed]
- Meloni, A.; Righi, R.; Missere, M.; Renne, S.; Schicchi, N.; Gamberini, M.R.; Cuccia, L.; Lisi, R.; Spasiano, A.; Roberti, M.G.; et al. Biventricular Reference Values by Body Surface Area, Age, and Gender in a Large Cohort of Well-Treated Thalassemia Major Patients Without Heart Damage Using a Multiparametric CMR Approach. J. Magn. Reson. Imaging 2021, 53, 61–70. [Google Scholar] [CrossRef] [PubMed]
- Wang, Y.; Moss, J.; Thisted, R. Predictors of body surface area. J. Clin. Anesth. 1992, 4, 4–10. [Google Scholar] [CrossRef] [PubMed]
- Taylor, R.J.; Moody, W.E.; Umar, F.; Edwards, N.C.; Taylor, T.J.; Stegemann, B.; Townend, J.N.; Hor, K.N.; Steeds, R.P.; Mazur, W.; et al. Myocardial strain measurement with feature-tracking cardiovascular magnetic resonance: Normal values. Eur. Heart J. Cardiovasc. Imaging 2015, 16, 871–881. [Google Scholar] [CrossRef] [PubMed]
- Weise Valdés, E.; Barth, P.; Piran, M.; Laser, K.T.; Burchert, W.; Körperich, H. Left-Ventricular Reference Myocardial Strain Assessed by Cardiovascular Magnetic Resonance Feature Tracking and fSENC—Impact of Temporal Resolution and Cardiac Muscle Mass. Front. Cardiovasc. Med. 2021, 8, 764496. [Google Scholar] [CrossRef] [PubMed]
- Li, G.; Zhang, Z.; Gao, Y.; Zhu, C.; Zhou, S.; Cao, L.; Zhao, Z.; Zhao, J.; Ordovas, K.; Lou, M.; et al. Age- and sex-specific reference values of biventricular strain and strain rate derived from a large cohort of healthy Chinese adults: A cardiovascular magnetic resonance feature tracking study. J. Cardiovasc. Magn. Reson. 2022, 24, 63. [Google Scholar] [CrossRef]
- Andre, F.; Steen, H.; Matheis, P.; Westkott, M.; Breuninger, K.; Sander, Y.; Kammerer, R.; Galuschky, C.; Giannitsis, E.; Korosoglou, G.; et al. Age- and gender-related normal left ventricular deformation assessed by cardiovascular magnetic resonance feature tracking. J. Cardiovasc. Magn. Reson. 2015, 17, 25. [Google Scholar] [CrossRef]
- André, F.; Robbers-Visser, D.; Helling-Bakki, A.; Föll, A.; Voss, A.; Katus, H.A.; Helbing, W.A.; Buss, S.J.; Eichhorn, J.G. Quantification of myocardial deformation in children by cardiovascular magnetic resonance feature tracking: Determination of reference values for left ventricular strain and strain rate. J. Cardiovasc. Magn. Reson. 2016, 19, 8. [Google Scholar] [CrossRef] [PubMed]
- Yang, W.; Xu, J.; Zhu, L.; Zhang, Q.; Wang, Y.; Zhao, S.; Lu, M. Myocardial Strain Measurements Derived From MR Feature-Tracking: Influence of Sex, Age, Field Strength, and Vendor. JACC Cardiovasc. Imaging 2023, in press. [CrossRef]
- Augustine, D.; Lewandowski, A.J.; Lazdam, M.; Rai, A.; Francis, J.; Myerson, S.; Noble, A.; Becher, H.; Neubauer, S.; Petersen, S.E.; et al. Global and regional left ventricular myocardial deformation measures by magnetic resonance feature tracking in healthy volunteers: Comparison with tagging and relevance of gender. J. Cardiovasc. Magn. Reson. 2013, 15, 8. [Google Scholar] [CrossRef]
- Truong, V.T.; Safdar, K.S.; Kalra, D.K.; Gao, X.; Ambach, S.; Taylor, M.D.; Moore, R.; Taylor, R.J.; Germann, J.; Toro-Salazar, O.; et al. Cardiac magnetic resonance tissue tracking in right ventricle: Feasibility and normal values. Magn. Reson. Imaging 2017, 38, 189–195. [Google Scholar] [CrossRef]
- Liu, B.; Dardeer, A.M.; Moody, W.E.; Hayer, M.K.; Baig, S.; Price, A.M.; Leyva, F.; Edwards, N.C.; Steeds, R.P. Reference ranges for three-dimensional feature tracking cardiac magnetic resonance: Comparison with two-dimensional methodology and relevance of age and gender. Int. J. Cardiovasc. Imaging 2018, 34, 761–775. [Google Scholar] [CrossRef]
- Peng, J.; Zhao, X.; Zhao, L.; Fan, Z.; Wang, Z.; Chen, H.; Leng, S.; Allen, J.; Tan, R.; Koh, A.S.; et al. Normal Values of Myocardial Deformation Assessed by Cardiovascular Magnetic Resonance Feature Tracking in a Healthy Chinese Population: A Multicenter Study. Front. Physiol. 2018, 9, 1181. [Google Scholar] [CrossRef]
- Vo, H.Q.; Marwick, T.H.; Negishi, K. MRI-Derived Myocardial Strain Measures in Normal Subjects. JACC Cardiovasc. Imaging 2018, 11, 196–205. [Google Scholar] [CrossRef] [PubMed]
- Romano, S.; Judd, R.M.; Kim, R.J.; Kim, H.W.; Klem, I.; Heitner, J.F.; Shah, D.J.; Jue, J.; White, B.E.; Indorkar, R.; et al. Feature-Tracking Global Longitudinal Strain Predicts Death in a Multicenter Population of Patients With Ischemic and Nonischemic Dilated Cardiomyopathy Incremental to Ejection Fraction and Late Gadolinium Enhancement. JACC Cardiovasc. Imaging 2018, 11, 1419–1429. [Google Scholar] [CrossRef] [PubMed]
- Kammerlander, A.A.; Kraiger, J.A.; Nitsche, C.; Donà, C.; Duca, F.; Zotter-Tufaro, C.; Binder, C.; Aschauer, S.; Loewe, C.; Hengstenberg, C.; et al. Global Longitudinal Strain by CMR Feature Tracking Is Associated With Outcome in HFPEF. JACC: Cardiovasc. Imaging 2019, 12, 1585–1587. [Google Scholar] [CrossRef]
- Hinojar, R.; Fernández-Golfín, C.; González-Gómez, A.; Rincón, L.M.; Plaza-Martin, M.; Casas, E.; García-Martín, A.; Fernandez-Mendez, M.A.; Esteban, A.; Nacher, J.J.J.; et al. Prognostic implications of global myocardial mechanics in hypertrophic cardiomyopathy by cardiovascular magnetic resonance feature tracking. Relations to left ventricular hypertrophy and fibrosis. Int. J. Cardiol. 2017, 249, 467–472. [Google Scholar] [CrossRef]
- Fischer, K.; Obrist, S.J.; Erne, S.A.; Stark, A.W.; Marggraf, M.; Kaneko, K.; Guensch, D.P.; Huber, A.T.; Greulich, S.; Aghayev, A.; et al. Feature Tracking Myocardial Strain Incrementally Improves Prognostication in Myocarditis Beyond Traditional CMR Imaging Features. JACC Cardiovasc. Imaging 2020, 13, 1891–1901. [Google Scholar] [CrossRef]
- Eitel, I.; Stiermaier, T.; Lange, T.; Rommel, K.P.; Koschalka, A.; Kowallick, J.T.; Lotz, J.; Kutty, S.; Gutberlet, M.; Hasenfuß, G.; et al. Cardiac Magnetic Resonance Myocardial Feature Tracking for Optimized Prediction of Cardiovascular Events Following Myocardial Infarction. JACC Cardiovasc. Imaging 2018, 11, 1433–1444. [Google Scholar] [CrossRef] [PubMed]
- Kersten, J.; Hackenbroch, C.; Gann, P.; Hoestermann, A.S.; Bernhardt, P. Myocardial deformation parameters assessed by CMR feature tracking in chronic heart failure: The influence of an optimal medical therapy on myocardial remodelling. Acta Cardiol. 2023, in press. [Google Scholar] [CrossRef]
- Fijalkowska, J.; Glinska, A.; Fijalkowski, M.; Sienkiewicz, K.; Kulawiak-Galaska, D.; Szurowska, E.; Pienkowska, J.; Dorniak, K. Cardiac Magnetic Resonance Relaxometry Parameters, Late Gadolinium Enhancement, and Feature-Tracking Myocardial Longitudinal Strain in Patients Recovered from COVID-19. J. Cardiovasc. Dev. Dis. 2023, 10, 278. [Google Scholar] [CrossRef] [PubMed]
- Lange, T.; Gertz, R.J.; Schulz, A.; Backhaus, S.J.; Evertz, R.; Kowallick, J.T.; Hasenfuß, G.; Desch, S.; Thiele, H.; Stiermaier, T.; et al. Impact of myocardial deformation on risk prediction in patients following acute myocardial infarction. Front. Cardiovasc. Med. 2023, 10, 1199936. [Google Scholar] [CrossRef]
- Xu, J.; Yang, W.; Zhao, S.; Lu, M. State-of-the-art myocardial strain by CMR feature tracking: Clinical applications and future perspectives. Eur. Radiol. 2022, 32, 5424–5435. [Google Scholar] [CrossRef]
- Wu, L.; Germans, T.; Güçlü, A.; Heymans, M.W.; Allaart, C.P.; van Rossum, A.C. Feature tracking compared with tissue tagging measurements of segmental strain by cardiovascular magnetic resonance. J. Cardiovasc. Magn. Reson. 2014, 16, 10. [Google Scholar] [CrossRef] [PubMed]
- Morton, G.; Schuster, A.; Jogiya, R.; Kutty, S.; Beerbaum, P.; Nagel, E. Inter-study reproducibility of cardiovascular magnetic resonance myocardial feature tracking. J. Cardiovasc. Magn. Reson. 2012, 14, 43. [Google Scholar] [CrossRef] [PubMed]
- Feisst, A.; Kuetting, D.L.R.; Dabir, D.; Luetkens, J.; Homsi, R.; Schild, H.H.; Thomas, D. Influence of observer experience on cardiac magnetic resonance strain measurements using feature tracking and conventional tagging. IJC Heart Vasc. 2018, 18, 46–51. [Google Scholar] [CrossRef] [PubMed]


| All (N = 100) | Males (N = 50) | Females (N = 50) | p-Value | |
|---|---|---|---|---|
| Age(years) | 44.7 ± 14.2 | 44.6 ± 14.4 | 44.7 ± 14.1 | 0.89 |
| Caucasian race, N (%) | 100 (100) | 50 (100) | 50 (100) | - |
| Body surface area (m2) | 1.8 ± 0.2 | 1.9 ± 0.2 | 1.7 ± 1.5 | <0.001 |
| Heart Rate (bpm) | 65.6 ± 10.0 | 64.0 ± 11.8 | 67.1 ± 7.7 | 0.13 |
| LV end-diastolic volume index (mL/m2) | 74.8 ± 12.7 | 79.5 ± 12.4 | 70.1 ± 11.3 | <0.001 |
| LV end-systolic volume index (mL/m2) | 27.5 ± 7.3 | 30.5 ± 7.1 | 24.5 ± 6.3 | <0.001 |
| LV stroke volume index (mL/m2) | 47.4 ± 8.4 | 49.1 ± 8.1 | 45.7 ± 8.6 | 0.027 |
| LV mass index (g/m2) | 54.9 ± 12.5 | 60.3 ± 9.9 | 49.5 ± 12.6 | <0.001 |
| LV ejection fraction (%) | 63.5 ± 6.1 | 61.8 ± 5.4 | 65.1 ± 6.4 | 0.012 |
| RV end-diastolic volume index (mL/m2) | 74.0 ± 14.3 | 80.6 ± 13.4 | 67.4 ± 11.9 | <0.001 |
| RV end-systolic volume index (mL/m2) | 28.9 ± 8.3 | 32.7 ± 7.5 | 25.1 ± 7.4 | <0.001 |
| RV stroke volume index (mL/m2) | 45.4 ± 8.7 | 47.9 ± 8.7 | 42.8 ± 8.0 | 0.003 |
| RV ejection fraction (%) | 61.8 ± 5.5 | 59.9 ± 4.9 | 63.5 ± 5.5 | 0.001 |
| LV GCS (%) | −16.7 ± 2.1 | −16.0 ± 1.9 | −17.4 ± 2.1 | 0.001 |
| LV GRSSAX (%) | 26.4 ± 5.1 | 24.8 ± 4.5 | 27.9 ± 5.2 | 0.001 |
| LV GRSLAX (%) | 31.1 ± 5.2 | 28.9 ± 4.4 | 33.3 ± 5.1 | <0.001 |
| LV GLS (%) | −17.7 ± 1.9 | −16.9 ± 1.7 | −18.5 ± 1.7 | <0.001 |
| RV GLS (%) | −23.9 ± 4.1 | −23.0 ± 3.6 | −24.7 ± 4.3 | 0.036 |
| Age | BSA | HR | LV EDVI | LV Mass Index | LV EF | RV EDVI | RV EF | |
|---|---|---|---|---|---|---|---|---|
| LV GCS (%) | R = −0.06; p = 0.53 | R = 0.21; p = 0.040 | R = −0.09; p = 0.383 | R = 0.24; p = 0.015 | R = 0.16; p = 0.11 | R = −0.73; p < 0.001 | R = 0.12; p = 0.25 | R = −0.50; p < 0.001 |
| LV GRSSAX (%) | R = 0.06; p = 0.57 | R = −0.28; p = 0.005 | R = 0.07; p = 0.499 | R = −0.25; p = 0.014 | R = −0.18; p = 0.09 | R = 0.72; p < 0.001 | R = −0.15; p = 0.14 | R = 0.49; p < 0.001 |
| LV GRSLAX (%) | R = −0.18; p = 0.07 | R = −0.35; p < 0.001 | R = −0.05; p = 0.617 | R = −0.08; p = 0.43 | R = −0.14; p = 0.18 | R = 0.35; p < 0.001 | R = −0.01; p = 0.89 | R = −0.16; p = 0.12 |
| LV GLS (%) | R = 0.19; p = 0.06 | R = 0.34; p < 0.001 | R = 0.06; p = 0.569 | R = 0.12; p = 0.26 | R = 0.12; p = 0.24 | R = −0.37; p < 0.001 | R = 0.01; p = 0.98 | R = −0.12; p = 0.26 |
| RV GLS (%) | R = −0.09; p = 0.37 | R = 0.11; p = 0.27 | R = −0.13; p = 0.202 | R = 0.23; p = 0.022 | R = −0.13; p = 0.21 | R = 0.14; p = 0.18 | R = 0.22; p = 0.032 | R = −0.11; p = 0.27 |
| Dependent Variable | Independent Predictors | Univariate Analysis | Multivariate Analysis | ||
|---|---|---|---|---|---|
| Beta Coefficient (95% CI) | p-Value | Beta Coefficient (95% CI) | p-Value | ||
| LV GCS (%) | Sex (M = 1; F = 2) | −1.4 (−2.2; −0.57) | 0.001 | −1.4 (−2.2; −0.57) | 0.001 |
| Age | −0.01 (−0.03; 0.02) | 0.52 | |||
| BSA | 1.9 (0.09; 3.9) | 0.040 | |||
| HR | −0.02 (−0.06; 0.02) | 0.38 | |||
| LV GRSSAX (%) | Sex (M = 1; F = 2) | 3.2 (1.3; 5.2) | 0.001 | 3.2 (1.3; 5.2) | 0.001 |
| Age | 0.02 (−0.05; 0.09) | 0.54 | |||
| BSA | −4.7 (−9.3; −0.19) | 0.042 | |||
| HR | 0.04 (−0.06; 0.14) | 0.41 | |||
| LV GRSLAX (%) | Sex (M = 1; F = 2) | 4.4 (2.5; 6.3) | <0.001 | 4.4 (2.5; 6.3) | <0.001 |
| Age | −0.05 (−0.12; 0.02) | 0.16 | |||
| BSA | −7.9 (−12.2; −3.7) | <0.001 | |||
| HR | −0.03 (−0.13; 0.08) | 0.62 | |||
| LV GLS (%) | Sex (M = 1; F = 2) | −1.5 (−2.2; −0.82) | <0.001 | −1.5 (−2.2; −0.82) | <0.001 |
| Age | 0.03 (−0.00; 0.05) | 0.06 | |||
| BSA | 2.8 (1.2; 4.3) | 0.001 | |||
| HR | 0.01 (−0.03; 0.05) | 0.57 | |||
| RV GLS (%) | Sex (M = 1; F = 2) | −1.7 (−3.3; −0.11) | 0.036 | −1.7 (−3.3; −0.11) | 0.036 |
| Age | −0.03 (−0.08; 0.03) | 0.37 | |||
| BSA | 2.6 (−1.0; 6.2) | 0.16 | |||
| HR | −0.05 (−0.13; 0.03) | 0.23 | |||
| Measure | INTRA-OPERATOR | INTRA-OPERATOR | ||||||
|---|---|---|---|---|---|---|---|---|
| Bland–Altman Analysis | CoV (%) | ICC [95% CI] | Bland–Altman Analysis | CoV (%) | ICC [95% CI] | |||
| Bias (%) | Limits (%) | Bias (%) | Limits (%) | |||||
| LV GCS (%) | −0.94 | −2.1 to 0.18; | 4.4 | 0.95 [0.63; 0.99] | −0.28 | −1.5 to 0.91 | 2.8 | 0.98 [0.96; 0.99] |
| LV GRSSAX (%) | 1.9 | −2.6 to 6.5 | 7.3 | 0.95 [0.69; 0.99] | 0.78 | −2.6 to 4.2 | 4.9 | 0.97 [0.94; 0.99] |
| LV GRSLAX (%) | 1.8 | −3.6 to 7.3 | 5.5 | 0.83 [0.40; 0.95] | −0.09 | −4.9 to 4.7 | 5.7 | 0.93 [0.87; 0.96] |
| LV GLS (%) | −0.65 | −2.6 to 1.3 | 3.9 | 0.85 [0.46; 0.95] | 0.09 | −1.7 to 1.9 | 3.7 | 0.93 [0.88; 0.97] |
| RV GLS (%) | −0.04 | −3.8 to 3.7 | 5.2 | 0.88 [0.64; 0.96] | 1.2 | −3.7 to 6.1 | 7.7 | 0.83 [0.61; 0.92] |
| Males | Females | |
|---|---|---|
| LV GCS(%) | −12.3 to −19.8 | −13.2 to −21.6 |
| LV GRSSAX(%) | 17.3 to 34.1 | 17.5 to 38.4 |
| LV GRSLAX(%) | 20.1 to 37.7 | 23.2 to 43.4 |
| LV GLS(%) | −13.7 to −20.3 | −14.9 to −21.9 |
| RV GLS(%) | −15.8 to −32.5 | −16.1 to −33.4 |
| Study | Year | Sample Size (N) | LV GCS (%) | LV GRS (%) | LV GLS (%) | RV GLS (%) |
|---|---|---|---|---|---|---|
| Augustine et al. [17] | 2013 | 145 | −21 ± 3 | 25 ± 6 | −19 ± 3 | n.a. |
| Taylor et al. [11] | 2015 | 100 | −26.1 ± 3.8 | 39.8 ± 8.3 | −21.3 ± 4.8 | n.a. |
| Andre et al. [14] | 2015 | 150 | −21.3 ± 3.3 | 36.3 ± 8.7 | −21.6 ± 3.2 | n.a. |
| Troung et al. [18] | 2017 | 50 | n.a. | n.a. | n.a | −22.11 ± 3.51 |
| Liu et al. [19] | 2018 | 100 | −20.9 ± 3.6 | 46.6 ± 15.4 | −19.8 ± 2.9 | n.a. |
| Peng et al. [20] | 2018 | 150 | −24.3 ± 3.1 | 79 ± 19.4 | −22.4 ± 2.9 | −29.3 ± 6.0 |
| Vo et al. [21] | 2018 | 659 (metanalysis from 18 studies) | −23.0 | −34.1 | −20.1 | −21.8 |
| Weise Valdés et al. [12] | 2021 | 181 | −19.2 ± 2.1 | 34.2 ± 6.1 | −16.9 ± 1.8 | n.a. |
| Li et al. [13] | 2022 | 566 | −19.6 ± 2.1 | 34.5 ± 6.3 | −16.6 ± 2.1 | −21.2 ± 5.0 |
| Yantg et al. [16] | 2023 | 3359 (metanalysis from 44 studies) | −21.4% | 43.7% | −18.4% | −24.0% |
| Barison et al. | 2023 | 100 | −16.7 ± 2.1 | 26.4 ± 5.1 | −17.7 ± 1.9 | −23.9 ± 4.1 |
Disclaimer/Publisher’s Note: The statements, opinions and data contained in all publications are solely those of the individual author(s) and contributor(s) and not of MDPI and/or the editor(s). MDPI and/or the editor(s) disclaim responsibility for any injury to people or property resulting from any ideas, methods, instructions or products referred to in the content. |
© 2023 by the authors. Licensee MDPI, Basel, Switzerland. This article is an open access article distributed under the terms and conditions of the Creative Commons Attribution (CC BY) license (https://creativecommons.org/licenses/by/4.0/).
Share and Cite
Barison, A.; Ceolin, R.; Palmieri, A.; Tamborrino, P.P.; Todiere, G.; Grigoratos, C.; Gueli, I.A.; De Gori, C.; Clemente, A.; Pistoia, L.; et al. Biventricular Tissue Tracking with Cardiovascular Magnetic Resonance: Reference Values of Left- and Right-Ventricular Strain. Diagnostics 2023, 13, 2912. https://doi.org/10.3390/diagnostics13182912
Barison A, Ceolin R, Palmieri A, Tamborrino PP, Todiere G, Grigoratos C, Gueli IA, De Gori C, Clemente A, Pistoia L, et al. Biventricular Tissue Tracking with Cardiovascular Magnetic Resonance: Reference Values of Left- and Right-Ventricular Strain. Diagnostics. 2023; 13(18):2912. https://doi.org/10.3390/diagnostics13182912
Chicago/Turabian StyleBarison, Andrea, Roberto Ceolin, Alessandro Palmieri, Pietro Paolo Tamborrino, Giancarlo Todiere, Chrysanthos Grigoratos, Ignazio Alessio Gueli, Carmelo De Gori, Alberto Clemente, Laura Pistoia, and et al. 2023. "Biventricular Tissue Tracking with Cardiovascular Magnetic Resonance: Reference Values of Left- and Right-Ventricular Strain" Diagnostics 13, no. 18: 2912. https://doi.org/10.3390/diagnostics13182912
APA StyleBarison, A., Ceolin, R., Palmieri, A., Tamborrino, P. P., Todiere, G., Grigoratos, C., Gueli, I. A., De Gori, C., Clemente, A., Pistoia, L., Pepe, A., Aquaro, G. D., Positano, V., Emdin, M., Cademartiri, F., & Meloni, A. (2023). Biventricular Tissue Tracking with Cardiovascular Magnetic Resonance: Reference Values of Left- and Right-Ventricular Strain. Diagnostics, 13(18), 2912. https://doi.org/10.3390/diagnostics13182912