
Characteristics of Urine Organic Acid Metabolites in Nonalcoholic Fatty Liver Disease Assessed Using Magnetic Resonance Imaging with Elastography in Korean Adults


Abstract
:1. Introduction
2. Subjects and Methods
2.1. The Study Participants
2.2. Measurements and Personal Medical History
2.3. Measurements of Urine Organic Acid Metabolites
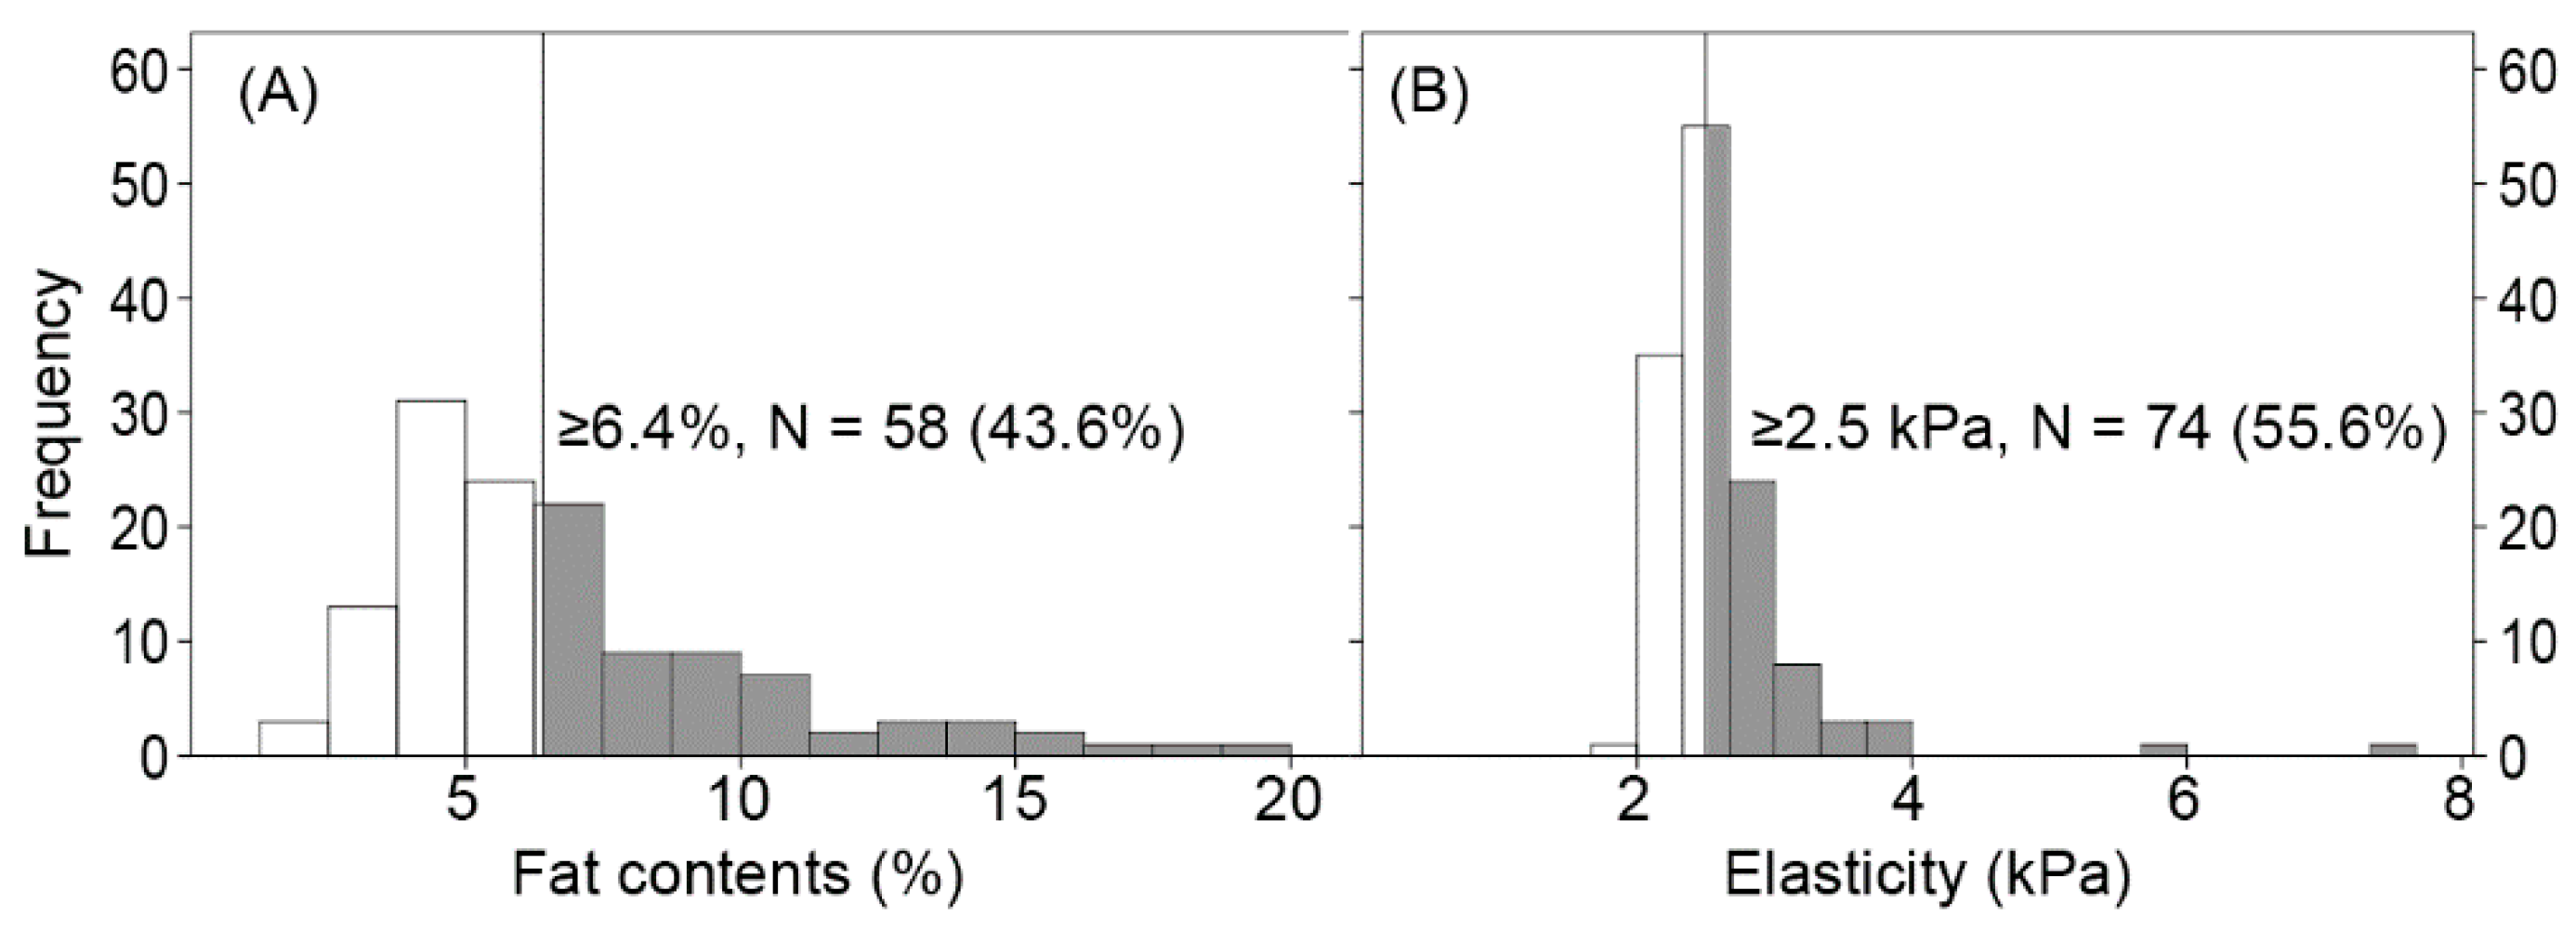
2.4. Measurements of Hepatic Steatosis and Fibrosis
2.5. Statistical Analysis
3. Results
3.1. Characteristics of the Participants
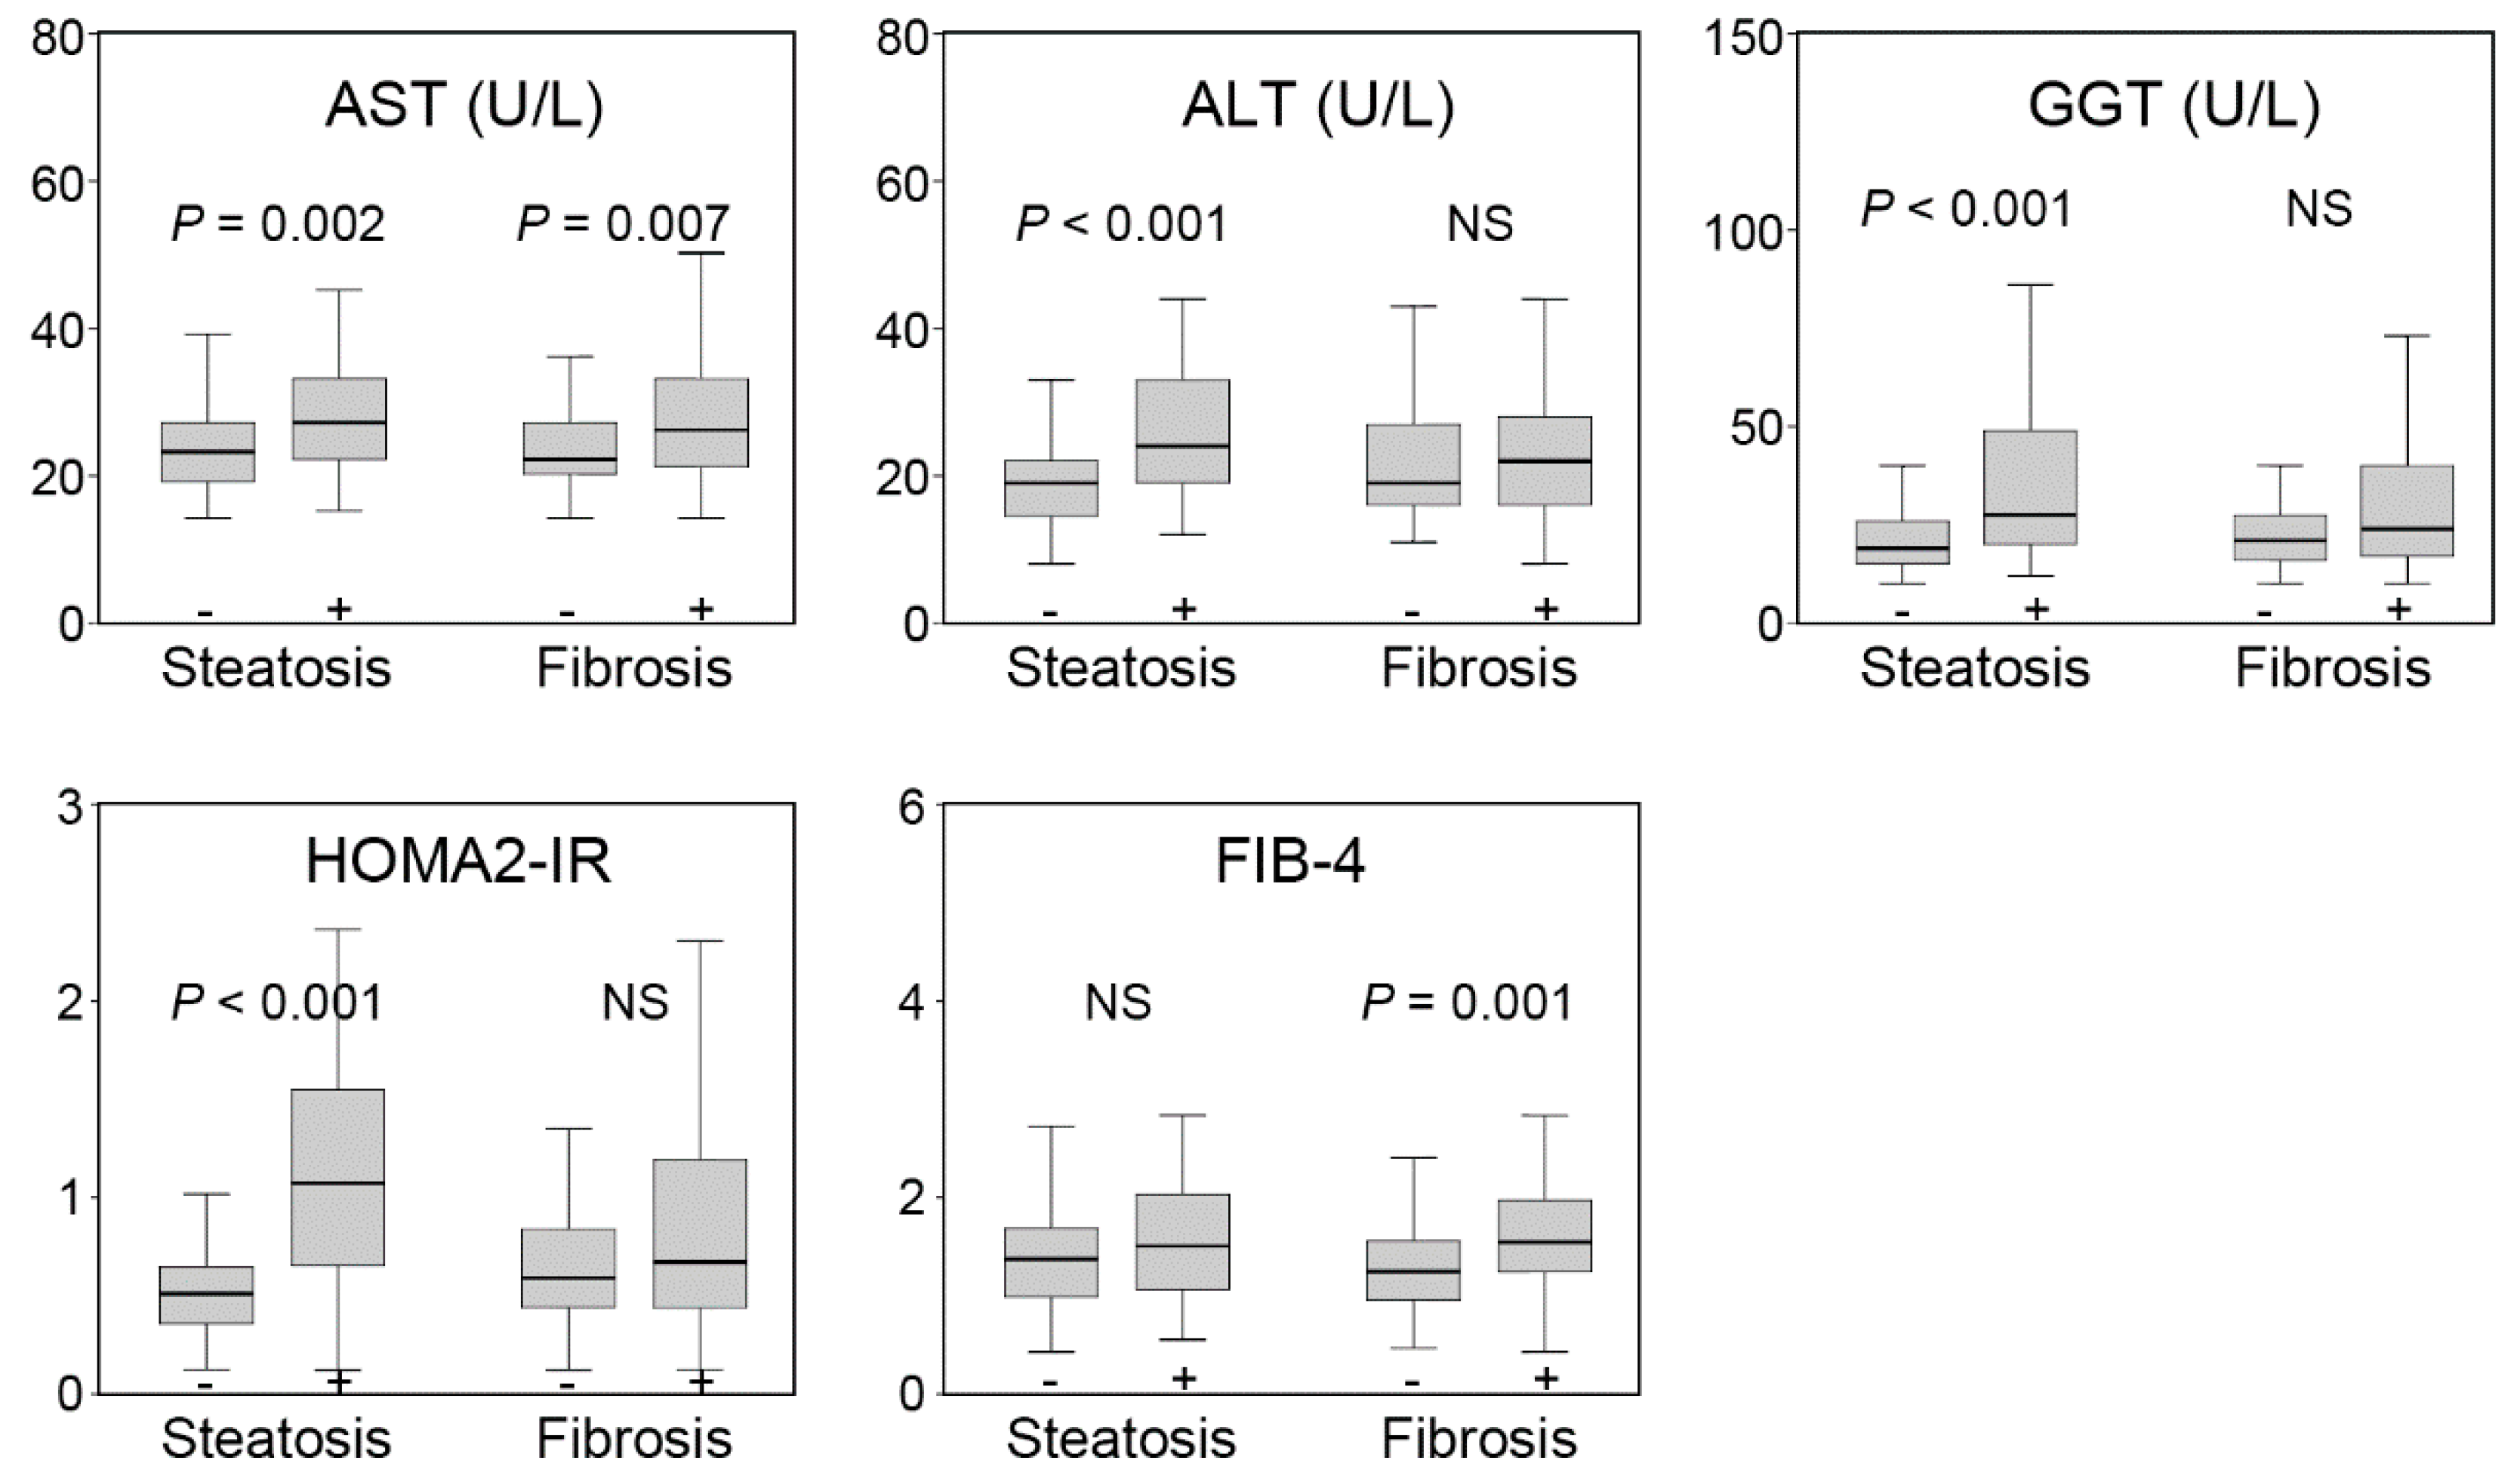
3.2. Differences in Conventional Parameters According to Hepatic Steatosis and Fibrosis
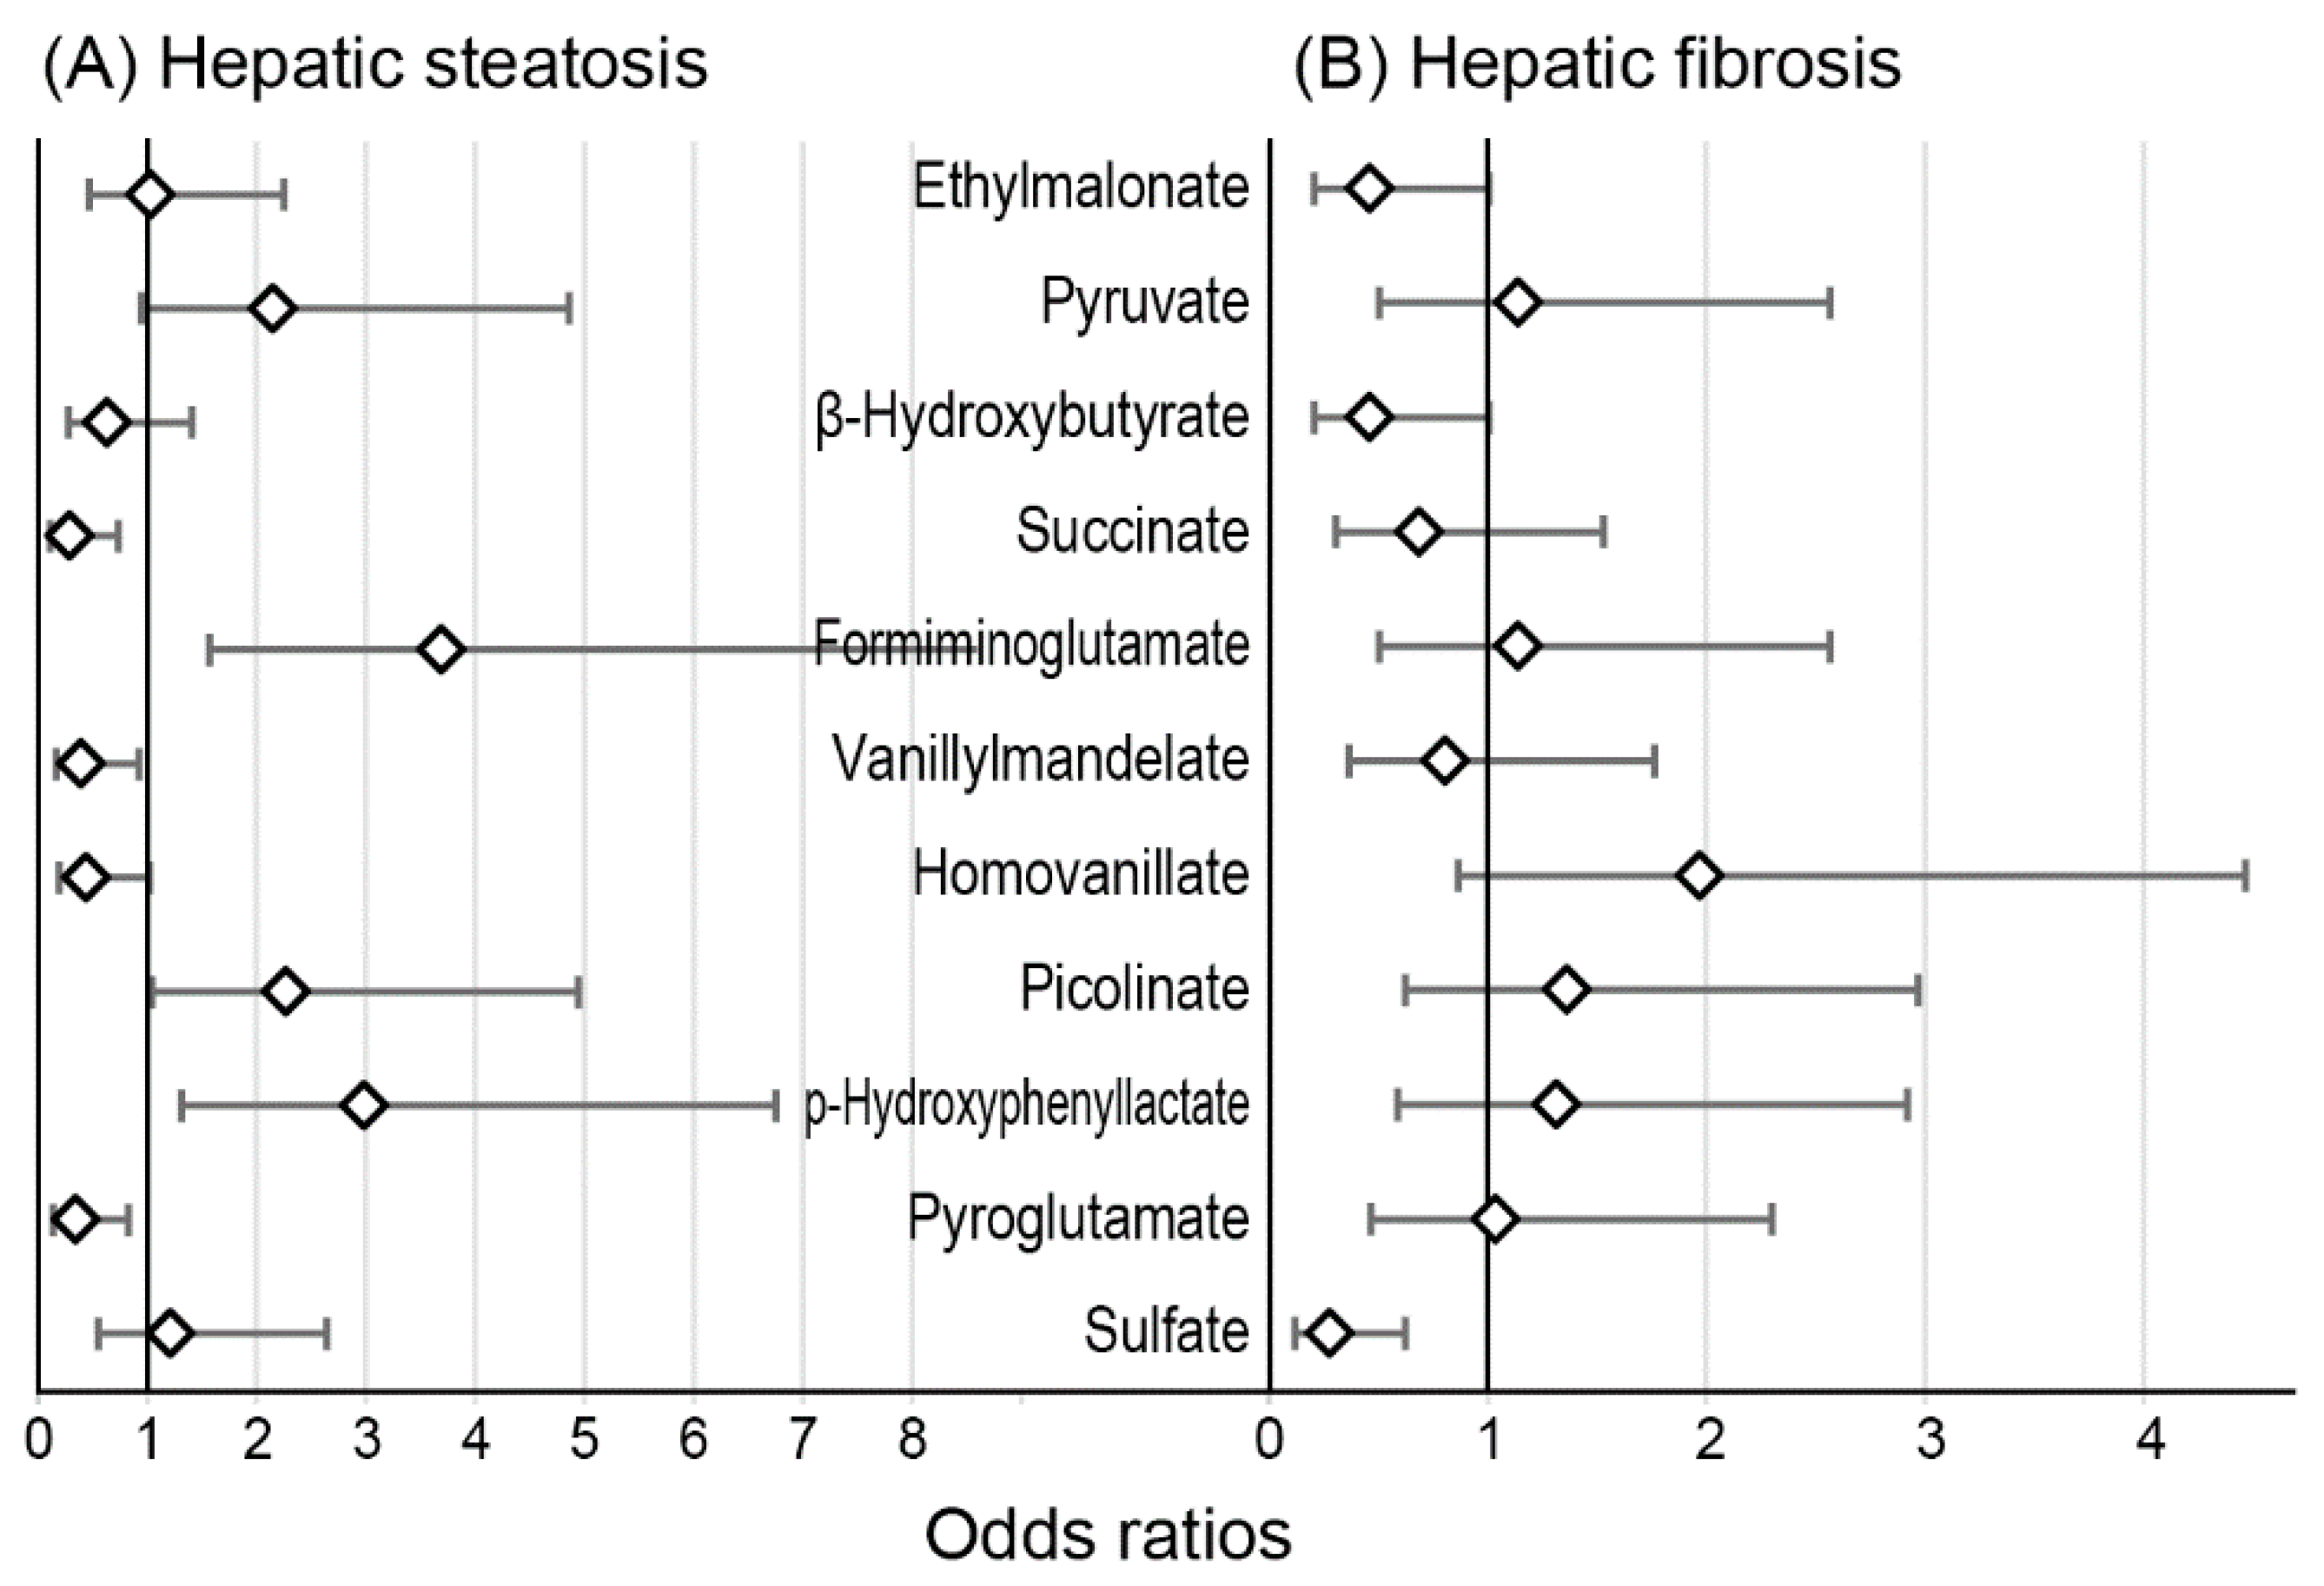
3.3. The Association of Hepatic Steatosis and Fibrosis with Urine Organic Acid Metabolites
4. Discussion
5. Conclusions
Supplementary Materials
Author Contributions
Funding
Institutional Review Board Statement
Informed Consent Statement
Data Availability Statement
Acknowledgments
Conflicts of Interest
References
- Loomba, R.; Sanyal, A.J. The global NAFLD epidemic. Nat. Rev. Gastroenterol. Hepatol. 2013, 10, 686–690. [Google Scholar] [CrossRef] [PubMed]
- Chalasani, N.; Younossi, Z.; Lavine, J.E.; Charlton, M.; Cusi, K.; Rinella, M.; Harrison, S.A.; Brunt, E.M.; Sanyal, A.J. The diagnosis and management of nonalcoholic fatty liver disease: Practice guidance from the American Association for the Study of Liver Diseases. Hepatology 2018, 67, 328–357. [Google Scholar] [CrossRef] [PubMed]
- Angulo, P.; Kleiner, D.E.; Dam-Larsen, S.; Adams, L.A.; Bjornsson, E.S.; Charatcharoenwitthaya, P.; Mills, P.R.; Keach, J.C.; Lafferty, H.D.; Stahler, A.; et al. Liver Fibrosis, but No Other Histologic Features, Is Associated with Long-term Outcomes of Patients With Nonalcoholic Fatty Liver Disease. Gastroenterology 2015, 149, 389–397.e10. [Google Scholar] [CrossRef] [Green Version]
- Younossi, Z.M.; Stepanova, M.; Rafiq, N.; Makhlouf, H.; Younoszai, Z.; Agrawal, R.; Goodman, Z. Pathologic criteria for nonalcoholic steatohepatitis: Interprotocol agreement and ability to predict liver-related mortality. Hepatology 2011, 53, 1874–1882. [Google Scholar] [CrossRef] [PubMed]
- Younossi, Z.M.; Otgonsuren, M.; Henry, L.; Venkatesan, C.; Mishra, A.; Erario, M.; Hunt, S. Association of nonalcoholic fatty liver disease (NAFLD) with hepatocellular carcinoma (HCC) in the United States from 2004 to 2009. Hepatology 2015, 62, 1723–1730. [Google Scholar] [CrossRef] [PubMed]
- Mohamad, B.; Shah, V.; Onyshchenko, M.; Elshamy, M.; Aucejo, F.; Lopez, R.; Hanouneh, I.A.; Alhaddad, R.; Alkhouri, N. Characterization of hepatocellular carcinoma (HCC) in non-alcoholic fatty liver disease (NAFLD) patients without cirrhosis. Hepatol. Int. 2016, 10, 632–639. [Google Scholar] [CrossRef]
- Dyson, J.K.; Anstee, Q.M.; McPherson, S. Non-alcoholic fatty liver disease: A practical approach to diagnosis and staging. Frontline Gastroenterol. 2014, 5, 211–218. [Google Scholar] [CrossRef]
- Tamaki, N.; Ajmera, V.; Loomba, R. Non-invasive methods for imaging hepatic steatosis and their clinical importance in NAFLD. Nat. Rev. Endocrinol. 2022, 18, 55–66. [Google Scholar] [CrossRef]
- Wang, J.; Malik, N.; Yin, M.; Smyrk, T.C.; Czaja, A.J.; Ehman, R.L.; Venkatesh, S.K. Magnetic resonance elastography is accurate in detecting advanced fibrosis in autoimmune hepatitis. World J. Gastroenterol. 2017, 23, 859–868. [Google Scholar] [CrossRef]
- Idilman, I.S.; Keskin, O.; Celik, A.; Savas, B.; Elhan, A.H.; Idilman, R.; Karcaaltincaba, M. A comparison of liver fat content as determined by magnetic resonance imaging-proton density fat fraction and MRS versus liver histology in non-alcoholic fatty liver disease. Acta Radiol. 2016, 57, 271–278. [Google Scholar] [CrossRef]
- Chen, J.; Yin, M.; Talwalkar, J.A.; Oudry, J.; Glaser, K.J.; Smyrk, T.C.; Miette, V.; Sandrin, L.; Ehman, R.L. Diagnostic Performance of MR Elastography and Vibration-controlled Transient Elastography in the Detection of Hepatic Fibrosis in Patients with Severe to Morbid Obesity. Radiology 2017, 283, 418–428. [Google Scholar] [CrossRef] [PubMed]
- Giannini, E.G.; Testa, R.; Savarino, V. Liver enzyme alteration: A guide for clinicians. CMAJ 2005, 172, 367–379. [Google Scholar] [CrossRef] [PubMed] [Green Version]
- Lemmer, P.; Selbach, N.; Baars, T.; Porsch-Ozcurumez, M.; Heider, D.; Canbay, A.; Sowa, J.P. Transaminase Concentrations Cannot Separate Non-Alcoholic Fatty Liver and Non-Alcoholic Steatohepatitis in Morbidly Obese Patients Irrespective of Histological Algorithm. Dig. Dis. 2021. [Google Scholar] [CrossRef] [PubMed]
- Martinou, E.; Pericleous, M.; Stefanova, I.; Kaur, V.; Angelidi, A.M. Diagnostic Modalities of Non-Alcoholic Fatty Liver Disease: From Biochemical Biomarkers to Multi-Omics Non-Invasive Approaches. Diagnostics 2022, 12, 407. [Google Scholar] [CrossRef] [PubMed]
- Mallet, V.; Parlati, L.; Vallet-Pichard, A.; Terris, B.; Tsochatzis, E.; Sogni, P.; Pol, S. FIB-4 index to rule-out advanced liver fibrosis in NAFLD patients. Presse Méd. 2019, 48, 1484–1488. [Google Scholar] [CrossRef] [PubMed]
- Kaswala, D.H.; Lai, M.; Afdhal, N.H. Fibrosis Assessment in Nonalcoholic Fatty Liver Disease (NAFLD) in 2016. Dig. Dis. Sci. 2016, 61, 1356–1364. [Google Scholar] [CrossRef]
- Rui, L. Energy metabolism in the liver. Compr. Physiol. 2014, 4, 177–197. [Google Scholar] [CrossRef] [Green Version]
- Loomba, R.; Friedman, S.L.; Shulman, G.I. Mechanisms and disease consequences of nonalcoholic fatty liver disease. Cell 2021, 184, 2537–2564. [Google Scholar] [CrossRef]
- Piras, C.; Noto, A.; Ibba, L.; Deidda, M.; Fanos, V.; Muntoni, S.; Leoni, V.P.; Atzori, L. Contribution of Metabolomics to the Understanding of NAFLD and NASH Syndromes: A Systematic Review. Metabolites 2021, 11, 694. [Google Scholar] [CrossRef]
- Dong, S.; Zhan, Z.Y.; Cao, H.Y.; Wu, C.; Bian, Y.Q.; Li, J.Y.; Cheng, G.H.; Liu, P.; Sun, M.Y. Urinary metabolomics analysis identifies key biomarkers of different stages of nonalcoholic fatty liver disease. World J. Gastroenterol. 2017, 23, 2771–2784. [Google Scholar] [CrossRef]
- Qi, S.; Xu, D.; Li, Q.; Xie, N.; Xia, J.; Huo, Q.; Li, P.; Chen, Q.; Huang, S. Metabonomics screening of serum identifies pyroglutamate as a diagnostic biomarker for nonalcoholic steatohepatitis. Clin. Chim. Acta 2017, 473, 89–95. [Google Scholar] [CrossRef] [PubMed]
- Masarone, M.; Troisi, J.; Aglitti, A.; Torre, P.; Colucci, A.; Dallio, M.; Federico, A.; Balsano, C.; Persico, M. Untargeted metabolomics as a diagnostic tool in NAFLD: Discrimination of steatosis, steatohepatitis and cirrhosis. Metabolomics 2021, 17, 12. [Google Scholar] [CrossRef] [PubMed]
- Kim, H.Y. Recent advances in nonalcoholic fatty liver disease metabolomics. Clin. Mol. Hepatol. 2021, 27, 553–559. [Google Scholar] [CrossRef] [PubMed]
- Scolamiero, E.; Cozzolino, C.; Albano, L.; Ansalone, A.; Caterino, M.; Corbo, G.; di Girolamo, M.G.; Di Stefano, C.; Durante, A.; Franzese, G.; et al. Targeted metabolomics in the expanded newborn screening for inborn errors of metabolism. Mol. Biosyst. 2015, 11, 1525–1535. [Google Scholar] [CrossRef]
- Gallagher, R.C.; Pollard, L.; Scott, A.I.; Huguenin, S.; Goodman, S.; Sun, Q. ACMG Biochemical Genetics Subcommittee of the Laboratory Quality Assurance Committee. Laboratory analysis of organic acids, 2018 update: A technical standard of the American College of Medical Genetics and Genomics (ACMG). Genet. Med. 2018, 20, 683–691. [Google Scholar] [CrossRef]
- Haam, J.H.; Lee, Y.K.; Suh, E.; Choi, S.W.; Chun, H.; Kim, Y.S. Urine organic acids may be useful biomarkers for metabolic syndrome and its components in Korean adults. Clin. Chem. Lab. Med. 2021, 59, 1824–1831. [Google Scholar] [CrossRef]
- Sterling, R.K.; Lissen, E.; Clumeck, N.; Sola, R.; Correa, M.C.; Montaner, J.; Sulkowski, M.S.; Torriani, F.J.; Dieterich, D.T.; Thomas, D.L.; et al. Development of a simple noninvasive index to predict significant fibrosis in patients with HIV/HCV coinfection. Hepatology 2006, 43, 1317–1325. [Google Scholar] [CrossRef]
- Tang, A.; Desai, A.; Hamilton, G.; Wolfson, T.; Gamst, A.; Lam, J.; Clark, L.; Hooker, J.; Chavez, T.; Ang, B.D.; et al. Accuracy of MR imaging-estimated proton density fat fraction for classification of dichotomized histologic steatosis grades in nonalcoholic fatty liver disease. Radiology 2015, 274, 416–425. [Google Scholar] [CrossRef] [Green Version]
- Huwart, L.; Sempoux, C.; Salameh, N.; Jamart, J.; Annet, L.; Sinkus, R.; Peeters, F.; ter Beek, L.C.; Horsmans, Y.; Van Beers, B.E. Liver fibrosis: Noninvasive assessment with MR elastography versus aspartate aminotransferase-to-platelet ratio index. Radiology 2007, 245, 458–466. [Google Scholar] [CrossRef]
- Huwart, L.; Sempoux, C.; Vicaut, E.; Salameh, N.; Annet, L.; Danse, E.; Peeters, F.; ter Beek, L.C.; Rahier, J.; Sinkus, R.; et al. Magnetic resonance elastography for the noninvasive staging of liver fibrosis. Gastroenterology 2008, 135, 32–40. [Google Scholar] [CrossRef]
- Ballestri, S.; Mantovani, A.; Baldelli, E.; Lugari, S.; Maurantonio, M.; Nascimbeni, F.; Marrazzo, A.; Romagnoli, D.; Targher, G.; Lonardo, A. Liver Fibrosis Biomarkers Accurately Exclude Advanced Fibrosis and Are Associated with Higher Cardiovascular Risk Scores in Patients with NAFLD or Viral Chronic Liver Disease. Diagnostics 2021, 11, 98. [Google Scholar] [CrossRef] [PubMed]
- Angulo, P.; Hui, J.M.; Marchesini, G.; Bugianesi, E.; George, J.; Farrell, G.C.; Enders, F.; Saksena, S.; Burt, A.D.; Bida, J.P.; et al. The NAFLD fibrosis score: A noninvasive system that identifies liver fibrosis in patients with NAFLD. Hepatology 2007, 45, 846–854. [Google Scholar] [CrossRef] [PubMed]
- Lichtinghagen, R.; Pietsch, D.; Bantel, H.; Manns, M.P.; Brand, K.; Bahr, M.J. The Enhanced Liver Fibrosis (ELF) score: Normal values, influence factors and proposed cut-off values. J. Hepatol. 2013, 59, 236–242. [Google Scholar] [CrossRef] [PubMed]
- Guha, I.N.; Parkes, J.; Roderick, P.; Chattopadhyay, D.; Cross, R.; Harris, S.; Kaye, P.; Burt, A.D.; Ryder, S.D.; Aithal, G.P.; et al. Noninvasive markers of fibrosis in nonalcoholic fatty liver disease: Validating the European Liver Fibrosis Panel and exploring simple markers. Hepatology 2008, 47, 455–460. [Google Scholar] [CrossRef]
- Lu, Q.; Tian, X.; Wu, H.; Huang, J.; Li, M.; Mei, Z.; Zhou, L.; Xie, H.; Zheng, S. Metabolic Changes of Hepatocytes in NAFLD. Front. Physiol. 2021, 12, 710420. [Google Scholar] [CrossRef]
- Puchalska, P.; Crawford, P.A. Multi-dimensional Roles of Ketone Bodies in Fuel Metabolism, Signaling, and Therapeutics. Cell Metab. 2017, 25, 262–284. [Google Scholar] [CrossRef] [Green Version]
- Linster, C.L.; Noel, G.; Stroobant, V.; Vertommen, D.; Vincent, M.F.; Bommer, G.T.; Veiga-da-Cunha, M.; Van Schaftingen, E. Ethylmalonyl-CoA decarboxylase, a new enzyme involved in metabolite proofreading. J. Biol. Chem. 2011, 286, 42992–43003. [Google Scholar] [CrossRef] [Green Version]
- Amendt, B.A.; Greene, C.; Sweetman, L.; Cloherty, J.; Shih, V.; Moon, A.; Teel, L.; Rhead, W.J. Short-chain acyl-coenzyme A dehydrogenase deficiency. Clinical and biochemical studies in two patients. J. Clin. Investig. 1987, 79, 1303–1309. [Google Scholar] [CrossRef] [Green Version]
- Ozand, P.T.; Rashed, M.; Millington, D.S.; Sakati, N.; Hazzaa, S.; Rahbeeni, Z.; al Odaib, A.; Youssef, N.; Mazrou, A.; Gascon, G.G.; et al. Ethylmalonic aciduria: An organic acidemia with CNS involvement and vasculopathy. Brain Dev. 1994, 16, 12–22. [Google Scholar] [CrossRef]
- Tafti, M.; Petit, B.; Chollet, D.; Neidhart, E.; de Bilbao, F.; Kiss, J.Z.; Wood, P.A.; Franken, P. Deficiency in short-chain fatty acid beta-oxidation affects theta oscillations during sleep. Nat. Genet. 2003, 34, 320–325. [Google Scholar] [CrossRef]
- Levy, G. Sulfate conjugation in drug metabolism: Role of inorganic sulfate. Fed. Proc. 1986, 45, 2235–2240. [Google Scholar] [PubMed]
- Gregus, Z.; White, C.; Howell, S.; Klaassen, C.D. Effect of glutathione depletion on sulfate activation and sulfate ester formation in rats. Biochem. Pharmacol. 1988, 37, 4307–4312. [Google Scholar] [CrossRef]
- Almazroo, O.A.; Miah, M.K.; Venkataramanan, R. Drug Metabolism in the Liver. Clin. Liver Dis. 2017, 21, 1–20. [Google Scholar] [CrossRef] [PubMed]
- Muhammad, I.; Wang, H.; Sun, X.; Wang, X.; Han, M.; Lu, Z.; Cheng, P.; Hussain, M.A.; Zhang, X. Dual Role of Dietary Curcumin Through Attenuating AFB1-Induced Oxidative Stress and Liver Injury via Modulating Liver Phase-I and Phase-II Enzymes Involved in AFB1 Bioactivation and Detoxification. Front. Pharm. 2018, 9, 554. [Google Scholar] [CrossRef] [Green Version]
- Smith, E.A.; Macfarlane, G.T. Enumeration of human colonic bacteria producing phenolic and indolic compounds: Effects of pH, carbohydrate availability and retention time on dissimilatory aromatic amino acid metabolism. J. Appl. Bacteriol. 1996, 81, 288–302. [Google Scholar] [CrossRef]
- Moore, S.C.; Matthews, C.E.; Sampson, J.N.; Stolzenberg-Solomon, R.Z.; Zheng, W.; Cai, Q.; Tan, Y.T.; Chow, W.H.; Ji, B.T.; Liu, D.K.; et al. Human metabolic correlates of body mass index. Metabolomics 2014, 10, 259–269. [Google Scholar] [CrossRef]
- Caussy, C.; Hsu, C.; Lo, M.T.; Liu, A.; Bettencourt, R.; Ajmera, V.H.; Bassirian, S.; Hooker, J.; Sy, E.; Richards, L.; et al. Link between gut-microbiome derived metabolite and shared gene-effects with hepatic steatosis and fibrosis in NAFLD. Hepatology 2018, 68, 918–932. [Google Scholar] [CrossRef] [Green Version]
- Muting, D.; Wuzel, H.; Bucsis, L.; Flasshoff, H.J. Urinary p-hydroxyphenyllactic acid as indicator of hepatic encephalopathy in patients with hepatic cirrhosis. Lancet 1985, 2, 1365–1366. [Google Scholar] [CrossRef]
- An, Y.A.; Chen, S.; Deng, Y.; Wang, Z.V.; Funcke, J.B.; Shah, M.; Shan, B.; Gordillo, R.; Yoshino, J.; Klein, S.; et al. The mitochondrial dicarboxylate carrier prevents hepatic lipotoxicity by inhibiting white adipocyte lipolysis. J. Hepatol. 2021, 75, 387–399. [Google Scholar] [CrossRef]
- Asselah, T.; Boyer, N.; Guimont, M.C.; Cazals-Hatem, D.; Tubach, F.; Nahon, K.; Daikha, H.; Vidaud, D.; Martinot, M.; Vidaud, M.; et al. Liver fibrosis is not associated with steatosis but with necroinflammation in French patients with chronic hepatitis C. Gut 2003, 52, 1638–1643. [Google Scholar] [CrossRef] [Green Version]
- Hagstrom, H.; Elfwen, O.; Hultcrantz, R.; Stal, P. Steatohepatitis Is Not Associated with an Increased Risk for Fibrosis Progression in Nonalcoholic Fatty Liver Disease. Gastroenterol. Res. Pract. 2018, 2018, 1942648. [Google Scholar] [CrossRef] [PubMed] [Green Version]
- Yin, M.; Chen, J.; Glaser, K.J.; Talwalkar, J.A.; Ehman, R.L. Abdominal magnetic resonance elastography. Top. Magn. Reson. Imaging 2009, 20, 79–87. [Google Scholar] [CrossRef] [PubMed] [Green Version]
- Venkatesh, S.K.; Yin, M.; Ehman, R.L. Magnetic resonance elastography of liver: Technique, analysis, and clinical applications. J. Magn. Reson. Imaging 2013, 37, 544–555. [Google Scholar] [CrossRef] [Green Version]
- Paparo, F.; Cenderello, G.; Revelli, M.; Bacigalupo, L.; Rutigliani, M.; Zefiro, D.; Cevasco, L.; Amico, M.; Bandelloni, R.; Cassola, G.; et al. Diagnostic value of MRI proton density fat fraction for assessing liver steatosis in chronic viral C hepatitis. BioMed Res. Int. 2015, 2015, 758164. [Google Scholar] [CrossRef] [PubMed]
- Tang, A.; Tan, J.; Sun, M.; Hamilton, G.; Bydder, M.; Wolfson, T.; Gamst, A.C.; Middleton, M.; Brunt, E.M.; Loomba, R.; et al. Nonalcoholic fatty liver disease: MR imaging of liver proton density fat fraction to assess hepatic steatosis. Radiology 2013, 267, 422–431. [Google Scholar] [CrossRef] [PubMed] [Green Version]
- Gu, Q.; Cen, L.; Lai, J.; Zhang, Z.; Pan, J.; Zhao, F.; Yu, C.; Li, Y.; Chen, C.; Chen, W.; et al. A meta-analysis on the diagnostic performance of magnetic resonance imaging and transient elastography in nonalcoholic fatty liver disease. Eur. J. Clin. Investig. 2021, 51, e13446. [Google Scholar] [CrossRef]
- Noureddin, M.; Lam, J.; Peterson, M.R.; Middleton, M.; Hamilton, G.; Le, T.A.; Bettencourt, R.; Changchien, C.; Brenner, D.A.; Sirlin, C.; et al. Utility of magnetic resonance imaging versus histology for quantifying changes in liver fat in nonalcoholic fatty liver disease trials. Hepatology 2013, 58, 1930–1940. [Google Scholar] [CrossRef]


| n = 133 | |
|---|---|
| Age (years) | 58.6 ± 10.9 |
| Sex (men) | 68 (51.1%) |
| Medication history | |
| Hypertension | 31 (23.3%) |
| Diabetes | 42 (31.6%) |
| Dyslipidemia | 13 (9.8%) |
| Anthropometry and measurements | |
| Body mass index (kg/m2) | 23.2 (21.2–25.4) |
| Systolic BP (mmHg) | 119 (108–129) |
| Diastolic BP (mmHg) | 74 (66–80) |
| Laboratory results | |
| AST (U/L) | 24 (20–29) |
| ALT (U/L) | 21 (16–28) |
| GGT (U/L) | 22 (16–33) |
| HOMA2-IR | 0.63 (0.44–1.11) |
| FIB-4 | 1.42 (1.04–1.84) |
| Urine creatinine (mmol/L) | 12.2 (8.1–15.7) |
| MRI with elastography findings | |
| Fat content (%) | 5.8 (4.3–8.2) |
| Elasticity (kPa) | 2.51 (2.31–2.74) |
| Model 1 (Age and Sex) | Model 2 (Liver Parameter) | Model 3 (Metabolic Factors) | ||||
|---|---|---|---|---|---|---|
| OR | p | OR | p | OR | p | |
| Hepatic steatosis | ||||||
| Pyruvate | 2.318 (0.934–5.756) | 0.070 | 2.061 (0.781–5.437) | 0.144 | 1.265 (0.415–3.856) | 0.679 |
| Succinate | 0.371 (0.137–1.007) | 0.052 | 0.410 (0.149–1.133) | 0.086 | 0.327 (0.103–1.039) | 0.058 |
| Formiminoglutamate | 2.174 (0.862–5.480) | 0.100 | 1.250 (0.450–3.476) | 0.669 | 0.797 (0.245–2.592) | 0.706 |
| Vanillylmandelate | 1.003 (0.345–2.917) | 0.995 | 0.589 (0.180–1.931) | 0.382 | 0.800 (0.223–2.864) | 0.732 |
| Homovanillate | 0.838 (0.296–2.376) | 0.740 | 1.120 (0.373–3.359) | 0.840 | 0.970 (0.274–3.431) | 0.962 |
| Picolinate | 2.081 (0.875–4.949) | 0.097 | 1.865 (0.755–4.604) | 0.177 | 1.347 (0.480–3.781) | 0.571 |
| p-Hydroxyphenyllactate | 3.078 (1.246–7.604) | 0.015 | 3.379 (1.307–8.734) | 0.012 | 2.665 (0.934–7.604) | 0.067 |
| Pyroglutamate | 0.617 (0.225–1.693) | 0.349 | 0.499 (0.168–1.483) | 0.211 | 0.750 (0.226–2.482) | 0.637 |
| Hepatic fibrosis | ||||||
| Ethylmalonate | 0.444 (0.195–1.009) | 0.053 | 0.385 (0.160–0.924) | 0.033 | 0.390 (0.162–0.939) | 0.036 |
| β-Hydroxybutyrate | 0.504 (0.225–1.130) | 0.096 | 0.391 (0.163–0.937) | 0.035 | 0.393 (0.162–0.956) | 0.039 |
| Sulfate | 0.246 (0.105–0.580) | 0.001 | 0.233 (0.094–0.580) | 0.002 | 0.243 (0.097–0.610) | 0.003 |
Publisher’s Note: MDPI stays neutral with regard to jurisdictional claims in published maps and institutional affiliations. |
© 2022 by the authors. Licensee MDPI, Basel, Switzerland. This article is an open access article distributed under the terms and conditions of the Creative Commons Attribution (CC BY) license (https://creativecommons.org/licenses/by/4.0/).
Share and Cite
Haam, J.-H.; Lee, Y.K.; Suh, E.; Kim, Y.-S. Characteristics of Urine Organic Acid Metabolites in Nonalcoholic Fatty Liver Disease Assessed Using Magnetic Resonance Imaging with Elastography in Korean Adults. Diagnostics 2022, 12, 1199. https://doi.org/10.3390/diagnostics12051199
Haam J-H, Lee YK, Suh E, Kim Y-S. Characteristics of Urine Organic Acid Metabolites in Nonalcoholic Fatty Liver Disease Assessed Using Magnetic Resonance Imaging with Elastography in Korean Adults. Diagnostics. 2022; 12(5):1199. https://doi.org/10.3390/diagnostics12051199
Chicago/Turabian StyleHaam, Ji-Hee, Yun Kyong Lee, Eunkyung Suh, and Young-Sang Kim. 2022. "Characteristics of Urine Organic Acid Metabolites in Nonalcoholic Fatty Liver Disease Assessed Using Magnetic Resonance Imaging with Elastography in Korean Adults" Diagnostics 12, no. 5: 1199. https://doi.org/10.3390/diagnostics12051199
APA StyleHaam, J.-H., Lee, Y. K., Suh, E., & Kim, Y.-S. (2022). Characteristics of Urine Organic Acid Metabolites in Nonalcoholic Fatty Liver Disease Assessed Using Magnetic Resonance Imaging with Elastography in Korean Adults. Diagnostics, 12(5), 1199. https://doi.org/10.3390/diagnostics12051199