Article

Electrochemical Polymerisation of Glutamic Acid on the Surface of Graphene Paste Electrode for the Detection and Quantification of Rutin in Food and Medicinal Samples

by
Balliamada M. Amrutha
1,
Jamballi G. Manjunatha
1,*,
Hareesha Nagarajappa
1,
Ammar M. Tighezza
2,
Munirah D. Albaqami
2 and
Mika Sillanpää
3
1
Department of Chemistry, FMKMC College, Mangalore University Constituent College, Madikeri 571201, Karnataka, India
2
Department of Chemistry, College of Science, King Saud University, Riyadh 11451, Saudi Arabia
3
Department of Biological and Chemical Engineering, Aarhus University, Nørrebrogade 44, 8000 Aarhus, Denmark
*
Author to whom correspondence should be addressed.
Diagnostics 2022, 12(12), 3113; https://doi.org/10.3390/diagnostics12123113
Submission received: 15 November 2022 / Revised: 29 November 2022 / Accepted: 7 December 2022 / Published: 9 December 2022

Abstract

:
Rutin (RU) is one of the best-known natural antioxidants with various physiological functions in the human body and other plant species. In this work, an efficient voltammetric sensor to detect RU in food samples was explicated using a poly (glutamic acid)-modified graphene paste electrode (PGAMGPE). In order to detect RU, the proposed sensor diminishes material resistance and overpotential while increasing kinetic rate, peak currents, and material conductance. Using differential pulse voltammetry (DPV) and cyclic voltammetry (CV), the analysing efficiency of a PGAMGPE and a Bare graphene paste electrode (BGPE) was evaluated in 0.2 M phosphate buffer (PB) at an ideal pH of 6.5. in a potential window of −0.25 V to 0.6 V. Electrochemical impedance spectroscopy (EIS) was used to analyse the prepared electrode materials’ conductivity, charge transfer resistance, and the kinetics of electron transport. Field emission scanning electron microscopy (FE-SEM) images were considered to compare the exterior morphology of the PGAMGPE and the BGPE. It was discovered that the PGAMGPE and the BGPE have electroactive surfaces of 0.062 cm2 and 0.04 cm2, respectively. It was determined that two protons and two electrons participated in the redox process. The resultant limit of detection (LOD) was found to be 0.04 µM and 0.06 µM, respectively, using DPV and CV methods. In spite of common interferents such as metal ions and chemical species, the developed sensor’s selectivity for RU detection was impressive. For the simultaneous analysis of RU in the presence of caffeine (CF), the PGAMGPE affords a good electrochemical nature for RU with good selectivity. Due to the good stability, repeatability, reproducibility, and ease of use of the present RU sensor, it is useful for real sample analysis such as food and medicinal samples with recovery ranging from 94 to 100%.

1. Introduction

A polyphenolic bioflavonoid RU, also known as sophorin, rutoside, and quercetin-3-rutinoside is mostly taken from citrus fruits, grapes, berries, tea, peaches, and certain other naturally occurring supplies. Chemically, it is a glycoside composed by the flavonolic quercetin and disaccharide rutinose [1]. Several plant species naturally produce RU, and it can be found in buckwheat seed, fruit rinds, and other plant parts, particularly citrus fruits (orange, grapefruit, and lemon). The oxidising species OH radical, superoxide radical, and peroxyl radical can all be effectively scavenged by RU. As a result, it exhibits a range of pharmacological activity, including anti-inflammatory, antiallergic, and vasoactive properties as well as anticancer, antibacterial, antiviral, and antiprotozoal ones. RU is also said to have various therapeutic effects such as hypolipidemia, anticarcinogenic properties, and antidiabetic properties. RU has a benefit over flavonoids such as myricetin, quercetagenin, and others that can occasionally act as pro-oxidants and promote the creation of oxygen radicals. In comparison to glycones, whose use as medicinal agents is prohibited due to their mutagenic and cytotoxic action, RU has additional advantages [2]. RU is a lipophilic substance that is soluble in pyridine, methanol, and ethanol [3]. As a result, it may be worthwhile to think of it as a potentially useful molecule that is both harmless and inert. Hence, it is essential to analyse RU in foodstuff, biological, and pharmaceutical samples with a methodology that is more straightforward, economical, eco-friendly, and adaptive.
Various analytical methods such as high-performance thin-layer chromatography [4], capillary electrophoresis [5], ultraviolet–visible spectrophotometry [6], high-performance liquid chromatography with ultraviolet detection [7], chromatographic fingerprint analysis [8], chemiluminescence [9], capillary zone electrophoresis [10], high-performance liquid chromatography mass spectrometry [11], etc., have been used for the sensitive detection of RU. However, all these analytical procedures are lengthy, challenging to handle with expensive instrumentation, require difficult pretreatment procedures, provide high LOD, low sensitivity, and it is difficult to analyse the target molecule in the presence of interferents [12].
Fabrication of an electrochemically sensitive working electrode with appropriate surface modification is necessary for the detection of RU. During the past few decades, graphene and other carbon-based substances have been widely employed for the investigation of various significant electrochemical compounds [13]. Graphene is well known for having a variety of interesting electrochemical characteristics for sensing. These intriguing nanoparticles are composed of two-dimensional short stacks of graphene sheets which are structured like platelets. They are reasonably priced, have a larger potential interface, active surface area, good thermal and electrical conductivity, rapid electron transfer rate, and influential mechanical and chemical stability [14]. Due to the swift method, flexibility of its use, relatively inexpensive nature and ecological benefits, electropolymerisation is one of the most popular techniques for modifying the electrode surface. During this process, an electrochemical reaction takes place at the interface of the electrode which results in effortlessly adhering a conductive polymer film of desired thickness under different conditions of deposition. The dispersed monomers in the electrochemical solution will be reduced to polymers by electrochemical oxidation of monomers, and they form a film on the exterior of the electrode with large number of active sites [15,16,17].
Polyglutamic acid (PGA) is, however, one biomaterial with a variety of biological functions and potential for use in fundamental and functional research. According to the literature, PGA offers both conducting bridges and speeds up electron transport. It consists of many glutamic acid (GA) units connected by γ-peptide links, and the α-carboxyl groups are free to interact with a variety of substances [18]. A GA molecule that combines an amino and a carboxyl group has a variety of special characteristics. It may easily create covalent connections and electrostatic interactions with particular molecules. Additionally, PGA is regarded as a biofriendly polymer due to its adaptable structure and superior biocompatibility. The PGA film which exhibits outstanding qualities in electrochemical applications with different chain length may also be broken down by bacteria. Since it is so simple to prepare, PGA is frequently utilised to modify the electrode. It will increase its adsorption capability when mixed with other materials, particularly when combined with graphene [19].
A modest and responsive PGAMGPE was developed on the basis of electropolymerisation of GA at GPE for RU detection in food and medicinal samples using the CV and DPV methods. This electrochemical sensor (PGAMGPE) presents lower LOD than other complex electrochemical sensors and biosensors (further difficulties during the preparation of electrodes) with precise and responsive RU redox peaks. Moreover, the interfering component’s effect on RU was analysed at PGAMGPE with inspiring results. The sensor (PGAMGPE) is also biodegradable and just requires a modest amount of inexpensive electrode material. The present PGAMGPE has not been applied as a catalyst for the electrocatalytic analysis of RU in any earlier published research data.

2. Experimental Procedure

2.1. Chemicals and Reagents

Tokyo Chemical Industry (Japan) supplied RU and graphene with dimensions of 6.0–8.0 nm thick and 15 µm broad. From Molychem (India), silicon oil with a purity of 90% was purchased. Dimethyl sulfoxide (DMSO) was purchased from Sigma Aldrich (India). We bought Na2HPO4·2H2O, NaH2PO4·H2O and K4[Fe(CN)6] from Himedia chemicals (India). KCl with a purity of 99.5% was obtained from Nice chemicals (India). All the chemicals used were all analytical reagent quality and were used as is. By dissolving them in a specified quantity of solvent, all the necessary chemical solutions with known concentrations were made.

2.2. Instrumentation

The electrochemical response of RU was analysed using CHI-6038E from USA. A three-electrode assembly was attached to this electrochemical analyser, where the reference electrode was a saturated calomel electrode (SCE), platinum wire was the auxiliary electrode, and BGPE or PGAMGPE of 3 mm module was the working electrode. The EQ-610 pH device was used to prepare PB with varied pH values ranging from 5.5 to 8.0. The FE-SEM was performed using a ZEISS apparatus at Mangalore University, India.

2.3. Fabrication of Working Electrodes

In order to create a homogenous paste, graphene powder and silicone oil were correctly combined in a ratio of 60:40 to obtain BGPE. This homogeneous paste was inserted into the 3 mm gap of the polytetrafluoroethylene tube and its surface was scrubbed by a soft tissue paper to attain a consistently smooth surface on the sensor. The prepared sensor’s exterior was rinsed with double distilled water to get rid of the impurities. The PGAMGPE was fabricated using the electrochemical polymerisation procedure. Ten CV cycles were used with a potential gap of 0.2 V to 1.5 V to electrochemically polymerise 1.0 mM GA in 0.2 M PB on the surface of the BGPE. The exterior of the prepared sensors was then gently cleaned with distilled water to remove the GA molecules that had not been adsorbed.

2.4. Preparation of RU Containing Real Sample Solutions

Fresh lime juice was extracted from fresh limes, which was then continuously stirred with DMSO. After that, lime juice and its rind were separated by centrifugation. Whatman filter paper was used to filter the resulting solution. For further examination, the resulting solution of lime juice was diluted with 0.2 M PB. The green tea sachets were submerged for one hour in a container containing DMSO solvent. To obtain a clean solution of green tea, the resultant tea solution was then filtered using filter paper. For further investigation, the resulting stock solution was diluted with PB of pH 6.5. The tablets containing RU were purchased from a neighbourhood pharmacy. The tablet was thoroughly ground into powder, and the resulting powder was then combined with a known quantity of DMSO while being constantly stirred. A clear solution was obtained after filtering the obtained mixture, and the resultant tablet solution was diluted with M PB for additional examination.

3. Results and Discussions

3.1. FE-SEM Characterisation of BGPE and PGAMGPE

The prepared working electrode surfaces were initially investigated by FE-SEM. Figure 1a displays the typical FE-SEM depiction of the BGPE which reveals a flake-shaped sheet structure with flat morphology indicating the presence of graphene nanoplates with topological size. The BGPE exhibits a layered heterogeneous structure with crumpled and ridged appearance. Figure 1b shows the deposition of a thin layer of PGA film which displays a large surface area for the adsorption of target species indicating that they are finely blended [20].

3.2. Electrochemical Impedance Studies and Electroactive Surface Area Calculation

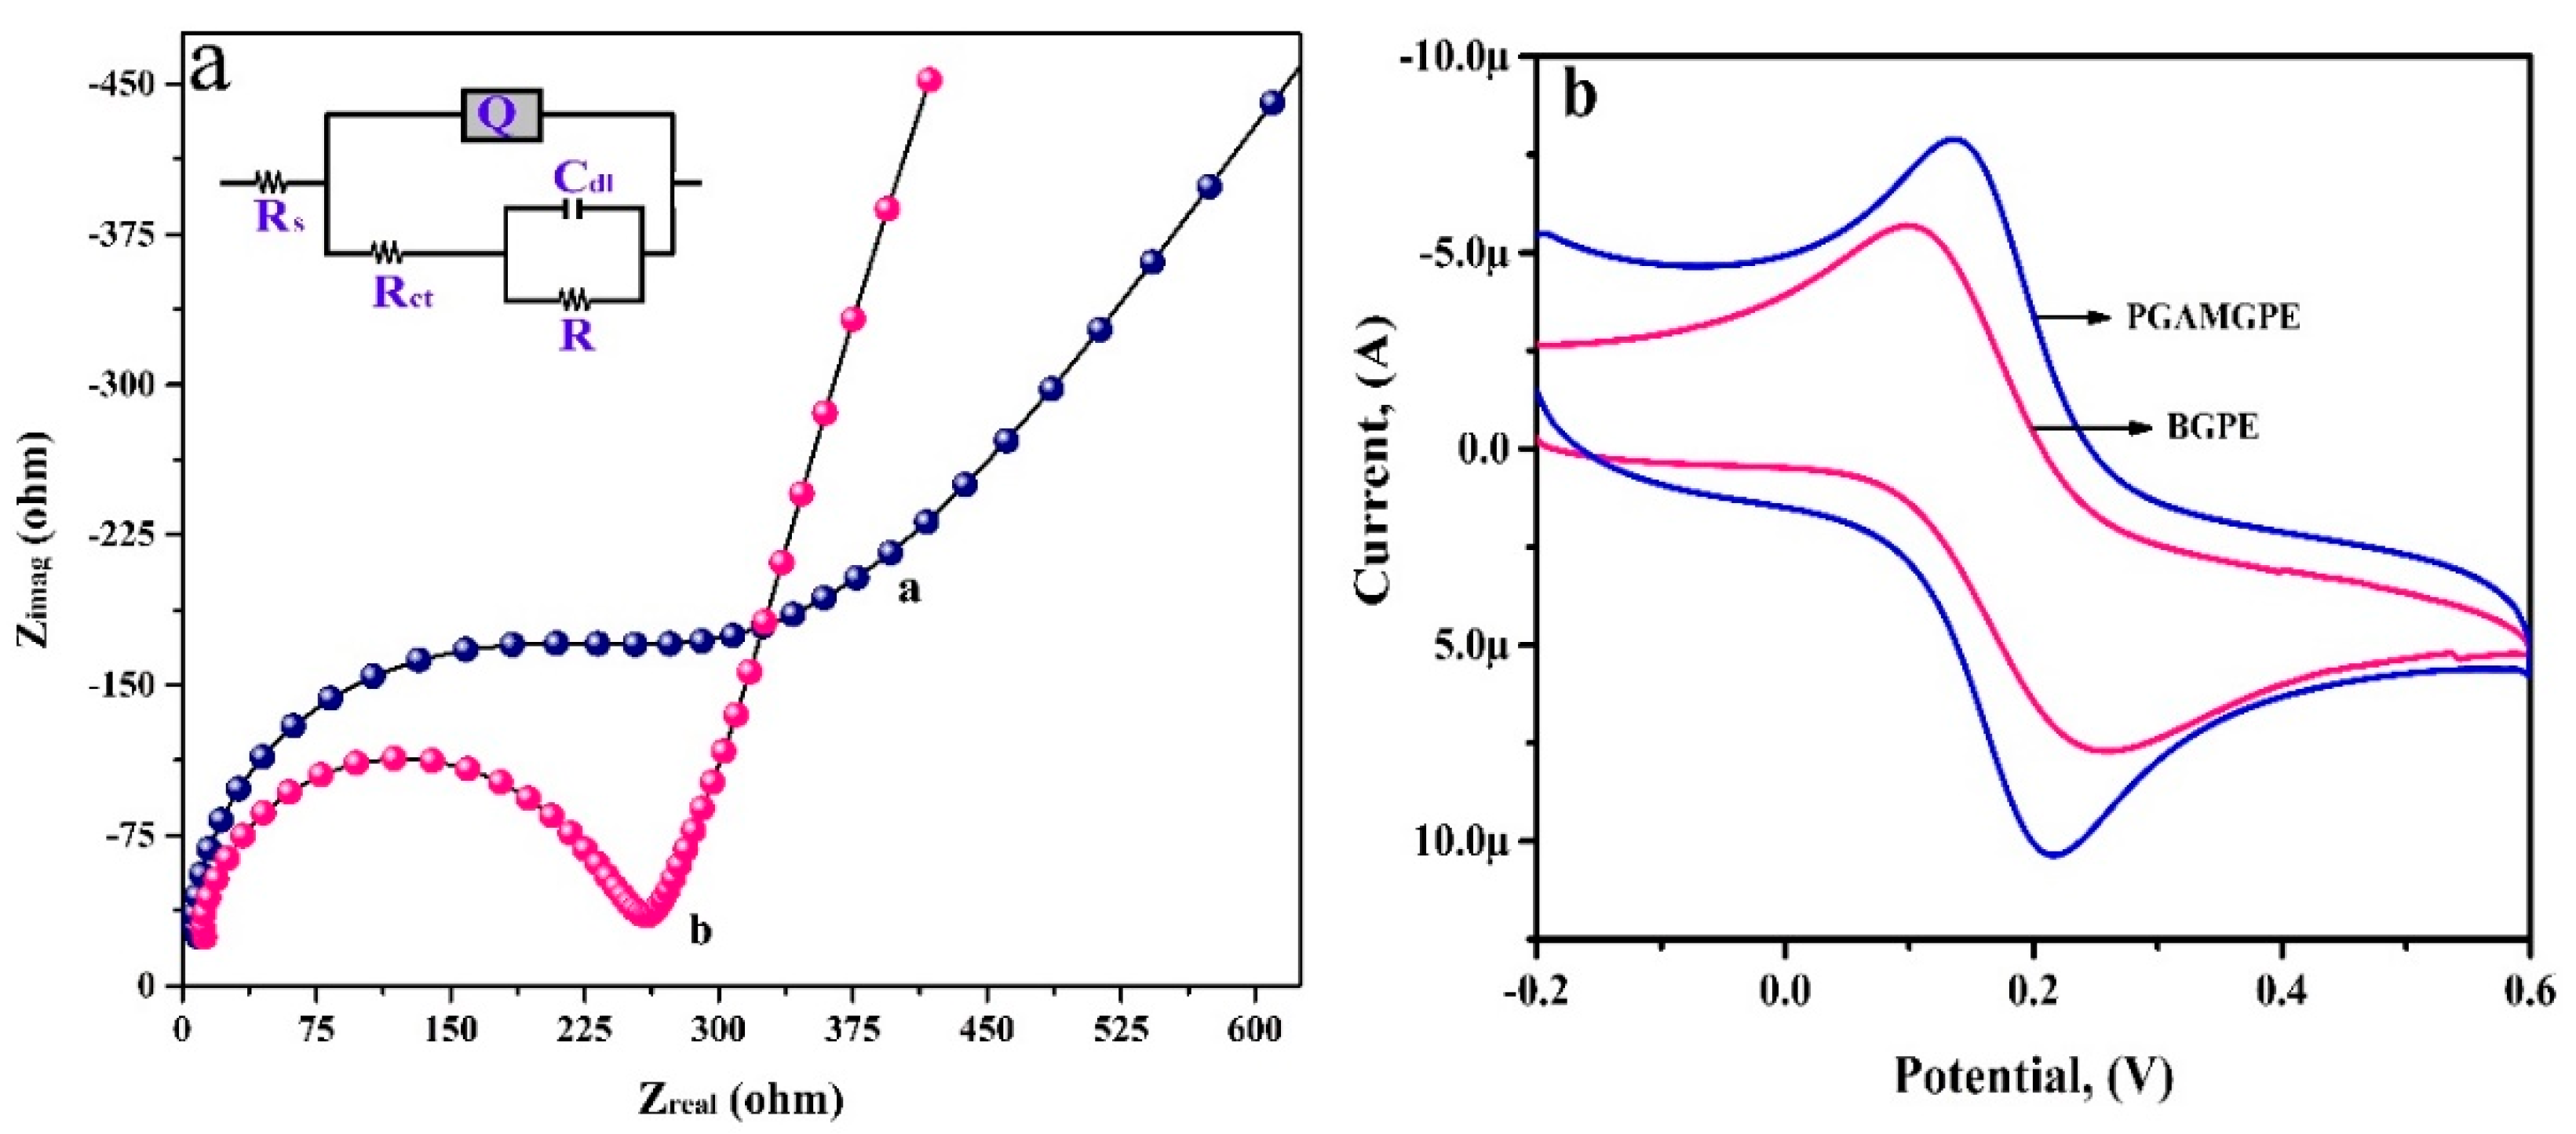
EIS is widely used to evaluate the charge transfer capability of working electrodes. The Nyquist plots of the BGPE and the PGAMGPE were recorded in KCl (0.1 M) with 1.0 mM K4[Fe(CN)6]. The resistance to electrochemical reaction at the working electrode surface is directly reflected by the semicircle diameter in Nyquist plots as shown in Figure 2a. Due to the weak conductivity of the BGPE, the semicircular portion is significantly greater than the PGAMGPE, and as a result, the Rct value of the BGPE is significantly higher than the PGAMGPE [21,22]. The fitting results showed that the Rct values of the BGPE and the PGAMGPE were 387.1 Ω and 262 Ω, respectively. The Rct values manifest that the polymer film of GA has strong electrical conductivity and the modified electrode has a faster rate of electron transfer. The corresponding circuit was also fitted using the Nyquist plot and had the resulting parameters: solution resistance (Rs), capacitance (C), Rct, and constant phase element (CPE).
Analysis of the electrochemical characteristics of electrodes using CV is a reliable method. Using 1.0 mM K4 [Fe (CN)6] as a standard redox system with 0.1 M KCl as the supporting electrolyte, the voltammetric performance of the PGAMGPE and the BGPE was examined. The cyclic voltammograms (CVs) in Figure 2b demonstrate that the PGAMGPE has improved current sensitivity in comparison to the BGPE. In the standard redox system, the cathodic and anodic signals had peak to peak separations (ΔEp) of 0.0838 V and 0.1594 V for the PGAMGPE and the BGPE, respectively. The lowered ΔEp value of the modified electrode proves that the polymer coating on the bare electrode’s surface speeds up the rate of electron transport [23].
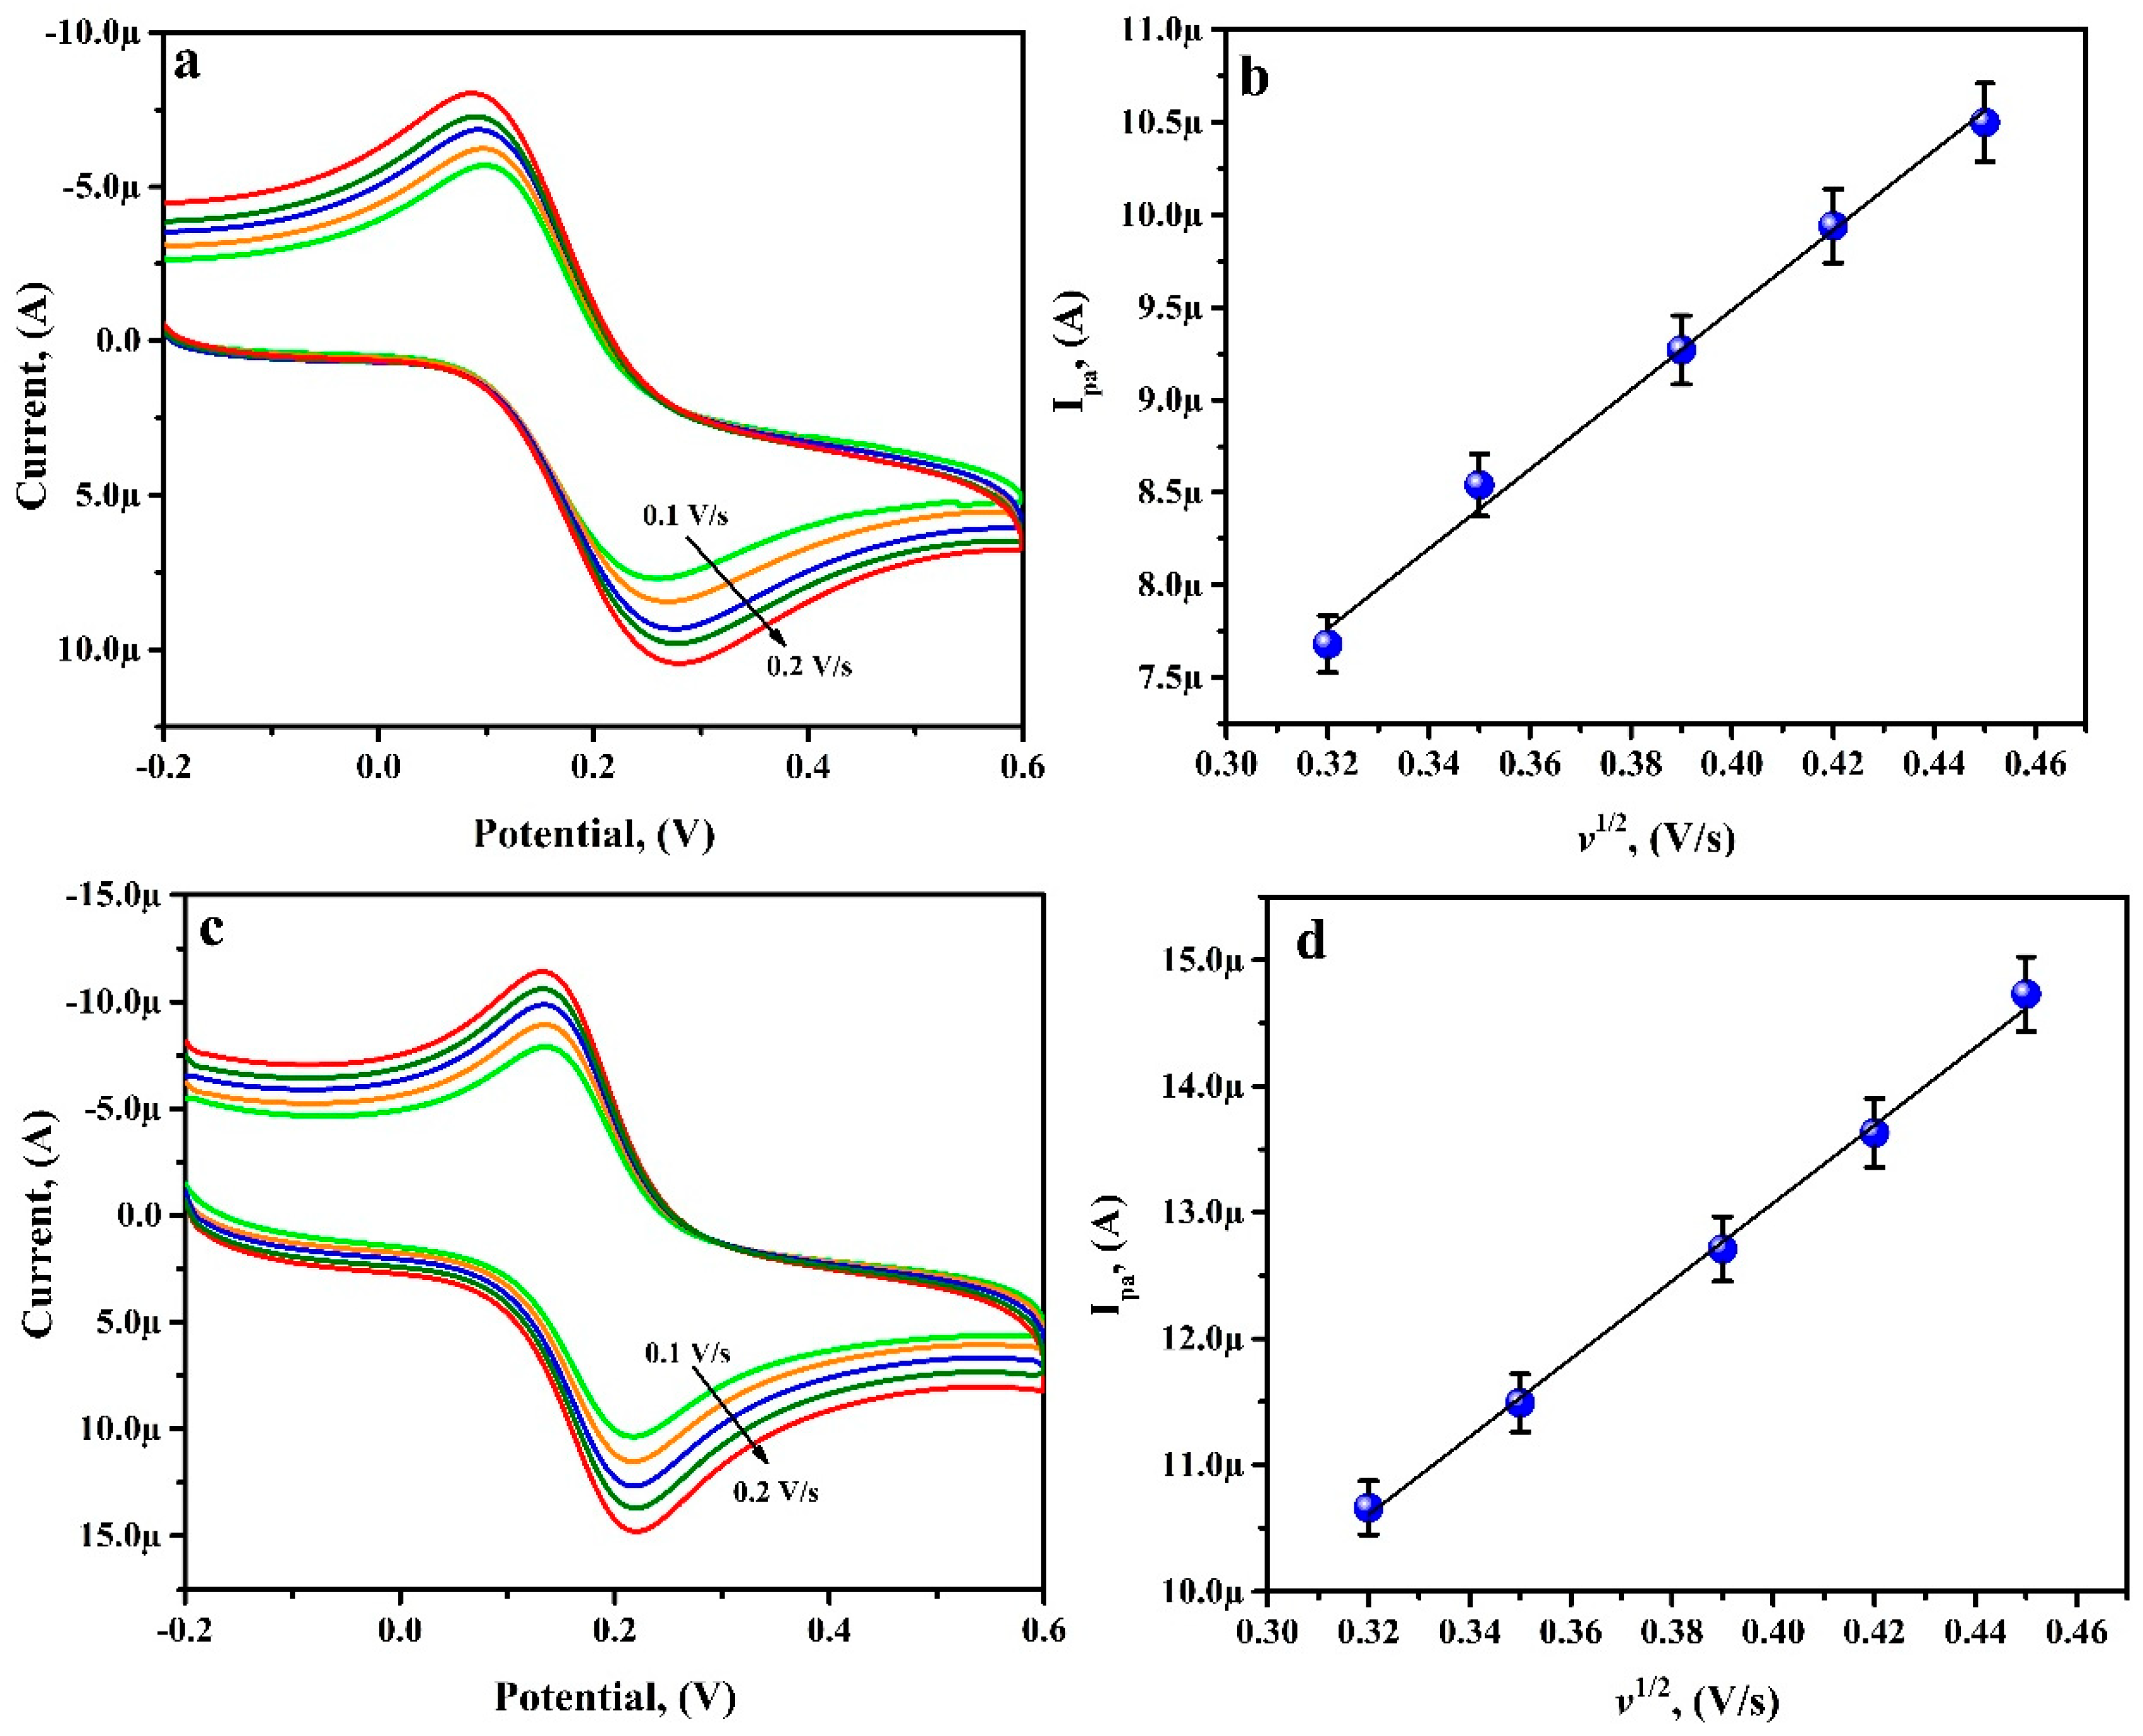
Using the conventional redox probe, the CVs were carefully examined at a range of scan rates from 0.1 V/s to 0.2 V/s. Figure 3a,c shows that, along with the linear increase in the redox peak current, the Epa and Epc shift to further positive and further negative sides, respectively. The plot of Ipa versus ʋ1/2 (Figure 3b,d) expresses linearity with R2 value of 0.9920 and 0.9932 for the BGPE and the PGAMGPE, respectively. The electroactive surface area of the BGPE and the PGAMGPE were calculated using Randles–Sevcik equation:
Ipa = 2.69 × 10⁵ n3/2 A Co D1/2 ʋ1/2
Ipa is the oxidation peak current (µA), n represents the number of electrons exchanged, Co represents the concentration of electroactive species, D for diffusion coefficient, and ʋ is the scan rate. The active surface area ‘A’ was determined using the slope of the plot of Ipa versus ʋ1/2. For the PGAMGPE, the electroactive surface area was higher (0.0 62 cm2) as compared with the BGPE (0.040 cm2).
The electron transfer rate constant (k0) value of the proposed electrode was calculated from the Rct value using Equation (2):
k 0 = R T n 2 F 2 A C o R c t
where C0 is the concentration of the redox probe, R stands for the gas constant (8.314 J/K mol), T stands for the temperature in K, and F stands for Faraday’s constant (96,485 C/mol). The calculated value of k0 was found to be 1.63 × 10⁻¹ cm/s.

3.3. Electrochemical Deposition of PGA Film on the Surface of the BGPE

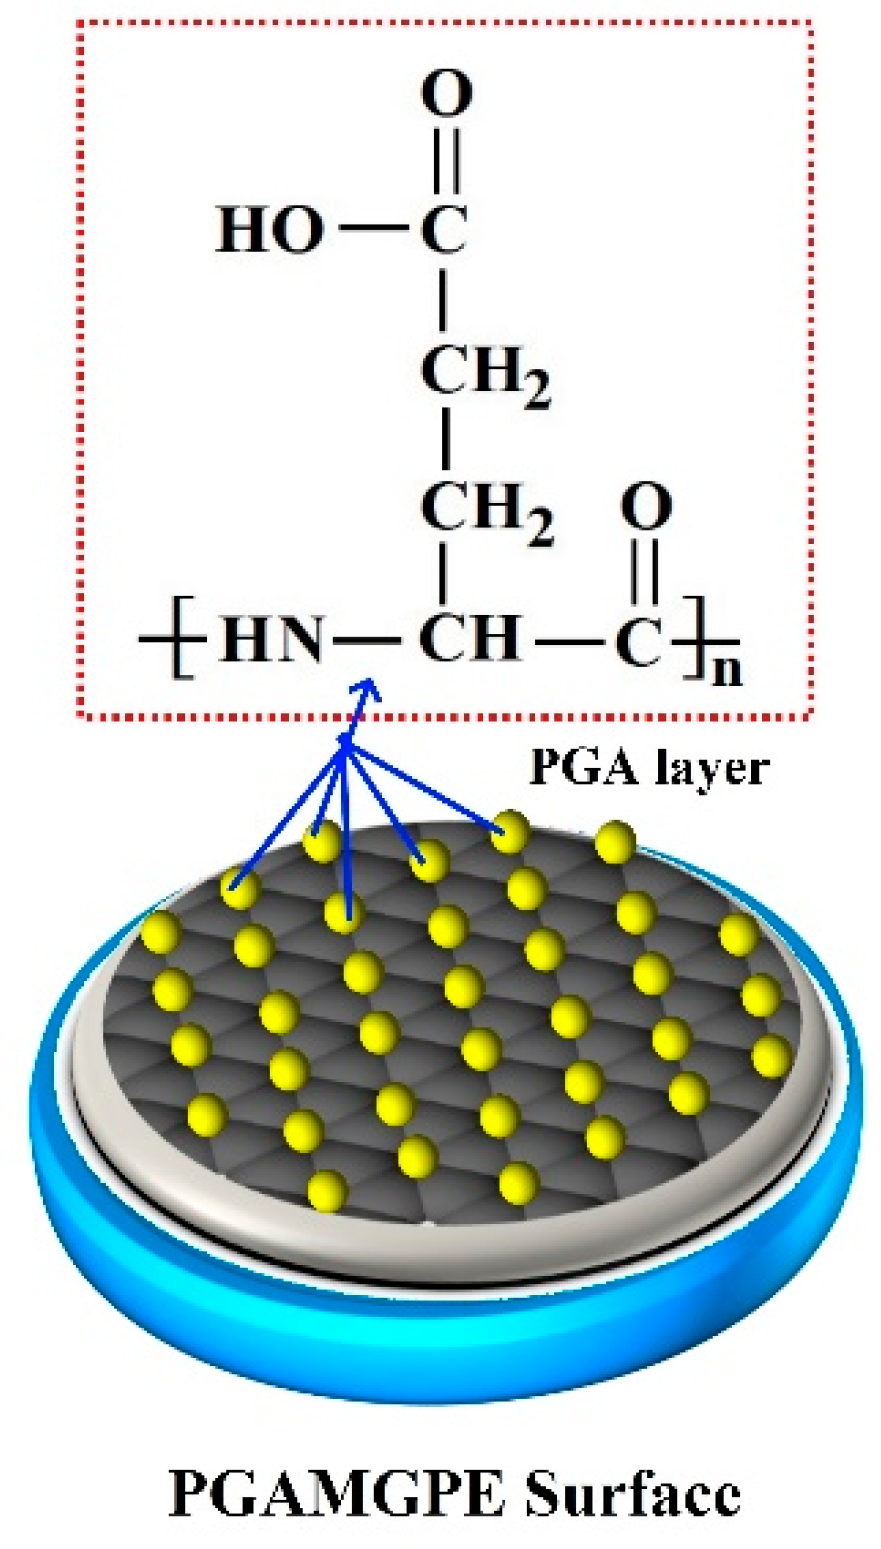
A polymer coating was formed on the surface of the BGPE, by electropolymerising 1.0 mM GA in PB of 5.5 pH. Figure 4a illustrates the CV measurements made by continuously running 10 CV cycles in the potentials between −0.1 and 1.5 V at a scan rate of 0.1 V/s in a three-electrode electrochemical cell. Steadily improved CVs with the increased cycling time revealed the change of monomer GA into PGA on the surface of the BGPE. From Scheme 1, it is obvious that PGA is formed by the repetitive polymeric linkages between the α-amino and the δ-carboxylic acid groups [24]. Scan cycles were optimised by varying it from 5 to 25 cycles to obtain a PGA film of various thickness on the surface of the BGPE. Figure 4b indicates that at the 10th cycle enhanced current sensitivity was observed since complete surface coverage of the BGPE takes place at 10th cycle which marks the increase of active sites, and after that, the electron transporting tendency of PGA gets depleted due to which the peak current gets diminished. As an outcome, it was decided that 10 scan cycles would be ideal for further investigation.

3.4. Influence of Supporting Electrolyte

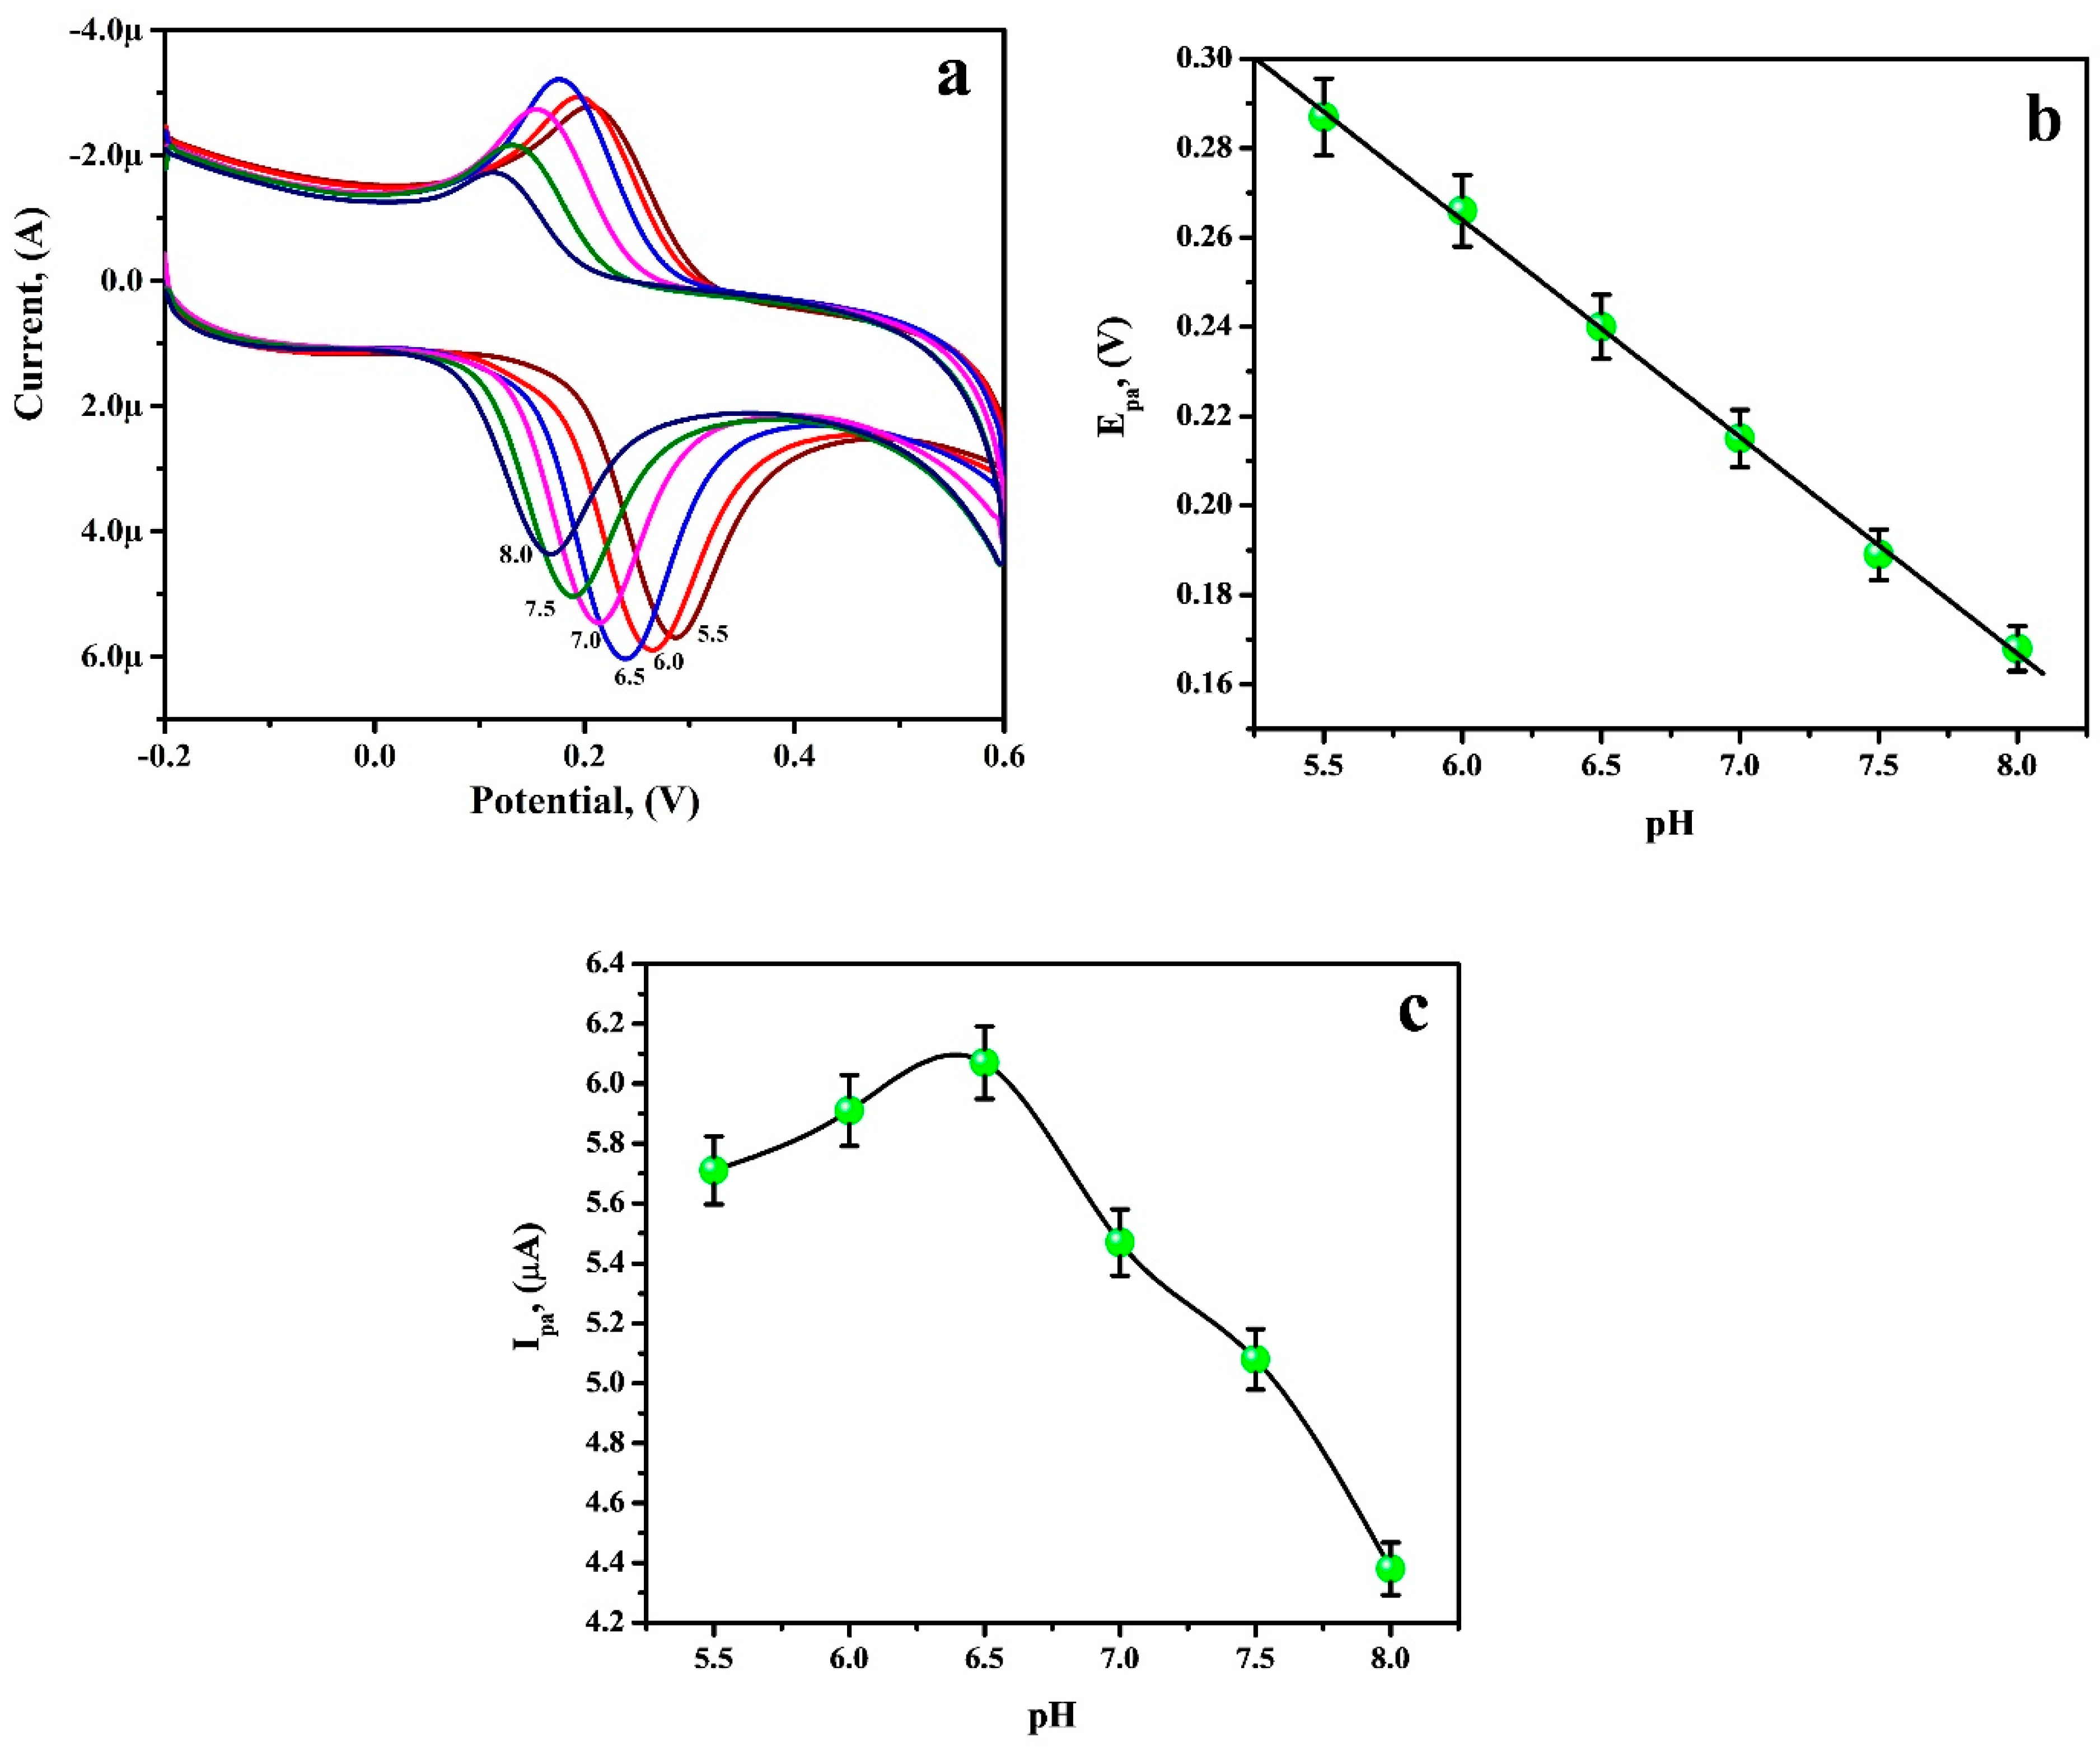
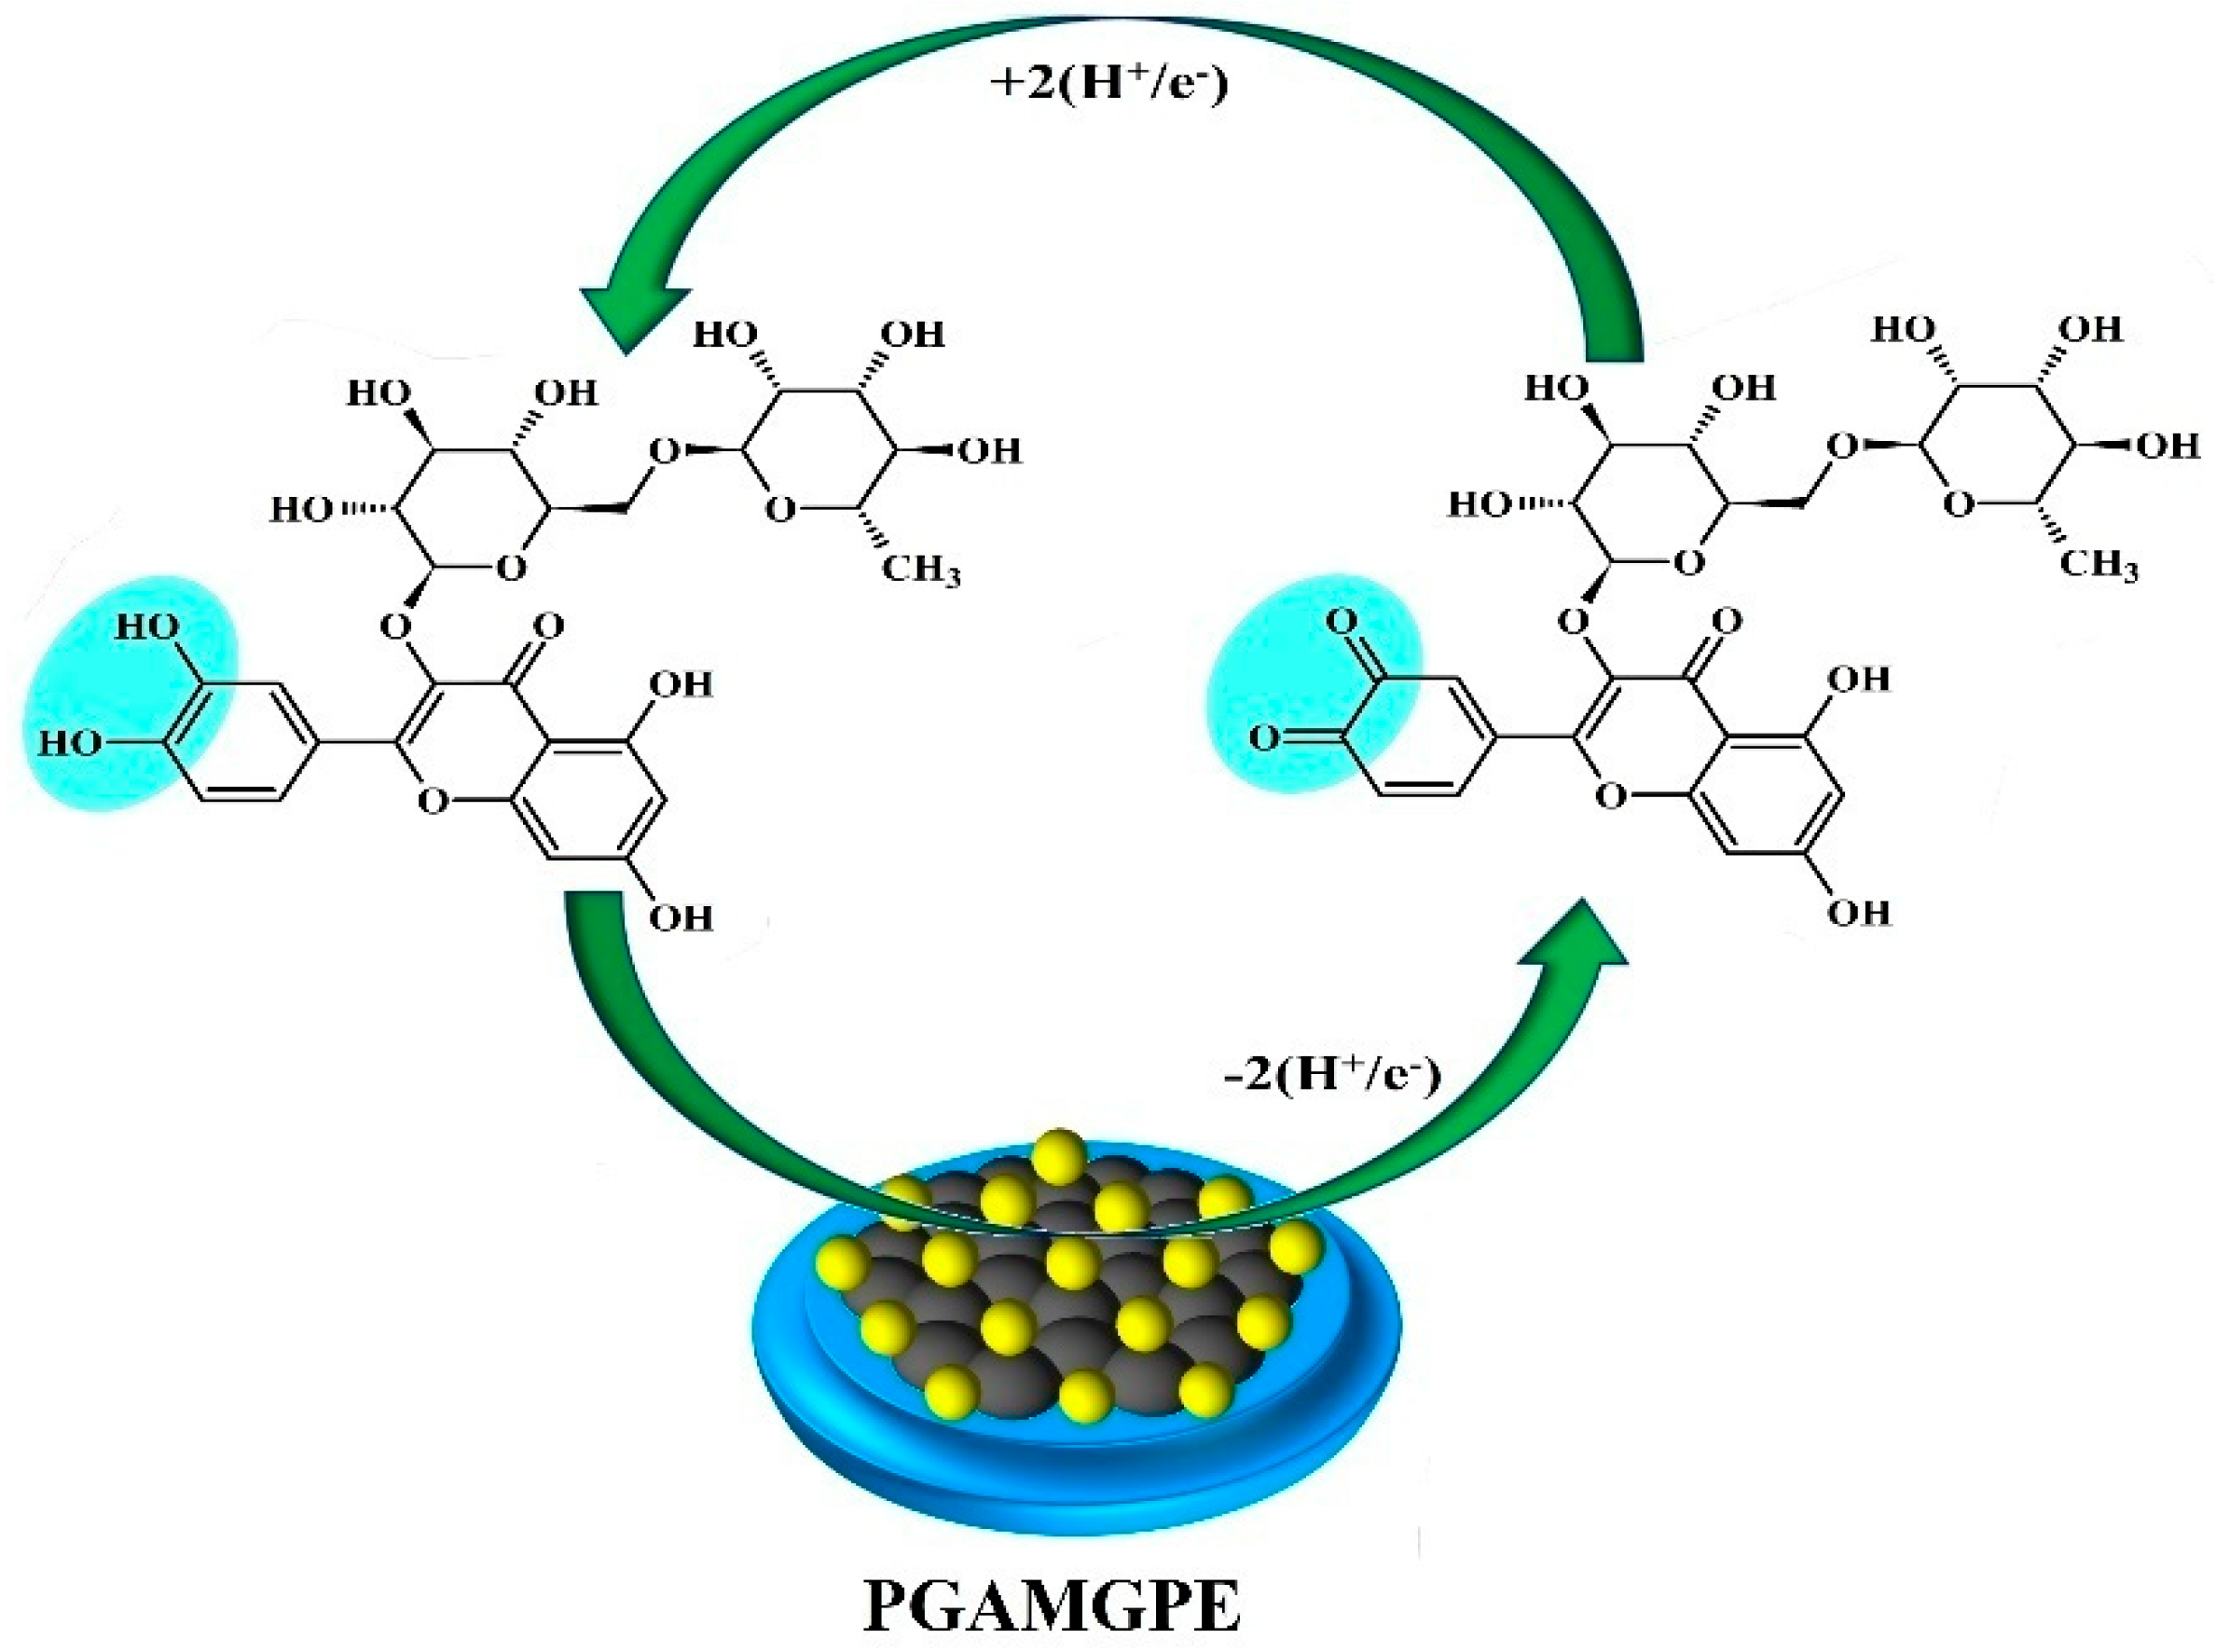
The electrochemical behaviour of RU on the PGAMGPE is significantly influenced by the buffer’s pH. It is possible to achieve a sharper response accompanied by increased sensitivity by optimizing the pH of a solution. Therefore, by using the CV technique, the effect of pH on the redox potential and current in 0.2 M PB at different pH levels extending from 5.5 to 8 was evaluated. The cyclic voltammogram generated by changing the pH from 5.5 to 8.0 is as shown in Figure 5a. The linearity equation Epa [V] = 0.5550 – 0.0500 [V/pH] with R2 = 0.9994 represents the linear relationship between Epa and pH (Figure 5b). It is clear from Figure 5b that as the pH rises, the peak potential shifts to the less positive side. The slope value of 0.050 V/pH is very near to the expected value of 0.059 V/pH, indicating that there are exactly the same number of proton and electron transfers occurring during the electrochemical oxidation of RU at the PGAMGPE. The CV outcome demonstrates that ΔIp value rises with rising pH, reaches an enhancement at 6.5, and then falls. Based on the plot ‘Ipa versus pH’ (Figure 5c) pH 6.5 shows an enhanced peak current, and hence, it was considered to be the optimal condition for further analysis. Peak current magnitude is related to the rate of the electrochemical redox process. The probable mechanism is represented in Scheme 2. The number of protons involved in the electrochemical redox reaction of RU was found out by the Nernst Equation (3) [25]:
B = 2.303   m R T n F
where B defines the slope of plot Epa versus pH, m: the number of participated protons, and terms such as R, T, and F gas constant, experimental temperature and Faraday constant have their own physical significant values. The computed value of the proton count was determined to be 1.72, almost equivalent to 2.

3.5. Optimisation of Accumulation Potential and Time

The accumulation time and potential are the vibrant parameters to enhance the highest adsorption of RU at the surface of PGAMGPE to attain a fine electrochemical reaction with low LOD and great sensitivity [26]. Figure 6a indicates an amplified redox peak current in the potential scale of −0.250 to 0.60 V, signifying that at this accumulation potential window utmost adsorption of RU at the PGAMGPE surface occurs. Hence, for the investigation of RU, the potential gap of −0.250 to 0.60 V was chosen as the best accumulation potential gap. Figure 6b shows the plot of time versus Ipa, which unveils that from the obtained electrochemical results at different values of ACT from 0.0 to 100.0 s, the maximum Ipa of RU was attained at 40.0 s. The decrease in RU current that possibly occurred due to the electrode surface getting saturated due to the full surface coverage of RU at 40 s of ACT. Therefore, the value 40 s was selected as the better accumulation time for the analysis RU.

3.6. Electrochemical Sensing of RU at the PGAMGPE

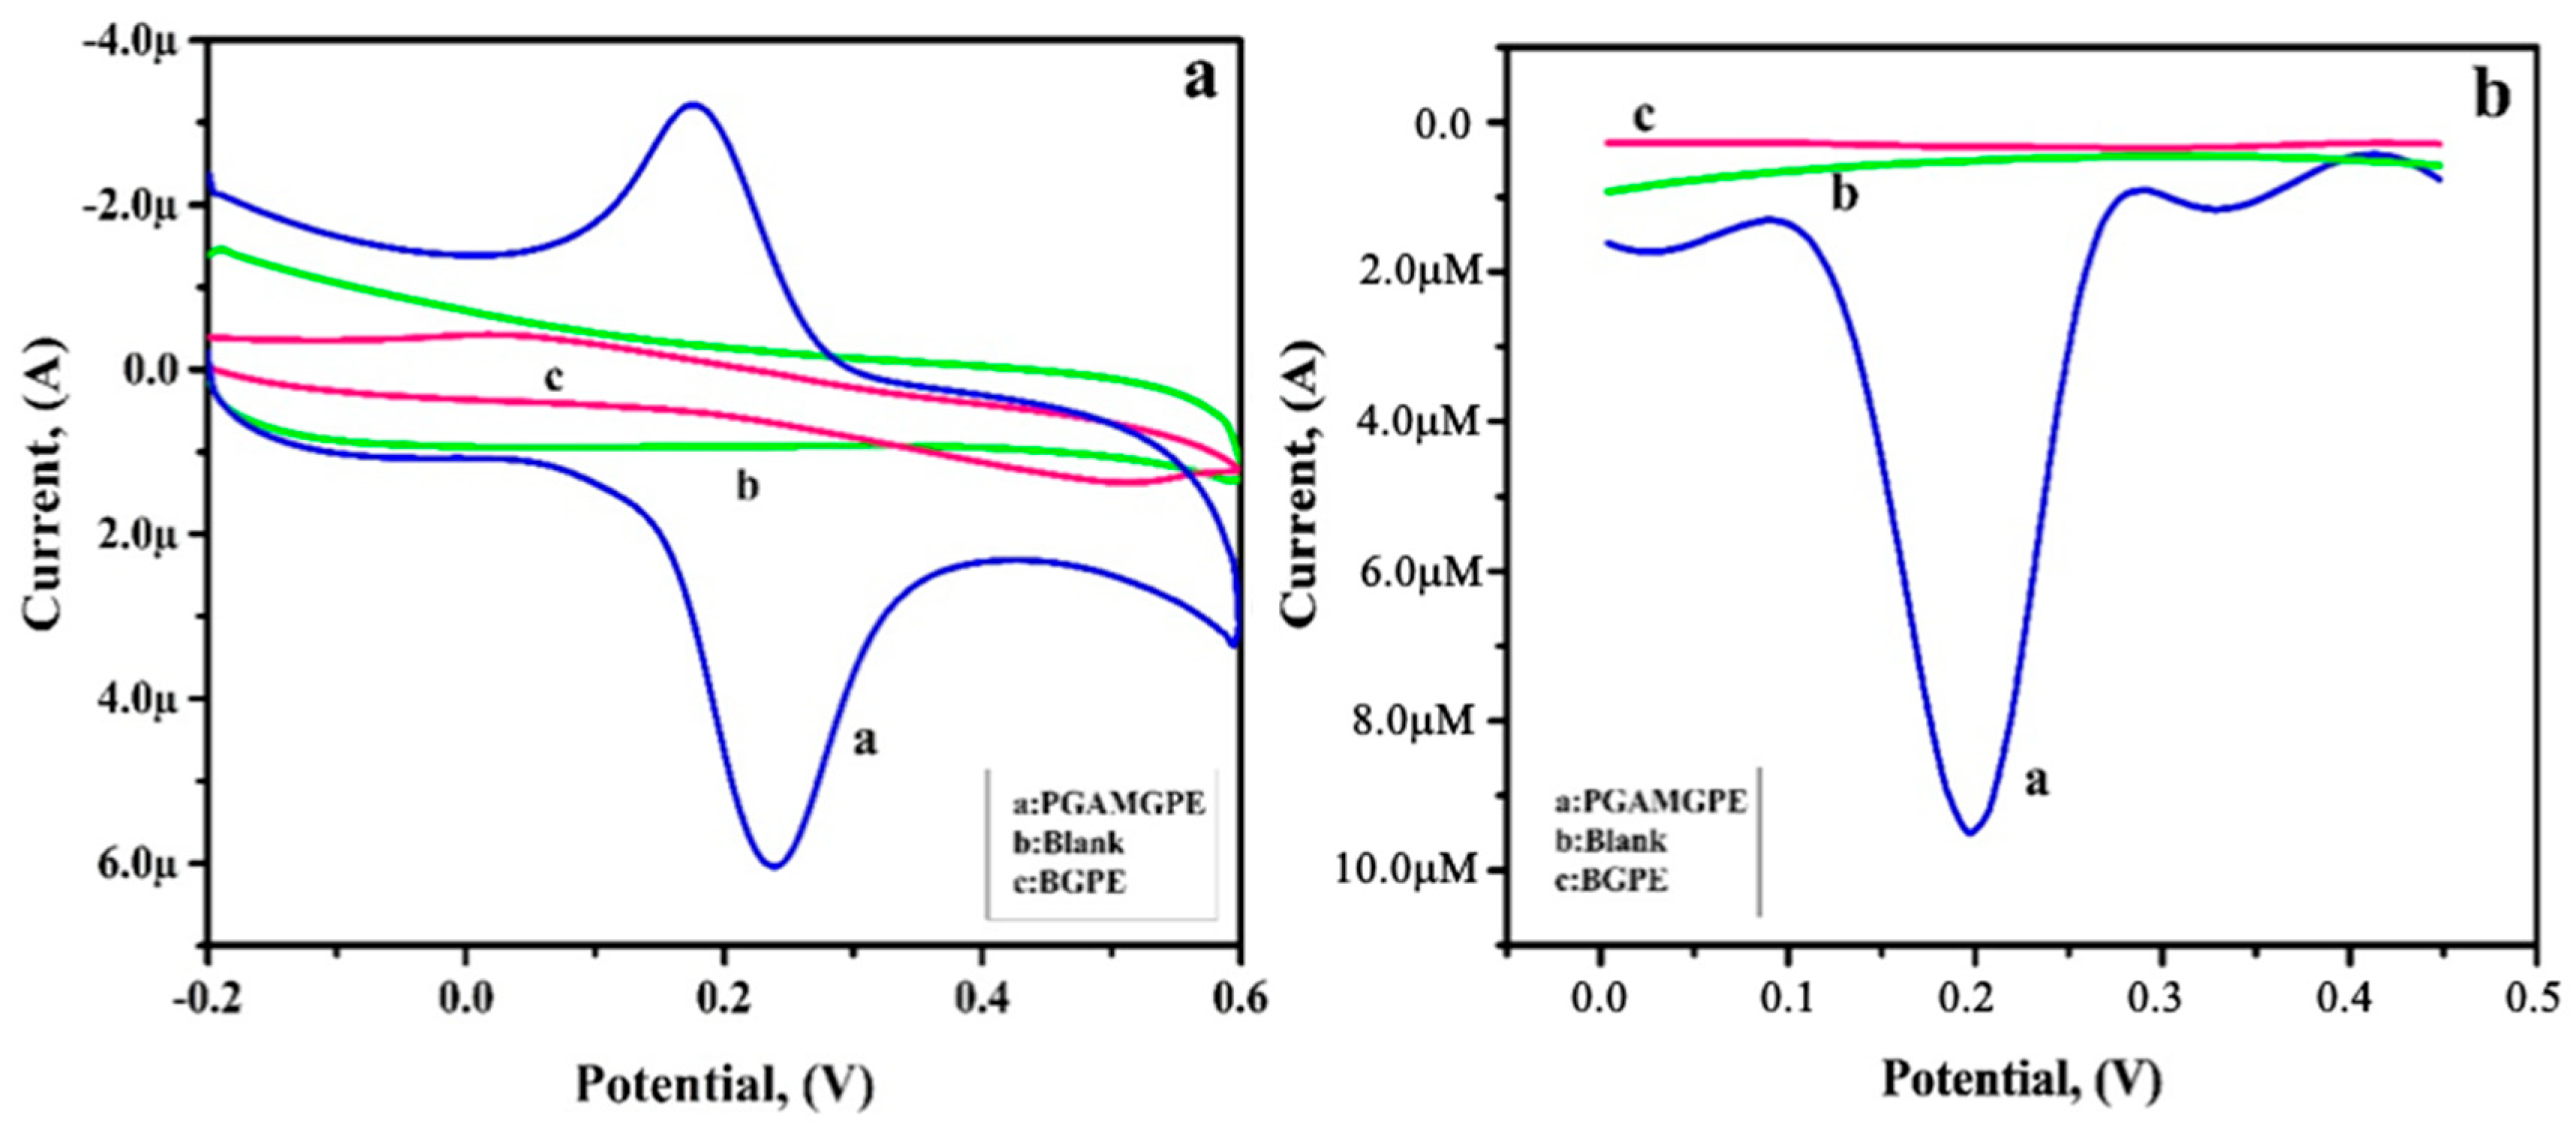
Figure 7a demonstrates that the response of CV for 0.1 mM RU displays a less noticeable electrochemical redox peak at the BGPE (curve c), signifying that the adsorption of RU at the BGPE is feebler with a less sensitive electrochemical reaction. It can, however, produce two peaks at the PGAMGPE (curve a) electrode surface in 0.2 M PB of pH 6.5 with the Ipa and Ipc of 5.37µA and −3.45 µA, respectively. The Epa and Epc are 0.240 V and 0.180 V, with a peak separation of about 0.060 V and the Ipa/Ipc ratio of 1.55, demonstrating electrochemical reversibility for RU at the PGAMGPE. This should be credited to the accumulation and promotion effect of PGA which increases the rate of electron transfer. Similarly, during the absence of RU molecule (curve c) in PB at the PGAMGPE, we did not notice any of the redox peak. The results of differential pulse voltammograms (DPVs) (Figure 7b) parade the electrochemical activity of RU on the surfaces of the PGAMGPE (curve a) and the BGPE (curve c) and of the blank solution. At the PGAMGPE, an enhanced peak current is observed in comparison to the BGPE for RU. Likewise, the DPV response for only 0.2 M PB solution does not display any peak current (curve b).
The surface concentration ‘Г’ of RU on the PGAMGPE surface was found to be 1.7 ÅM/cm2 based on the following equation [27]:
Q = nFAΓ
Here, n is the number of electrons involved, and Q is the charge from the area of the CV peak under ideal conditions.

3.7. Potential Scan Rate Effect

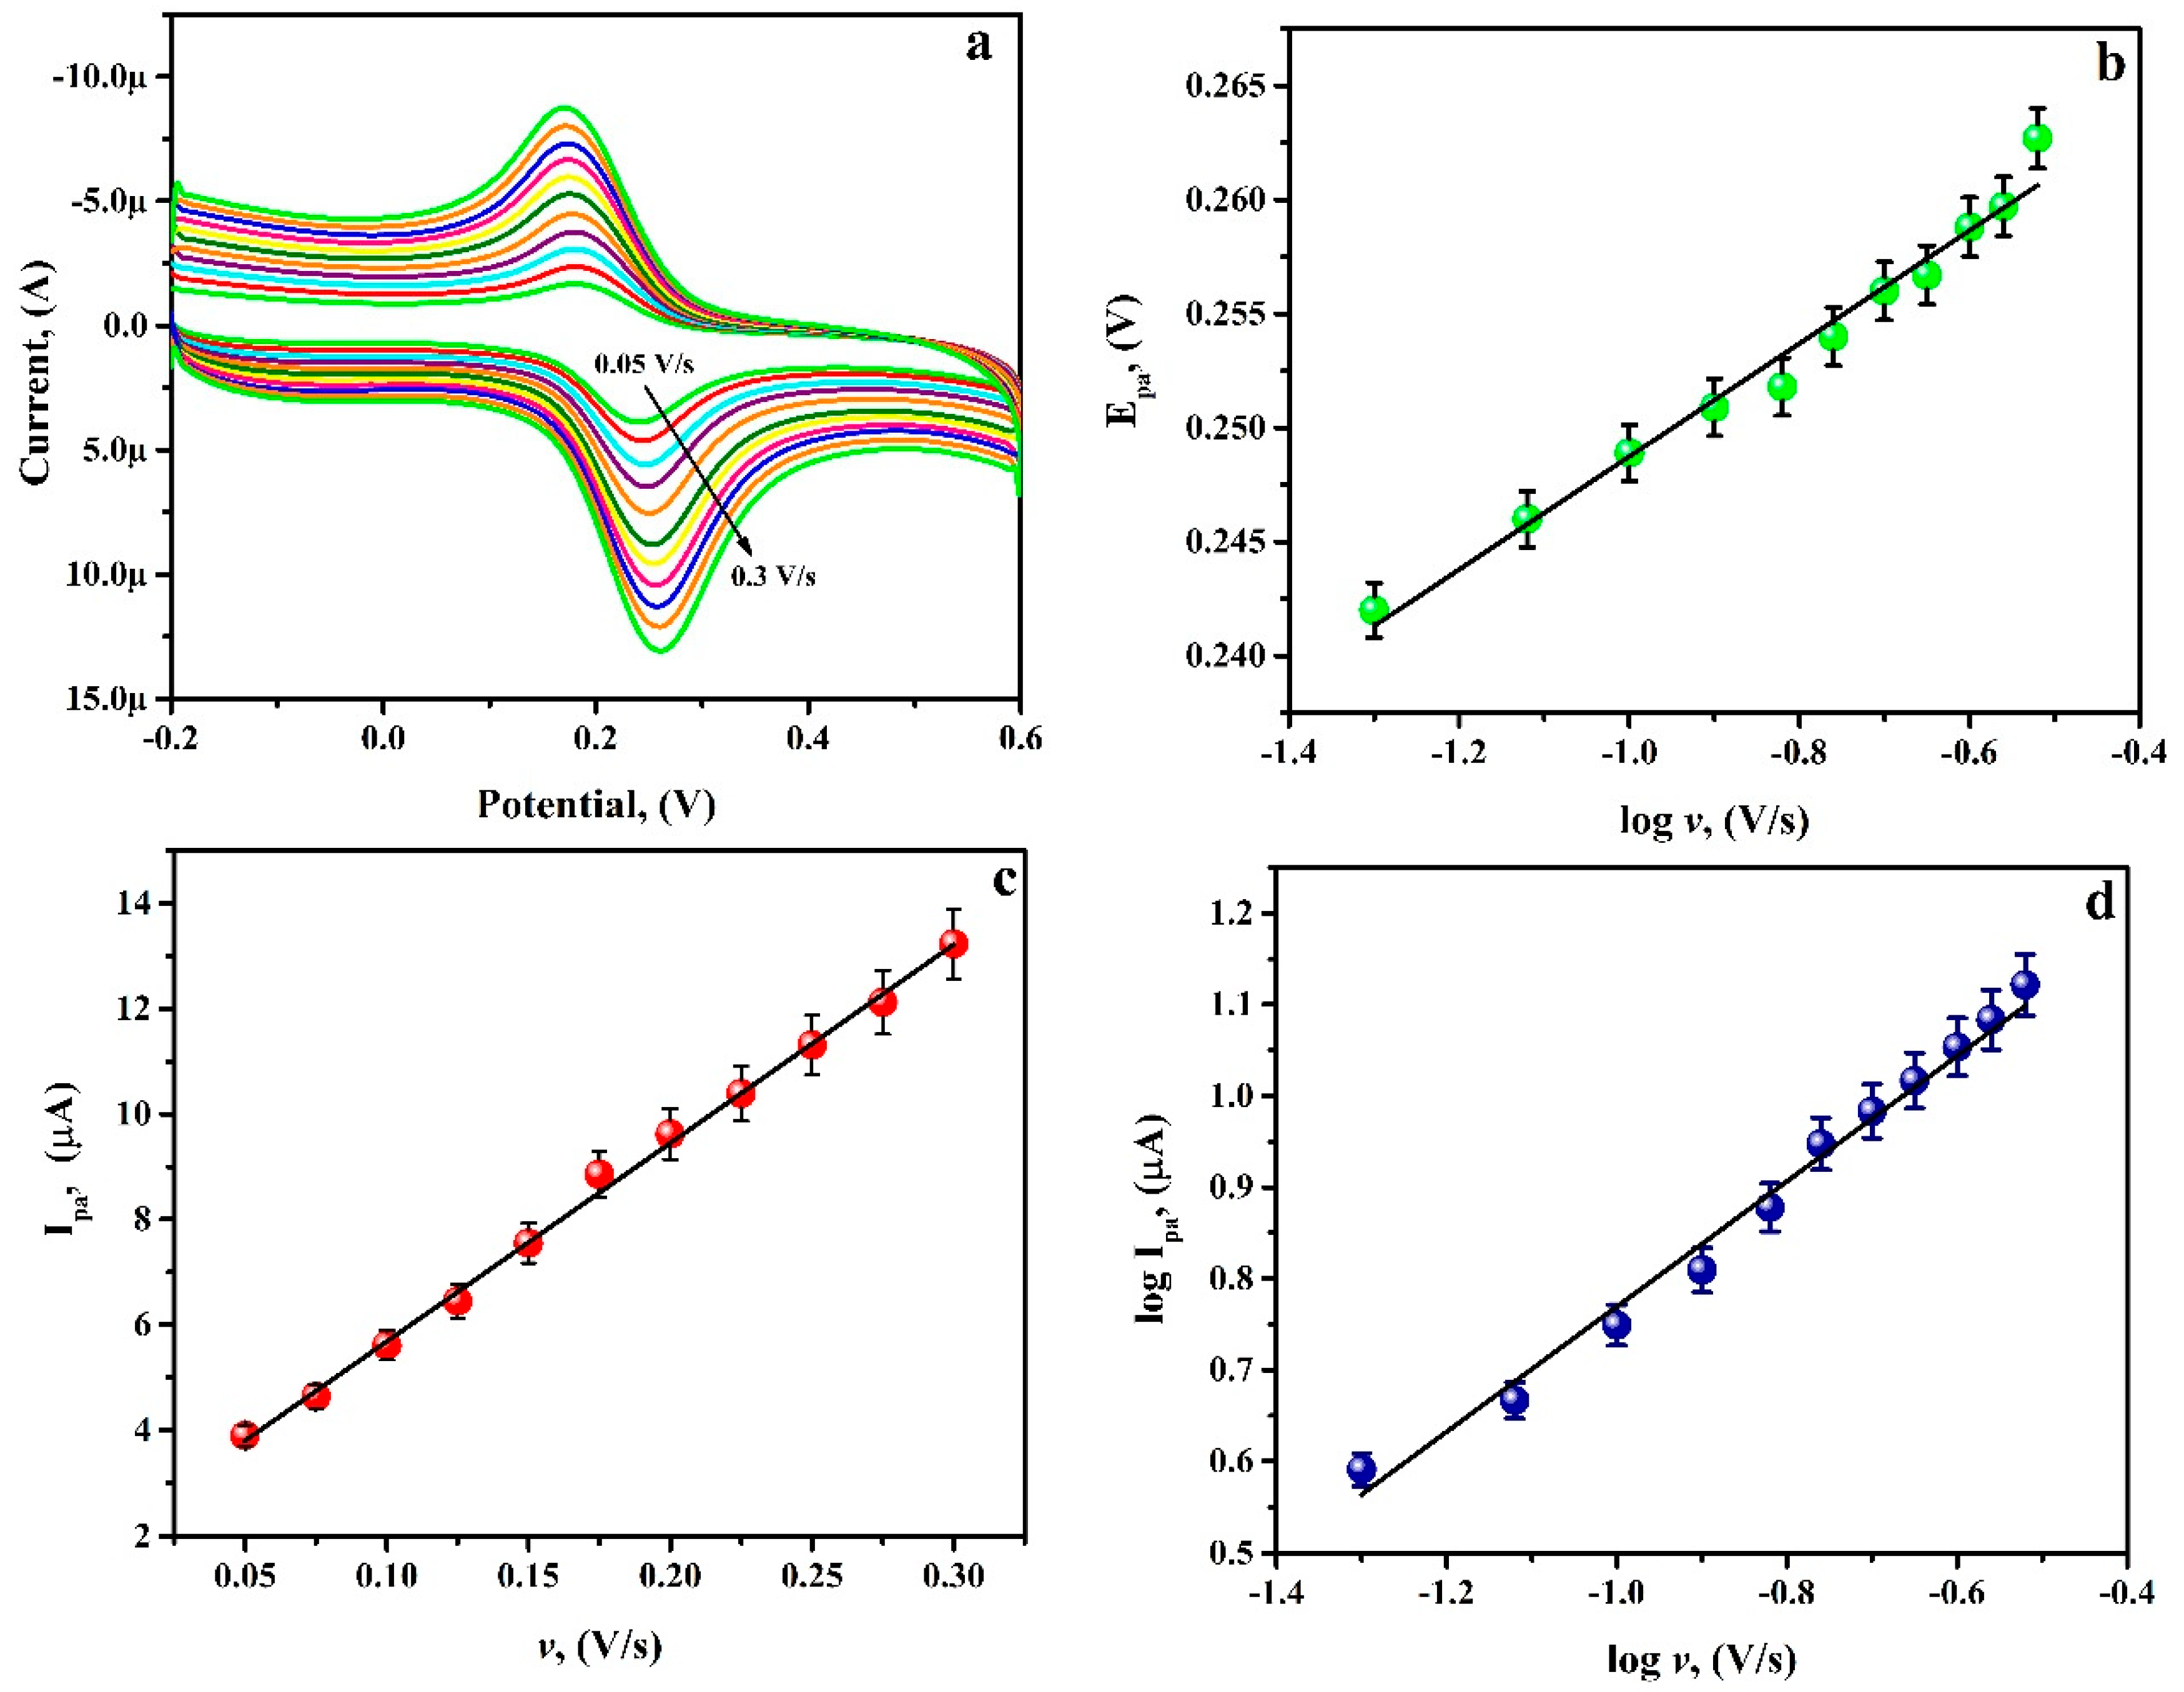
The scan rate effect on the electrochemical peak current of RU in pH 6.5 of PB at the PGAMGPE was studied. From Figure 8a, it is obvious that a distinct reversible redox peak was attained and the CVs gradually increased with the scan rate from 0.050 to 0.30 V/s, and when the potential scan rate rises, the positive shif of Epa and the negative shift of Epc with the increase in the peak separation was observed. This shows that the rate of electron transfer is not relatively fast and that the reversibility of the electrochemical reaction eventually decreases [28]. The plot of log ʋ against Epa shows good linearity with the equation as follows (Figure 8b):
Epa[V] = 0.2736 + 0.0249 log ʋ, (V/s) (R2 = 0.9989)
Furthermore, the plot of Ipa against ʋ (Figure 8c) and the plot of log Ipa against log ʋ (Figure 8d) shows a good linear correlation and the corresponding linear regression equations are:
Ipa (μA) = 37.65 + 1.9185 ʋ (V/s) (R2 = 0.9954)
log Ipa (µA) = 1.4754 + 0.9989 log ʋ, (V/s) (R2 = 0.9980)
which specifies that the electrochemical reaction process of RU at the PGAMGPE surface is controlled by an adsorption pathway. The slope of Equation (7) is in close proximity with the hypothetical value of one for the adsorption-controlled reaction pathway [29]. Considering the slope of Ipa versus scan rate, Equation (8) estimates that there were two electrons transported, which indicates a two-electron and two-proton mechanism for RU [30].
I p a = n 2 F 2 v A Γ 4 R T = n F Q v 4 R T
The charge transfer coefficient (α) was premeditated by the Bard and Faulkner relation (Equation (9)) and was obtained to be 0.36:
α n = 47.7 E p a E p a 2
Epa/2 represents the half wave anodic potential, and Epa is the anodic potential under the optimised condition at 0.1 V/s scan rate.
Figure 8. (a) CVs for 0.1 mM RU at PGAMGPE in pH 6.5 at different scan rates ranging from 0.050 to 0.30 V/s. (b) Graph of Epa versus log ʋ. (c) Graph of Ipa versus ʋ. (d) Graph of log Ipa versus log ʋ.
Diagnostics 12 03113 g008

3.8. Analysing Capability of PGAMGPE towards RU
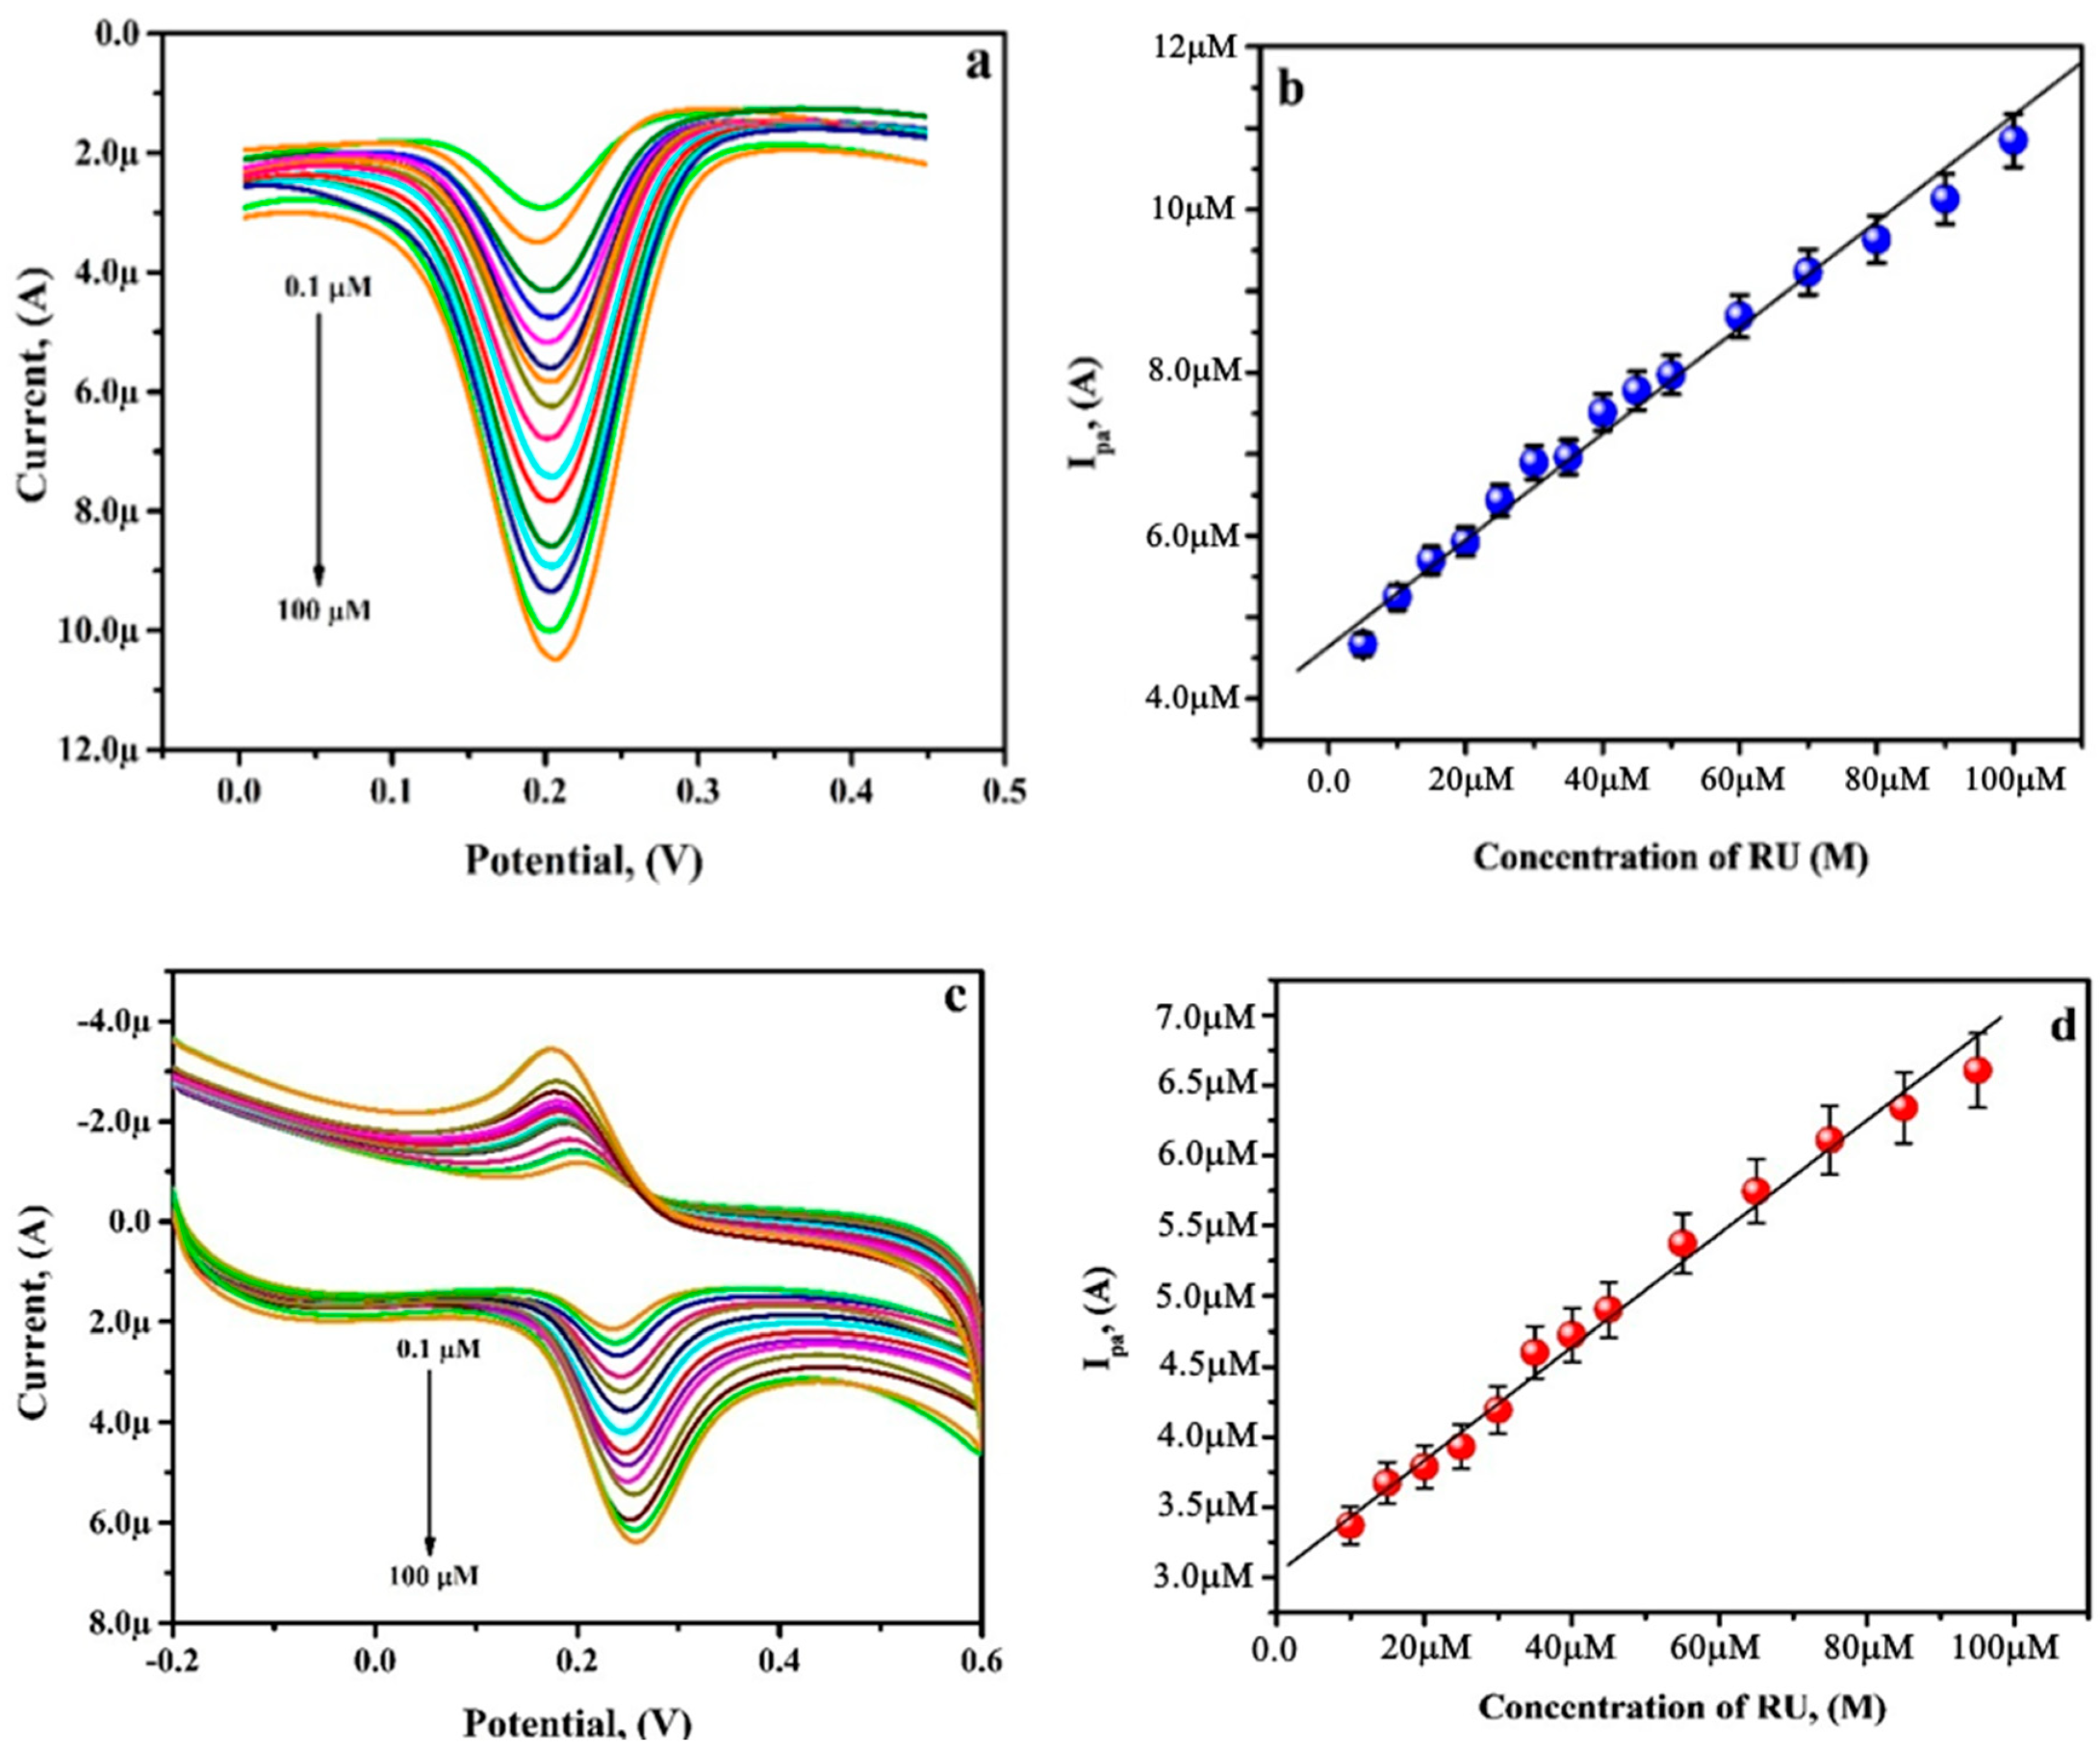
The BGPE and the PGAMGPE’s electrocatalytic capabilities were examined using the CV and DPV procedures under ideal conditions. In the DPV and CV voltammograms shown in Figure 9a,c, an increase in the peak current is observed concurrently with an increase in concentration from 0.1 µM to 100 µM. The calibration plot of DPV (Figure 9b) and CV (Figure 9d) displays that the RU oxidation peak current at the PGAMGPE has good linear proportionality to its concentration over the range of 0.10 to 100.0 µM in PB. The linearity fitted results are as follows:
Ipa (µA) = 4.6429 × 10⁻⁶ + 0.6652 [RU](M), (R2 = 0.9930) by DPV method
Ipa (µA) = 3.0283 × 10⁻⁶ + 0.4403 [RU] (M), (R2 = 0.9947) by CV method
The LOD and limit of quantification (LOQ) at the surface of the PGAMGE were assessed by considering the slope values (B) of the calibration plot and standard deviation (S) of the blank solution in the following relations [31]:
L O D = 3 S N
L O Q = 10 S N
The premeditated LOD and LOQ were achieved to be 0.04 µM and 0.15 µM using the DPV method and 0.06 µM and 0.21 µM using the CV method, respectively. The sensitivity of the modified electrode was found to be 10.72 A/M/cm2, which was calculated by the equation
S e n s i t i v i t y = B A
Figure 9. (a) DPVs for varying concentrations of RU ranging from 0.10 to 100.0 μM in PB on PGAMGPE. (b) Plot of [RU] versus Ipa. (c) CVs for varying RU concentrations ranging from 0.10 to 100.0 μM, in PB at PGAMGPE. (d) Plot of [RU] versus Ipa.
Diagnostics 12 03113 g009
A is the electrochemical surface area of the modified electrode and B is the slope of the calibration plot. The results given for the analytical parameters of RU at the modified surface of various electrodes are identical to the analytical parameters attained at the PGAMGPE, as shown in Table 1 [32,33,34,35,36,37,38,39,40]. Additionally, the PGAMGPE results validate that the PGAMGPE is an appropriate tool for the sensitive electrochemical detection of RU with a significant improvement in the simplified fabrication process.

3.9. Simultaneous Analysis of RU and CF

RU is a bioflavonoid naturally found in certain foods such as apple peels, green tea, black tea, onions, and many citrus fruits. In addition to acquiring it from food, RU is also available as a supplement in the form of pills or capsules. The phytochemical nature of RU offers pharmacological benefits for the treatment of a number of chronic diseases, including diabetes, hypertension, high blood cholesterol, and cancer. As a result, RU has a wide range of positive impacts on human health. CF is also an alkaloid extensively found in natural products used in beverages. Numerous physiological effects include diuresis, activation of the central nervous system, and stomach acid secretion. CF combined with nonsteroidal anti-inflammatory medicines in analgesic formulations is therapeutically used to alleviate migraines [41]. So, it has been suggested that RU and CF may have similar in vivo effects [42]. Hardly any methods have been tested for the concurrent analysis of RU and CF. Hence, the fabricated sensor is used for the concurrent determination of RU and CF.
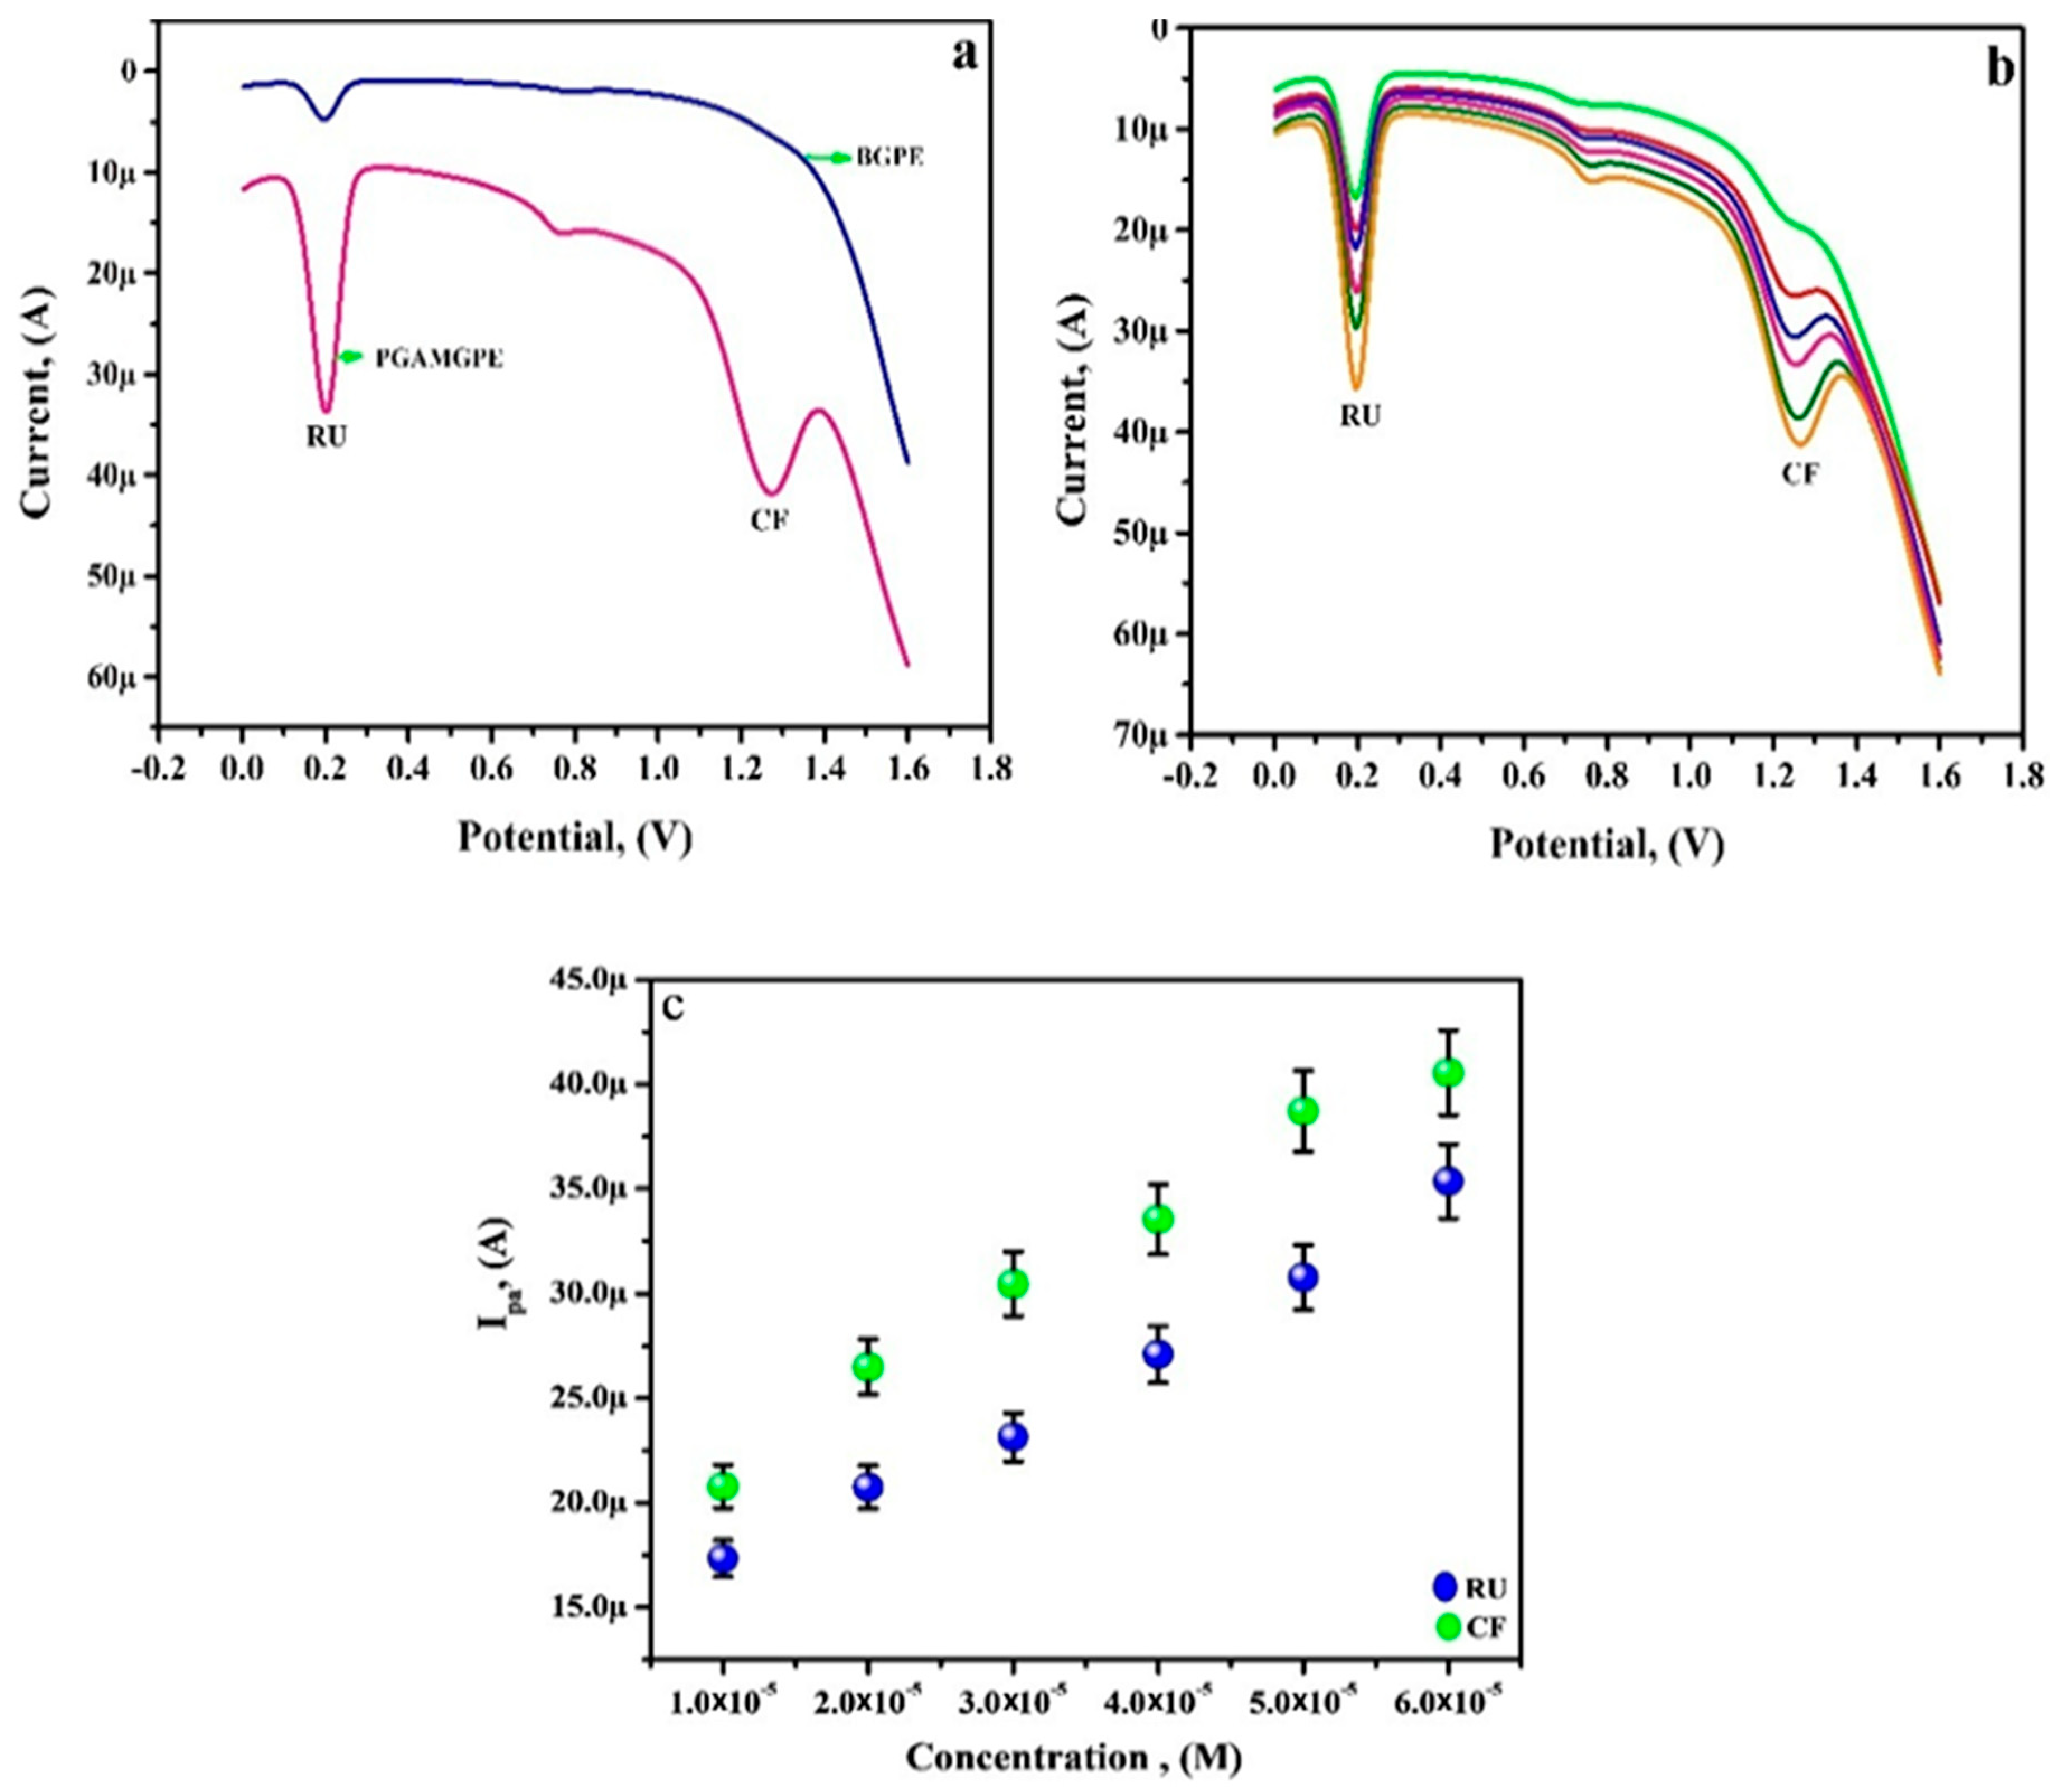
Using the PGAMGPE, the simultaneous measurement of 0.1 mM solutions of RU and CF was accomplished in PB at 0.1 V/s scan rate. Figure 10a displays the DPV for concurrent analysis of RU and CF at the PGAMGPE and at the BGPE. The DPV for the simultaneous determination of RU and CF at the PGAMGPE and at the BGPE is shown in Figure 10a. For RU and CF, the PGAMGPE exhibits two well-separated peaks with higher current responsiveness at peak potentials of 0.2014 V and 1.2580 V. The DPV obtained by gradually increasing the concentration of RU and CF from 10 µM to 60 µM under optimal conditions is shown in Figure 10b. The voltammograms produced demonstrate that the peak current increases as concentration increases. The plot of Ipa versus [RU] and [CF] (Figure 10c) displays linearity with correlation coefficients of 0.9920 and 0.9921. RU and CF can, therefore, be determined simultaneously using the PGAMGPE with a favourable performance.

3.10. Interference Analysis

The choosiness of the modified electrodes will be severely influenced by the presence of certain inactive substances in pharmaceutical samples that are formed alongside the active ingredient of the prescription drug. Under ideal conditions and with the presence of concentrated solutions of some foreign substances such as glycine, caffeine, glucose, and urea, DPV analysis of RU (0.1 mM) at the PGAMGPE was performed. Biologically present cations such as Na+, Mg2+, K+, and Ca2+ were added to the modified sensor in order to study its selectivity. The observations demonstrated that the presence of possible interferents has no influence on the redox potential of RU and that the PGAMGPE may be utilised to accurately determine RU.

3.11. Assessment of Stability, Reproducibility, and Repeatability

The stability of the PGAMGPE was analysed by verifying CVs of 60 segments for RU in PB. The degradation percent of the current response was premeditated by calculating the preliminary (Ipa (1)) and final currents (Ipa (n)) which was found to be 98%. Since 98% of the original current was continued even after 30 cycles, the constructed sensor was found to be stable. The reproducibility of the electrode was recorded by running five consecutive CV cycles for RU in PB at four independently modified PGAMGPEs. The attained RSD value of 4.51% conveys that the PGAMGPE is reproducible with high accuracy. Five successive CVs with the same modified electrode yielded a stable, repeatable peak that had an RSD of 3.89% for four trials, signifying that the PGAMGPE may be operated for multiple measurements.

3.12. Analytical Application of PGAMGPE

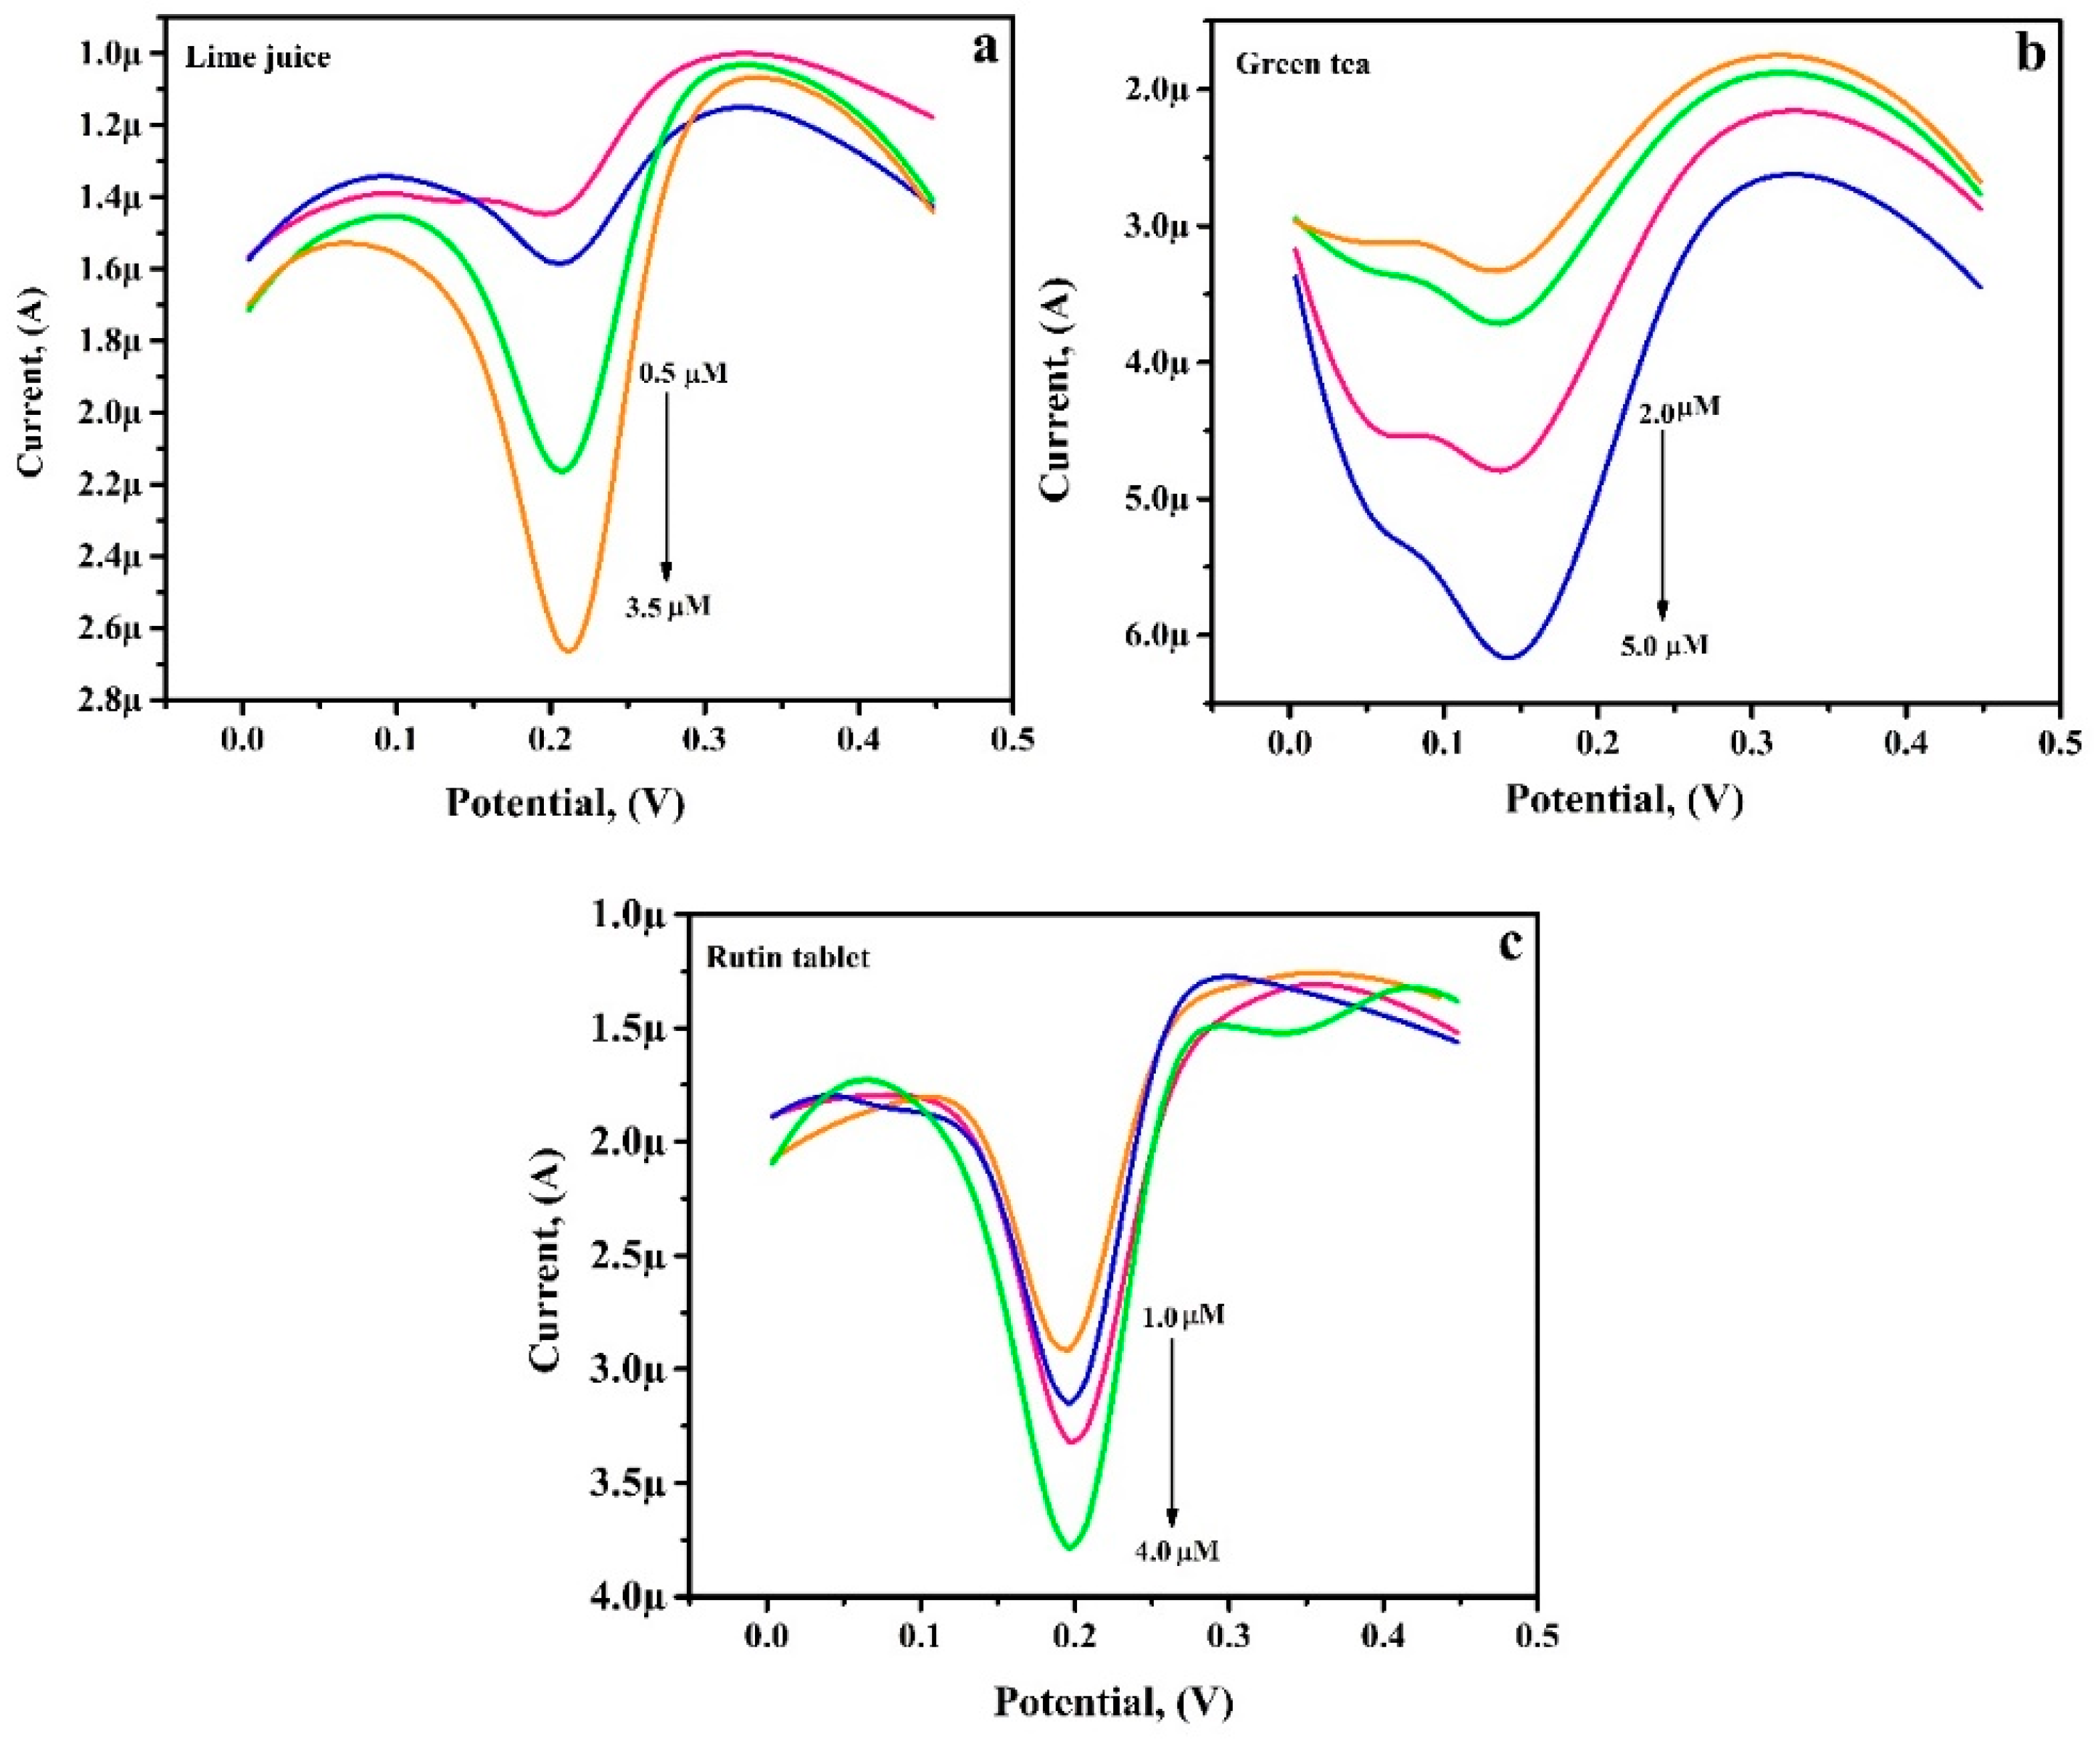
The analytical utility of the PGAMGPE for the examination of RU was verified in samples such as lime juice, green tea, and tablet samples by the DPV technique. According to the analytical DPV responses for lime juice from 0.5 to 3.5 µM (Figure 11a), green tea from 2.0 to 5.0 µM (Figure 11b), and RU tablets from 1.0 to 4.0 µM (Figure 11c) under optimised conditions, the peak current rises as the concentration of the real samples does. The RU real sample solutions were analysed by diluting them with 0.2 M PB of pH 6.5 with concentrations ranging from 10 to 40 µM. Since, initially, there were no electrochemical peaks for RU in the diluted lime juice sample, the standard addition procedure was used. However, RU-containing green tea and tablet samples display the electrochemical reaction for RU without adding a commercial sample of RU. Because of the excellent recovery, the modified electrode (PGAMGPE) is appropriate for all real sample studies. The outcomes are listed in Table 2.

4. Conclusions

In the current research work, the PGAMGPE was effectively used to examine the electrochemical redox reaction nature of RU. FE-SEM, EIS, and CV techniques were used to successfully characterise the fabricated sensor materials. The PGAMGPE displays a high catalytic nature in comparison with the BGPE for electrochemical redox reaction of RU with an improved current sensitivity using CV and DPV methods. The most efficient redox reaction process was obtained at pH 6.5, demonstrating that it is adsorption-controlled and includes two electrons and two protons. The impact of accumulation potential and time on electrochemical behaviour of RU at the PGAMGPE was deliberated effectively. The PGAMGPE achieves an acceptable linear range for varying RU concentrations with a low LOD of 0.04 µM and 0.06 µM by DPV and CV approaches, respectively. Additionally, the PGAMGPE provided remarkable recovery for RU in lime juice, green tea, and tablet samples. The PGAMGPE can become the utmost relevant sensing device for the examination of RU on account of its remarkable electrocatalytic activity and certain advantageous properties including great analysing efficiency, high selectivity, sensitivity, repeatability, reproducibility, and stability.

Author Contributions

Conceptualization, B.M.A., J.G.M. and H.N.; methodology, B.M.A., J.G.M. and H.N.; validation, B.M.A., J.G.M. and H.N.; investigation, B.M.A., J.G.M. and H.N.; data analysis, B.M.A., J.G.M. and H.N.; writing—original draft preparation, B.M.A., J.G.M. and H.N.; writing—review and editing, B.M.A., J.G.M., H.N., A.M.T., M.D.A. and M.S.; supervision, J.G.M.; software, B.M.A. and H.N. All authors have read and agreed to the published version of the manuscript.

Funding

N. Hareesha is grateful for the financial support from the Department of Science and Technology, Govt. of India for the INSPIRE Fellowship (Registration number: IF180479). Ammar M. TIGHEZZA and Munirah D. Albaqami are grateful for the Researchers Supporting Project Number (RSP-2021/267), King Saud University, Riyadh, Saudi Arabia.

Institutional Review Board Statement

Not applicable.

Informed Consent Statement

This article is original, has not been published previously in any form or language, and is not under consideration for publication elsewhere.

Data Availability Statement

The data underlying this article are presented in the main manuscript. The datasets generated during and/or analysed during the current study are available from the corresponding author upon reasonable request.

Conflicts of Interest

We have no known potential competing financial interests or personal relationships that could have appeared to influence the reported work.

References

  1. Enogieru, A.B.; Haylett, W.; Hiss, D.C.; Bardien, S.; Ekpo, O.E. Rutin as a Potent Antioxidant: Implications for Neurodegenerative Disorders. Oxid. Med. Cell. Longev. 2018, 2018, 6241017. [Google Scholar] [CrossRef] [PubMed] [Green Version]
  2. Shrestha, S.; Asgar, A.; Javed, A.; Jasjeet, K.S.; Sanjula, B. Rutin: Therapeutic Potential and Recent Advances in Drug Delivery. Expert. Opin. Investig. Drugs 2013, 22, 1063–1079. [Google Scholar] [CrossRef]
  3. Negahdari, R.; Bohlouli, S.; Sharifi, S.; Dizaj, S.M.; Saadat, Y.R.; Khezri, K.; Jafari, S.; Ahmadian, E.; Jahandizi, N.G.; Raeesi, S. Therapeutic Benefits of Rutin and its Nanoformulations. Phytother. Res. 2020, 35, 1719–1738. [Google Scholar] [CrossRef]
  4. Rodriguez-Valdovinos, K.Y.; Salgado-Garciglia, R.; Vazquez-Sanchez, M.; Alvarez-Bernal, D.; Oregel-Zamudio, E.; Ceja-Torres, L.F.; Medina-Medrano, J.R. Quantitative Analysis of Rutin by HPTLC and In Vitro Antioxidant and Antibacterial Activities of Phenolic-Rich Extracts from Verbesina Sphaerocephala. Plants 2021, 10, 475. [Google Scholar] [CrossRef] [PubMed]
  5. Zhang, F.; Qi, X.; Zou, M.; Li, J. Analysis of Rutin from Lespedeza Virgata (Thunb) DC. by Microwave-Assisted Extraction and Capillary Electrophoresis. J. Chem. 2013, 2013, 324294. [Google Scholar] [CrossRef] [Green Version]
  6. Xu, H.; Li, Y.; Hong-Wu, T.; Chun-Mei, L.; Qiong-Shui, W. Determination of Rutin with UV-Vis Spectrophotometric and Laser-Induced Fluorimetric Detections Using a Non-Scanning Spectrometer. Anal. Lett. 2010, 43, 893–904. [Google Scholar] [CrossRef]
  7. Liu, D.; Mei, Q.; Wan, X.; Que, H.; Li, L.; Wan, D. Determination of Rutin and Isoquercetin Contents in Hibiscimutabilis Folium in Different Collection Periods by HPLC. J. Chromatogr. Sci. 2015, 53, 1680–1684. [Google Scholar] [CrossRef] [Green Version]
  8. Xie, Z.; Zhao, Y.; Chen, P.; Jing, P.; Yue, J.; Yu, L.L. Chromatographic Fingerprint Analysis and Rutin and Quercetin Compositions in the Leaf and Whole-Plant Samples of Di- and Tetraploid Gynostemma pentaphyllum. J. Agric. Food Chem. 2011, 59, 3042–3049. [Google Scholar] [CrossRef]
  9. Song, Z.; Hou, S. Sensitive Determination of Sub-Nanogram Amounts of Rutin by its Inhibition on Chemiluminescence with Immobilized Reagents. Talanta 2002, 57, 59–67. [Google Scholar] [CrossRef]
  10. Wang, Q.; Ding, F.; Li, H.; He, P.; Fang, Y. Determination of Hydrochlorothiazide and Rutin in Chinese Herb Medicine and Human Urine by Capillary Zone Electrophoresis with Amperometricdetection. J. Pharm. Biomed. Anal. 2003, 30, 1507–1514. [Google Scholar] [CrossRef]
  11. Bojarowicz, H.; Marszall, M.P.; Wnuk, M.; Gorynski, K.; Bucinski, A. Determination of Rutin in Plant Extracts and Emulsions by HPLC-MS. Anal. Lett. 2011, 44, 1728–1737. [Google Scholar] [CrossRef]
  12. Ghoreishi, S.M.; Khoobi, A.; Behpour, M.; Masoum, S. Application of Multivariate Curve Resolution Alternating Least Squares to Biomedical Analysis Using Electrochemical Techniques at a Nanostructure-Based Modified Sensor. Electrochim. Acta 2014, 130, 271–278. [Google Scholar] [CrossRef]
  13. Ghoreishi, S.M.; Behpour, M.; Khoobi, A.; Masoum, S. Application of Experimental Design for Quantification and Voltammetric Studies of Sulfapyridine Based on a Nanostructure Electrochemical Sensor. Arab. J. Chem. 2017, 10, S3156–S3166. [Google Scholar] [CrossRef] [Green Version]
  14. Amrutha, B.M.; Manjunatha, J.G.; Aarti, S.B.; Hareesha, N. Sensitive and Selective Electrochemical Detection of Vanillin at Graphene Based Poly (Methyl Orange) Modified Electrode. J. Sci.-Adv. Mater. Dev. 2021, 6, 415–424. [Google Scholar] [CrossRef]
  15. Berkes, B.B.; Bandarenka, A.S.; Inzelt, G. Electropolymerization: Further Insight into the Formation of Conducting Polyindole Thin Films. J. Phys. Chem. C 2015, 119, 1996–2003. [Google Scholar] [CrossRef]
  16. Amrutha, B.M.; Manjunatha, J.G.; Aarti, S.B.; Pushpanjali, P.A. Fabrication of a Sensitive and Selective Electrochemical Sensing Platform Based on Poly-l-Leucine Modifed Sensor for Enhanced Voltammetric Determination of Ribofavin. J. Food Meas. Charact. 2020, 14, 3633–3643. [Google Scholar] [CrossRef]
  17. Khoobi, A.; Shahdost-fard, F.; Arbabi, M.; Akbari, M.; Mirzaei, H.; Nejati, M.; Banafshe, H.R. Sonochemical Synthesis of ErVO4/MnWO4 Heterostructures: Application as a Novel Nanostructured Surface for Electrochemical Determination of Tyrosine in Biological Samples. Polyhedron 2019, 177, 114302. [Google Scholar] [CrossRef]
  18. Feminus, J.J.; Manikandan, R.; Narayanan, S.S.; Deepa, P.N. Determination of Gallic Acid Using Poly (Glutamic Acid): Graphene Modified Electrode. J. Chem. Sci. 2019, 131, 11. [Google Scholar] [CrossRef] [Green Version]
  19. Xiao, L.; Liqiang, L.; Yaping, D.; Daixin, Y. Poly-Glutamic Acid Modified Carbon Nanotube-Doped Carbon Paste Electrode for Sensitive Detection of L-Tryptophan. Bioelectrochemistry 2011, 82, 38–45. [Google Scholar] [CrossRef]
  20. Wei, Y.; Zihua, H.; Junjie, F.; Xiaohua, H. Sensitive Electrochemical Sensor Based on Poly (L=Glutamic Acid)/Graphene Oxide Composite Material for Simultaneous Detection of Heavy Metal Ions. RSC Adv. 2019, 9, 17325–17334. [Google Scholar] [CrossRef]
  21. Nazari, F.; Ghoreishi, S.M.; Khoobi, A. Bio-based Fe3O4/Chitosan Nanocomposite Sensor for Response Surface Methodology and Sensitive Determination of Gallic acid. Int. J. Biol. Macromol. 2020, 160, 456–469. [Google Scholar] [CrossRef] [PubMed]
  22. Pushpanjali, P.A.; Manjunatha, J.G.; Hareesha, N.; Amrutha, B.M.; Raril, C.; Zeid, A.A.; Amer, M.A.; Anup, P. Fabrication of Poly (ʟ-Aspartic Acid) Layer on Graphene Nanoplatelets Paste Electrode for Riboflavin Sensing. Mater. Chem. Phys. 2022, 276, 125392. [Google Scholar] [CrossRef]
  23. Matthew, R.; Andrew, G.W.; Steven, H.; Paolo, B. Voltammetry at Hexamethyl-P-Terphenyl Poly(Benzimidazolium) (HMT-PMBI)-Coated Glassy Carbon Electrodes: Charge Transport Properties and Detection of Uric and Ascorbic Acid. Sensors 2020, 20, 443. [Google Scholar] [CrossRef] [Green Version]
  24. Chen, C.; Xuchu, L.; Lei, W.; Wu, Y.; Feng, S.; Ding, Y.; Jingjing, L.; Hao, Q.; Shen-Ming, C. Amoxicillin on Polyglutamic Acid Composite Three-Dimensional Graphene Modified Electrode: Reaction Mechanism of Amoxicillin Insights by Computational Simulations. Anal. Chim. Acta 2019, 1073, 22–29. [Google Scholar] [CrossRef] [PubMed]
  25. Hareesha, N.; Manjunatha, J.G.; Amrutha, B.M.; Sreeharsha, N.; Asdaq, S.M.B.; Anwer, M.K. A Fast and Selective Electrochemical Detection of Vanillin in Food Samples on the Surface of Poly (Glutamic Acid) Functionalized Multiwalled Carbon Nanotubes and Graphite Composite Paste Sensor. Colloids Surf. A Physicochem. Eng. 2021, 626, 127042. [Google Scholar] [CrossRef]
  26. Bukkitgar, S.D.; Shetti, N.P.; Raviraj, M.K. Construction of Nanoparticles Composite Sensor for Atorvastatin and its Determination in Pharmaceutical and Urine Samples. Sens. Actuators B Chem. 2018, 255, 1462–1470. [Google Scholar] [CrossRef]
  27. Amrutha, B.M.; Manjunatha, J.G.; Aarti, S.B. Design of a Sensitive and Selective Voltammetric Sensor Based on a Cationic Surfactant-Modified Carbon Paste Electrode for the Determination of Alloxan. ACS Omega 2020, 36, 23481–23490. [Google Scholar] [CrossRef]
  28. Zeng, B.; Wei, S.; Xiao, F.; Zhao, F. Voltammetric Behavior and Determination of Rutin at a Single-Walled Carbon Nanotubes Modified Gold Electrode. Sens. Actuators B Chem. 2006, 115, 240–246. [Google Scholar] [CrossRef]
  29. Chen, L.; Chaisiwamongkhol, K.; Chen, Y.; Compton, R.G. Rapid electrochemical detection of vanillin in natural vanilla. Electroanalysis 2019, 31, 1067–1074. [Google Scholar] [CrossRef]
  30. Lei, Y.; Du, D.; Tang, L.; Tan, C.; Chen, K.; Guo-Jun, Z. Determination of Rutin by a Graphene-Modified Glassy Carbon Electrode. Anal. Lett. 2015, 48, 894–906. [Google Scholar] [CrossRef]
  31. Raril, C.; Manjunatha, J.G. A Simple Approach for the Electrochemical Determination of Vanillin at Ionic Surfactant Modified Graphene Paste Electrode. Microchem. J. 2020, 154, 104575. [Google Scholar] [CrossRef]
  32. Hanustiak, P.; Mikelova, R.; Potesil, D.; Hodek, P.; Stiborova, M.; Kizek, R. Electrochemical Behaviour of Flavonoids on a Surface of a Carbon Paste Electrode. Biomed. Pap. 2005, 149, 44–47. [Google Scholar]
  33. Joon-Hyung, J.; Eunae, C.; Chanho, K.; Seunho, J. Selective Monitoring of Rutin and Quercetin Based on a Novel Multi-Wall Carbon Nanotube-Coated Glassy Carbon Electrode Modifed with Microbial Carbohydrates α-Cyclosophorohexadecaose and Succinoglycan Monomer M3. Bull. Korean Chem. Soc. 2010, 31, 1897–1901. [Google Scholar] [CrossRef] [Green Version]
  34. Yalikun, N.; Mamat, X.; Li, Y.; Hu, X.; Wang, P.; Hu, G. Taraxacum-like Mg-AlSi@Porous Carbon Nanoclusters for Electrochemical Rutin Detection. Microchim. Acta 2019, 186, 379. [Google Scholar] [CrossRef]
  35. Liu, M.; Deng, J.; Chen, Q.; Huang, Y.; Wang, L.; Zhao, Y.; Zhang, Y.; Li, H.; Yao, S. Sensitive Detection of Rutin with Novel Ferrocene Benzyne Derivative Modified Electrodes. Biosens. Bioelectron. 2013, 41, 275–281. [Google Scholar] [CrossRef]
  36. Senocak, A.; Khataee, A.; Demirbas, E.; Doustkhah, E. Ultrasensitive Detection of Rutin Antioxidant Through a Magnetic Micro-Mesoporous Graphitized Carbon Wrapped Co Nanoarchitecture. Sens. Actuators B Chem. 2020, 312, 127939. [Google Scholar] [CrossRef]
  37. Kupendrian, S.; Sakthivel, R.; Chen, S.; Qin-Jin, Y.; Bhuvanenthiran, M.; Thirumalraj, B. “Design of Novel WO3/CB Nanohybrids” An Affordable and Efficient Electrochemical Sensor for the Detection of Multifunctional Flavonoid Rutin. Inorg. Chem. Front. 2018, 5, 1085–1093. [Google Scholar] [CrossRef]
  38. Oliveira-Roberth, A.D.; Santos, D.I.V.; Cordeiro, D.D.; Lino, F.M.D.A.; Bara, M.T.F.; Gil, E.D.S. Voltammetric determination of Rutin at Screen-Printed carbon disposable electrodes. Cent. Eur. J. Chem. 2012, 10, 1609–1616. [Google Scholar] [CrossRef] [Green Version]
  39. Hareesha, N.; Manjunatha, J.G.; Alothman, Z.A.; Sillanpa, M. Simple and Affordable Graphene Nano-Platelets and Carbon Nanocomposite Surface Decorated with Cetrimonium Bromide as a Highly Responsive Electrochemical Sensor for Rutin Detection. J. Electroanal. Chem. 2022, 917, 116388. [Google Scholar] [CrossRef]
  40. Attia, T.Z. Simultaneous Determination of Rutin and Ascorbic Acid Mixture in their Pure Forms and Combined Dosage Form. Spectrochim. Acta A Mol. Biomol. Spectrosc. 2016, 169, 82–86. [Google Scholar] [CrossRef]
  41. Lourenc, B.C.; Medeiros, R.A.; Rocha-Filho, R.C.; Mazoa, L.H.; Fatibello-Filhoa, O. Simultaneous Voltammetric Determination of Paracetamol and Caffeine in Pharmaceutical Formulations Using a Boron-Doped Diamond Electrode. Talanta 2009, 78, 748–752. [Google Scholar] [CrossRef] [PubMed]
  42. Nema, N.; Bairagi, S.M. The In-Vivo Effects of Caffeine and Rutin Combination on Caffeine Intoxication in Rodent Model. Acta Pharm. Sci. 2017, 1, 20–24. [Google Scholar]
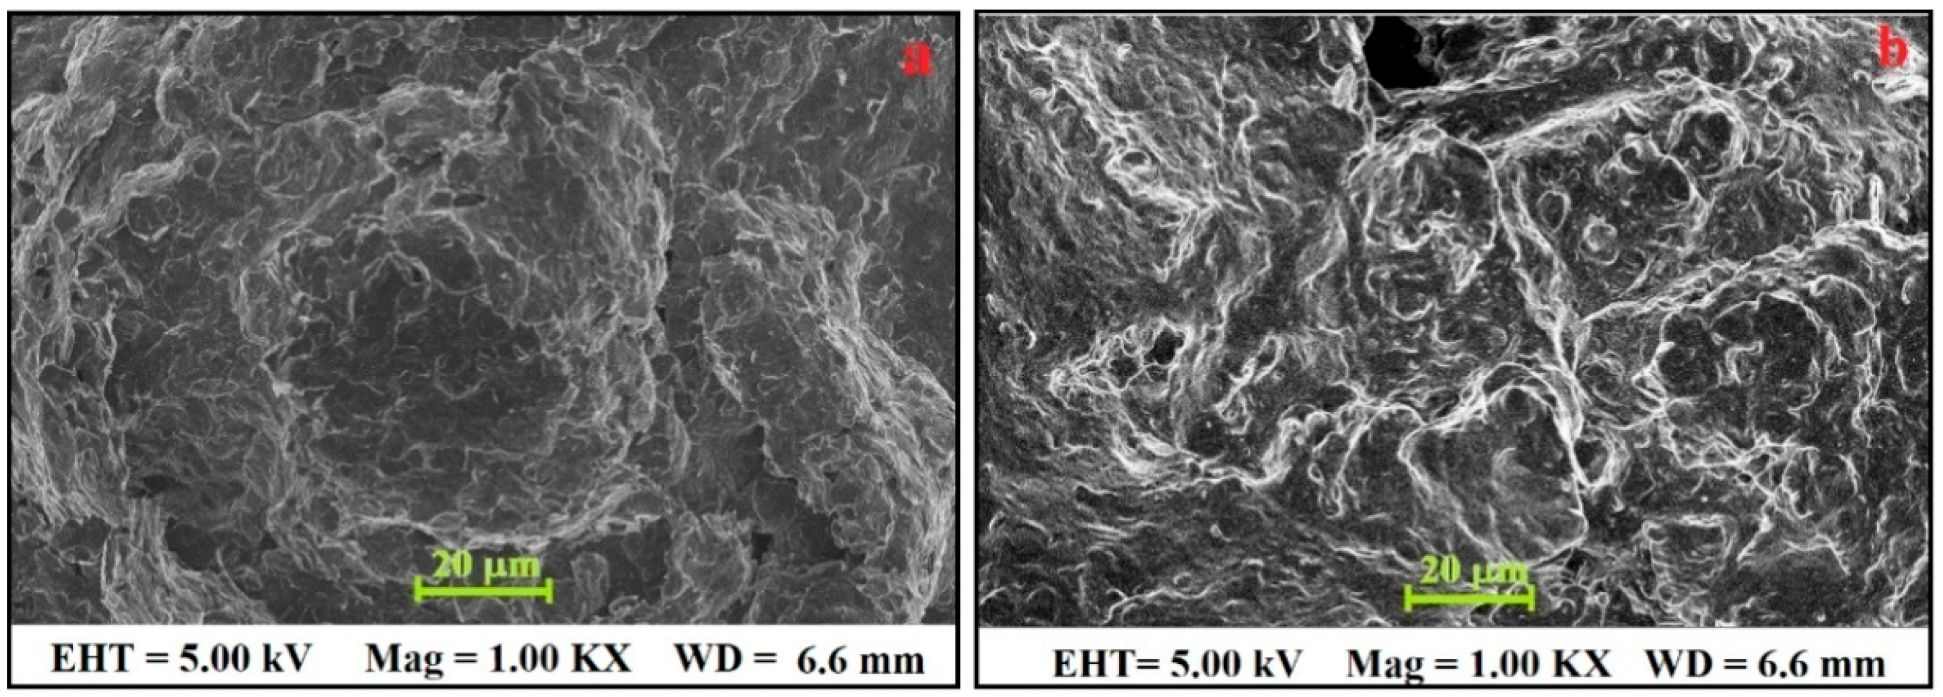
Figure 1. (a) FE-SEM picture of BGPE. (b) FE-SEM picture of PGAMGPE.
Diagnostics 12 03113 g001
Figure 2. (a) Nyquist plot for BGPE (curve a) and PGAMGPE (curve b). (b) CVs representing K4 [Fe(CN)6] (1 mM) on BGPE and PGAMGPE in 0.1 M KCl at the scan rate of 0.1 V/s.
Diagnostics 12 03113 g002
Figure 3. (a) CVs of K4[Fe(CN)6] (1.0 mM) in KCl (0.1 M) on the BGPE by changing scan rates (0.1−0.2 V/s). (b) Plot of Ipa versus ʋ1/2. (c) CVs obtained for PGAMGPE in the same electrolytic solution at different scan rates from 0.1 to 0.2 V/s. (d) Plot of Ipa versus ʋ1/2.
Diagnostics 12 03113 g003
Figure 4. (a) CVs of electrochemical polymerisation of GA (0.1 mM) in 0.2 M PB of pH 6.5 in the potential window −0.1 V to 1.5 V at ʋ = 0.1 V/s. (b) Plot of the Ipa of 0.1 mM GA versus the number of polymerisation cycles.
Diagnostics 12 03113 g004
Scheme 1. Possible electrochemical polymerisation of GA at the graphene surface.
Diagnostics 12 03113 sch001
Figure 5. (a) CV response of 0.1 mM RU at PGAMGPE in 0.2 M PB of pH ranging from 5.5 to 8.0. (b) Plot of Epa versus Ph. (c) Plot of Ipa versus pH of solution.
Diagnostics 12 03113 g005
Scheme 2. Possible electrochemical redox reaction of RU at the surface of PGAMGPE.
Diagnostics 12 03113 sch002
Figure 6. (a) CVs of accumulation potential versus Ipa. (b) ACT versus Ipa in optimum pH at a scan rate of 0.1 V/s.
Diagnostics 12 03113 g006
Figure 7. (a) CV response of 0.1 mM RU at PGAMGPE (curve a), BGPE (curve c), and blank (curve b) with the scan rate of 0.10 V/s. (b) DPVs for 0.1 mM RU on PGAMGPE (curve a), at BGPE (curve c), and blank (curve b).
Diagnostics 12 03113 g007
Figure 10. (a) DPVs for simultaneous analysis of RU, CF (0.1 mM) at PGAMGPE and BGPE in PB. (b) DPVs for simultaneous investigation with variable concentrations (10.0 to 60.0 µM) of RU and CF. (c) Plot of Ipa versus [RU] and [CF] under optimum condition.
Diagnostics 12 03113 g010
Figure 11. DPVs for RU detection in (a) lime juice, (b) green tea, and (c) tablet samples at PGAMGPE.
Diagnostics 12 03113 g011
Table 1. Comparison of the present RU LOD at PGAMGPE with the previous RU sensors.
TechniqueElectrodeLinear Range (µM)LOD (µM)Reference
SWV aCPE b1–1000.850[32]
SWVα-C16-GCE-MWCNT c2–80.604[33]
DPVMg-Al-Si-PC-GCE d1–100.01[34]
DPVMWCNTs-IL-gel-GCE e0.04–1000.01[35]
DPVCo-ZIF-C-GCE f0.1–300.022[36]
DPVCB-WO3-SPCE g0.01–75.460.002[37]
CVSPE h2.0–150.1[38]
CVCMB-GNPs-CBCPE i0.1–80.023[39]
HPLC-UV/16.3–98.273.0[40]
CVPGAMGPE0.1–1000.06Present
DPVPGAMGPE0.1–1000.04work
a Square wave voltammetry; b Carbon paste electrode; c α-Carbohydrate-doped multiwalled carbon nanotube modified glassy carbon electrode; d Porous carbon encapsulated Mg-Al-Si alloy nanocluster; e Ferrocene benzyne derivative immobilised gold nanoparticle modified glassy carbon electrode; f Magnetic micromesoporous graphitized carbon wrapped Co nanoarchitecture; g WO3-infused carbon based nanohybrids; h Screen-printed disposable carbon paste electrode; i Cetrimonium bromide graphene nanoplatelets carbon paste composite electrode.
Table 2. Recovery of RU in samples.
SampleAdded (µM)Found (µM)Recovery (%)
Lime Juice0.50.4896.83
1.00.9797.67
2.01.9095.00
3.02.8397.88
Green Tea2.01.8994.64
3.02.9197.13
4.04.10102.68
5.04.9599.04
RU Tablet1.00.9999.89
2.02.06100.31
3.02.9598.40
4.03.9899.74
Publisher’s Note: MDPI stays neutral with regard to jurisdictional claims in published maps and institutional affiliations.