


Modifications in Electrocardiographic and Vectordardiographic Morphological Parameters in Elderly Males as Result of Cardiovascular Diseases and Diabetes Mellitus

Abstract
:1. Introduction
2. Materials and Methods
- Subjects with a history of cardiovascular disease: arrhythmia (ARRH), angina pectoris (AP), myocardial infarction (MI), congestive heart failure (CHF), hypertension (HTN), peripheral artery disease (PAD);
- Subjects with diabetes mellitus DM;
- Subjects with neurological conditions: dementia of any type, distal symmetric neuropathy of lower limbs, parkinsonism, stroke; and
- Healthy subjects characterized by the absence of any cardiovascular, neurological, chronic pulmonary disease or diabetes, by the absence of therapy potentially influencing cardiac electrical activity, and by the absence of electrolyte imbalance.
- -
- QRS-amplitude, QRS-PCA, QRS-duration, QT-interval duration, T duration, QT-dispersion, ST-elevation, T-amplitude, T-PCA, and T-area dispersion computed from ECG signal;
- -
- QRS-area, maximal QRS-vector (QRS-max_vect), QRS-angle, QRS-roundness index, T-area, maximal T-vector (T-max_vect), T-angle, QRS/T-angle, T-vector ratio, and T- roundness index computed from VCG signal;
- -
- Heart rate.
3. Results
4. Discussion
- -
- Increased values for area of QRS-loop (p = 0.005), QRS duration (p < 0.001), QT-dispersion (p = 0.006), T-wave PCA (p < 0.001), T-wave roundness index (p < 0.001), and QRS-roundness index (p < 0.001) (the loop resembles more a circle than a narrow ellipsoid); and
- -
- Decreased values for maximal vector of QRS-loop (p < 0.001), T amplitude (p < 0.001), maximal vector of T-loop (p < 0.001), and T-wave area dispersion (p < 0.001), and T-loop vector ratio (p < 0.001) (the shape of the loop has become more oval or circular);
- -
- Increased values for QRS amplitude (p = 0.008), area of QRS-loop (p < 0.001), QRS-duration, (p < 0.001), QRS-roundness index (p < 0.001), T-wave PCA (p < 0.001), T-wave roundness index (p < 0.001);
- -
- Decreased values for T-wave amplitude (p < 0.001), maximal vector of T-loop (p < 0.001), T-loop vector ratio (p < 0.001), and T-wave area dispersion (p < 0.001);
- -
- Increased values for area of QRS-loop (p = 0.007), QRS-roundness index (p = 0.002), QT-duration (p = 0.006), T-duration (p = 0.045), T-wave PCA (p < 0.001), T-wave roundness index (p < 0.001); and
- -
- Decreased values for: T-wave amplitude (p < 0.001), magnitude of the maximal vector of T-loop (p < 0.001), T-loop vector ratio (p < 0.001), and T-wave area dispersion (p < 0.001).
- -
- QRS-amplitude increase was significant only for the HTN group. This was in accordance with [31], where increase of R and S-peaks in the group of HTN compared to the group of normotensive, was found in the examined leads;
- -
- The area of QRS-loop increased significantly in AP, HTN, MI, ARRH, and PAD. This parameter was used in patient selection for cardiac resynchronization therapy [32], and showed, like a LBBB index, more predictive power than other electrocardiographic parameters.
- -
- Decrease of maximal vector of QRS-loop was statistically significant only for MI. This result was in agreement with [30] where QRS vector magnitude decreased significantly in patients with infarct-cardiomyopathy and ventricular tachycardia with respect to healthy control subjects.
- -
- The analysis of QRS and T-wave by means of PCA was performed in order to find a quantitative expression of the morphological changes of those waves. The QRS-PCA contributed to the diagnosis and risk stratification of patients with Brugada syndrome [9] and PCA of the T-wave was used for the detection of T-wave alternans (TWA) [33]. In our study, only T-wave PCA presented significant differences and increased in all cardiovascular diseases and DM compared to the healthy group.
- -
- -
- -
- QT-interval duration increased significantly only in AP;
- -
- The QT-dispersion index increased significantly in MI and HTN groups, and this was supported by [6] wherein increased values of this index were associated with higher risk of cardiac death;
- -
- The T-wave amplitude decreased significantly in all cardiovascular diseases and in DM with respect to the healthy control. This result was supported by a recent study [35], wherein this index was associated as a marker of sudden cardiac arrest in the high risk group of patients with hypertrophic cardiomyopathy;
- -
- A significant decrease of the magnitude of T-loop maximal vector was observed for all cardiovascular diseases and for DM. The importance of this parameter in detection of myocardial injury after infarction was pointed out in [36];
- -
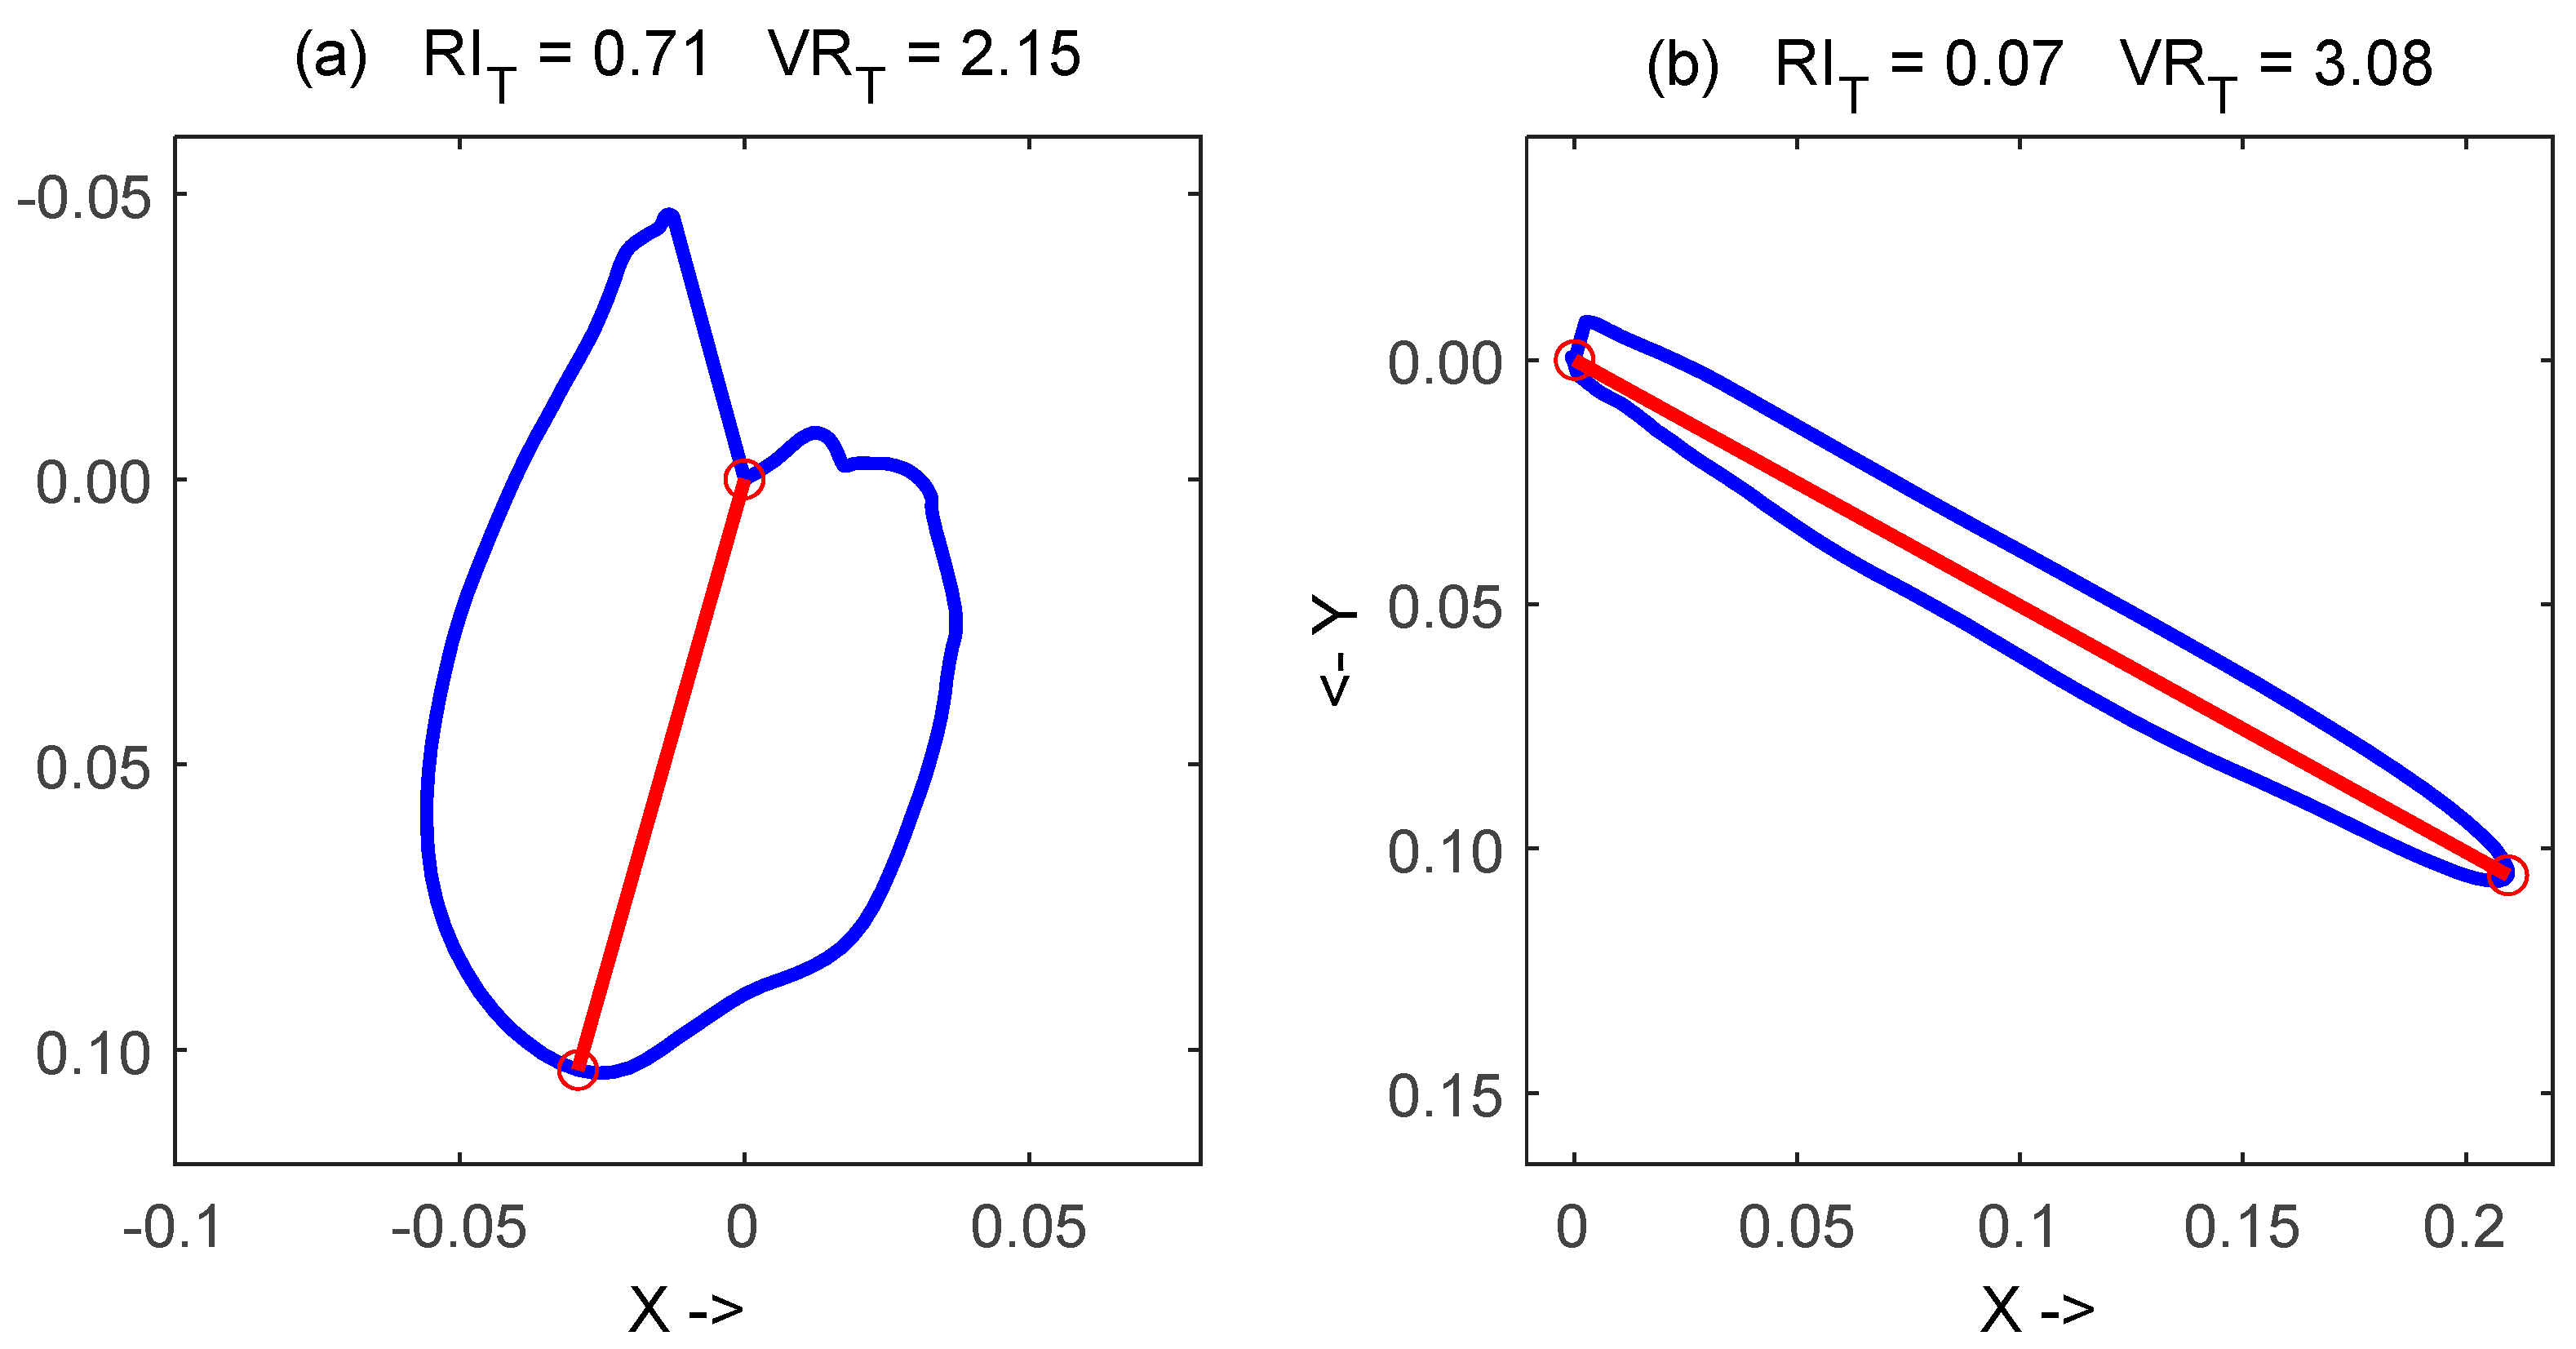
- The observed significant decrease of T vector ratio and significant increase of T roundness index in all considered diseases, with respect to healthy subjects, has a very interesting visual interpretation: the T-loop in these patients developed a rounder shape, like the examples reported in Figure 2;
- -
- T-wave area dispersion was a parameter recently proposed for quantification of repolarization heterogeneity, and low TWAD values were associated with SCD during a follow-up of general population [10]. In addition, TWAD was used to identify successfully DM patients as a group with increased risk of SCD at the time of coronary artery bypass grafting [11]. In the current study, TWAD decreased significantly for all cardiovascular diseases and for DM, and reached the lowest values (negative) for CHF. This shows the higher discriminant power of TWAD with respect to QT-dispersion for characterization of the repolarization phase in ECG. In addition, the simpler computation of TWAD should be pointed out, in which the T-wave localization was not so critical as in QT-wave dispersion [11].
- -
- Heart rate increased significantly in DM and in all cardiovascular diseases except in AP group. This result was in agreement with several studies in literature, and the HR was consequently considered as a risk factor for various cardiac events [37]. In [38], HR increased significantly after heart operation, and it was influenced by many factors from cardiac and hemodynamic origin but also from general factors such as pain, hypoxia, or hypothermia.
5. Conclusions
Author Contributions
Funding
Institutional Review Board Statement
Informed Consent Statement
Data Availability Statement
Conflicts of Interest
Appendix A
References
- Nakamura, S.; Uzu, T.; Inenaga, T.; Kimura, G. Prediction of coronary artery disease and cardiac events using electrocardiographic changes during hemodialysis. Am. J. Kidney Dis. 2000, 36, 592–599. [Google Scholar] [CrossRef] [PubMed]
- Simova, I.; Christov, I.; Bortolan, G.; Abächerli, R.; Kambova LJekova, I. Hemodialysis-induced ST-segment deviation. Comp. Card. 2015, 42, 1133–1136. [Google Scholar] [CrossRef]
- Iuliano, S.; Fisher, S.G.; Karasik, P.E.; Fletcher, R.D.; Singh, S.N. QRS duration and mortality in patients with congestive heart failure. Am. Heart J. 2002, 143, 1085–1091. [Google Scholar] [CrossRef]
- Kashani, A.; Barold, S. Significance of QRS complex duration in patients with heart failure. J. Am. Coll. Cardiol. 2005, 46, 2183–2192. [Google Scholar] [CrossRef] [PubMed] [Green Version]
- De Bruyne, M.C.; Hoes, A.W.; Kors, J.A.; Hofman, A.; Van Bemmel, J.H.; Grobbee, D.E. QTc dispersion predicts cardiac mortality in the elderly: The Rotterdam Study. Circulation 1998, 97, 467–472. [Google Scholar] [CrossRef] [Green Version]
- Sheehan, J.; Perry, I.J.; Reilly, M.; Salim, A.; Collins, M.; Twomey, E.M.; Daly, A.; Ni Loingsigh, S.; Elwood, P.; Ben-Shlomo, Y.; et al. QT dispersion, QT maximum and risk of cardiac death in the Caerphilly Heart Study. Eur. J. Cardiovasc. Prev. Rehabil. 2004, 11, 63–68. [Google Scholar] [CrossRef]
- Yamazaki, T.; Froelicher, V.F.; Myers, J.; Chun, S.; Wang, P. Spatial QRS-T angle predicts cardiac death in a clinical population. Heart Rhythm. 2005, 2, 73–78. [Google Scholar] [CrossRef]
- Simova, I.; Bortolan, G.; Christov, I. ECG attenuation phenomenon with advancing age. J. Electrocard. 2018, 51, 1029–1034. [Google Scholar] [CrossRef]
- Batchvarov, V.; Christov, I.; Bortolan, G.; Behr, E. Principal component analysis of the QRS complex during diagnostic ajmaline test for suspected Brugada syndrome. Comput. Cardiol. 2010, 37, 501–504. [Google Scholar]
- Kenttä, T.V.; Sinner, M.F.; Huikuri, H.V. Repolarization heterogeneity measured with T-wave area dispersion in Standard 12-lead ECG predicts sudden cardiac death in general population. Circ. Arrhythmia Electrophysiol. 2018, 11, e005762. [Google Scholar] [CrossRef]
- Simov, D. Electrocardiographic changes in certain cardiovascular physiological and pathological settings. Impact on coronary artery bypass grafting. Int. J. Bioautomation 2016, 20, 43–68. [Google Scholar]
- Simov, D.; Christov, I.; Simova, I. T-wave area dispersion in coronary artery bypass grafting is indicative for increased risk of adverse events in diabetics. Curr. Diab. Rev. 2019, 5, 347–348. [Google Scholar] [CrossRef] [PubMed]
- Bortolan, G.; Christov, I.; Simova, I. Gender related modifications in ECG and VCG in elderly people. Comp. Card. 2020, 47, 1–4. [Google Scholar] [CrossRef]
- Maggi, S.; Zucchetto, M.; Grigoletto, F.; Baldereschi, M.; Candelise, L.; Scarpini, E.; ILSA Group. The Italian longitudinal study on aging (ILSA): Design and methods. Aging Clin. Exper. Res. 1994, 6, 464–473. [Google Scholar] [CrossRef] [PubMed]
- Amaducci, L.; Baldereschi, M.; Di Carlo, A.; Maggi, S.; Scarlato, G.; Candelise, L.; Zucchetto, M. Prevalence of chronic diseases in older Italians: Comparing self-reported and clinical diagnoses. Int. J. Epidem. 1997, 26, 995–1002. [Google Scholar] [CrossRef]
- Bortolan, G.; Bressan, M.; Golferini, F. Serial analysis in the ECG-ILSA database: Study of longitudinal modifications. Comput. Card. 1999, 26, 667–670. [Google Scholar] [CrossRef]
- Bortolan, G.; Bressan, M.; Golferini, F.; ILSA Study Group. QT dispersion in the elderly. The ILSA study. Aging Clin. Exper. Res. 2004, 16, 342–348. [Google Scholar] [CrossRef]
- Levkov, C.; Mihov, G.; Ivanov, R.; Daskalov, I.; Christov, I.; Dotsinsky, I. Removal of power-line interference from the ECG: A review of the subtraction procedure. BioMed. Eng. Online 2005, 4, 50. [Google Scholar] [CrossRef] [Green Version]
- Bortolan, G.; Christov, I.; Simova, I.; Dotsinsky, I. Noise processing in exercise ECG stress test for the analysis and the clinical characterization of QRS and T wave alternans. Biomed. Signal Process. Contr. 2015, 18, 378–385. [Google Scholar] [CrossRef]
- Christov, I.; Neycheva, T.; Schmid, R.; Stoyanov, T.; Abächerli, R. Pseudo real-time low-pass filter in ECG, self-adjustable to the frequency spectra of the waves. Med. Biol. Eng. Comp. 2017, 55, 1579–1588. [Google Scholar] [CrossRef]
- Christov, I.I. Real time electrocardiogram QRS detection using combined adaptive threshold. BioMed. Eng. Online 2004, 3, 28. [Google Scholar] [CrossRef] [Green Version]
- Daskalov, I.K.; Christov, I.I. Electrocardiogram signal preprocessing for automatic detection of QRS boundaries. Med. Eng. Phys. 1999, 21, 37–44. [Google Scholar] [CrossRef] [PubMed]
- Daskalov, I.K.; Christov, I.I. Automatic detection of the electrocardiogram T-wave end. Med. Biol. Eng. Comp. 1999, 37, 348–353. [Google Scholar] [CrossRef] [PubMed]
- Christov, I.; Simova, I. Q-onset and T-end delineation: Assessment of the performance of an automated method with the use of a reference database. Physiol. Meas. 2007, 28, 213–221. [Google Scholar] [CrossRef] [PubMed]
- Dower, G.E. A lead synthesizer for the Frank system to simulate the standard 12-lead electrocardiogram. J. Electrocard. 1968, 1, 101–106. [Google Scholar] [CrossRef]
- Bortolan, G.; Christov, I.; Simova, I. Potential of rule-based methods and deep learning architectures for ECG diagnostics. Diagnostics 2021, 11, 1678. [Google Scholar] [CrossRef]
- Kallert, T.; Couderc, J.P.; Voss, A.; Zareba, W. Semi-automatic method quantifying T wave loop morphology: Relevance for assessment of heterogeneous repolarization. Comp. Cardiol. 1999, 26, 153–156. [Google Scholar]
- Bortolan, G.; Christov, I. Myocardial infarction and ischemia characterization from T-loop morphology in VCG. Comp. Cardiol. 2001, 28, 633–636. [Google Scholar]
- Bortolan, G.; Bressan, M.; Christov, I. Longitudinal modifications of T-loop morphology. Comp. Cardiol. 2002, 29, 685–688. [Google Scholar]
- Sedaghat, G.; Ghafoori, E.; Waks, J.W.; Kabir, M.M.; Shvilkin, A.; Josephson, M.E.; Tereshchenko, L.G. Quantitative assessment of vectorcardiographic loop morphology. J. Electrocardiol. 2016, 49, 154–163. [Google Scholar] [CrossRef] [Green Version]
- Aeschbacher, S.; Metin, F.; Bossard, M.; Schoen, T.; von Rotz, M.; Mettler, H.; Conen, D. Relationships of electrocardiographic parameters with ambulatory hypertension in young and healthy adults. Int. J. Card. 2016, 202, 300–304. [Google Scholar] [CrossRef] [PubMed]
- van Deursen, C.J.; Vernooy, K.; Dudink, E.; Bergfeldt, L.; Crijns, H.J.; Prinzen, F.W.; Wecke, L. Vectorcardiographic QRS area as a novel predictor of response to cardiac resynchronization therapy. J. Electrocardiol. 2015, 48, 45–52. [Google Scholar] [CrossRef] [PubMed] [Green Version]
- Bortolan, G.; Christov, I.I. Principal component analysis for the detection and assessment of T-wave alternans. Comp. Card. 2008, 35, 521–524. [Google Scholar]
- Horinaka, S.; Yamamoto, H.; Yagi, S. Spatial orientation of the vectorcardiogram in patients with myocardial infarction. Jpn. Circ. J. 1993, 57, 109–116. [Google Scholar] [CrossRef] [PubMed]
- Sugrue, A.; Killu, A.M.; DeSimone, C.V.; A Chahal, A.; Vogt, J.C.; Kremen, V.; Hai, J.; O Hodge, D.; Acker, N.G.; Geske, J.B.; et al. Utility of T-wave amplitude as a noninvasive risk marker of sudden cardiac death in hypertrophic cardiomyopathy. Open Heart 2017, 4, e000561. [Google Scholar] [CrossRef] [PubMed]
- Goernig, M.; Hoeffling, B.; Lau, S.; Figulla, H.R.; Haueisen, J. T Vector and Loop Characteristics Improve Detection of Myocardial Injury After Infarction. J. Med. Biol. Eng. 2015, 35, 381–386. [Google Scholar] [CrossRef]
- Kannel, W.B.; Kannel, C.; Paffenbarger, R.S.; Cupples, L.A. Heart rate and cardiovascular mortality: The Framingham Study. Am. Heart J. 1987, 113, 1489–1494. [Google Scholar] [CrossRef]
- Simov, D.; Christov, I.; Simova, I.; Matveev, M.; Petrov, I. Electrocardiographic parameters indicative for increased risk of adverse events in diabetics after coronary artery bypass grafting. Comp. Card. 2017, 44, 1–4. [Google Scholar] [CrossRef]


| Healthy | DM | AP | HTN | MI | ARRH | CHF | PAD | |
|---|---|---|---|---|---|---|---|---|
| Healthy | 219 | 0 | 0 | 0 | 0 | 0 | 0 | 0 |
| DM. | 0 | 130 | 14 | 96 | 28 | 57 | 10 | 20 |
| AP | 0 | 14 | 99 | 69 | 41 | 41 | 15 | 17 |
| HTN | 0 | 96 | 69 | 607 | 99 | 252 | 50 | 69 |
| MI | 0 | 28 | 41 | 99 | 160 | 72 | 28 | 26 |
| ARRH | 0 | 57 | 41 | 252 | 72 | 386 | 47 | 40 |
| CHF | 0 | 10 | 15 | 50 | 28 | 47 | 73 | 9 |
| PAD | 0 | 20 | 17 | 69 | 26 | 40 | 9 | 95 |
| DM (n = 130) | AP (n = 99) | HTN (n = 607) | MI (n = 160) | ARRH (n = 386) | CHF (n = 73) | PAD (n = 95) | Healty (n = 219) | |
|---|---|---|---|---|---|---|---|---|
| QRS-ampl [mV] | 0.83 (0.39) [0.76; 0.90] | 0.86 (0.33) [0.80; 0.93] | 0.90 (0.38) [0.87; 0.93] | 0.76 (0.33) [0.71; 0.82] | 0.86 (0.39) [0.82; 0.90] | 0.84 (0.48) [0.72; 0.95] | 0.80 (0.34) [0.73; 0.87] | 0.82 (0.31) [0.78; 0.86] |
| QRS-area [mV*s] | 0.14 (0.15) [0.12; 0.17] | 0.18 (0.24) [0.13; 0.23] | 0.16 (0.18) [0.14; 0.17] | 0.16 (0.16) [0.13; 0.18] | 0.17 (0.22) [0.15; 0.19] | 0.18 (0.29) [0.12; 0.25] | 0.16 (0.14) [0.13; 0.19] | 0.11 (0.11) [0.10; 0.13] |
| QRS-max_vect [mV] | 0.77 (0.31) [0.72; 0.82] | 0.79 (0.33) [0.72; 0.86] | 0.80 (0.30) [0.78; 0.82] | 0.68 (0.27) [0.64; 0.72] | 0.77 (0.30) [0.74; 0.80] | 0.77 (0.34) [0.69; 0.85] | 0.75 (0.29) [0.69; 0.81] | 0.77 (0.25) [0.74; 0.80] |
| QRS-angle [°] | 123.5 (68.1) [111.7; 135.3] | 130.0 (75.2) [115.0; 145.0] | 121.3 (67.5) [115.9; 126.7] | 126.3 (79.0) [114.0; 138.6] | 123.1 (74.2) [115.6; 130.5] | 122.6 (72.8) [105.6; 139.6] | 117.5 (66.5) [104.0; 131.1] | 108.6 (41.8) [103.0; 114.2] |
| QRS-PCA [number] | 0.24 (0.21) [0.20; 0.28] | 0.21 (0.18) [0.18; 0.25] | 0.24 (0.19) [0.22; 0.25] | 0.24 (0.21) [0.20; 0.27] | 0.24 (0.20) [0.22; 0.26] | 0.23 (0.21) [0.18; 0.28] | 0.27 (0.22) [0.22; 0.31] | 0.26 (0.20) [0.23; 0.29] |
| QRS-durat [ms] | 126.7 (21.4) [123.0; 130.4] | 122.6 (21.9) [118.3; 127.0] | 123.8 (22.9) [122.0; 125.6] | 125.2 (20.8) [121.9; 128.4] | 128.3 (27.6) [125.6; 131.1] | 128.3 (27.7) [121.8; 134.7] | 122.4 (21.3) [118.1; 126.7] | 116.8 (14.8) [114.9; 118.8] |
| QRS-round [number] | 0.24 (0.20) [0.20; 0.27] | 0.30 (0.25) [0.24; 0.35] | 0.26 (0.22) [0.25; 0.28] | 0.34 (0.24) [0.30; 0.38] | 0.29 (0.23) [0.26; 0.31] | 0.29 (0.25) [0.23; 0.34] | 0.32 (0.25) [0.27; 0.37] | 0.22 (0.21) [0.19; 0.24] |
| QT-durat [ms] | 426.9 (39.6) [420.0; 433.7] | 432.6 (48.4) [422.9; 442.2] | 427.7 (43.5) [424.3; 431.2] | 430.2 (41.9) [423.7; 436.7] | 428.5 (49.9) [423.5; 433.5] | 415.3 (50.7) [403.5; 427.1] | 429.4 (47.4) [419.7; 439.1] | 422.5 (37.0) [417.6; 427.4] |
| QT-disp [ms] | 41.04 (12.48) [38.87; 43.20] | 41.16 (13.00) [38.56; 43.75] | 40.13 (12.00) [39.17; 41.09] | 41.41 (11.61) [39.60; 43.23] | 41.47 (11.92) [40.27; 42.66] | 40.91 (13.19) [37.83; 43.99] | 40.01 (11.61) [37.65; 42.38] | 37.74 (12.32) [36.10; 39.38] |
| ST-elevat [mV] | 77.62 (77.08) [64.24; 90.99] | 86.16 (253.73) [35.55; 136.76] | 74.97 (119.49) [65.45; 84.50] | 75.08 (82.13) [62.26; 87.91] | 82.54 (227.94) [59.73; 105.35] | 50.00 (104.46) [25.63; 74.37] | 56.21 (80.46) [39.82; 72.60] | 69.67 (54.46) [62.41; 76.92] |
| T-duration [ms] | 300.2 (38.3) [293.5; 306.8] | 309.9 (43.1) [301.3; 318.5] | 303.9 (40.5) [300.7; 307.2] | 305.1 (38.0) [299.1; 311.0] | 300.2 (45.0) [295.7; 304.7] | 287.0 (46.9) [276.1; 298.0] | 307.0 (42.1) [298.4; 315.6] | 305.7 (38.2) [300.6; 310.8] |
| T-ampl [mV] | 0.08 (0.07) [0.07; 0.10] | 0.08 (0.07) [0.07; 0.10] | 0.11 (0.09) [0.10; 0.11] | 0.08 (0.07) [0.07; 0.09] | 0.10 (0.08) [0.09; 0.10] | 0.08 (0.07) [0.06; 0.09] | 0.09 (0.07) [0.08; 0.11] | 0.14 (0.08) [0.13; 0.15] |
| T-area [mV*s] | 5.32 (6.13) [4.26; 6.38] | 6.59 (7.37) [5.12; 8.06] | 6.79 (11.27) [5.89; 7.68] | 6.10 (8.80) [4.73; 7.47] | 7.04 (13.61) [5.68; 8.41] | 9.84 (26.84) [3.58; 16.11] | 7.02 (8.27) [5.34; 8.71] | 6.12 (6.18) [5.30; 6.95] |
| T-max_vect [mV] | 0.20 (0.11) [0.18; 0.22] | 0.19 (0.09) [0.18; 0.21] | 0.23 (0.11) [0.22; 0.24] | 0.19 (0.11) [0.17; 0.21] | 0.22 (0.11) [0.21; 0.23] | 0.19 (0.10) [0.17; 0.21] | 0.20 (0.11) [0.18; 0.23] | 0.26 (0.10) [0.25; 0.27] |
| T-angle [°] | 108.5 (33.6) [102.7; 114.4] | 116.5 (33.8) [109.8; 123.2] | 113.4 (31.0) [111.0; 115.9] | 115.8 (47.1) [108.5; 123.2] | 115.2 (36.9) [111.5; 118.9] | 120.4 (45.0) [109.9; 130.9] | 111.0 (28.9) [105.1; 116.9] | 111.1 (12.9) [109.4; 112.8] |
| QRS/T-angle [°] | −14.95 (73.45) [−27.70; −2.20] | −13.51 (79.54) [−29.37; 2.35] | −7.87 (72.05) [−13.61; −2.13] | −10.48 (85.11) [−23.77; 2.80] | −7.87 (81.58) [−16.03; 0.30] | −2.22 (85.35) [−22.13; 17.70] | −6.53 (72.74) [−21.35; 8.28] | 2.53 (42.83) [−3.18; 8.23] |
| T-vector ratio [number] | 2.38 (0.44) [2.30; 2.45] | 2.41 (0.47) [2.32; 2.51] | 2.45 (0.43) [2.41; 2.48] | 2.34 (0.46) [2.27; 2.41] | 2.35 (0.45) [2.30; 2.39] | 2.29 (0.42) [2.19; 2.39] | 2.36 (0.45) [2.27; 2.46] | 2.64 (0.39) [2.59; 2.69] |
| T-PCA [number] | 0.13 (0.13) [0.11; 0.15] | 0.14 (0.15) [0.11; 0.17] | 0.12 (0.13) [0.11; 0.13] | 0.13 (0.14) [0.11; 0.15] | 0.13 (0.14) [0.11; 0.14] | 0.18 (0.17) [0.14; 0.22] | 0.13 (0.13) [0.10; 0.16] | 0.07 (0.07) [0.06; 0.08] |
| T-roundness [number] | 0.17 (0.18) [0.14; 0.20] | 0.18 (0.20) [0.14; 0.22] | 0.15 (0.16) [0.14; 0.16] | 0.19 (0.20) [0.16; 0.23] | 0.16 (0.18) [0.15; 0.18] | 0.21 (0.22) [0.15; 0.26] | 0.20 (0.22) [0.16; 0.25] | 0.09 (0.07) [0.08; 0.10] |
| TWAD [number] | 0.09 (0.44) [0.02; 0.17] | 0.09 (0.45) [−0.00; 0.18] | 0.19 (0.42) [0.16; 0.23] | 0.09 (0.44) [0.02; 0.16] | 0.16 (0.44) [0.12; 0.20] | −0.05 (0.44) [−0.15; 0.06] | 0.16 (0.41) [0.08; 0.24] | 0.38 (0.33) [0.34; 0.43] |
| HR [bpm] | 69.97 (12.01) [67.88; 72.05] | 67.41 (13.25) [64.77; 70.06] | 68.53 (11.96) [67.57; 69.48] | 68.90 (11.24) [67.15; 70.65] | 70.22 (14.18) [68.80; 71.63] | 76.04 (15.96) [72.32; 79.77] | 69.60 (12.05) [67.15; 72.05] | 66.11 (9.89) [64.79; 67.42] |
| Healthy vs: | |||||||
|---|---|---|---|---|---|---|---|
| DM (n = 130) | AP (n = 99) | HTN (n = 607) | MI (n = 160) | ARRH (n = 386) | CHF (n = 73) | PAD (n = 95) | |
| QRS-ampl | p = 0.008 | ||||||
| QRS-area | p = 0.007 | p < 0.001 | p = 0.005 | p < 0.001 | p = 0.001 | ||
| QRS-max_vect | p < 0.001 | ||||||
| QRS-angle | |||||||
| QRS-PCA | |||||||
| QRS-durat | p < 0.001 | p < 0.001 | p < 0.001 | p < 0.001 | p = 0.005 | ||
| QRS-round | p = 0.002 | p < 0.001 | p < 0.001 | p < 0.001 | p = 0.005 | p < 0.001 | |
| QT-durat | p = 0.006 | ||||||
| QT-disp | p = 0.006 | p < 0.001 | |||||
| ST-elevat | |||||||
| T-duration | p = 0.003 | ||||||
| T-ampl | p < 0.001 | p < 0.001 | p < 0.001 | p < 0.001 | p < 0.001 | p < 0.001 | p < 0.001 |
| T-area | |||||||
| T-max_vect | p < 0.001 | p < 0.001 | p < 0.001 | p < 0.001 | p < 0.001 | p < 0.001 | p < 0.001 |
| T-angle | |||||||
| QRS/T-angle | |||||||
| T-vector ratio | p < 0.001 | p < 0.001 | p < 0.001 | p < 0.001 | p < 0.001 | p < 0.001 | p < 0.001 |
| T-PCA | p < 0.001 | p < 0.001 | p < 0.001 | p < 0.001 | p < 0.001 | p < 0.001 | p < 0.001 |
| T-roundness | p < 0.001 | p < 0.001 | p < 0.001 | p < 0.001 | p < 0.001 | p < 0.001 | p < 0.001 |
| TWAD | p < 0.001 | p < 0.001 | p < 0.001 | p < 0.001 | p < 0.001 | p < 0.001 | p < 0.001 |
| HR | p = 0.003 | p = 0.003 | p < 0.001 | ||||
| Healthy | DM | AP | HTN | MI | ARRH | CHF | PAD | |
|---|---|---|---|---|---|---|---|---|
| Mortality | 3.2% | 12.3% | 11.1% | 8.4% | 12.5% | 10.1% | 23.2% | 13.7% |
| Healthy | DM | AP | HTN | MI | ARRH | CHF | PAD | |
|---|---|---|---|---|---|---|---|---|
| QRS-ampl | ||||||||
| QRS-area | ||||||||
| QRS-max_vect | ||||||||
| QRS-angle | p = 0.033 | |||||||
| QRS-PCA | p = 0.044 | |||||||
| QRS-durat | ||||||||
| QRS-round | ||||||||
| QT-durat | ||||||||
| QT-disp | p = 0.017 | |||||||
| ST-elevat | p = 0.034 | |||||||
| T-duration | ||||||||
| T-ampl | p = 0.007 | p = 0.033 | ||||||
| T-area | ||||||||
| T-max_vect | p = 0.001 | p < 0.001 | p = 0.001 | |||||
| T-angle | p = 0.012 | |||||||
| QRS/T-angle | ||||||||
| T-vector_ratio | p = 0.029 | |||||||
| T-PCA | p = 0.006 | |||||||
| T-roundn | p = 0.031 | p = 0.019 | p = 0.029 | p < 0.001 | ||||
| TWAD | p = 0.043 | |||||||
| HR | p = 0.001 |
Publisher’s Note: MDPI stays neutral with regard to jurisdictional claims in published maps and institutional affiliations. |
© 2022 by the authors. Licensee MDPI, Basel, Switzerland. This article is an open access article distributed under the terms and conditions of the Creative Commons Attribution (CC BY) license (https://creativecommons.org/licenses/by/4.0/).
Share and Cite
Bortolan, G.; Christov, I.; Simova, I. Modifications in Electrocardiographic and Vectordardiographic Morphological Parameters in Elderly Males as Result of Cardiovascular Diseases and Diabetes Mellitus. Diagnostics 2022, 12, 2911. https://doi.org/10.3390/diagnostics12122911
Bortolan G, Christov I, Simova I. Modifications in Electrocardiographic and Vectordardiographic Morphological Parameters in Elderly Males as Result of Cardiovascular Diseases and Diabetes Mellitus. Diagnostics. 2022; 12(12):2911. https://doi.org/10.3390/diagnostics12122911
Chicago/Turabian StyleBortolan, Giovanni, Ivaylo Christov, and Iana Simova. 2022. "Modifications in Electrocardiographic and Vectordardiographic Morphological Parameters in Elderly Males as Result of Cardiovascular Diseases and Diabetes Mellitus" Diagnostics 12, no. 12: 2911. https://doi.org/10.3390/diagnostics12122911
APA StyleBortolan, G., Christov, I., & Simova, I. (2022). Modifications in Electrocardiographic and Vectordardiographic Morphological Parameters in Elderly Males as Result of Cardiovascular Diseases and Diabetes Mellitus. Diagnostics, 12(12), 2911. https://doi.org/10.3390/diagnostics12122911