
Serum Osteoprotegerin and Carotid Intima-Media Thickness Are Related to High Arterial Stiffness in Heart Failure with Reduced Ejection Fraction


 , , and
Abstract
1. Introduction
2. Materials and Methods
2.1. The Study Cohort
2.2. Measurement of PWV
2.3. Cardiac and Carotid Echocardiography and the Ankle–Brachial Index Determination
2.4. Laboratory Analysis
2.5. Biomarker Measurements
2.6. Statistical Analysis
3. Results
3.1. Study Group Characteristics: Factors Related to a Higher PWV
3.2. Correlations of PWV, OPG, and Sclerostin
3.3. Correlations of PWV in the EF Subgroups
3.4. Predictors of PWV in the Multiple Linear Regression and Logistic Regression Models
4. Discussion
5. Conclusions
Author Contributions
Funding
Institutional Review Board Statement
Informed Consent Statement
Data Availability Statement
Conflicts of Interest
References
- Inamdar, A.A.; Inamdar, A.C. Heart Failure: Diagnosis, Management and Utilization. J. Clin. Med. 2016, 5. [Google Scholar] [CrossRef] [PubMed]
- Egbuche, O.; Hanna, B.; Onuorah, I.; Uko, E.; Taha, Y.; Ghali, J.K.; Onwuanyi, A. Contemporary Pharmacologic Management of Heart Failure with Reduced Ejection Fraction: A Review. Curr. Cardiol. Rev. 2020, 16, 55–64. [Google Scholar] [CrossRef]
- Spoletini, I.; Coats, A.J.S.; Senni, M.; Rosano, G.M.C. Monitoring of biomarkers in heart failure. Eur. Heart J. Suppl. 2019, 21, M5–M8. [Google Scholar] [CrossRef]
- Shim, C.Y.; Hong, G.R.; Ha, J.W. Ventricular Stiffness and Ventricular-Arterial Coupling in Heart Failure What Is It, How to Assess, and Why? Heart Fail. Clin. 2019, 15, 267–274. [Google Scholar] [CrossRef] [PubMed]
- Demir, S.; Akpinar, O.; Akkus, O.; Nas, K.; Unal, I.; Molnar, F.; Demir, A.; Illyes, M.; Acarturk, E. The prognostic value of arterial stiffness in systolic heart failure. Cardiol. J. 2013, 20, 665–671. [Google Scholar] [CrossRef]
- Vlachopoulos, C.; Terentes-Printzios, D.; Stefanadis, C. Arterial stiffness and carotid intima-media thickness: Together they stand. Hypertens. Res. 2010, 33, 291–292. [Google Scholar] [CrossRef]
- Tsao, C.W.; Lyass, A.; Larson, M.G.; Levy, D.; Hamburg, N.M.; Vita, J.A.; Benjamin, E.J.; Mitchell, G.F.; Vasan, R.S. Relation of Central Arterial Stiffness to Incident Heart Failure in the Community. J. Am. Heart Assoc. 2015, 4. [Google Scholar] [CrossRef]
- Kim, H.L.; Kim, S.H. Pulse Wave Velocity in Atherosclerosis. Front. Cardiovasc. Med. 2019, 6. [Google Scholar] [CrossRef]
- Rochette, L.; Meloux, A.; Rigal, E.; Zeller, M.; Cottin, Y.; Vergely, C. The role of osteoprotegerin in the crosstalk between vessels and bone: Its potential utility as a marker of cardiometabolic diseases. Pharmacol. Ther. 2018, 182, 115–132. [Google Scholar] [CrossRef]
- Van Campenhout, A.; Golledge, J. Osteoprotegerin, vascular calcification and atherosclerosis. Atherosclerosis 2009, 204, 321–329. [Google Scholar] [CrossRef] [PubMed]
- Evrard, S.; Delanaye, P.; Kamel, S.; Cristol, J.P.; Cavalier, E.; Ca, S.-S.J.W.G.V. Vascular calcification: From pathophysiology to biomarkers. Clin. Chim. Acta 2015, 438, 401–414. [Google Scholar] [CrossRef]
- De Mare, A.; D’Haese, P.C.; Verhulst, A. The Role of Sclerostin in Bone and Ectopic Calcification. Int. J. Mol. Sci. 2020, 21. [Google Scholar] [CrossRef] [PubMed]
- Williams, B.; Mancia, G.; Spiering, W.; Rosei, E.A.; Azizi, M.; Burnier, M.; Clement, D.L.; Coca, A.; de Simone, G.; Dominiczak, A.; et al. 2018 ESC/ESH Guidelines for the management of arterial hypertension. Eur. Heart J. 2018, 39, 3021–3104. [Google Scholar] [CrossRef]
- Amer Diabet, A. Classification and Diagnosis of Diabetes: Standards of Medical Care in Diabetes-2020. Diabetes Care 2020, 43, S14–S31. [Google Scholar] [CrossRef]
- Levey, A.S.; Bosch, J.P.; Lewis, J.B.; Greene, T.; Rogers, N.; Roth, D.; Modification Diet Renal Dis Study, G. A more accurate method to estimate glomerular filtration rate from serum creatinine: A new prediction equation. Ann. Intern. Med. 1999, 130, 461–470. [Google Scholar] [CrossRef]
- Milan, A.; Zocaro, G.; Leone, D.; Tosello, F.; Buraioli, I.; Schiavone, D.; Veglio, F. Current assessment of pulse wave velocity: Comprehensive review of validation studies. J. Hypertens. 2019, 37, 1547–1557. [Google Scholar] [CrossRef]
- Lang, R.M.; Badano, L.P.; Mor-Avi, V.; Afilalo, J.; Armstrong, A.; Ernande, L.; Flachskampf, F.A.; Foster, E.; Goldstein, S.A.; Kuznetsova, T.; et al. Recommendations for Cardiac Chamber Quantification by Echocardiography in Adults: An Update from the American Society of Echocardiography and the European Association of Cardiovascular Imaging. J. Am. Soc. Echocardiogr. 2015, 28, 1-U170. [Google Scholar] [CrossRef]
- Januzzi, J.L.; Chen-Tournoux, A.A.; Christenson, R.H.; Doros, G.; Hollander, J.E.; Levy, P.D.; Nagurney, J.T.; Nowak, R.M.; Pang, P.S.; Patel, D.; et al. N-Terminal Pro-B-Type Natriuretic Peptide in the Emergency Department The ICON-RELOADED Study. J. Am. Coll. Cardiol. 2018, 71, 1191–1200. [Google Scholar] [CrossRef]
- Chirinos, J.A.; Khan, A.; Bansal, N.; Dries, D.L.; Feldman, H.I.; Ford, V.; Anderson, A.H.; Kallem, R.; Lash, J.P.; Ojo, A.; et al. Arterial Stiffness, Central Pressures, and Incident Hospitalized Heart Failure in the Chronic Renal Insufficiency Cohort Study. Circ. Heart Fail. 2014, 7, 709–716. [Google Scholar] [CrossRef]
- Pandey, A.; Khan, H.; Newman, A.B.; Lakatta, E.G.; Forman, D.E.; Butler, J.; Berry, J.D. Arterial Stiffness and Risk of Overall Heart Failure, Heart Failure With Preserved Ejection Fraction, and Heart Failure With Reduced Ejection Fraction The Health ABC Study (Health, Aging, and Body Composition). Hypertension 2017, 69, 267–274. [Google Scholar] [CrossRef]
- Feola, M.; Testa, M.; Ferreri, C.; Rosso, G.; Rossi, A.; Ruocco, G. The Analysis of Arterial Stiffness in Heart Failure Patients in Comparison with Healthy Subjects and Patients with Cardiovascular Risk Factors. J. Clin. Med. 2019, 8. [Google Scholar] [CrossRef]
- Davaine, J.M.; Quillard, T.; Chatelais, M.; Guilbaud, F.; Brion, R.; Guyomarch, B.; Brennan, M.A.; Heymann, D.; Heymann, M.F.; Goueffic, Y. Bone Like Arterial Calcification in Femoral Atherosclerotic Lesions: Prevalence and Role of Osteoprotegerin and Pericytes. Eur. J. Vasc. Endovasc. Surg. 2016, 51, 259–267. [Google Scholar] [CrossRef] [PubMed]
- Rochette, L.; Meloux, A.; Rigal, E.; Zeller, M.; Malka, G.; Cottin, Y.; Vergely, C. The Role of Osteoprotegerin in Vascular Calcification and Bone Metabolism: The Basis for Developing New Therapeutics. Calcif. Tissue Int. 2019, 105, 239–251. [Google Scholar] [CrossRef]
- Zannettino, A.C.W.; Holding, C.A.; Diamond, P.; Atkins, G.J.; Kostakis, P.; Farrugia, A.; Gamble, J.; To, L.B.; Findlay, D.M.; Haynes, D.R. Osteoprotegerin (OPG) is localized to the Weibel-Palade bodies of human vascular endothelial cells and is physically associated with von Willebrand factor. J. Cellu. Physiol. 2005, 204, 714–723. [Google Scholar] [CrossRef]
- Ozkalayci, F.; Gulmez, O.; Ugur-Altun, B.; Pandi-Perumal, S.R.; Altun, A. The Role of Osteoprotegerin as a Cardioprotective Versus Reactive Inflammatory Marker: The Chicken or the Egg Paradox. Balk. Med. J. 2018, 35, 225–232. [Google Scholar] [CrossRef] [PubMed]
- Nagy, E.E.; Frigy, A.; Szasz, J.A.; Horvath, E. Neuroinflammation and microglia/macrophage phenotype modulate the molecular background of post-stroke depression: A literature review. Exp. Ther. Med. 2020, 20, 2510–2523. [Google Scholar] [CrossRef]
- Wu, M.T.; Rementer, C.; Giachelli, C.M. Vascular Calcification: An Update on Mechanisms and Challenges in Treatment. Calcif. Tissue Int. 2013, 93, 365–373. [Google Scholar] [CrossRef] [PubMed]
- Rasmussen, L.M.; Tarnow, L.; Hansen, T.K.; Parving, H.H.; Flyvbjerg, A. Plasma osteoprotegerin levels are associated with glycaemic status, systolic blood pressure, kidney function and cardiovascular morbidity in type 1 diabetic patients. Eur. J. Endocrinol. 2006, 154, 75–81. [Google Scholar] [CrossRef][Green Version]
- Nagy, E.E.; Varga-Fekete, T.; Puskas, A.; Kelemen, P.; Brassai, Z.; Szekeres-Csiki, K.; Gombos, T.; Csanyi, M.C.; Harsfalvi, J. High circulating osteoprotegerin levels are associated with non-zero blood groups. BMC Cardiovasc. Disord. 2016, 16, 1–8. [Google Scholar] [CrossRef]
- Kadoglou, N.P.E.; Gerasimidis, T.; Golemati, S.; Kapelouzou, A.; Karayannacos, P.E.; Liapis, C.D. The relationship between serum levels of vascular calcification inhibitors and carotid plaque vulnerability. J. Vasc. Surg. 2008, 47, 55–62. [Google Scholar] [CrossRef]
- Anand, D.V.; Lahiri, A.; Lim, E.; Hopkins, D.; Corder, R. The relationship between plasma osteoprotegerin levels and coronary artery calcification in uncomplicated type 2 diabetic subjects. J. Am. Coll. Cardiol. 2006, 47, 1850–1857. [Google Scholar] [CrossRef]
- Anand, D.V.; Lim, E.; Darko, D.; Bassett, P.; Hopkins, D.; Lipkin, D.; Corder, R.; Lahiri, A. Determinants of progression of coronary artery calcification in type 2 diabetes. J. Am. Coll. Cardiol. 2007, 50, 2218–2225. [Google Scholar] [CrossRef]
- Omland, T.; Drazner, M.H.; Ueland, T.; Abedin, M.; Murphy, S.A.; Aukrust, P.; de Lemos, J.A. Plasma osteoprotegerin levels in the general population—Relation to indices of left ventricular structure and function. Hypertension 2007, 49, 1392–1398. [Google Scholar] [CrossRef]
- Helske, S.; Kovanen, P.T.; Lindstedt, K.A.; Salmela, K.; Lommi, J.; Turto, H.; Werkkala, K.; Kupari, M. Increased circulating concentrations and augmented myocardial extraction of osteoprotegerin in heart failure due to left ventricular pressure overload. Eur. J. Heart Fail. 2007, 9, 357–363. [Google Scholar] [CrossRef]
- Morony, S.; Sage, A.P.; Corbin, T.; Lu, J.; Tintut, Y.; Demer, L.L. Enhanced Mineralization Potential of Vascular Cells from SM22 alpha-Rankl (tg) Mice. Calcif. Tissue Int. 2012, 91, 379–386. [Google Scholar] [CrossRef][Green Version]
- Deuell, K.A.; Callegari, A.; Giachelli, C.M.; Rosenfeld, M.E.; Scatena, M. RANKL Enhances Macrophage Paracrine Pro-Calcific Activity in High Phosphate-Treated Smooth Muscle Cells: Dependence on IL-6 and TNF-alpha. J. Vasc. Res. 2012, 49, 510–521. [Google Scholar] [CrossRef]
- Wang, J.H.; Lee, C.J.; Chen, M.L.; Yang, C.F.; Chen, Y.C.; Hsu, B.G. Association of Serum Osteoprotegerin Levels With Carotid-Femoral Pulse Wave Velocity in Hypertensive Patients. J. Clin. Hypertens. 2014, 16, 301–308. [Google Scholar] [CrossRef]
- Shargorodsky, M.; Boaz, M.; Luckish, A.; Matas, Z.; Gaivish, D.; Mashavi, M. Osteoprotegerin as an independent marker of subclinical atherosclerosis in osteoporotic postmenopausal women. Atherosclerosis 2009, 204, 608–611. [Google Scholar] [CrossRef]
- Buleu, F.N.; Luca, C.T.; Tudor, A.; Badalica-Petrescu, M.; Caraba, A.; Pah, A.; Georgescu, D.; Christodorescu, R.; Dragan, S. Correlations between Vascular Stiffness Indicators, OPG, and 25-OH Vitamin D3 Status in Heart Failure Patients. Med. Lith. 2019, 55. [Google Scholar] [CrossRef]
- Hou, J.S.; Lin, Y.L.; Wang, C.H.; Lai, Y.H.; Kuo, C.H.; Subeq, Y.M.; Hsu, B.G. Serum osteoprotegerin is an independent marker of central arterial stiffness as assessed using carotid-femoral pulse wave velocity in hemodialysis patients: A cross sectional study. BMC Nephrol. 2019, 20. [Google Scholar] [CrossRef]
- Scialla, J.J.; Leonard, M.B.; Townsend, R.R.; Appel, L.; Wolf, M.; Budoff, M.J.; Chen, J.; Lustigova, E.; Gadegbeku, C.A.; Glenn, M.; et al. Correlates of Osteoprotegerin and Association with Aortic Pulse Wave Velocity in Patients with Chronic Kidney Disease. Clin. J. Am. Soc. Nephrol. 2011, 6, 2612–2619. [Google Scholar] [CrossRef] [PubMed]
- Aoki, A.; Murata, M.; Asano, T.; Ikoma, A.; Sasaki, M.; Saito, T.; Otani, T.; Jinbo, S.; Ikeda, N.; Kawakami, M.; et al. Association of serum osteoprotegerin with vascular calcification in patients with type 2 diabetes. Cardiovasc. Diabetol. 2013, 12. [Google Scholar] [CrossRef]
- Morisawa, T.; Nakagomi, A.; Kohashi, K.; Kosugi, M.; Kusama, Y.; Atarashi, H.; Shimizu, W. Osteoprotegerin is Associated With Endothelial Function and Predicts Early Carotid Atherosclerosis in Patients With Coronary Artery Disease. Int. Heart J. 2015, 56, 605–612. [Google Scholar] [CrossRef]
- Vik, A.; Mathiesen, E.B.; Brox, J.; Wilsgaard, T.; Njolstad, I.; Jorgensen, L.; Hansen, J.B. Relation between serum osteoprotegerin and carotid intima media thickness in a general population—The Tromso Study. J. Thromb. Haemost. 2010, 8, 2133–2139. [Google Scholar] [CrossRef]
- Nie, B.; Zhang, S.Y.; Guan, S.M.; Zhou, S.Q.; Fang, X. Role of Wnt/beta-Catenin Pathway in the Arterial Medial Calcification and Its Effect on the OPG/RANKL System. Curr. Med. Sci. 2019, 39, 28–36. [Google Scholar] [CrossRef]
- Vikram, A.; Kim, Y.R.; Kumar, S.; Naqvi, A.; Hoffman, T.A.; Kumar, A.; Miller, F.J.; Kim, C.S.; Irani, K. Canonical Wnt Signaling Induces Vascular Endothelial Dysfunction via p66(Shc)-Regulated Reactive Oxygen Species. Arterioscler. Thromb. Vasc. Biol. 2014, 34, 2301–2309. [Google Scholar] [CrossRef]
- Wang, F.; Liu, Z.; Park, S.H.; Gwag, T.; Lu, W.W.; Ma, M.R.; Sui, Y.P.; Zhou, C.C. Myeloid beta catenin Deficiency Exacerbates Atherosclerosis in Low-density Lipoprotein-receptor Deficient Mice. Arterioscler. Thromb. Vasc. Biol. 2018, 38. [Google Scholar] [CrossRef]
- Krishna, S.M.; Seto, S.W.; Jose, R.J.; Li, J.; Morton, S.K.; Biros, E.; Wang, Y.; Nsengiyumva, V.; Lindeman, J.H.N.; Loots, G.G.; et al. Wnt Signaling Pathway Inhibitor Sclerostin Inhibits Angiotensin II-Induced Aortic Aneurysm and Atherosclerosis. Arterioscler. Thromb. Vasc. Biol. 2017, 37, 553–566. [Google Scholar] [CrossRef]
- Tian, B.Y.; Yao, L.; Sheng, Z.T.; Wan, P.Z.; Qiu, X.B.; Wang, J.; Xu, T.H. Specific knockdown of WNT8b expression protects against phosphate-induced calcification in vascular smooth muscle cells by inhibiting the Wnt-β-catenin signaling pathway. J. Cell. Physiol. 2019, 234, 3469–3477. [Google Scholar] [CrossRef]
- De Mare, A.; Maudsley, S.; Azmi, A.; Hendrickx, J.O.; Opdebeeck, B.; Neven, E.; D’Haese, P.C.; Verhulst, A. Sclerostin as Regulatory Molecule in Vascular Media Calcification and the Bone-Vascular Axis. Toxins 2019, 11. [Google Scholar] [CrossRef]
- Evenepoel, P.; Goffin, E.; Meijers, B.; Kanaan, N.; Bammens, B.; Coche, E.; Claes, K.; Jadoul, M. Sclerostin Serum Levels and Vascular Calcification Progression in Prevalent Renal Transplant Recipients. J. Clin. Endocrinol. Metab. 2015, 100, 4669–4676. [Google Scholar] [CrossRef]
- Ho, T.Y.; Chen, N.C.; Hsu, C.Y.; Huang, C.W.; Lee, P.T.; Chou, K.J.; Fang, H.C.; Chen, C.L. Evaluation of the association of Wnt signaling with coronary artery calcification in patients on dialysis with severe secondary hyperparathyroidism. BMC Nephrol. 2019, 20. [Google Scholar] [CrossRef] [PubMed]
- Lee, Y.T.; Ng, H.Y.; Chiu, T.T.Y.; Li, L.C.; Pei, S.N.; Kuo, W.H.; Lee, C.T. Association of bone-derived biomarkers with vascular calcification in chronic hemodialysis patients. Clin. Chim. Acta 2016, 452, 38–43. [Google Scholar] [CrossRef] [PubMed]
- Chang, Y.C.; Hsu, B.G.; Liou, H.H.; Lee, C.J.; Wang, J.H. Serum levels of sclerostin as a potential biomarker in central arterial stiffness among hypertensive patients. BMC Cardiovasc. Disord. 2018, 18. [Google Scholar] [CrossRef]
- Hsu, B.G.; Liou, H.H.; Lee, C.J.; Chen, Y.C.; Ho, G.J.; Lee, M.C. Serum Sclerostin as an Independent Marker of Peripheral Arterial Stiffness in Renal Transplantation Recipients A Cross-Sectional Study. Medicine 2016, 95. [Google Scholar] [CrossRef] [PubMed]
- Morena, M.; Jaussent, I.; Dupuy, A.M.; Bargnoux, A.S.; Kuster, N.; Chenine, L.; Leray-Moragues, H.; Klouche, K.; Vernhet, H.; Canaud, B.; et al. Osteoprotegerin and sclerostin in chronic kidney disease prior to dialysis: Potential partners in vascular calcifications. Nephrol. Dial. Transplant. 2015, 30, 1345–1356. [Google Scholar] [CrossRef]


| Variables | Median (Quartile Range)/Mean ± SE | PWVlo Group (n = 41) | PWVhi Group (n = 37) | p-Values |
|---|---|---|---|---|
| Demographic and clinical parameters | ||||
| Age (years) | 66.5 (58–76) | 60 (52–65) | 76 (72–80) | <0.0001 |
| Gender (f/m) | 21 (26.9)/57 (73.1) | 6 (14.6)/35 (85.4) | 15 (40.5)/22 (59.5) | 0.011 |
| Body mass index (kg/m2) * | 27.31 ± 0.61 | 27.32 ± 0.82 | 27.29 ± 0.92 | 0.978 |
| Ejection fraction (≤30%/>30%) | 43 (57.1)/35 (44.9) | 28 (68.3)/13 (31.7) | 15 (40.5)/22 (59.5) | 0.022 |
| Left-ventricular ejection fraction (%) | 30 (25–40) | 30 (20–35) | 40 (30–40) | 0.002 |
| Left-ventricular end-diastolic diameter (mm) * | 60.60 ± 1.05 | 62.76 ± 1.64 | 58.22 ± 1.18 | 0.03 |
| Global heart failure (y/n) | 57 (73.1)/21 (26.9) | 32 (78.1)/9 (21.9) | 25 (67.6)/12 (32.4) | 0.319 |
| Left ventricular failure (y/n) | 44 (56.4)/34 (43.6) | 20 (48.8)/21 (51.2) | 13 (35.1)/24 (64.9) | 0.176 |
| History of atrial fibrillation | 18 (23.1)/60 (76.9) | 5 (12.2)/36 (87.8) | 13 (35.1)/24 (64.9) | 0.029 |
| Coronary artery disease (y/n) | 33 (42.3)/45 (57.7) | 14 (34.2)/27 (65.8) | 19 (51.4)/18 (48.6) | 0.169 |
| Atherosclerotic disease (y/n) | 39 (50)/39 (50) | 18 (43.9)/23 (56.1) | 21 (56.8)/16 (43.2) | 0.364 |
| Hypertension (y/n) | 43 (55.1)/35 (44.9) | 23 (56.1)/18 (43.9) | 25 (67.6)/12 (32.4) | 0.043 |
| Diabetes (y/n) | 55 (70.5)/23 (29.5) | 30 (73.2)/11 (26.8) | 25 (67.6)/12 (32.4) | 0.626 |
| Peripheral arterial disease (y/n) | 7 (9)/71 (91) | 2 (4.9)/39 (95.2) | 5 (13.5)/32 (86.5) | 0.246 |
| Carotid atherosclerotic disease (y/n) | 10 (12.8)/68 (87.2) | 3 (7.3)/38 (92.7) | 7 (18.9)/30 (81.1) | 0.178 |
| Valvular disease | 31 (39.7)/47 (60.3) | 13 (31.7)/28 (68.3) | 18 (48.6)/19 (51.4) | 0.166 |
| Laboratory parameters and biomarkers | ||||
| Hemoglobin (d/dL) * | 13.73 ± 0.21 | 13.97 ± 0.23 | 13.45 ± 0.36 | 0.217 |
| Platelet count (k/μL) * | 206.75 ± 6.05 | 205.08 ± 8.27 | 208.6 ± 9.0 | 0.774 |
| Glomerular filtration rate (mL/min/1.73 m2) * | 68.10 ± 2.57 | 73.07 ± 3.79 | 62.58 ± 3.22 | 0.04 |
| C-reactive protein (mg/L) | 0.91 (0.25–1.8) | 0.68 (0.19–1.72) | 1.04 (0.45–2.3) | 0.103 |
| Fibrinogen (mg/dL) | 359 (295–481) | 351 (278–450) | 365 (318.3–520) | 0.339 |
| Serum iron (μg/dL) | 60 (45–84) | 65 (46–87) | 57 (45–80) | 0.612 |
| Glucose (mg/dL) | 109 (92–134) | 100 (90–115) | 119 (95–141) | 0.038 |
| Triglicerids (mg/dL) | 111.5 (93–150) | 110 (96–150) | 115 (90–150) | 0.96 |
| HDL cholesterol (mg/dL) | 45 (36–51) | 45 (36.3–55) | 44.7 (36–50) | 0.591 |
| LDL cholesterol (mg/dL) | 96.3 (78.3–125) | 96.3 (81.8–120.5) | 97 (77–128) | 0.72 |
| Uric acid (mg/dL) | 6.9 (5.6–8.3) | 6.8 (6–8.6) | 7 (5.6–8) | 0.577 |
| NT pro-BNP (pg/mL) | 2089.5 (862.1–3089) | 2388 (862.1–3604) | 1865 (898.9–2713) | 0.309 |
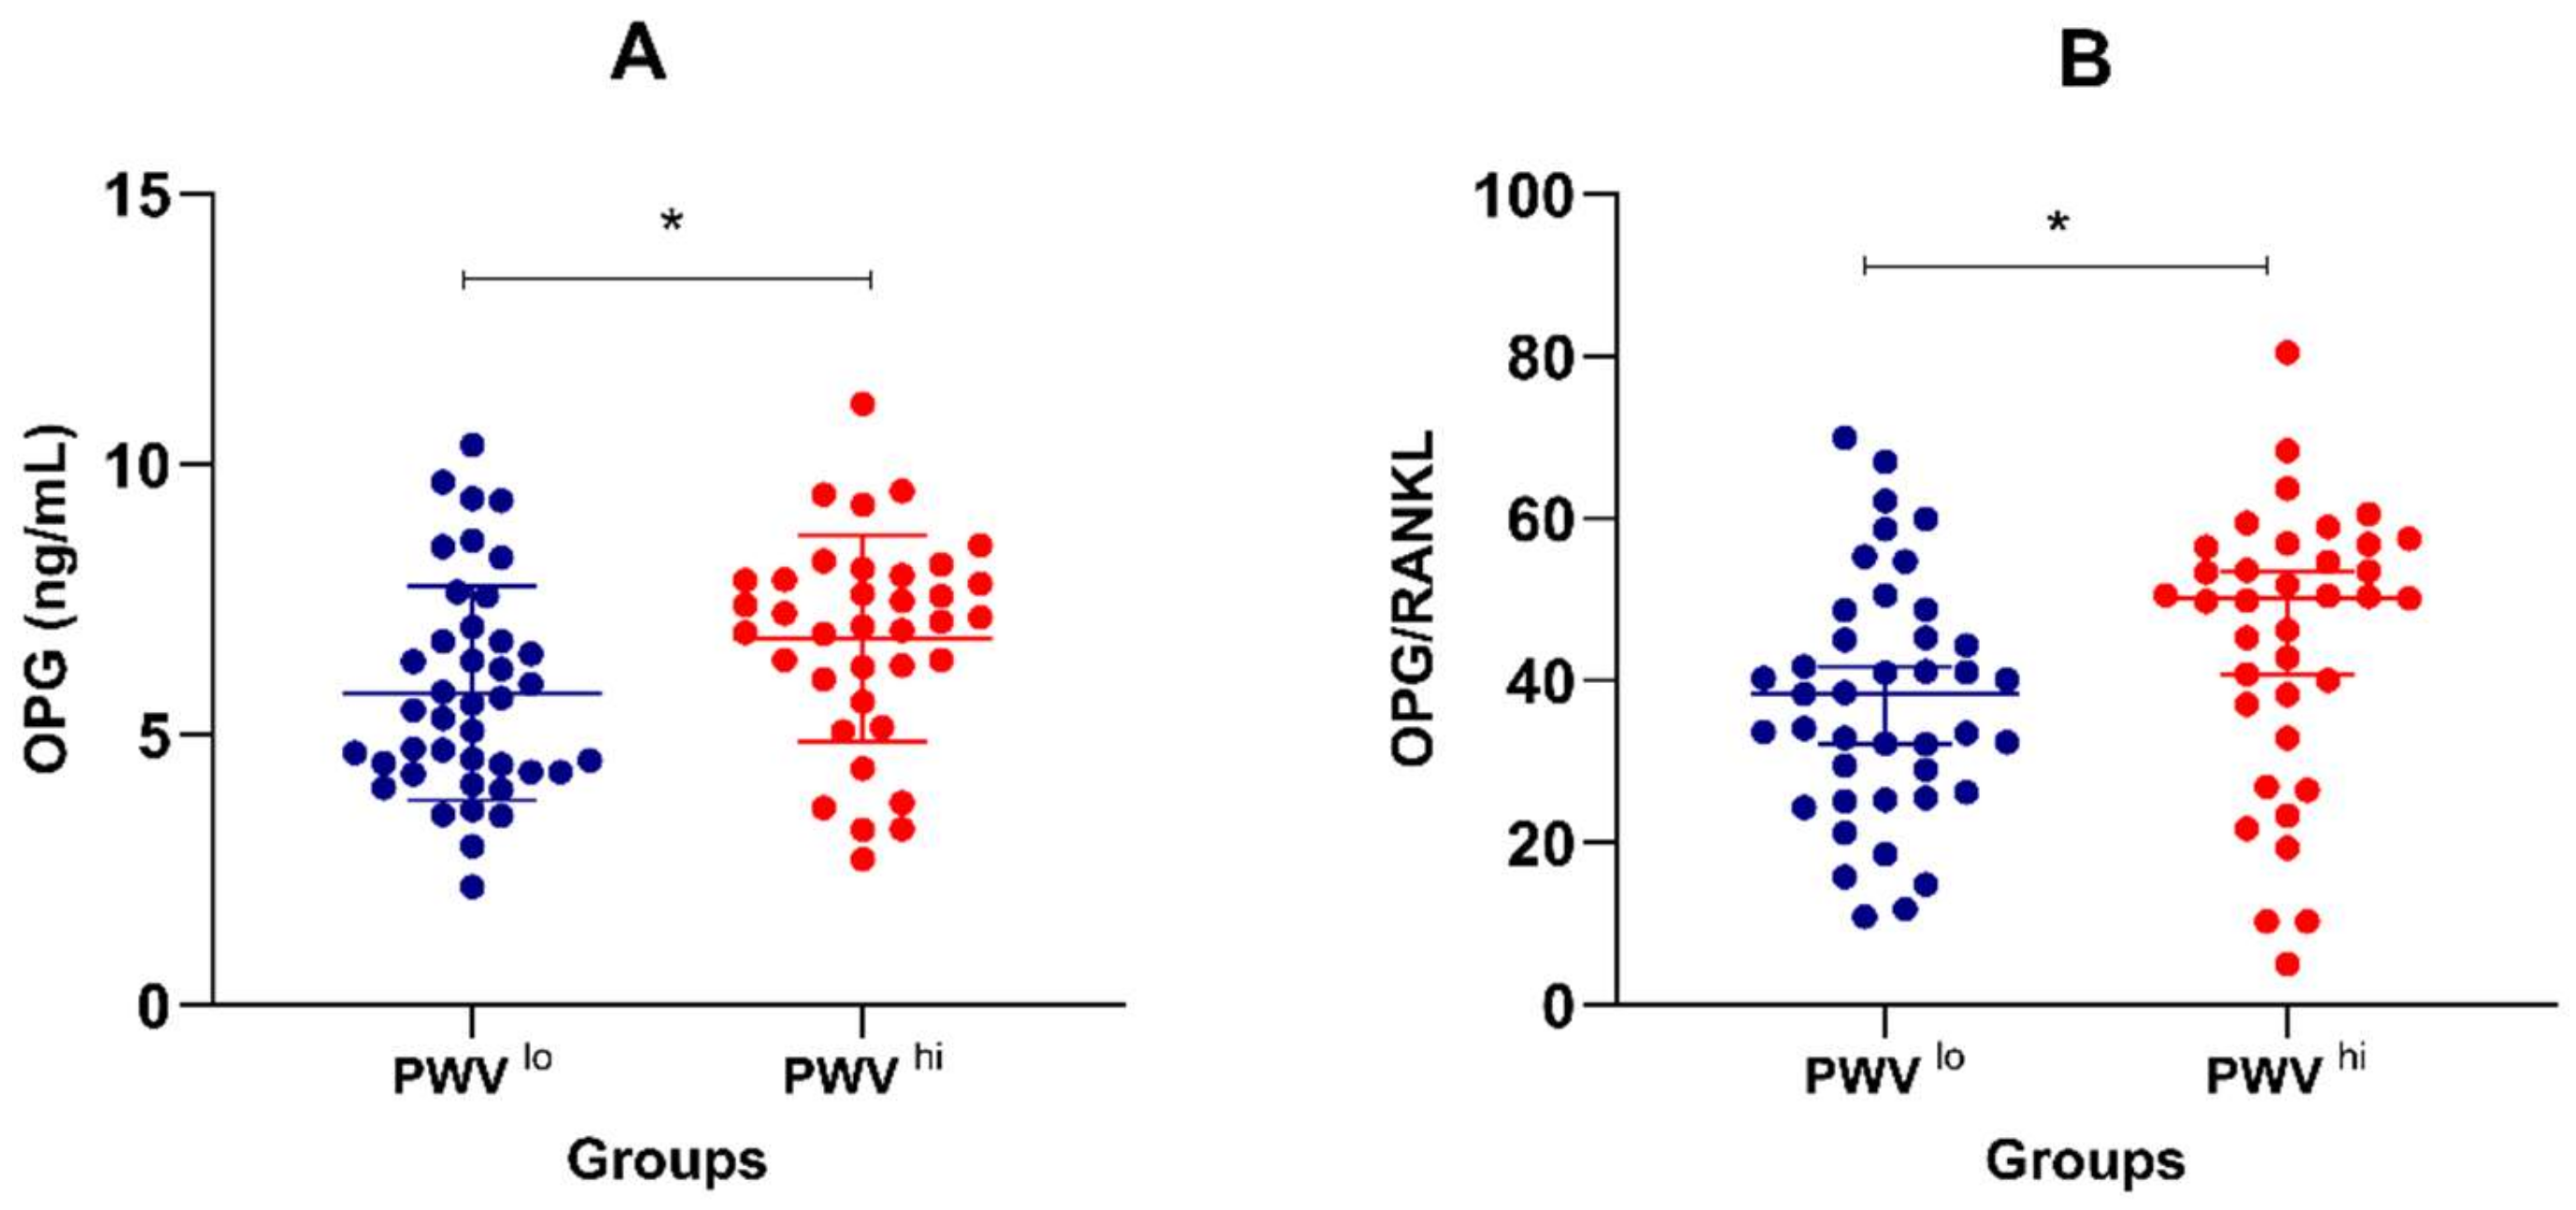
| Osteoprotegerin (ng/mL) * | 6.25 ± 0.23 | 5.77 ± 0.31 | 6.78 ± 0.31 | 0.024 |
| RANKL (pg/mL) | 138.7 (138.2–148.2) | 138.6 (138.2–148.2) | 138.7 (138.2–147.6) | 0.858 |
| Sclerostin (pg/mL) | 239.4 (209.8–360.9) | 231.4 (203–288.4) | 242.6 (220.3–366.3) | 0.201 |
| DKK1 (pg/mL) | 304.9 (183.6–583.4) | 353.2 (203.6–625.5) | 265 (182.8–574.3) | 0.251 |
| Osteoprotegerin/RANKL ratio | 41.0 (28.9–53.5) | 38.3 (26.3–45.3) | 50.2 (37.1–56.4) | 0.029 |
| Ankle–brachial index | 1 (0.87–1.15) | 1 (0.9–1.13) | 1 (0.87–1.2) | 0.705 |
| Intima-media thickness (mm) | 1 (0.8–1.3) | 0.8 (0.8–1.1) | 1.2 (0.9–1.3) | <0.0001 |
| Pulse-wave velocity (m/s) * | 9.62 ± 0.26 | 7.79 ± 0.18 | 11.64 ± 0.20 | <0.0001 |
| Lifestyle and medication | ||||
| Exercise level (≤30 min/week/>30 min/week) | 43 (57.1)/35 (44.9) | 19 (46.3)/22 (53.7) | 24 (64.9)/13 (35.1) | 0.1 |
| ACE inhibitors (y/n) | 33 (42.3)/45 (57.7) | 15 (36.6)/26 (63.4) | 18 (48.6)/19 (51.4) | 0.359 |
| Diuretics (y/n) | 67 (85.9)/11 (14.1) | 34 (82.9)/7 (17.1) | 33 (89.2)/4 (10.8) | 0.524 |
| Calcium blockers (y/n) | 7 (9)/71 (91) | 1 (2.4)/40 (97.6) | 6 (16.2)/31 (83.8) | 0.048 |
| Angiotensin receptor antagonists (y/n) | 6 (7.7)/72 (92.3) | 2 (4.9)/39 (95.1) | 4 (10.8)/33 (89.2) | 0.415 |
| Beta blockers (y/n) | 67 (85.9)/11 (14.1) | 35 (85.4)/6 (14.6) | 32 (86.5)/5 (13.5) | 1 |
| Nitrates (y/n) | 13 (16.6)/65 (83.3) | 5 (12.2)/36 (87.8) | 8 (21.6)/29 (78.4) | 0.364 |
| Antiaggregants (y/n) | 31 (39.7)/47 (60.3) | 16 (39)/25 (61) | 15 (40.5)/22 (59.6) | 1 |
| Anticoagulants (y/n) | 49 (62.8)/29 (37.2) | 25 (61)/16 (39) | 24 (64.9)/13 (35.1) | 0.816 |
| Statins (y/n) | 30 (38.5)/48 (61.5) | 15 (36.6)/26 (63.4) | 15 (40.5)/22 (59.5) | 0.816 |
| Variables | All Cases (n = 78) | PVWlo Group (n = 41) | PWVhi Group (n = 37) | |||
|---|---|---|---|---|---|---|
| Spearman/Pearson’s R | p-Value | Spearman/Pearson’s R | p-Value | Spearman/Pearson’s R | p-Value | |
| Age | 0.875 | <0.0001 | 0.893 | <0.0001 | 0.571 | <0.0001 |
| Body mass index * | −0.123 | 0.282 | 0.017 | 0.918 | −0.471 | 0.003 |
| Left-ventricular ejection fraction | 0.344 | 0.002 | 0.277 | 0.079 | −0.218 | 0.195 |
| Left-ventricular end-diastolic diameter * | −0.339 | 0.002 | −0.374 | 0.016 | −0.085 | 0.616 |
| Hemoglobin * | −0.191 | 0.094 | −0.066 | 0.679 | −0.188 | 0.263 |
| Platelet count * | 0.021 | 0.850 | −0.001 | 0.483 | 0.091 | 0.592 |
| Glomerular filtration rate * | −0.370 | 0.0010 | −0.318 | 0.043 | −0.367 | 0.025 |
| C-reactive protein | 0.259 | 0.022 | 0.294 | 0.054 | 0.300 | 0.079 |
| Fibrinogen | 0.154 | 0.177 | 0.130 | 0.418 | 0.096 | 0.573 |
| Serum iron | −0.141 | 0.218 | −0.041 | 0.798 | −0.332 | 0.045 |
| Creatinine | 0.139 | 0.226 | 0.195 | 0.222 | 0.285 | 0.087 |
| Urea | 0.189 | 0.098 | 0.202 | 0.206 | 0.296 | 0.075 |
| Glucose | 0.233 | 0.040 | 0.028 | 0.864 | 0.126 | 0.458 |
| Triglicerides | −0.034 | 0.767 | −0.114 | 0.479 | 0.027 | 0.874 |
| HDL cholesterol | 0.077 | 0.504 | 0.448 | 0.003 | 0.003 | 0.985 |
| LDL cholesterol | −0.101 | 0.381 | −0.032 | 0.845 | −0.246 | 0.142 |
| Uric acid | −0.087 | 0.449 | −0.012 | 0.941 | −0.122 | 0.470 |
| NT-proBNP | −0.079 | 0.491 | −0.051 | 0.751 | 0.180 | 0.284 |
| Osteoprotegerin * | 0.371 | 0.0010 | 0.281 | 0.074 | 0.330 | 0.046 |
| RANKL | −0.042 | 0.717 | −0.169 | 0.292 | −0.053 | 0.755 |
| Sclerostin | 0.291 | 0.0097 | 0.371 | 0.017 | 0.278 | 0.095 |
| DKK1 | −0.095 | 0.409 | 0.175 | 0.272 | −0.109 | 0.522 |
| Osteoprotegerin/RANKL ratio | 0.369 | 0.0009 | 0.280 | 0.077 | 0.387 | 0.018 |
| Ankle–brachial index | 0.078 | 0.499 | 0.046 | 0.775 | 0.096 | 0.574 |
| Intima-media thickness | 0.552 | <0.0001 | 0.719 | <0.0001 | 0.068 | 0.689 |
| (A) | ||||
|---|---|---|---|---|
| Model 1. Summary of the Stepwise Regression | ||||
| Variables | Multiple R | R-Square Change | F-to-Enter/Rem | p-Level |
| Intima-media thickness | 0.500 | 0.250 | 25.383 | <0.0001 |
| Gender | 0.581 | 0.088 | 9.920 | 0.002 |
| Osteoprotegerin | 0.629 | 0.057 | 6.992 | 0.010 |
| Hypertension | 0.652 | 0.030 | 3.762 | 0.056 |
| Ventricular wall thickness | 0.661 | 0.013 | 1.634 | 0.205 |
| Sclerostin | 0.671 | 0.013 | 1.657 | 0.202 |
| Exercise score | 0.679 | 0.011 | 1.426 | 0.236 |
| (B) | ||||
| Model 2. Summary of the Stepwise Regression | ||||
| Variables | Multiple R | R-Square Change | F-to-Enter/Rem | p-Level |
| Intima-media thickness | 0.675 | 0.456 | 32.713 | <0.0001 |
| Sclerostin | 0.727 | 0.073 | 5.884 | 0.020 |
| Ventricular wall thickness | 0.763 | 0.054 | 4.749 | 0.036 |
| Hypertension | 0.788 | 0.039 | 3.699 | 0.062 |
| Model 1. | ||
|---|---|---|
| Variables | Odds Ratio (95% CI) | p-Value |
| Osteoprotegerin (pg/mL), tertile 3: tertile 1 | 3.02 (1.13–8.07) | 0.032 |
| Intima-media thickness (mm), tertile 3: tertile 1 | 3.75 (1.40–10.01) | 0.029 |
| Ejection fraction (>30%/≤30%) | 3.16 (1.24–8.00) | 0.154 |
| NT-proBNP (low/high) | 1.31 (0.50–3.39) | 0.920 |
| Model 2. | ||
| Variables | Odds Ratio (95% CI) | p-Value |
| Osteoprotegerin (pg/mL), tertile 3: tertile 1 | 3.02 (1.13–8.07) | 0.039 |
| Intima-media thickness (mm), tertile 3: tertile 1 | 3.75 (1.40–10.01) | 0.017 |
| Hypertension (yes/no) | 2.66 (1.05–6.70) | 0.341 |
| Atherosclerotic manifestation (yes/no) | 1.67 (0.68–4.11) | 0.887 |
Publisher’s Note: MDPI stays neutral with regard to jurisdictional claims in published maps and institutional affiliations. |
© 2021 by the authors. Licensee MDPI, Basel, Switzerland. This article is an open access article distributed under the terms and conditions of the Creative Commons Attribution (CC BY) license (https://creativecommons.org/licenses/by/4.0/).
Share and Cite
Fehérvári, L.; Frigy, A.; Kocsis, L.; Szabó, I.A.; Szabo, T.M.; Urkon, M.; Jakó, Z.; Nagy, E.E. Serum Osteoprotegerin and Carotid Intima-Media Thickness Are Related to High Arterial Stiffness in Heart Failure with Reduced Ejection Fraction. Diagnostics 2021, 11, 764. https://doi.org/10.3390/diagnostics11050764
Fehérvári L, Frigy A, Kocsis L, Szabó IA, Szabo TM, Urkon M, Jakó Z, Nagy EE. Serum Osteoprotegerin and Carotid Intima-Media Thickness Are Related to High Arterial Stiffness in Heart Failure with Reduced Ejection Fraction. Diagnostics. 2021; 11(5):764. https://doi.org/10.3390/diagnostics11050764
Chicago/Turabian StyleFehérvári, Lajos, Attila Frigy, Lóránd Kocsis, István Adorján Szabó, Timea Magdolna Szabo, Melinda Urkon, Zita Jakó, and Előd Ernő Nagy. 2021. "Serum Osteoprotegerin and Carotid Intima-Media Thickness Are Related to High Arterial Stiffness in Heart Failure with Reduced Ejection Fraction" Diagnostics 11, no. 5: 764. https://doi.org/10.3390/diagnostics11050764
APA StyleFehérvári, L., Frigy, A., Kocsis, L., Szabó, I. A., Szabo, T. M., Urkon, M., Jakó, Z., & Nagy, E. E. (2021). Serum Osteoprotegerin and Carotid Intima-Media Thickness Are Related to High Arterial Stiffness in Heart Failure with Reduced Ejection Fraction. Diagnostics, 11(5), 764. https://doi.org/10.3390/diagnostics11050764