An Improved qFibrosis Algorithm for Precise Screening and Enrollment into Non-Alcoholic Steatohepatitis (NASH) Clinical Trials

 , , , and
Abstract
1. Introduction
2. Materials and Methods
2.1. Study Population and Samples
2.2. Image Acquisition
2.3. Assessment of Fibrosis Stage
2.4. Differences between One-Time Readings and Real-Time Readings
2.5. Consensus Read
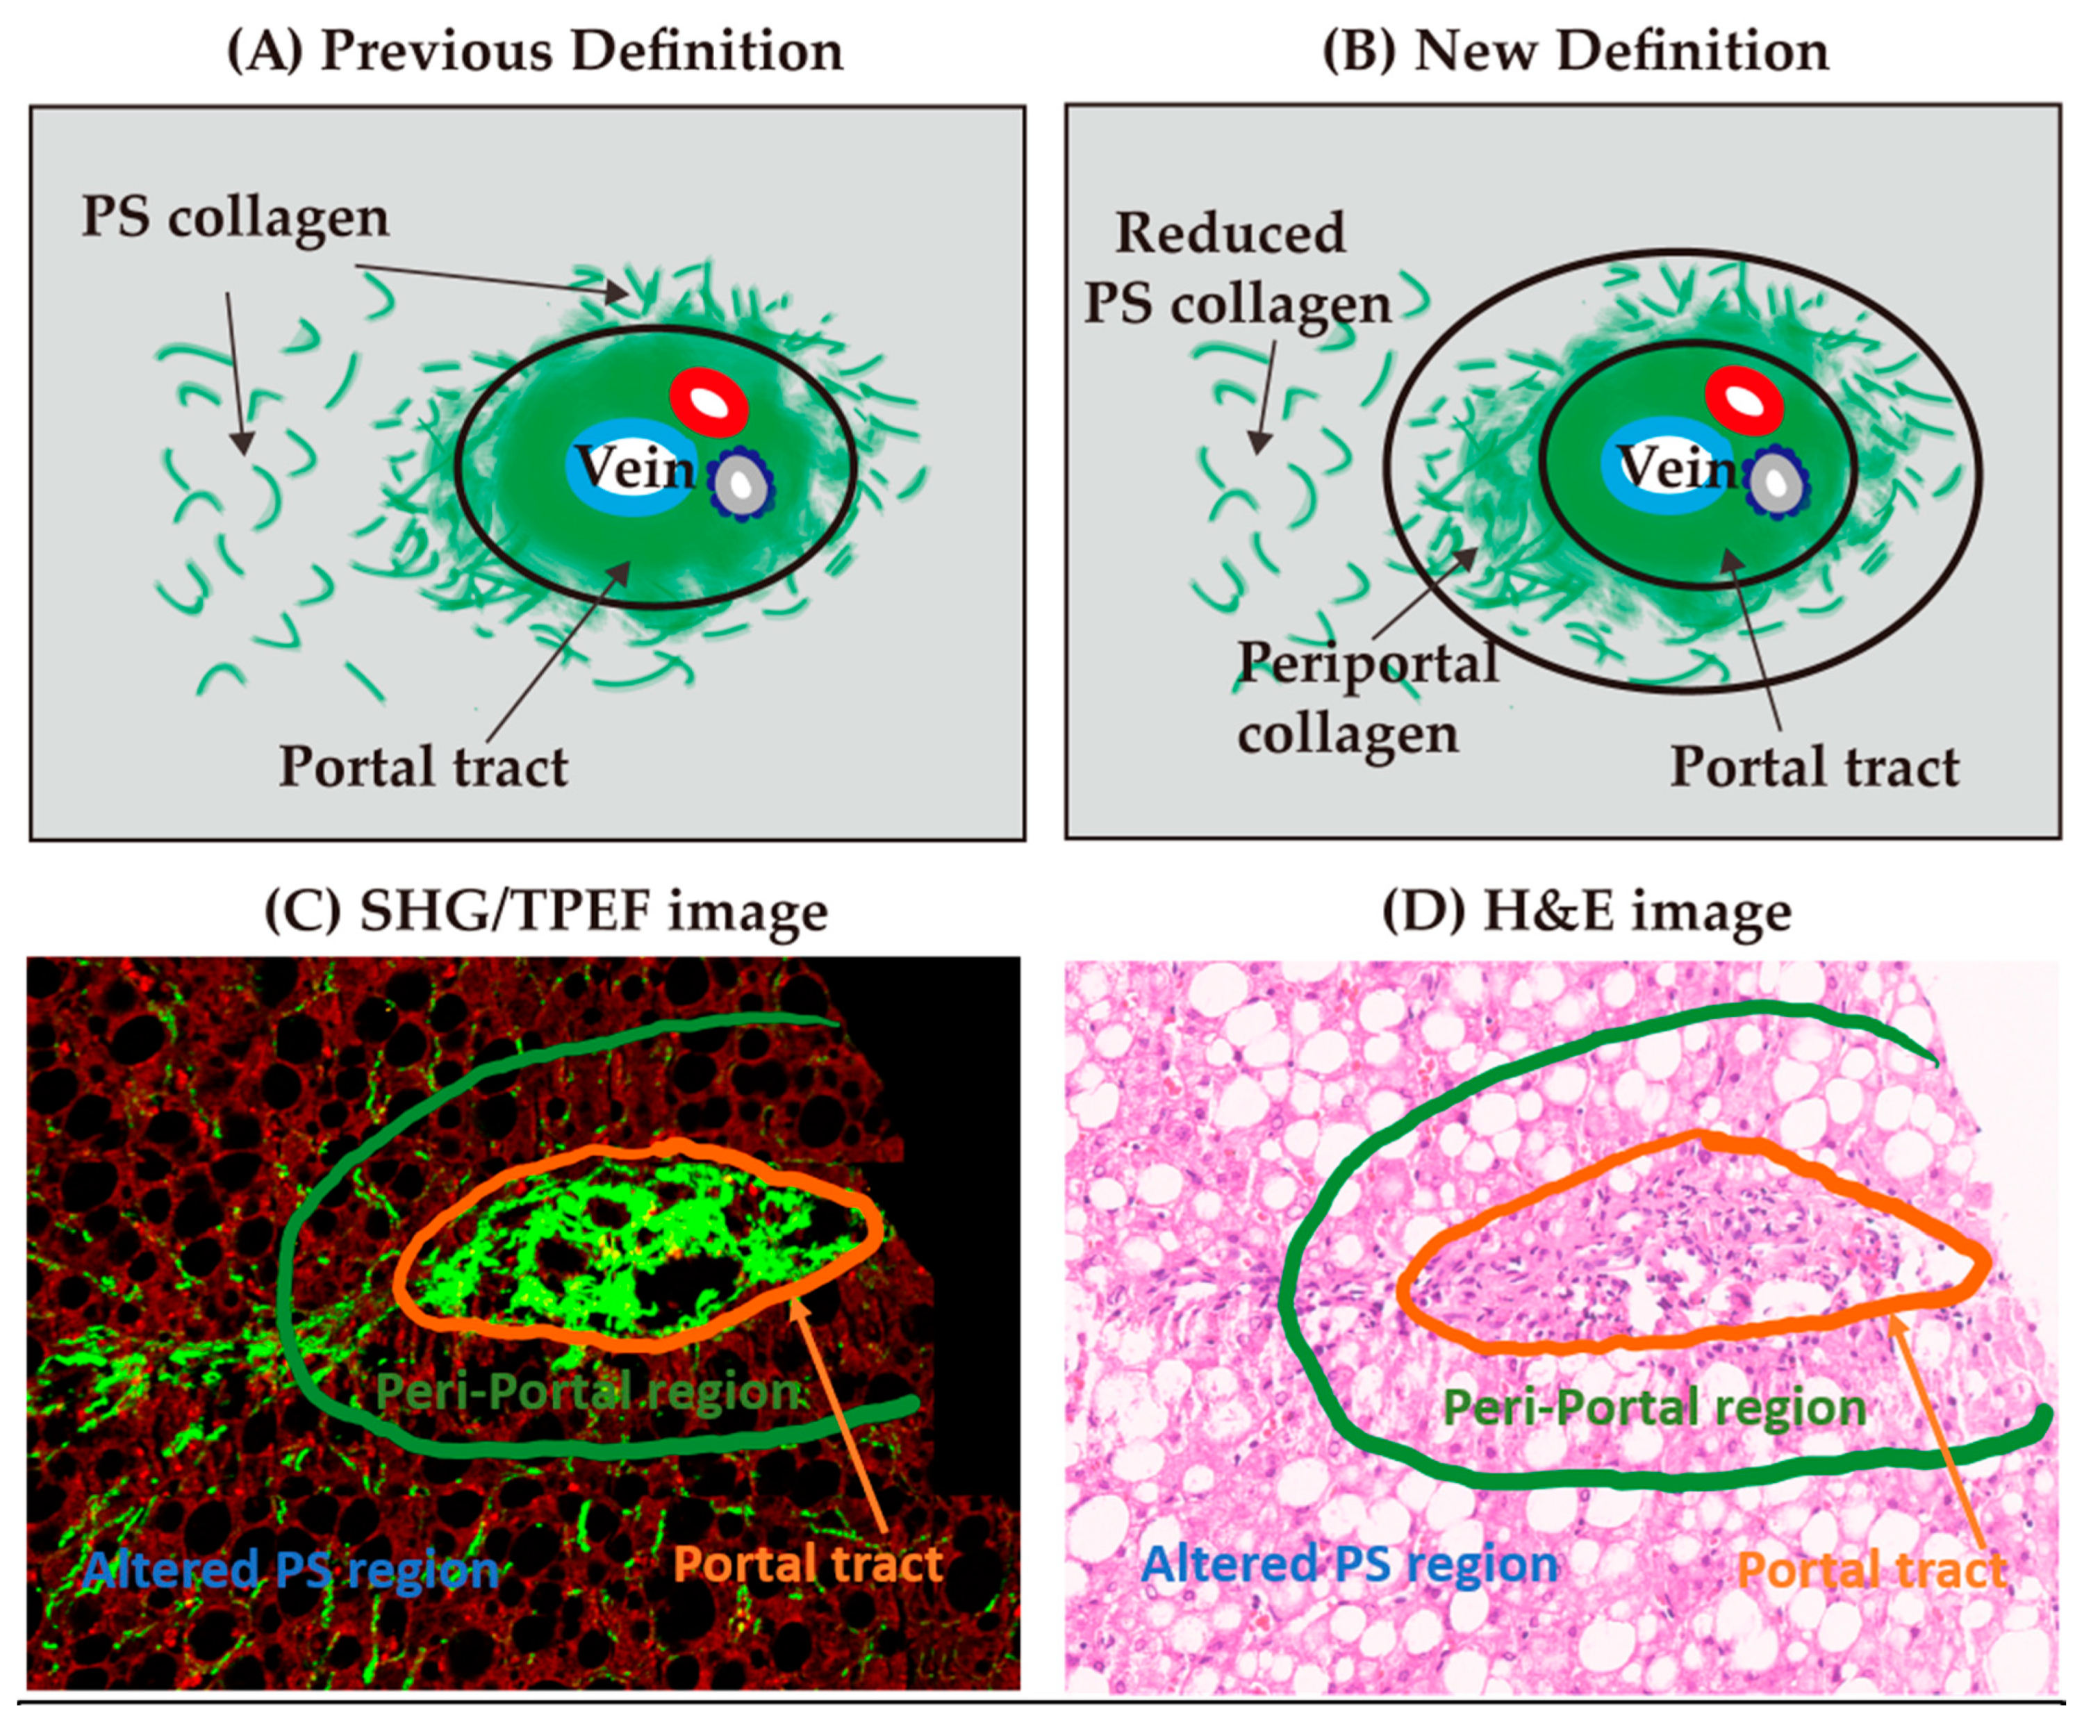
2.6. Creation of Periportal Parameters for the Refined qFibrosis Algorithm
2.7. Validation of the Improved qFibrosis Algorithm
2.8. Statistical Analysis
3. Results
4. Discussion
5. Conclusions
Author Contributions
Funding
Acknowledgments
Conflicts of Interest
References
- EASL–EASD–EASO Clinical Practice Guidelines for the management of non-alcoholic fatty liver disease. J. Hepatol. 2016, 64, 1388–1402. [CrossRef] [PubMed]
- Satapathy, S.K.; Sanyal, A.J. Epidemiology and Natural History of Nonalcoholic Fatty Liver Disease. Semin. Liver Dis. 2015, 35, 221–235. [Google Scholar] [CrossRef] [PubMed]
- Zhu, J.-Z.; Dai, Y.-N.; Wang, Y.-M.; Zhou, Q.-Y.; Yu, C.-H.; Li, Y.-M. Prevalence of Nonalcoholic Fatty Liver Disease and Economy. Dig. Dis. Sci. 2015, 60, 3194–3202. [Google Scholar] [CrossRef] [PubMed]
- Goh, G.B.B.; McCullough, A.J. Natural History of Nonalcoholic Fatty Liver Disease. Dig. Dis. Sci. 2016, 61, 1226–1233. [Google Scholar] [CrossRef] [PubMed]
- Chalasani, N.; Younossi, Z.M.; LaVine, J.E.; Charlton, M.; Cusi, K.; Rinella, M.; Harrison, S.A.; Brunt, E.M.; Sanyal, A.J. The diagnosis and management of nonalcoholic fatty liver disease: Practice guidance from the American Association for the Study of Liver Diseases. Hepatology 2017, 67, 328–357. [Google Scholar] [CrossRef]
- Brunt, E.M. Nonalcoholic steatohepatitis. Semin. Liver Dis. 2004, 24, 3–20. [Google Scholar] [CrossRef]
- Younossi, Z.M.; Stepanova, M.; Rafiq, N.; Makhlouf, H.; Younoszai, Z.; Agrawal, R.; Goodman, Z. Pathologic criteria for nonalcoholic steatohepatitis: Interprotocol agreement and ability to predict liver-related mortality. Hepatology 2011, 53, 1874–1882. [Google Scholar] [CrossRef]
- European Association for the Study of the Liver; Asociación Latinoamericana para el Estudio del Hígado. EASL-ALEH Clinical Practice Guidelines: Non-invasive tests for evaluation of liver disease severity and prognosis. J. Hepatol. 2015, 63, 237–264. [Google Scholar] [CrossRef]
- Ekstedt, M.; Hagström, H.; Nasr, P.; Fredrikson, M.; Stål, P.; Kechagias, S.; Hultcrantz, R. Fibrosis stage is the strongest predictor for disease-specific mortality in NAFLD after up to 33 years of follow-up. Hepatology 2015, 61, 1547–1554. [Google Scholar] [CrossRef]
- Angulo, P.; Kleiner, D.E.; Dam-Larsen, S.; Adams, L.A.; Björnsson, E.S.; Charatcharoenwitthaya, P.; Mills, P.R.; Keach, J.C.; Lafferty, H.D.; Stahler, A.; et al. Liver Fibrosis, but No Other Histologic Features, Is Associated With Long-term Outcomes of Patients With Nonalcoholic Fatty Liver Disease. Gastroenterology 2015, 149, 389–397. [Google Scholar] [CrossRef]
- Ogawa, Y.; Yoneda, M.; Kobayashi, T.; Honda, Y.; Kessoku, T.; Imajo, K.; Saito, S.; Nakajima, A. Present and emerging pharmacotherapies for non-alcoholic steatohepatitis in adults. Expert Opin. Pharmacother. 2018, 20, 69–82. [Google Scholar] [CrossRef] [PubMed]
- Ratziu, V.; Friedman, S.L. Why do so many NASH trials fail? Gastroenterology 2020. [Google Scholar] [CrossRef] [PubMed]
- Chang, J.P.E.; Goh, G.B.B.; Leow, W.Q.; Shen, L.; Lim, K.H.; Tan, C.K. Second harmonic generation microscopy provides accurate automated staging of liver fibrosis in patients with non-alcoholic fatty liver disease. PLoS ONE 2018, 13, e0199166. [Google Scholar] [CrossRef] [PubMed]
- Liu, F.; Goh, G.B.; Tiniakos, D.; Wee, A.; Leow, W.; Zhao, J.; Rao, H.; Wang, X.; Wang, Q.; Wan, W.; et al. qFIBS: An Automated Technique for Quantitative Evaluation of Fibrosis, Inflammation, Ballooning, and Steatosis in Patients with Nonalcoholic Steatohepatitis. Hepatology 2020, 71, 1953–1966. [Google Scholar] [CrossRef] [PubMed]
- Xu, S.; Wang, Y.; Tai, D.C.; Wang, S.; Cheng, C.L.; Peng, Q.; Yan, J.; Chen, Y.; Sun, J.; Liang, X.; et al. qFibrosis: A fully-quantitative innovative method incorporating histological features to facilitate accurate fibrosis scoring in animal model and chronic hepatitis B patients. J. Hepatol. 2014, 61, 260–269. [Google Scholar] [CrossRef]
- Brunt, E.M.; Janney, C.G.; Di Bisceglie, A.M.; Neuschwander-Tetri, B.A.; Bacon, B.R. Nonalcoholic steatohepatitis: A proposal for grading and staging the histological lesions. Am. J. Gastroenterol. 1999, 94, 2467–2474. [Google Scholar] [CrossRef]
- Kleiner, D.E.; Brunt, E.M.; Van Natta, M.; Behling, C.; Contos, M.J.; Cummings, O.W.; Ferrell, L.D.; Liu, Y.-C.; Torbenson, M.S.; Unalp-Arida, A.; et al. Design and validation of a histological scoring system for nonalcoholic fatty liver disease. Hepatology 2005, 41, 1313–1321. [Google Scholar] [CrossRef]
- Juluri, R.; Vuppalanchi, R.; Olson, J.; Unalp, A.; Van Natta, M.L.; Cummings, O.W.; Tonascia, J.; Chalasani, N. Generalizability of the Nonalcoholic Steatohepatitis Clinical Research Network Histologic Scoring System for Nonalcoholic Fatty Liver Disease. J. Clin. Gastroenterol. 2011, 45, 55–58. [Google Scholar] [CrossRef]
- Gawrieh, S.; Knoedler, D.M.; Saeian, K.; Wallace, J.R.; Komorowski, R.A. Effects of interventions on intra- and interobserver agreement on interpretation of nonalcoholic fatty liver disease histology. Ann. Diagn. Pathol. 2011, 15, 19–24. [Google Scholar] [CrossRef]
- Jung, E.S.; Lee, K.; Yu, E.; Kang, Y.K.; Cho, M.-Y.; Kim, J.M.; Moon, W.S.; Jeong, J.S.; Park, C.K.; Park, J.-B.; et al. Interobserver Agreement on Pathologic Features of Liver Biopsy Tissue in Patients with Nonalcoholic Fatty Liver Disease. J. Pathol. Transl. Med. 2016, 50, 190–196. [Google Scholar] [CrossRef]
- Pai, R.K. NAFLD Histology: A Critical Review and Comparison of Scoring Systems. Curr. Hepatol. Rep. 2019, 18, 473–481. [Google Scholar] [CrossRef]
- Argo, C.K.; Northup, P.G.; Al-Osaimi, A.M.; Caldwell, S.H. Systematic review of risk factors for fibrosis progression in non-alcoholic steatohepatitis. J. Hepatol. 2009, 51, 371–379. [Google Scholar] [CrossRef] [PubMed]
- Brunt, E.M.; Kleiner, D.E.; Wilson, L.A.; Sanyal, A.J.; Neuschwander-Tetri, B.A.; Crn, T.N. Improvements in Histologic Features and Diagnosis associated with Improvement in Fibrosis in NASH: Results from the NASH Clinical Research Network Treatment Trials. Hepatology 2018, 70. [Google Scholar] [CrossRef] [PubMed]
- Vilar-Gomez, E.; Bertot, L.C.; Wong, V.W.; Castellanos, M.; La Fuente, R.A.-D.; Metwally, M.; Eslam, M.; Gonzalez-Fabian, L.; Sanz, M.A.-Q.; Conde-Martín, A.F.; et al. Fibrosis Severity as a Determinant of Cause-Specific Mortality in Patients with Advanced Nonalcoholic Fatty Liver Disease: A Multi-National Cohort Study. Gastroenterology 2018, 155, 443–457. [Google Scholar] [CrossRef]
- Cheung, A.; Neuschwander-Tetri, B.A.; Kleiner, D.E.; Schabel, E.; Rinella, M.; Harrison, S.; Ratziu, V.; Sanyal, A.J.; Loomba, R.; Megnien, S.J.; et al. Defining Improvement in Nonalcoholic Steatohepatitis for Treatment Trial Endpoints: Recommendations From the Liver Forum. Hepatology 2019, 70, 1841–1855. [Google Scholar] [CrossRef]
- Eddowes, P.J.; Sasso, M.; Allison, M.; Tsochatzis, E.; Anstee, Q.M.; Sheridan, D.; Guha, I.N.; Cobbold, J.F.; Deeks, J.J.; Paradis, V.; et al. Accuracy of FibroScan Controlled Attenuation Parameter and Liver Stiffness Measurement in Assessing Steatosis and Fibrosis in Patients With Nonalcoholic Fatty Liver Disease. Gastroenterology 2019, 156, 1717–1730. [Google Scholar] [CrossRef]
- Lee, J.I.; Lee, H.W.; Lee, K.S. Value of controlled attenuation parameter in fibrosis prediction in nonalcoholic steatohepatitis. World J. Gastroenterol. 2019, 25, 4959–4969. [Google Scholar] [CrossRef]
- Sun, Y.; Zhou, J.; Wu, X.; Chen, Y.; Piao, H.; Lu, L.; Ding, H.; Nan, Y.; Jiang, W.; Wang, T.; et al. Quantitative assessment of liver fibrosis (qFibrosis) reveals precise outcomes in Ishak “stable” patients on anti-HBV therapy. Sci. Rep. 2018, 8, 1–11. [Google Scholar] [CrossRef]
- Wang, B.; Sun, Y.; Zhou, J.; Wu, X.; Chen, S.; Shi, Y.; Wu, S.; Liu, H.; Ren, Y.; Ou, X.; et al. SHG/TPEF-based image technology improves liver fibrosis assessment of minimally sized needle biopsies. Hepatol. Int. 2019, 13, 501–509. [Google Scholar] [CrossRef]
- Liu, F.; Zhao, J.-M.; Rao, H.-Y.; Yu, W.-M.; Zhang, W.; Theise, N.D.; Wee, A.; Wei, L. Second Harmonic Generation Reveals Subtle Fibrosis Differences in Adult and Pediatric Nonalcoholic Fatty Liver Disease. Am. J. Clin. Pathol. 2017, 148, 502–512. [Google Scholar] [CrossRef]
- Hsiao, C.-Y.; Teng, X.; Su, T.-H.; Lee, P.-H.; Kao, J.-H.; Huang, K.-W. Improved quantitative assessment of HBV-associated liver fibrosis using second-harmonic generation microscopy with feature selection. Clin. Res. Hepatol. Gastroenterol. 2020, 44, 12–20. [Google Scholar] [CrossRef] [PubMed]
- Wang, Y.; Wong, G.L.; He, F.-P.; Sun, J.; Chan, A.W.-H.; Yang, J.; Shu, S.S.-T.; Liang, X.; Tse, Y.K.; Fan, X.-T.; et al. Quantifying and monitoring fibrosis in non-alcoholic fatty liver disease using dual-photon microscopy. Gut 2019, 69, 1116–1126. [Google Scholar] [CrossRef] [PubMed]
- Marchisello, S.; Di Pino, A.; Scicali, R.; Urbano, F.; Piro, S.; Purrello, F.; Rabuazzo, A.M. Pathophysiological, Molecular and Therapeutic Issues of Nonalcoholic Fatty Liver Disease: An Overview. Int. J. Mol. Sci. 2019, 20, 1948. [Google Scholar] [CrossRef] [PubMed]
- Di Mauro, S.; Scamporrino, A.; Petta, S.; Urbano, F.; Filippello, A.; Ragusa, M.; Di Martino, M.T.; Scionti, F.; Grimaudo, S.; Pipitone, R.M.; et al. Serum coding and non-coding RNAs as biomarkers of NAFLD and fibrosis severity. Liver Int. 2019, 39, 1742–1754. [Google Scholar] [CrossRef]
- Chen, L.; James, M.C. Encyclopedia of Gastroenterology. Gastroenterology 2004, 127, 1274–1275. [Google Scholar]
- Cholongitas, E.; Senzolo, M.; Standish, R.; Marelli, L.; Quaglia, A.; Patch, D.; Dhillon, A.P.; Burroughs, A.K. A Systematic Review of the Quality of Liver Biopsy Specimens. Am. J. Clin. Pathol. 2006, 125, 710–721. [Google Scholar] [CrossRef]
- Sun, Y.; Zhou, J.; Wang, L.; Wu, X.; Chen, Y.; Piao, H.; Lu, L.; Jiang, W.; Xu, Y.; Feng, B.; et al. New classification of liver biopsy assessment for fibrosis in chronic hepatitis B patients before and after treatment. Hepatology 2017, 65, 1438–1450. [Google Scholar] [CrossRef]
- Theise, N.D.; Jia, J.; Sun, Y.; Wee, A.; You, H. Progression and regression of fibrosis in viral hepatitis in the treatment era: The Beijing classification. Mod. Pathol. 2018, 31, 1191–1200. [Google Scholar] [CrossRef]
- Kleiner, D.E.; Brunt, E.M.; Wilson, L.A.; Behling, C.; Guy, C.; Contos, M.; Cummings, O.; Yeh, M.; Gill, R.; Chalasani, N.; et al. Association of Histologic Disease Activity With Progression of Nonalcoholic Fatty Liver Disease. JAMA Netw. Open 2019, 2, e1912565. [Google Scholar] [CrossRef]


| Peking University People’s Hospital (PKUH) (n = 52) | Singapore General Hospital (SGH) (n = 108) | |||
|---|---|---|---|---|
| Stage | Number (%) | Stage | Number (%) | |
| F0 | 17 (33%) | F0 | 17 (16%) | |
| F1 | 14 (27%) | F1 | 34 (31%) | |
| F2 | 6 (12%) | F2 | 11 (10%) | |
| F3 | 9 (17%) | F3 | 21 (19%) | |
| F4 | 6 (12%) | F4 | 25 (23%) | |
| Periportal Parameters | Descriptions |
|---|---|
| %Periportal | The percentage of fibers in the periportal region |
| %PeriportalAgg | The percentage of aggregated fibers in the periportal region |
| %PeriportalDis | The percentage of distributed fibers in the periportal region |
| #StrPeriportal | The total number of fibers in the periportal region |
| #ShortStrPeriportal | The number of short fibers in the periportal region |
| #LongStrPeriportal | The number of long fibers in the periportal region |
| #ThinStrPeriportal | The number of thin fibers in the periportal region |
| #ThickStrPeriportal | The number of thick fibers in the periportal region |
| StrAreaPeriportal | The total area of fibers in the periportal region |
| StrLengthPeriportal | The total length of fibers in the periportal region |
| StrWidthPeriportal | The total width of fibers in the periportal region |
| #StrPeriportalAgg | The total number of aggregated fibers in the periportal region |
| #ShortStrPeriportalAgg | The number of short aggregated fibers in the periportal region |
| #LongStrPeriportalAgg | The number of long aggregated fibers in the periportal region |
| #ThinStrPeriportalAgg | The number of thin aggregated fibers in the periportal region |
| #ThickStrPeriportalAgg | The number of thick aggregated fibers in the periportal region |
| StrAreaPeriportalAgg | The total area of aggregated fibers in the periportal region |
| StrLengthPeriportalAgg | The total length of aggregated fibers in the periportal region |
| StrWidthPeriportalAgg | The total width of aggregated fibers in the periportal region |
| #StrPeriportalDis | The total number of distributed fibers in the periportal region |
| #ShortStrPeriportalDis | The number of short distributed fibers in the periportal region |
| #LongStrPeriportalDis | The number of long distributed fibers in the periportal region |
| #ThinStrPeriportalDis | The number of thin distributed fibers in the periportal region |
| #ThickStrPeriportalDis | The number of thick distributed fibers in the periportal region |
| StrAreaPeriportalDis | The total area of distributed fibers in the periportal region |
| StrLengthPeriportalDis | The total length of distributed fibers in the periportal region |
| StrWidthPeriportalDis | The total width of distributed fibers in the periportal region |
| #IntersectionPeriportal | The number of intersections in the periportal region |
| Perisinusoidal Parameters | Descriptions |
|---|---|
| %RPS | The percentage of fibers in the reduced perisinusoidal region |
| %RPSAgg | The percentage of aggregated fibers in the reduced perisinusoidal region |
| %RPSDis | The percentage of distributed fibers in the reduced perisinusoidal region |
| #StrRPS | The total number of fibers in the reduced perisinusoidal region |
| #ShortStrRPS | The number of short fibers in the reduced perisinusoidal region |
| #LongStrRPS | The number of long fibers in the reduced perisinusoidal region |
| #ThinStrRPS | The number of thin fibers in the reduced perisinusoidal region |
| #ThickStrRPS | The number of thick fibers in the reduced perisinusoidal region |
| StrAreaRPS | The total area of fibers in the reduced perisinusoidal region |
| StrLengthRPS | The total length of fibers in the reduced perisinusoidal region |
| StrWidthRPS | The total width of fibers in the reduced perisinusoidal region |
| #StrRPSAgg | The total number of aggregated fibers in the reduced perisinusoidal region |
| #ShortStrRPSAgg | The number of short aggregated fibers in the reduced perisinusoidal region |
| #LongStrRPSAgg | The number of long aggregated fibers in the reduced perisinusoidal region |
| #ThinStrRPSAgg | The number of thin aggregated fibers in the reduced perisinusoidal region |
| #ThickStrRPSAgg | The number of thick aggregated fibers in the reduced perisinusoidal region |
| StrAreaRPSAgg | The total area of aggregated fibers in the reduced perisinusoidal region |
| StrLengthRPSAgg | The total length of aggregated fibers in the reduced perisinusoidal region |
| StrWidthRPSAgg | The total width of aggregated fibers in the reduced perisinusoidal region |
| #StrRPSDis | The total number of distributed fibers in the reduced perisinusoidal region |
| #ShortStrRPSDis | The number of short distributed fibers in the reduced perisinusoidal region |
| #LongStrRPSDis | The number of long distributed fibers in the reduced perisinusoidal region |
| #ThinStrRPSDis | The number of thin distributed fibers in the reduced perisinusoidal region |
| #ThickStrRPSDis | The number of thick distributed fibers in the reduced perisinusoidal region |
| StrAreaRPSDis | The total area of distributed fibers in the reduced perisinusoidal region |
| StrLengthRPSDis | The total length of distributed fibers in the reduced perisinusoidal region |
| StrWidthRPSDis | The total width of distributed fibers in the reduced perisinusoidal region |
| #IntersectionRPS | The number of intersections in the reduced perisinusoidal region |
| PKUH Samples | |||
|---|---|---|---|
| Fibrosis Stages | Number of Cases | Changes after Consensus Scoring | |
| Changes to Fibrosis Stages | Number (%) | ||
| F0 | 17 | 0 | 12 (71%) |
| +1 # | 5 (29%) | ||
| F1 | 14 | 0 | 10 (71%) |
| +1 #* | 4 (29%) | ||
| F2 | 6 | 0 | 6 (100%) |
| F3 | 9 | −3 # | 1 (11%) |
| −2 # | 2 (22%) | ||
| −1 # | 2 (22%) | ||
| 0 | 3 (33%) | ||
| 1 # | 1 (11%) | ||
| F4 | 6 | −1 # | 1 (17%) |
| 0 | 5 (83%) | ||
| SGH Samples | |||
|---|---|---|---|
| Fibrosis Stages | Number of Cases | Changes after Consensus Scoring | |
| Changes to Fibrosis Stages | Number (%) | ||
| F0 | 17 | 0 | 11 (65%) |
| +1 # | 6 (35%) | ||
| F1 | 34 | −1 # | 10 (29%) |
| 0 | 17 (50%) | ||
| +1 #* | 5 (15%) | ||
| +2 #* | 2 (6%) | ||
| F2 | 11 | −2 # | 2 (18%) |
| −1 #* | 4 (36%) | ||
| 0 | 3 (27%) | ||
| +1 # | 2 (18%) | ||
| F3 | 21 | −3 # | 2 (10%) |
| −2 # | 3 (14%) | ||
| −1 # | 3 (14%) | ||
| 0 | 4 (19%) | ||
| +1 # | 9 (43%) | ||
| F4 | 25 | −1 # | 1 (4%) |
| 0 | 24 (96%) | ||
| Statistically Significant Parameters | PKUH p-Value | SGH p-Value |
|---|---|---|
| %PeriportalDis | 0.825 | 0.022 |
| #StrPeriportal | 0.414 | 0.003 |
| #ShortStrPeriportal | 0.710 | 0.003 |
| #LongStrPeriportal | 0.604 | 0.009 |
| #ThinStrPeriportal | 0.710 | 0.024 |
| #ThickStrPeriportal | 0.439 | 0.004 |
| StrLengthPeriportal | 1.000 | 0.019 |
| StrWidthPeriportal | 0.330 | 0.004 |
| #StrPeriportalAgg | 0.825 | 0.005 |
| #ShortStrPeriportalAgg | 0.940 | 0.004 |
| #LongStrPeriportalAgg | 0.484 | 0.008 |
| #ThickStrPeriportalAgg | 0.629 | 0.005 |
| StrWidthPeriportalAgg | 0.199 | 0.006 |
| #StrPeriportalDis | 0.825 | 0.009 |
| #ShortStrPeriportalDis | 0.940 | 0.005 |
| #ThinStrPeriportalDis | 0.940 | 0.013 |
| #ThickStrPeriportalDis | 0.710 | 0.009 |
| StrAreaPeriportalDis | 0.825 | 0.022 |
| StrLengthPeriportalDis | 0.604 | 0.013 |
| StrWidthPeriportalDis | 0.825 | 0.019 |
| #StrPS | 0.454 | 0.049 |
| #ThickStrPS | 0.454 | 0.049 |
| StrLengthPS | 0.635 | 0.049 |
| StrWidthPS | 0.539 | 0.026 |
| #StrPSAgg | 0.839 | 0.042 |
| #LongStrPSAgg | 0.733 | 0.036 |
| #ThickStrPSAgg | 0.733 | 0.042 |
| StrWidthPSAgg | 0.635 | 0.036 |
| Parameters | True F1 vs. True F2 Cases |
|---|---|
| %PeriportalDis | 0.011 |
| #StrPeriportal | 0.003 |
| #ShortStrPeriportal | 0.003 |
| #LongStrPeriportal | 0.005 |
| #ThinStrPeriportal | 0.054 |
| #ThickStrPeriportal | 0.005 |
| StrLengthPeriportal | 0.005 |
| StrWidthPeriportal | 0.011 |
| #StrPeriportalAgg | 0.005 |
| #ShortStrPeriportalAgg | 0.005 |
| #LongStrPeriportalAgg | 0.005 |
| #ThickStrPeriportalAgg | 0.008 |
| StrWidthPeriportalAgg | 0.011 |
| #StrPeriportalDis | 0.003 |
| #ShortStrPeriportalDis | 0.003 |
| #ThinStrPeriportalDis | 0.054 |
| #ThickStrPeriportalDis | 0.004 |
| StrAreaPeriportalDis | 0.011 |
| StrLengthPeriportalDis | 0.011 |
| StrWidthPeriportalDis | 0.008 |
| #StrRPS | 0.022 |
| #ThickStrRPS | 0.022 |
| StrLengthRPS | 0.022 |
| StrWidthRPS | 0.022 |
| #StrRPSAgg | 0.018 |
| #LongStrRPSAgg | 0.018 |
| #ThickStrRPSAgg | 0.022 |
| StrWidthRPSAgg | 0.022 |
© 2020 by the authors. Licensee MDPI, Basel, Switzerland. This article is an open access article distributed under the terms and conditions of the Creative Commons Attribution (CC BY) license (http://creativecommons.org/licenses/by/4.0/).
Share and Cite
Leow, W.-Q.; Bedossa, P.; Liu, F.; Wei, L.; Lim, K.-H.; Wan, W.-K.; Ren, Y.; Chang, J.P.-E.; Tan, C.-K.; Wee, A.; et al. An Improved qFibrosis Algorithm for Precise Screening and Enrollment into Non-Alcoholic Steatohepatitis (NASH) Clinical Trials. Diagnostics 2020, 10, 643. https://doi.org/10.3390/diagnostics10090643
Leow W-Q, Bedossa P, Liu F, Wei L, Lim K-H, Wan W-K, Ren Y, Chang JP-E, Tan C-K, Wee A, et al. An Improved qFibrosis Algorithm for Precise Screening and Enrollment into Non-Alcoholic Steatohepatitis (NASH) Clinical Trials. Diagnostics. 2020; 10(9):643. https://doi.org/10.3390/diagnostics10090643
Chicago/Turabian StyleLeow, Wei-Qiang, Pierre Bedossa, Feng Liu, Lai Wei, Kiat-Hon Lim, Wei-Keat Wan, Yayun Ren, Jason Pik-Eu Chang, Chee-Kiat Tan, Aileen Wee, and et al. 2020. "An Improved qFibrosis Algorithm for Precise Screening and Enrollment into Non-Alcoholic Steatohepatitis (NASH) Clinical Trials" Diagnostics 10, no. 9: 643. https://doi.org/10.3390/diagnostics10090643
APA StyleLeow, W.-Q., Bedossa, P., Liu, F., Wei, L., Lim, K.-H., Wan, W.-K., Ren, Y., Chang, J. P.-E., Tan, C.-K., Wee, A., & Goh, G. B.-B. (2020). An Improved qFibrosis Algorithm for Precise Screening and Enrollment into Non-Alcoholic Steatohepatitis (NASH) Clinical Trials. Diagnostics, 10(9), 643. https://doi.org/10.3390/diagnostics10090643