L1CAM, CA9, KLK6, HPN, and ALDH1A1 as Potential Serum Markers in Primary and Metastatic Colorectal Cancer Screening

 ,
,  and
and
Abstract
1. Introduction
2. Materials and Methods
2.1. Patients and Serum Samples
2.2. Luminex Analyser MAGPIX® Multianalyte Profiling of Markers
2.3. Statistical Analysis
3. Results
3.1. Clinicopathological Features of Colorectal Cancer Patients
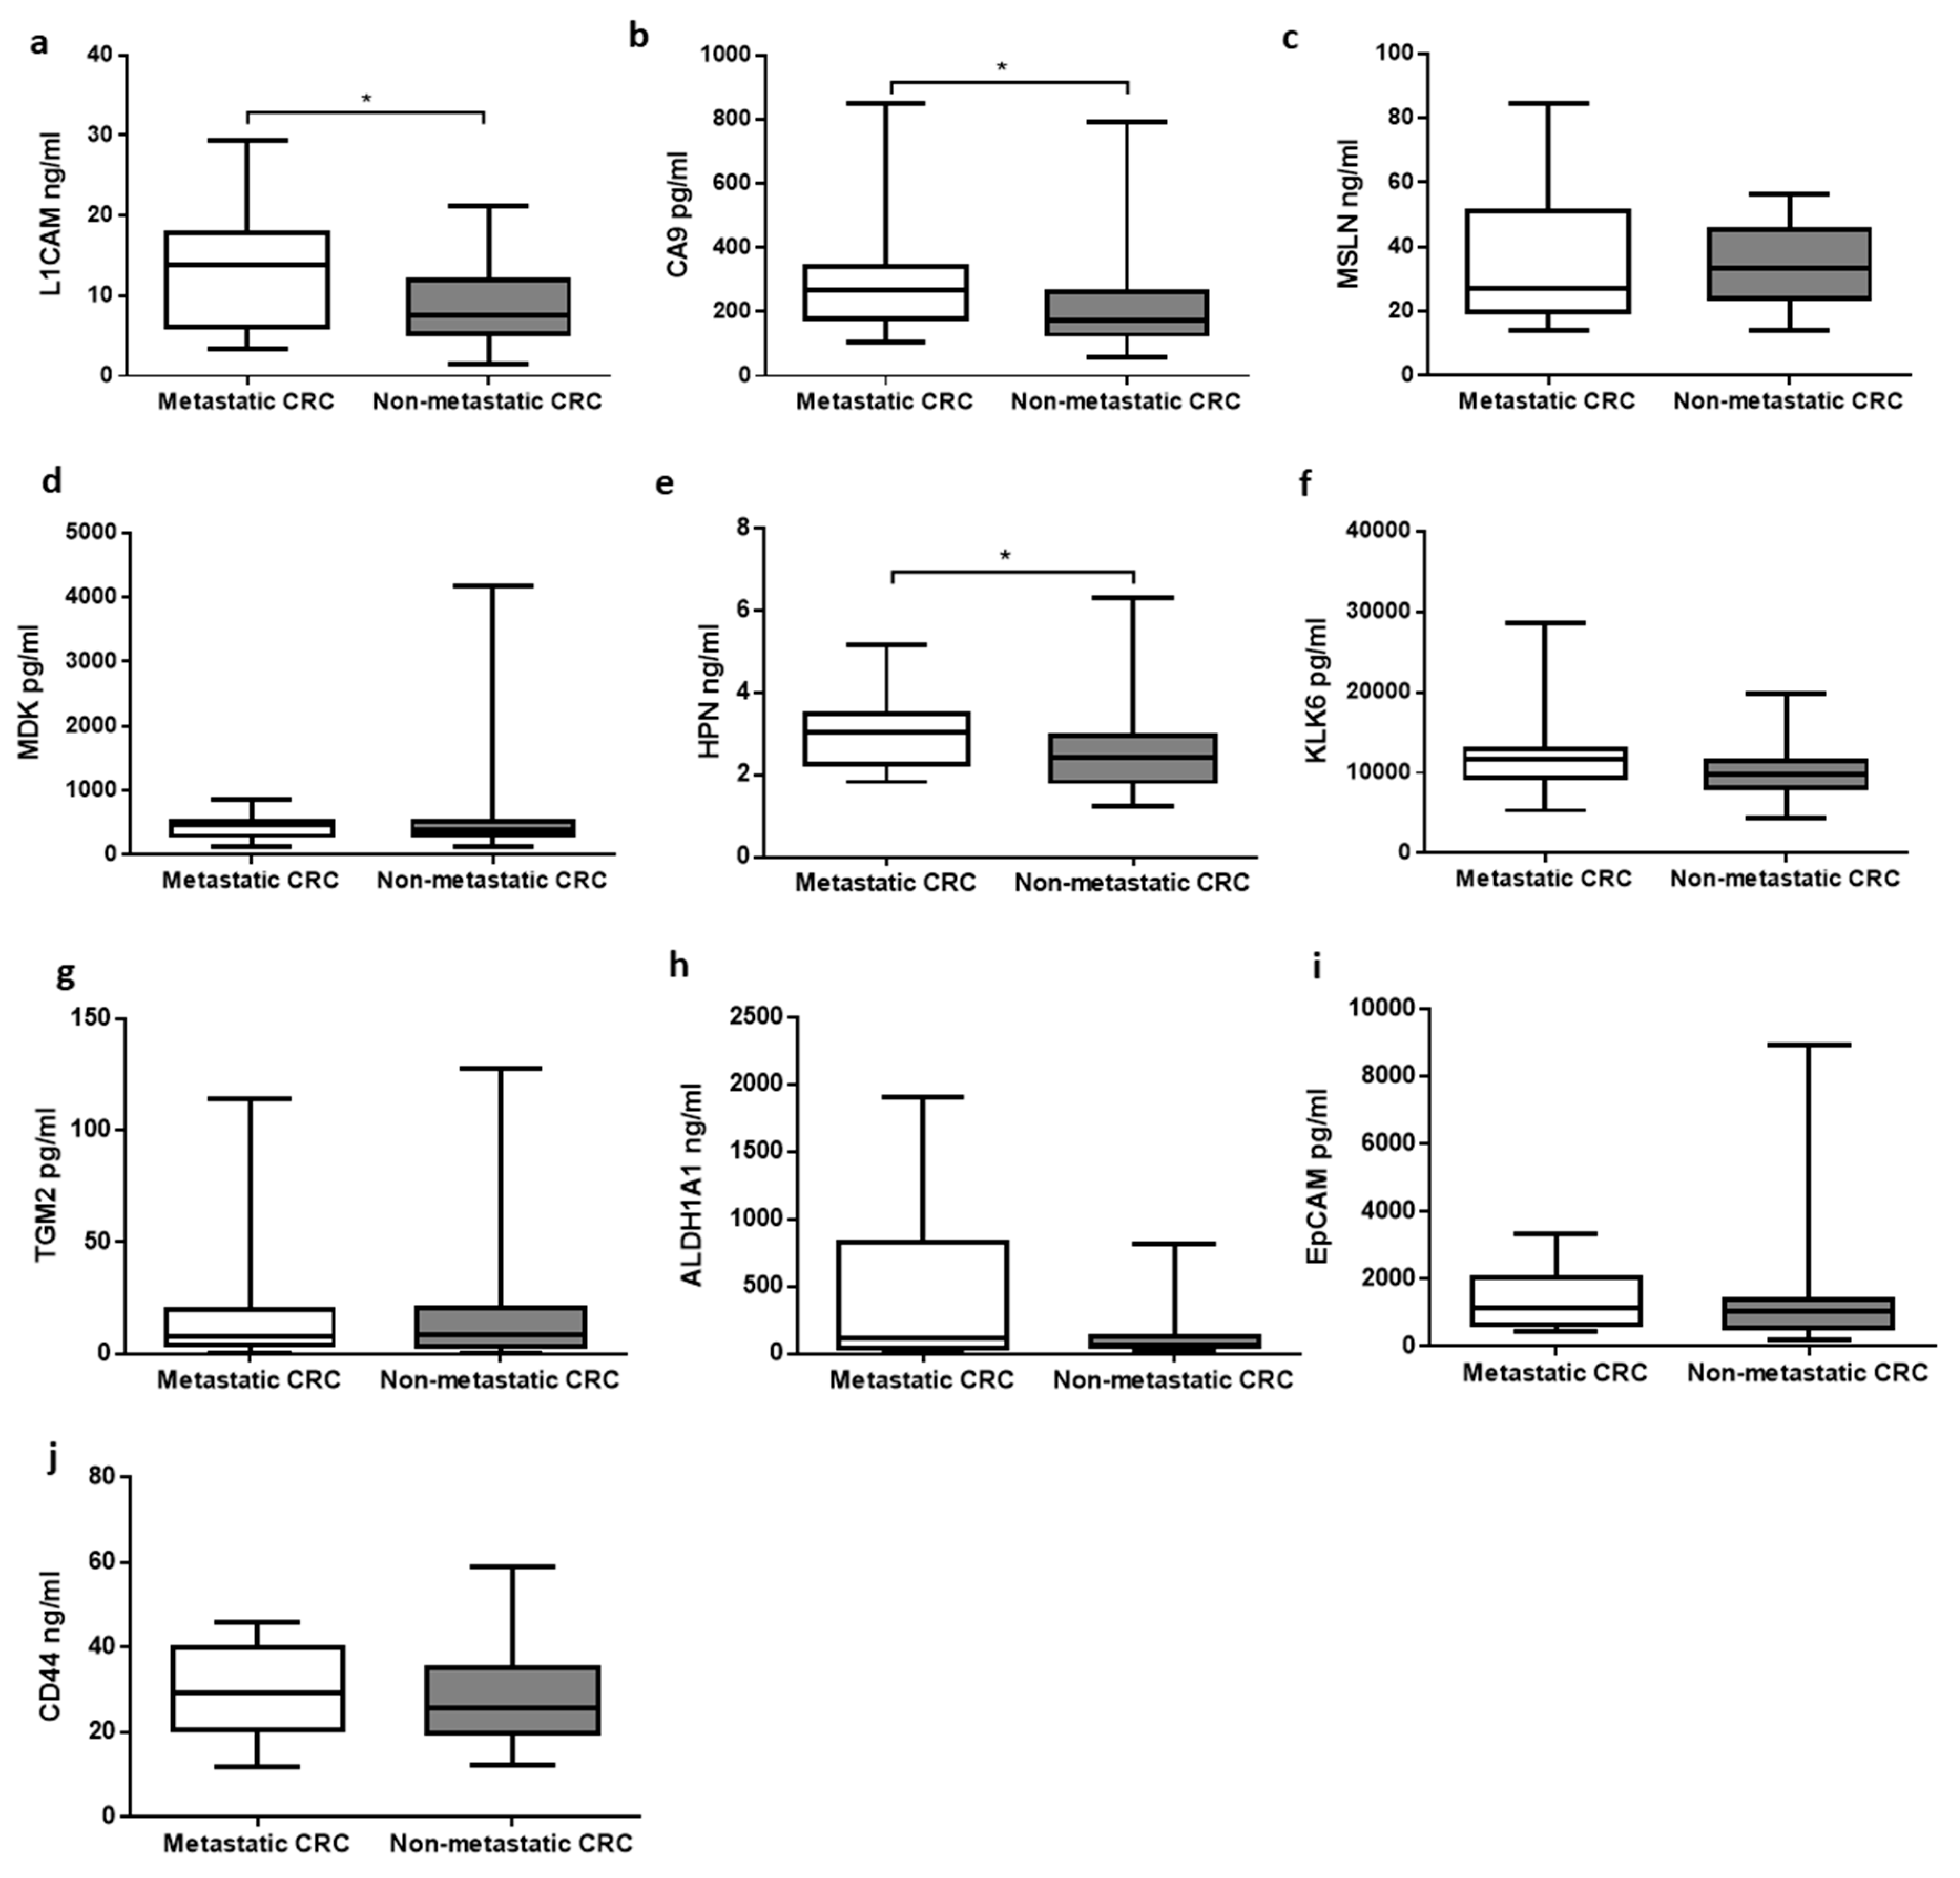
3.2. Association between Primary and Metastatic Tumors
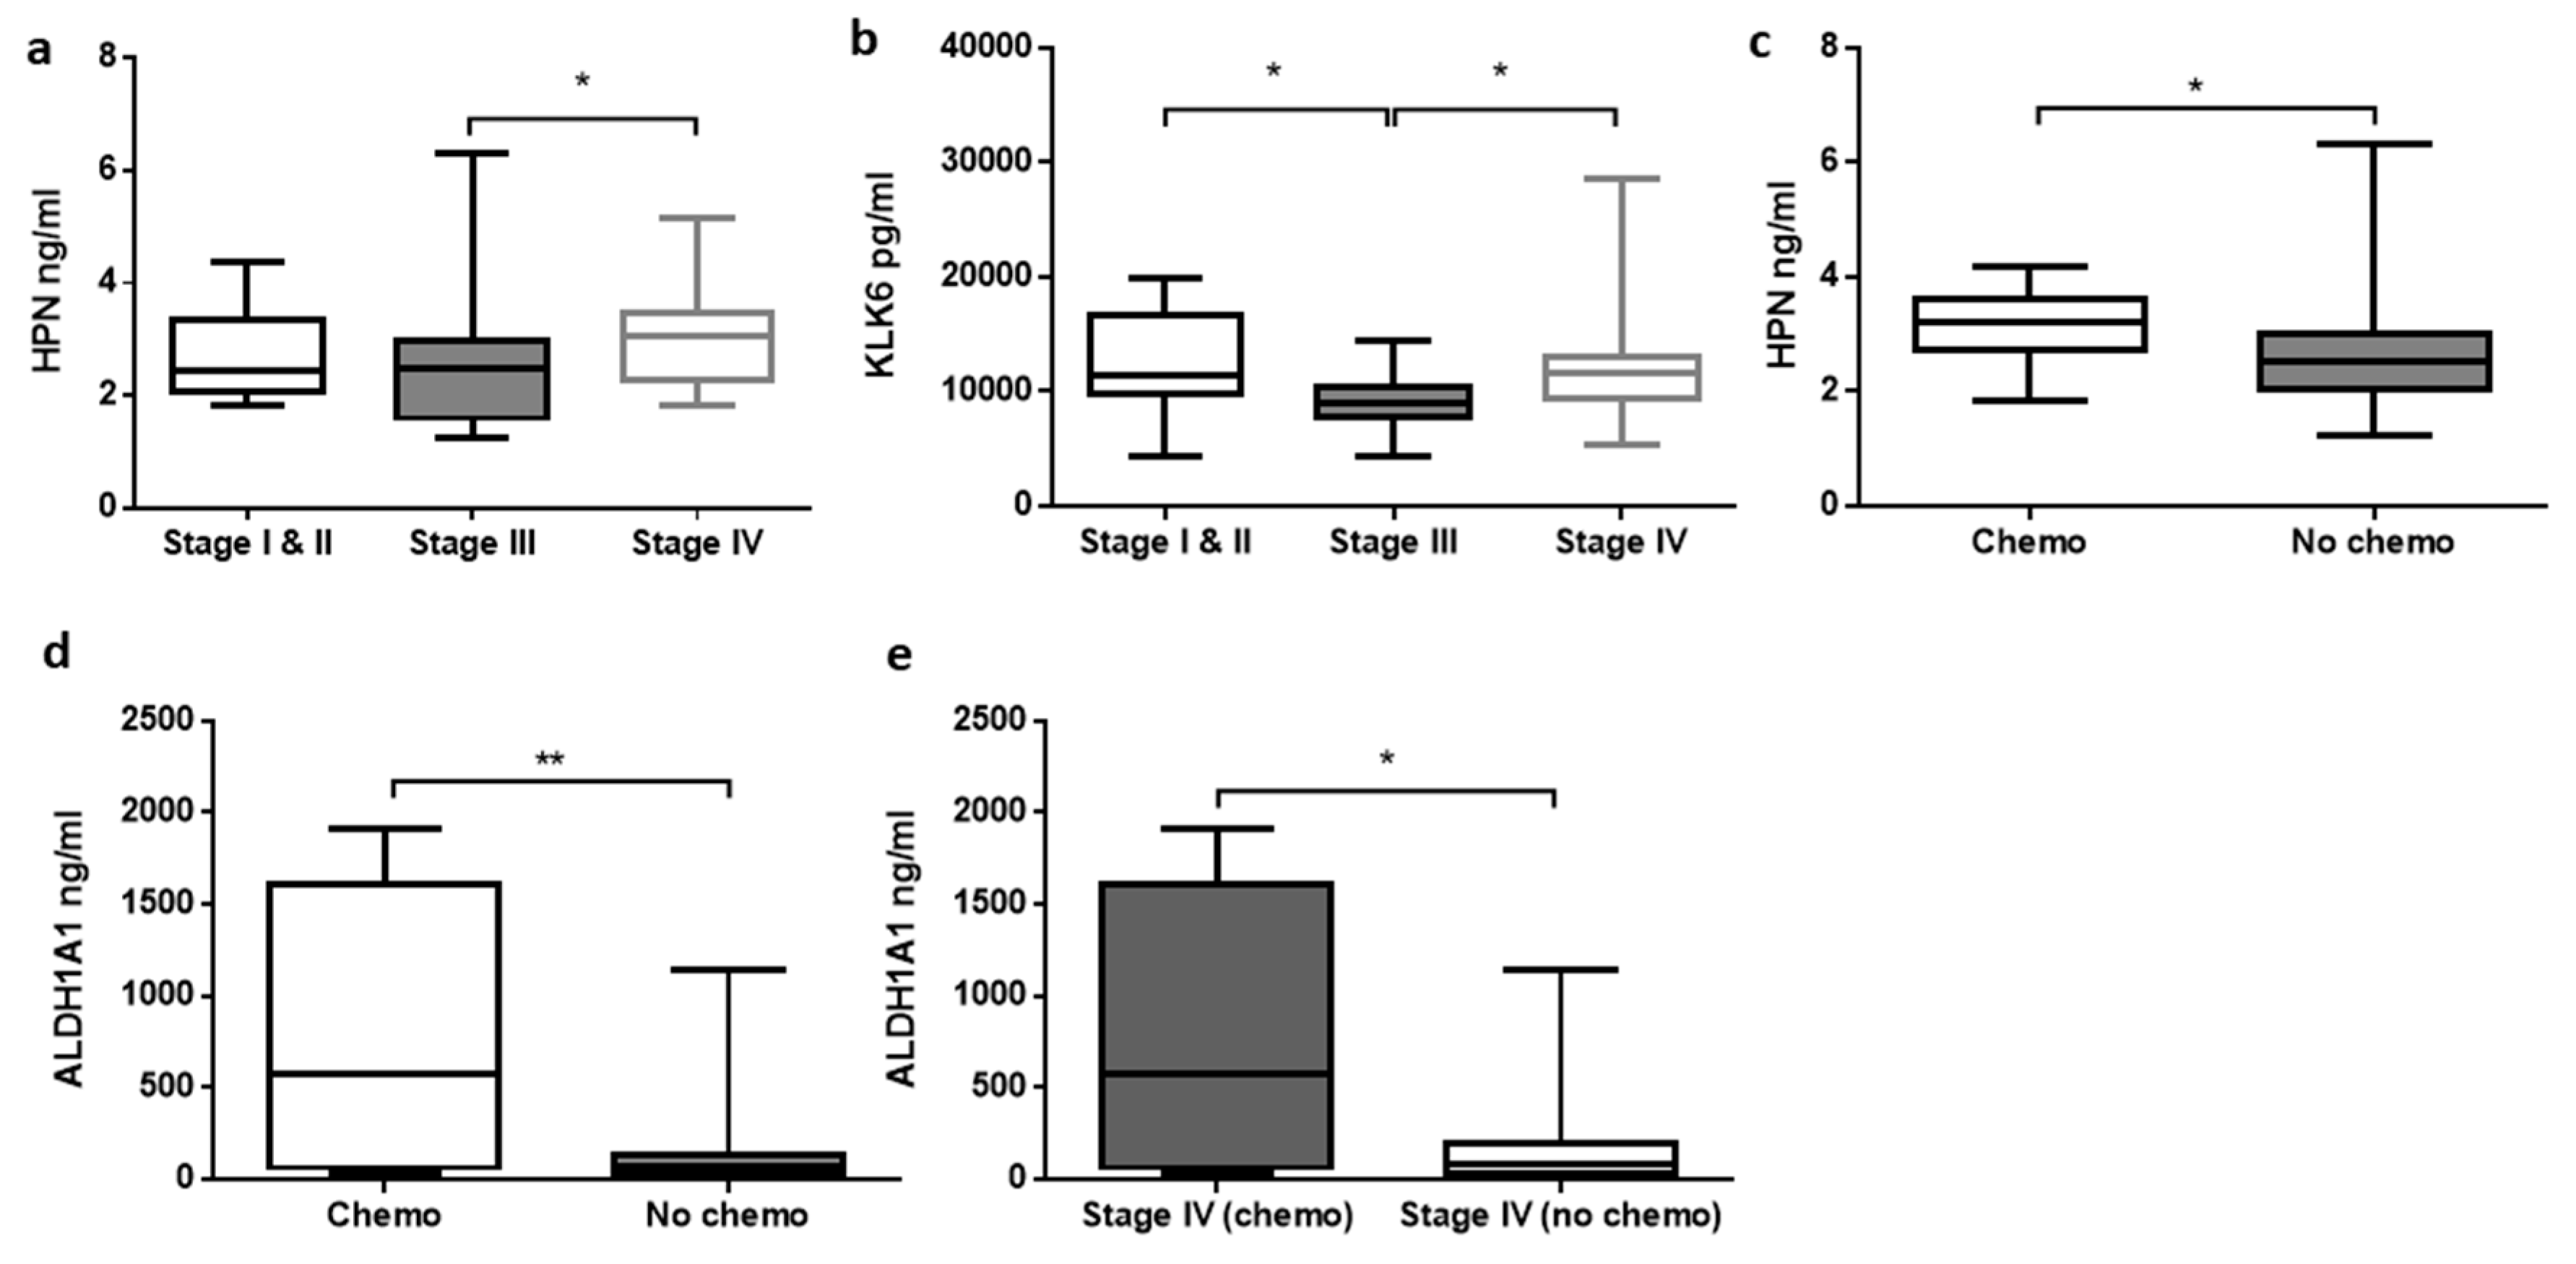
3.3. Relationship between Analytes Concentrations and Clinicopathological Features of CRC
3.4. Receiver Operating Characteristic Curve and Logistic Regression Analysis
3.5. Multivariable Logistic Regression Models
4. Discussion
5. Conclusions
Author Contributions
Funding
Acknowledgments
Conflicts of Interest
Abbreviations
References
- Granados-Romero, J.J.; Valderrama-Treviño, A.I.; Contreras-Flores, E.H.; Barrera-Mera, B.; Herrera Enríquez, M.; Uriarte-Ruíz, K.; Ceballos-Villalba, J.C.; Estrada-Mata, A.G.; Alvarado Rodríguez, C.; Arauz-Peña, G. Colorectal cancer: A review. Int. J. Res. Med. Sci. 2017, 5, 4667. [Google Scholar] [CrossRef]
- Bray, F.; Ferlay, J.; Soerjomataram, I.; Siegel, R.L.; Torre, L.A.; Jemal, A. Global cancer statistics 2018: GLOBOCAN estimates of incidence and mortality worldwide for 36 cancers in 185 countries. CA Cancer J. Clin. 2018, 68, 394–424. [Google Scholar] [CrossRef] [PubMed]
- Arvelo, F. Biology of colorectal cancer. Ecancermedicalscience 2015, 9. [Google Scholar] [CrossRef] [PubMed]
- Engstrand, J.; Nilsson, H.; Strömberg, C.; Jonas, E.; Freedman, J. Colorectal cancer liver metastases—A population-based study on incidence, management and survival. BMC Cancer 2018, 18. [Google Scholar] [CrossRef]
- Siegel, R.L.; Miller, K.D.; Jemal, A. Cancer statistics, 2019: Cancer Statistics, 2019. CA A Cancer J. Clin. 2019, 69, 7–34. [Google Scholar] [CrossRef]
- Shaukat, A.; Mongin, S.J.; Geisser, M.S.; Lederle, F.A.; Bond, J.H.; Mandel, J.S.; Church, T.R. Long-term mortality after screening for colorectal cancer. N. Engl. J. Med. 2013, 369, 1106–1114. [Google Scholar] [CrossRef]
- Carroll, M.R.R.; Seaman, H.E.; Halloran, S.P. Tests and investigations for colorectal cancer screening. Clin. Biochem. 2014, 47, 921–939. [Google Scholar] [CrossRef]
- Pox, C.P.; Altenhofen, L.; Brenner, H.; Theilmeier, A.; Stillfried, D.V.; Schmiegel, W. Efficacy of a Nationwide Screening Colonoscopy Program for Colorectal Cancer. Gastroenterology 2012, 142, 1460–1467.e2. [Google Scholar] [CrossRef]
- Brenner, H.; Hoffmeister, M.; Arndt, V.; Stegmaier, C.; Altenhofen, L.; Haug, U. Protection from Right- and Left-Sided Colorectal Neoplasms after Colonoscopy: Population-Based Study. J. Natl. Cancer Inst. 2010, 102, 89–95. [Google Scholar] [CrossRef] [PubMed]
- Morikawa, T.; Kato, J.; Yamaji, Y.; Wada, R.; Mitsushima, T.; Shiratori, Y. A Comparison of the Immunochemical Fecal Occult Blood Test and Total Colonoscopy in the Asymptomatic Population. Gastroenterology 2005, 129, 422–428. [Google Scholar] [CrossRef]
- Berger, B.M.; Ahlquist, D.A. Stool DNA screening for colorectal neoplasia: Biological and technical basis for high detection rates. Pathology 2012, 44, 80–88. [Google Scholar] [CrossRef] [PubMed]
- Haug, U.; Hundt, S.; Brenner, H. Quantitative Immunochemical Fecal Occult Blood Testing for Colorectal Adenoma Detection: Evaluation in the Target Population of Screening and Comparison with Qualitative Tests. Am. J. Gastroenterol. 2010, 105, 682–690. [Google Scholar] [CrossRef] [PubMed]
- Shah, R.; Jones, E.; Vidart, V.; Kuppen, P.J.K.; Conti, J.A.; Francis, N.K. Biomarkers for Early Detection of Colorectal Cancer and Polyps: Systematic Review. Cancer Epidemiol. Biomark. Prev. 2014, 23, 1712–1728. [Google Scholar] [CrossRef] [PubMed]
- Vacante, M.; Borzì, A.M.; Basile, F.; Biondi, A. Biomarkers in colorectal cancer: Current clinical utility and future perspectives. World J. Clin. Cases 2018, 6, 869–881. [Google Scholar] [CrossRef] [PubMed]
- Bünger, S.; Haug, U.; Kelly, M.; Posorski, N.; Klempt-Giessing, K.; Cartwright, A.; Fitzgerald, S.P.; Toner, V.; McAleer, D.; Gemoll, T.; et al. A novel multiplex-protein array for serum diagnostics of colon cancer: A case–control study. BMC Cancer 2012, 12, 393. [Google Scholar] [CrossRef] [PubMed]
- Bhardwaj, M.; Weigl, K.; Tikk, K.; Holland-Letz, T.; Schrotz-King, P.; Borchers, C.H.; Brenner, H. Multiplex quantitation of 270 plasma protein markers to identify a signature for early detection of colorectal cancer. Eur. J. Cancer 2020, 127, 30–40. [Google Scholar] [CrossRef]
- Ragulan, C.; Eason, K.; Fontana, E.; Nyamundanda, G.; Tarazona, N.; Patil, Y.; Poudel, P.; Lawlor, R.T.; Del Rio, M.; Koo, S.-L.; et al. Analytical Validation of Multiplex Biomarker Assay to Stratify Colorectal Cancer into Molecular Subtypes. Sci. Rep. 2019, 9, 7665. [Google Scholar] [CrossRef]
- Dressen, K.; Hermann, N.; Manekeller, S.; Walgenbach-Bruenagel, G.; Schildberg, F.A.; Hettwer, K.; Uhlig, S.; Kalff, J.C.; Hartmann, G.; Holdenrieder, S. Diagnostic Performance of a Novel Multiplex Immunoassay in Colorectal Cancer. Anticancer Res. 2017, 37, 2477–2486. [Google Scholar] [CrossRef]
- Kaifi, J.T.; Reichelt, U.; Quaas, A.; Schurr, P.G.; Wachowiak, R.; Yekebas, E.F.; Strate, T.; Schneider, C.; Pantel, K.; Schachner, M.; et al. L1 is associated with micrometastatic spread and poor outcome in colorectal cancer. Mod. Pathol. 2007, 20, 1183–1190. [Google Scholar] [CrossRef]
- Wachowiak, R.; Krause, M.; Mayer, S.; Peukert, N.; Suttkus, A.; Müller, W.C.; Lacher, M.; Meixensberger, J.; Nestler, U. Increased L1CAM (CD171) levels are associated with glioblastoma and metastatic brain tumors. Medicine 2018, 97, e12396. [Google Scholar] [CrossRef]
- Altevogt, P.; Doberstein, K.; Fogel, M. L1CAM in human cancer. Int. J. Cancer 2016, 138, 1565–1576. [Google Scholar] [CrossRef] [PubMed]
- Ganesh, K.; Basnet, H.; Kaygusuz, Y.; Laughney, A.M.; He, L.; Sharma, R.; O’Rourke, K.P.; Reuter, V.P.; Huang, Y.-H.; Turkekul, M.; et al. L1CAM defines the regenerative origin of metastasis-initiating cells in colorectal cancer. Nat. Cancer 2020, 1, 28–45. [Google Scholar] [CrossRef]
- Gavert, N.; Sheffer, M.; Raveh, S.; Spaderna, S.; Shtutman, M.; Brabletz, T.; Barany, F.; Paty, P.; Notterman, D.; Domany, E.; et al. Expression of L1-CAM and ADAM10 in human colon cancer cells induces metastasis. Cancer Res. 2007, 67, 7703–7712. [Google Scholar] [CrossRef]
- Pretzsch, E.; Bösch, F.; Neumann, J.; Ganschow, P.; Bazhin, A.; Guba, M.; Werner, J.; Angele, M. Mechanisms of Metastasis in Colorectal Cancer and Metastatic Organotropism: Hematogenous Versus Peritoneal Spread. Available online: https://www.hindawi.com/journals/jo/2019/7407190/ (accessed on 12 November 2019). [CrossRef]
- Kajiwara, Y.; Ueno, H.; Hashiguchi, Y.; Shinto, E.; Shimazaki, H.; Mochizuki, H.; Hase, K. Expression of l1 cell adhesion molecule and morphologic features at the invasive front of colorectal cancer. Am. J. Clin. Pathol. 2011, 136, 138–144. [Google Scholar] [CrossRef] [PubMed]
- Korkeila, E.; Talvinen, K.; Jaakkola, P.M.; Minn, H.; Syrjänen, K.; Sundström, J.; Pyrhönen, S. Expression of carbonic anhydrase IX suggests poor outcome in rectal cancer. Br. J. Cancer 2009, 100, 874–880. [Google Scholar] [CrossRef] [PubMed]
- Huang, M.-Y.; Wang, J.-Y.; Lin, S.-R. CA9 and CHRNB1 were correlated with perineural invasion in Taiwanese colorectal cancer patients. Biomark. Genom. Med. 2013, 5, 84–86. [Google Scholar] [CrossRef]
- He, X.; Wang, L.; Riedel, H.; Wang, K.; Yang, Y.; Dinu, C.Z.; Rojanasakul, Y. Mesothelin promotes epithelial-to-mesenchymal transition and tumorigenicity of human lung cancer and mesothelioma cells. Mol. Cancer 2017, 16, 63. [Google Scholar] [CrossRef]
- Morello, A.; Sadelain, M.; Adusumilli, P.S. Mesothelin-Targeted CARs: Driving T Cells to Solid Tumors. Cancer Discov. 2016, 6, 133–146. [Google Scholar] [CrossRef]
- Shiraishi, T.; Shinto, E.; Mochizuki, S.; Tsuda, H.; Kajiwara, Y.; Okamoto, K.; Einama, T.; Hase, K.; Ueno, H. Mesothelin expression has prognostic value in stage ΙΙ/ΙΙΙ colorectal cancer. Virchows Arch. 2019, 474, 297–307. [Google Scholar] [CrossRef]
- Olmeda, D.; Cerezo-Wallis, D.; Riveiro-Falkenbach, E.; Pennacchi, P.C.; Contreras-Alcalde, M.; Ibarz, N.; Cifdaloz, M.; Catena, X.; Calvo, T.G.; Cañón, E.; et al. Whole-body imaging of lymphovascular niches identifies pre-metastatic roles of midkine. Nature 2017, 546, 676–680. [Google Scholar] [CrossRef]
- Jono, H.; Ando, Y. Midkine: A novel prognostic biomarker for cancer. Cancers (Basel) 2010, 2, 624–641. [Google Scholar] [CrossRef] [PubMed]
- Ikematsu, S.; Okamoto, K.; Yoshida, Y.; Oda, M.; Sugano-Nagano, H.; Ashida, K.; Kumai, H.; Kadomatsu, K.; Muramatsu, H.; Muramatsu, T.; et al. High levels of urinary midkine in various cancer patients. Biochem. Biophys. Res. Commun. 2003, 306, 329–332. [Google Scholar] [CrossRef]
- Krzystek-Korpacka, M.; Diakowska, D.; Neubauer, K.; Gamian, A. Circulating midkine in malignant and non-malignant colorectal diseases. Cytokine 2013, 64, 158–164. [Google Scholar] [CrossRef] [PubMed]
- Cerami, E.; Gao, J.; Dogrusoz, U.; Gross, B.E.; Sumer, S.O.; Aksoy, B.A.; Jacobsen, A.; Byrne, C.J.; Heuer, M.L.; Larsson, E.; et al. The cBio Cancer Genomics Portal: An Open Platform for Exploring Multidimensional Cancer Genomics Data. Cancer Discov. 2012, 2, 401–404. [Google Scholar] [CrossRef] [PubMed]
- Gao, J.; Aksoy, B.A.; Dogrusoz, U.; Dresdner, G.; Gross, B.; Sumer, S.O.; Sun, Y.; Jacobsen, A.; Sinha, R.; Larsson, E.; et al. Integrative analysis of complex cancer genomics and clinical profiles using the cBioPortal. Sci. Signal. 2013, 6, pl1. [Google Scholar] [CrossRef] [PubMed]
- Yousef, G.M.; Borgoño, C.A.; Popalis, C.; Yacoub, G.M.; Polymeris, M.-E.; Soosaipillai, A.; Diamandis, E.P. In-silico analysis of kallikrein gene expression in pancreatic and colon cancers. Anticancer Res. 2004, 24, 43–51. [Google Scholar]
- Yousef, G.M.; Borgoño, C.A.; White, N.M.A.; Robb, J.-D.; Michael, I.P.; Oikonomopoulou, K.; Khan, S.; Diamandis, E.P. In silico Analysis of the Human Kallikrein Gene 6. TBI 2004, 25, 282–289. [Google Scholar] [CrossRef]
- Kim, J.-T.; Song, E.Y.; Chung, K.-S.; Kang, M.A.; Kim, J.W.; Kim, S.J.; Yeom, Y.I.; Kim, J.H.; Kim, K.H.; Lee, H.G. Up-regulation and clinical significance of serine protease kallikrein 6 in colon cancer. Cancer 2011, 117, 2608–2619. [Google Scholar] [CrossRef]
- Petraki, C.; Dubinski, W.; Scorilas, A.; Saleh, C.; Pasic, M.D.; Komborozos, V.; Khalil, B.; Gabril, M.Y.; Streutker, C.; Diamandis, E.P.; et al. Evaluation and prognostic significance of human tissue kallikrein-related peptidase 6 (KLK6) in colorectal cancer. Pathol. Res. Pract. 2012, 208, 104–108. [Google Scholar] [CrossRef]
- Kontos, C.K.; Scorilas, A. Kallikrein-related peptidases (KLKs): A gene family of novel cancer biomarkers. Clin. Chem. Lab. Med. 2012, 50, 1877–1891. [Google Scholar] [CrossRef]
- Talieri, M.; Li, L.; Zheng, Y.; Alexopoulou, D.K.; Soosaipillai, A.; Scorilas, A.; Xynopoulos, D.; Diamandis, E.P. The use of kallikrein-related peptidases as adjuvant prognostic markers in colorectal cancer. Br. J. Cancer 2009, 100, 1659–1665. [Google Scholar] [CrossRef] [PubMed][Green Version]
- Michaelidou, K.; Kladi-Skandali, A.; Scorilas, A. Kallikreins as Biomarkers in Human Malignancies. In Biomarkers in Cancer; Preedy, V.R., Patel, V.B., Eds.; Biomarkers in Disease: Methods, Discoveries and Applications; Springer: Dordrecht, The Netherlands, 2015; pp. 135–165. [Google Scholar] [CrossRef]
- Kontos, C.K.; Mavridis, K.; Talieri, M.; Scorilas, A. Kallikrein-related peptidases (KLKs) in gastrointestinal cancer: Mechanistic and clinical aspects. Thromb. Haemost. 2013, 110, 450–457. [Google Scholar] [CrossRef] [PubMed]
- Chen, H.; Sells, E.; Cui, H.; Pandey, R.; Pampalakis, G.; Sotiropoulou, G.; Doetschman, T.; Ignatenko, N.A. Abstract 854: Human tissue Kallikrein 6 enzyme activity regulates epithelial-mesenchymal transition in colon cancer. Cancer Res. 2017, 77, 854. [Google Scholar] [CrossRef]
- Ogawa, K.; Utsunomiya, T.; Mimori, K.; Tanaka, F.; Inoue, H.; Nagahara, H.; Murayama, S.; Mori, M. Clinical significance of human kallikrein gene 6 messenger RNA expression in colorectal cancer. Clin. Cancer Res. 2005, 11, 2889–2893. [Google Scholar] [CrossRef]
- Christodoulou, S.; Alexopoulou, D.K.; Kontos, C.K.; Scorilas, A.; Papadopoulos, I.N. Kallikrein-related peptidase-6 (KLK6) mRNA expression is an independent prognostic tissue biomarker of poor disease-free and overall survival in colorectal adenocarcinoma. Tumour Biol. 2014, 35, 4673–4685. [Google Scholar] [CrossRef]
- Gu, C.; Cai, J.; Xu, Z.; Zhou, S.; Ye, L.; Yan, Q.; Zhang, Y.; Fang, Y.; Liu, Y.; Tu, C.; et al. MiR-532-3p suppresses colorectal cancer progression by disrupting the ETS1/TGM2 axis-mediated Wnt/β-catenin signaling. Cell Death Dis. 2019, 10, 1–14. [Google Scholar] [CrossRef]
- Yang, P.; Yu, D.; Zhou, J.; Zhuang, S.; Jiang, T. TGM2 interference regulates the angiogenesis and apoptosis of colorectal cancer via Wnt/β-catenin pathway. Cell Cycle 2019, 18, 1122–1134. [Google Scholar] [CrossRef]
- Miyoshi, N.; Ishii, H.; Mimori, K.; Tanaka, F.; Hitora, T.; Tei, M.; Sekimoto, M.; Doki, Y.; Mori, M. TGM2 Is a Novel Marker for Prognosis and Therapeutic Target in Colorectal Cancer. Ann. Surg. Oncol. 2010, 17, 967–972. [Google Scholar] [CrossRef]
- Kang, S.; Oh, S.C.; Min, B.W.; Lee, D.-H. Transglutaminase 2 Regulates Self-renewal and Stem Cell Marker of Human Colorectal Cancer Stem Cells. Anticancer Res. 2018, 38, 787–794. [Google Scholar]
- Kahlert, C.; Gaitzsch, E.; Steinert, G.; Mogler, C.; Herpel, E.; Hoffmeister, M.; Jansen, L.; Benner, A.; Brenner, H.; Chang-Claude, J.; et al. Expression analysis of aldehyde dehydrogenase 1A1 (ALDH1A1) in colon and rectal cancer in association with prognosis and response to chemotherapy. Ann. Surg. Oncol. 2012, 19, 4193–4201. [Google Scholar] [CrossRef]
- Yang, W.; Wang, Y.; Wang, W.; Chen, Z.; Bai, G. Expression of Aldehyde Dehydrogenase 1A1 (ALDH1A1) as a Prognostic Biomarker in Colorectal Cancer Using Immunohistochemistry. Med. Sci. Monit. 2018, 24, 2864–2872. [Google Scholar] [CrossRef]
- Xu, S.-L.; Zeng, D.-Z.; Dong, W.-G.; Ding, Y.-Q.; Rao, J.; Duan, J.-J.; Liu, Q.; Yang, J.; Zhan, N.; Liu, Y.; et al. Distinct patterns of ALDH1A1 expression predict metastasis and poor outcome of colorectal carcinoma. Int. J. Clin. Exp. Pathol. 2014, 7, 2976. [Google Scholar]
- Van der Waals, L.M.; Rinkes, I.H.M.B.; Kranenburg, O. ALDH1A1 expression is associated with poor differentiation, ‘right-sidedness’ and poor survival in human colorectal cancer. PLoS ONE 2018, 13, e0205536. [Google Scholar] [CrossRef]
- Went, P.; Vasei, M.; Bubendorf, L.; Terracciano, L.; Tornillo, L.; Riede, U.; Kononen, J.; Simon, R.; Sauter, G.; Baeuerle, P.A. Frequent high-level expression of the immunotherapeutic target Ep-CAM in colon, stomach, prostate and lung cancers. Br. J. Cancer 2006, 94, 128–135. [Google Scholar] [CrossRef]
- Chaudry, M.A.; Sales, K.; Ruf, P.; Lindhofer, H.; Winslet, M.C. EpCAM an immunotherapeutic target for gastrointestinal malignancy: Current experience and future challenges. Br. J. Cancer 2007, 96, 1013–1019. [Google Scholar] [CrossRef]
- Spizzo, G.; Fong, D.; Wurm, M.; Ensinger, C.; Obrist, P.; Hofer, C.; Mazzoleni, G.; Gastl, G.; Went, P. EpCAM expression in primary tumour tissues and metastases: An immunohistochemical analysis. J. Clin. Pathol. 2011, 64, 415–420. [Google Scholar] [CrossRef]
- Went, P.T.; Lugli, A.; Meier, S.; Bundi, M.; Mirlacher, M.; Sauter, G.; Dirnhofer, S. Frequent EpCam protein expression in human carcinomas. Hum. Pathol. 2004, 35, 122–128. [Google Scholar] [CrossRef]
- Han, S.; Zong, S.; Shi, Q.; Li, H.; Liu, S.; Yang, W.; Li, W.; Hou, F. Is Ep-CAM Expression a Diagnostic and Prognostic Biomarker for Colorectal Cancer? A Systematic Meta-Analysis. EBioMedicine 2017, 20, 61–69. [Google Scholar] [CrossRef]
- Lugli, A.; Iezzi, G.; Hostettler, I.; Muraro, M.G.; Mele, V.; Tornillo, L.; Carafa, V.; Spagnoli, G.; Terracciano, L.; Zlobec, I. Prognostic impact of the expression of putative cancer stem cell markers CD133, CD166, CD44s, EpCAM, and ALDH1 in colorectal cancer. Br. J. Cancer 2010, 103, 382–390. [Google Scholar] [CrossRef]
- Gosens, M.J.E.M.; van Kempen, L.C.L.; van de Velde, C.J.H.; van Krieken, J.H.J.M.; Nagtegaal, I.D. Loss of membranous Ep-CAM in budding colorectal carcinoma cells. Mod. Pathol. 2007, 20, 221–232. [Google Scholar] [CrossRef]
- Kim, J.H.; Bae, J.M.; Song, Y.S.; Cho, N.-Y.; Lee, H.S.; Kang, G.H. Clinicopathologic, molecular, and prognostic implications of the loss of EPCAM expression in colorectal carcinoma. Oncotarget 2016, 7, 13372–13387. [Google Scholar] [CrossRef] [PubMed]
- Seeber, A.; Untergasser, G.; Spizzo, G.; Terracciano, L.; Lugli, A.; Kasal, A.; Kocher, F.; Steiner, N.; Mazzoleni, G.; Gastl, G.; et al. Predominant expression of truncated EpCAM is associated with a more aggressive phenotype and predicts poor overall survival in colorectal cancer. Int. J. Cancer 2016, 139, 657–663. [Google Scholar] [CrossRef] [PubMed]
- Mokhtari, M.; Zakerzade, Z. EPCAM Expression in Colon Adenocarcinoma and its Relationship with TNM Staging. Adv. Biomed. Res. 2017, 6. [Google Scholar] [CrossRef]
- Cohen, S.J.; Punt, C.J.; lannotti, N.; Saidman, B.H.; Sabbath, K.D.; Gabrail, N.Y.; Picus, J.; Morse, M.; Mitchell, E.; Miller, M.C.; et al. Relationship of Circulating Tumor Cells to Tumor Response, Progression-Free Survival, and Overall Survival in Patients With Metastatic Colorectal Cancer. J. Clin. Oncol. 2008, 26, 3213–3221. [Google Scholar] [CrossRef]
- Du, L.; Wang, H.; He, L.; Zhang, J.; Ni, B.; Wang, X.; Jin, H.; Cahuzac, N.; Mehrpour, M.; Lu, Y.; et al. CD44 is of functional importance for colorectal cancer stem cells. Clin. Cancer Res. 2008, 14, 6751–6760. [Google Scholar] [CrossRef] [PubMed]
- Yu, Q.; Stamenkovic, I. Localization of matrix metalloproteinase 9 to the cell surface provides a mechanism for CD44-mediated tumor invasion. Genes Dev. 1999, 13, 35–48. [Google Scholar] [CrossRef]
- Holah, N.; Aiad, H.; Asaad, N.; Elkhouly, E.; Lasheen, A. Evaluation of the role of CD44 as a cancer stem cell marker in colorectal carcinoma: Immunohistochemical study. Menoufia Med. J. 2016, 30, 174–183. [Google Scholar] [CrossRef]
- Zhao, L.; Lin, Q.; Wei, J.; Huai, Y.; Wang, K.; Yan, H. CD44v6 expression in patients with stage II or stage III sporadic colorectal cancer is superior to CD44 expression for predicting progression. Int. J. Clin. Exp. Pathol. 2015, 8, 692–701. [Google Scholar]
- Xia, P.; Xu, X.-Y. Prognostic significance of CD44 in human colon cancer and gastric cancer: Evidence from bioinformatic analyses. Oncotarget 2016, 7, 45538–45546. [Google Scholar] [CrossRef]
- Torres, A.; Pac-Sosińska, M.; Wiktor, K.; Paszkowski, T.; Maciejewski, R.; Torres, K. CD44, TGM2 and EpCAM as novel plasma markers in endometrial cancer diagnosis. BMC Cancer 2019, 19, 401. [Google Scholar] [CrossRef]
- DeLong, E.R.; DeLong, D.M.; Clarke-Pearson, D.L. Comparing the areas under two or more correlated receiver operating characteristic curves: A nonparametric approach. Biometrics 1988, 44, 837–845. [Google Scholar] [CrossRef]
- MedCalc Statistical Software Version 19.2; MedCalc Software Ltd.: Ostend, Belgium, 2020; Available online: https://www.medcalc.org (accessed on 19 April 2020).
- Berretta, M.; Alessandrini, L.; De Divitiis, C.; Nasti, G.; Lleshi, A.; Di Francia, R.; Facchini, G.; Cavaliere, C.; Buonerba, C.; Canzonieri, V. Serum and tissue markers in colorectal cancer: State of art. Crit. Rev. Oncol. Hematol. 2017, 111, 103–116. [Google Scholar] [CrossRef]
- Liou, J.-M.; Shun, C.-T.; Liang, J.-T.; Chiu, H.-M.; Chen, M.-J.; Chen, C.-C.; Wang, H.-P.; Wu, M.-S.; Lin, J.-T. Plasma Insulin-Like Growth Factor-Binding Protein-2 Levels as Diagnostic and Prognostic Biomarker of Colorectal Cancer. J. Clin. Endocrinol. Metab. 2010, 95, 1717–1725. [Google Scholar] [CrossRef] [PubMed]
- Vocka, M.; Langer, D.; Fryba, V.; Petrtyl, J.; Hanus, T.; Kalousova, M.; Zima, T.; Petruzelka, L. Novel serum markers HSP60, CHI3L1, and IGFBP-2 in metastatic colorectal cancer. Oncol. Lett. 2019, 18, 6284–6292. [Google Scholar] [CrossRef] [PubMed]
- Hosseini, S.; Vázquez-Villegas, P.; Rito-Palomares, M.; Martinez-Chapa, S.O. Advantages, Disadvantages and Modifications of Conventional ELISA. In Enzyme-linked Immunosorbent Assay (ELISA): From A to Z; Hosseini, S., Vázquez-Villegas, P., Rito-Palomares, M., Martinez-Chapa, S.O., Eds.; SpringerBriefs in Applied Sciences and Technology; Springer: Singapore, 2018; pp. 67–115. [Google Scholar] [CrossRef]
- Tighe, P.J.; Ryder, R.R.; Todd, I.; Fairclough, L.C. ELISA in the multiplex era: Potentials and pitfalls. Proteom. Clin. Appl. 2015, 9, 406–422. [Google Scholar] [CrossRef] [PubMed]
- Erdfelder, E.; Faul, F.; Buchner, A. GPOWER: A general power analysis program. Behav. Res. Methods Instrum. Comput. 1996, 28, 1–11. [Google Scholar] [CrossRef]
- Jones, S.; Carley, S.; Harrison, M. An introduction to power and sample size estimation. Emerg. Med. J. 2003, 20, 453–458. [Google Scholar] [CrossRef] [PubMed]
- Bujang, M.A.; Adnan, T.H. Requirements for Minimum Sample Size for Sensitivity and Specificity Analysis. J. Clin. Diagn. Res. 2016, 10, YE01–YE06. [Google Scholar] [CrossRef] [PubMed]
- Takahashi, H.; Suzuki, Y.; Nishimura, J.; Haraguchi, N.; Ohtsuka, M.; Miyazaki, S.; Uemura, M.; Hata, T.; Takemasa, I.; Mizushima, T.; et al. Characteristics of carbonic anhydrase 9 expressing cells in human intestinal crypt base. Int. J. Oncol. 2016, 48, 115–122. [Google Scholar] [CrossRef] [PubMed]
- Chen, S.-H.; Zhang, B.-Y.; Zhou, B.; Zhu, C.-Z.; Sun, L.-Q.; Feng, Y.-J. Perineural invasion of cancer: A complex crosstalk between cells and molecules in the perineural niche. Am. J. Cancer Res. 2019, 9, 1. [Google Scholar]
- Qureshi-Baig, K.; Kuhn, D.; Viry, E.; Pozdeev, V.I.; Schmitz, M.; Rodriguez, F.; Ullmann, P.; Koncina, E.; Nurmik, M.; Frasquilho, S.; et al. Hypoxia-induced autophagy drives colorectal cancer initiation and progression by activating the PRKC/PKC-EZR (ezrin) pathway. Autophagy 2019, 1–17. [Google Scholar] [CrossRef] [PubMed]
- Willbold, R.; Wirth, K.; Martini, T.; Sültmann, H.; Bolenz, C.; Wittig, R. Excess hepsin proteolytic activity limits oncogenic signaling and induces ER stress and autophagy in prostate cancer cells. Cell Death Dis. 2019, 10, 1–14. [Google Scholar] [CrossRef] [PubMed]
- Klezovitch, O.; Chevillet, J.; Mirosevich, J.; Roberts, R.L.; Matusik, R.J.; Vasioukhin, V. Hepsin promotes prostate cancer progression and metastasis. Cancer Cell 2004, 6, 185–195. [Google Scholar] [CrossRef] [PubMed]
- Pelkonen, M.; Luostari, K.; Tengström, M.; Ahonen, H.; Berdel, B.; Kataja, V.; Soini, Y.; Kosma, V.-M.; Mannermaa, A. Low expression levels of hepsin and TMPRSS3 are associated with poor breast cancer survival. BMC Cancer 2015, 15, 431. [Google Scholar] [CrossRef]
- Roemer, A.; Schwettmann, L.; Jung, M.; Stephan, C.; Roigas, J.; Kristiansen, G.; Loening, S.A.; Lichtinghagen, R.; Jung, K. The membrane proteases adams and hepsin are differentially expressed in renal cell carcinoma. Are they potential tumor markers? J. Urol. 2004, 172, 2162–2166. [Google Scholar] [CrossRef]
- Chen, C.-H.; Su, K.-Y.; Tao, M.-H.; Lin, S.-W.; Su, Y.-H.; Tsai, Y.-C.; Cheng, K.-C.; Jeng, Y.-M.; Sheu, J.-C. Decreased expressions of hepsin in human hepatocellular carcinomas. Liver Int. 2006, 26, 774–780. [Google Scholar] [CrossRef]
- Taylor, D.P.; Cannon-Albright, L.A.; Sweeney, C.; Williams, M.S.; Haug, P.J.; Mitchell, J.A.; Burt, R.W. Comparison of compliance for colorectal cancer screening and surveillance by colonoscopy based on risk. Genet. Med. 2011, 13, 737–743. [Google Scholar] [CrossRef]
- Lin, J.S.; Piper, M.A.; Perdue, L.A.; Rutter, C.M.; Webber, E.M.; O’Connor, E.; Smith, N.; Whitlock, E.P. Screening for Colorectal Cancer: Updated Evidence Report and Systematic Review for the US Preventive Services Task Force. JAMA 2016, 315, 2576–2594. [Google Scholar] [CrossRef]
- Zauber, A.G. The Impact of Screening on Colorectal Cancer Mortality and Incidence—Has It Really Made a Difference? Dig. Dis. Sci. 2015, 60, 681–691. [Google Scholar] [CrossRef]
- Quick, J.M. R Tutorial Series: Two-Way ANOVA with Unequal Sample Sizes. In My Statistical Analysis with R; Packt Publishing Inc.: Birmingham, UK, 2010; pp. 1–557. [Google Scholar]
- Kulinskaya, E.; Staudte, R.G. Interval estimates of weighted effect sizes in the one-way heteroscedastic ANOVA. Br. J. Math. Stat. Psychol. 2006, 59, 97–111. [Google Scholar] [CrossRef]
- Kulinskaya, E.; Staudte, R.G.; Gao, H. Power Approximations in Testing for Unequal Means in a One-Way ANOVA Weighted for Unequal Variances. Commun. Stat. Theory Methods 2003, 32, 2353–2371. [Google Scholar] [CrossRef]
- Cohen, B.H. Calculating a Factorial ANOVA from Means and Standard Deviations. Underst. Stat. 2002, 1, 191–203. [Google Scholar] [CrossRef]
- Henkhaus, R.S.; Gerner, E.W.; Ignatenko, N.A. Kallikrein 6 is a mediator of K-RAS-dependent migration of colon carcinoma cells. Biol. Chem. 2008, 389, 757–764. [Google Scholar] [CrossRef] [PubMed]
- Chen, H.; Sells, E.; Pandey, R.; Abril, E.R.; Hsu, C.-H.; Krouse, R.S.; Nagle, R.B.; Pampalakis, G.; Sotiropoulou, G.; Ignatenko, N.A. Kallikrein 6 protease advances colon tumorigenesis via induction of the high mobility group A2 protein. Oncotarget 2019, 10, 6062–6078. [Google Scholar] [CrossRef]
- Vakrakou, A.; Devetzi, M.; Papachristopoulou, G.; Malachias, A.; Scorilas, A.; Xynopoulos, D.; Talieri, M. Kallikrein-related peptidase 6 (KLK6) expression in the progression of colon adenoma to carcinoma. Biol. Chem. 2014, 395, 1105–1117. [Google Scholar] [CrossRef]
- Michaelidou, K.; Tzovaras, A.; Tsoukalas, N.; Mavridis, K.; Tsoukalas, G.; Tsapralis, N.; Stamatopoulou, S.; Zylis, D.; Misitzis, I.; Ardavanis, A.; et al. Evaluation of the clinical utility of kallikrein-related peptidase 6 gene (KLK6) downregulation in breast cancer. JCO 2012, 30, 10606. [Google Scholar] [CrossRef]
- Pampalakis, G.; Prosnikli, E.; Agalioti, T.; Vlahou, A.; Zoumpourlis, V.; Sotiropoulou, G. A Tumor-Protective Role for Human Kallikrein-Related Peptidase 6 in Breast Cancer Mediated by Inhibition of Epithelial-to-Mesenchymal Transition. Cancer Res. 2009, 69, 3779–3787. [Google Scholar] [CrossRef]
- Scarisbrick, I.A.; Epstein, B.; Cloud, B.A.; Yoon, H.; Wu, J.; Renner, D.N.; Blaber, S.I.; Blaber, M.; Vandell, A.G.; Bryson, A.L. Functional Role of Kallikrein 6 in Regulating Immune Cell Survival. PLoS ONE 2011, 6. [Google Scholar] [CrossRef]
- Ciccone, V.; Terzuoli, E.; Donnini, S.; Giachetti, A.; Morbidelli, L.; Ziche, M. Stemness marker ALDH1A1 promotes tumor angiogenesis via retinoic acid/HIF-1α/VEGF signalling in MCF-7 breast cancer cells. J. Exp. Clin. Cancer Res. 2018, 37, 1–16. [Google Scholar] [CrossRef]
- Yeh, C.Y.; Adusumilli, R.; Kullolli, M.; Mallick, P.; John, E.M.; Pitteri, S.J. Assessing biological and technological variability in protein levels measured in pre-diagnostic plasma samples of women with breast cancer. Biomark. Res. 2017, 5. [Google Scholar] [CrossRef]
- Varoquaux, G. Cross-validation failure: Small sample sizes lead to large error bars. NeuroImage 2018, 180, 68–77. [Google Scholar] [CrossRef] [PubMed]
- Kaplan, R.M.; Chambers, D.A.; Glasgow, R.E. Big Data and Large Sample Size: A Cautionary Note on the Potential for Bias. Clin. Transl. Sci. 2014, 7, 342–346. [Google Scholar] [CrossRef] [PubMed]
- Moonesinghe, R.; Khoury, M.J.; Liu, T.; Ioannidis, J.P.A. Required sample size and nonreplicability thresholds for heterogeneous genetic associations. Proc. Natl. Acad. Sci. USA 2008, 105, 617–622. [Google Scholar] [CrossRef] [PubMed]


| Marker | Role in Colorectal Cancer | Citation |
|---|---|---|
| L1CAM | • A member of the immunoglobulin-like cell adhesion molecule family that is shown to be associated with a worse prognosis of CRC. | [19,20,21] |
| • A major driver for tumor formation and metastasis initiation capability in CRC. | [22,23] | |
| • L1CAM contributes to peritoneal dissemination in CRC. | [24] | |
| • The regulation of L1CAM is strongly correlated with morphologic features at the invasive front in CRC. | [25] | |
| CA9 | • A transmembrane glycoprotein involved in cell proliferation, angiogenesis, and a marker for hypoxia and acidosis, which is linked to poor prognosis in CRC. | [26] |
| • CA9 correlates with perineural invasion in CRC. | [27] | |
| MSLN | • A cell surface membrane-bound glycoprotein which is highly expressed in solid CRC tumors (40–45%). | [28,29] |
| • MSLN acts as a prognostic marker for stage ΙΙ/ΙΙΙ CRC. | [30] | |
| MDK | • A heparin-binding growth factor, which induces neo-lymphangiogenesis and exhibits anti-apoptotic, migration-promoting, and angiogenic properties. | [31] |
| • Overexpression of MDK in the blood of CRC patients indicates a worse prognosis. MDK generally increases with increasing severity of cancer. | [32,33,34] | |
| • MDK adds value to multi-marker CRC biomarker panels. | [34] | |
| HPN | • A cell-surface type II transmembrane serine protease with genetic alteration in colon carcinoma (1.2%). | [35,36] |
| KLK6 | • A trypsin-like serine protease that is upregulated in tissues and sera from patients with malignant colon tumors compared with normal tissues. | [37,38,39,40] |
| • Upregulation of KLK6 protein is associated with a more advanced Dukes’ stage, serosal invasion, liver metastasis, and unfavorable predictor of overall survival among CRC patients. | [41,42,43,44] | |
| • KLK6 regulates epithelial–mesenchymal transition in CRC progression via the TGF-β- (transforming growth factor beta-) signaling pathway. | [45] | |
| • KLK6 mRNA overexpression is associated with high depth of tumor invasion, presence of distant metastases, and tumor, node, metastasis (TNM) stage of patients. | [44,46,47] | |
| • KLK6 mRNA expression is shown to predict poor disease-free and overall survival independently of patient gender, age, tumor size, location, histological subtype, grade, venous invasion, lymphatic invasion, TNM stage, radiotherapy, and chemotherapy treatment. | [47] | |
| TGM2 | • A well-known apoptosis attenuator. TGM2 is transcriptionally activated by protein C-eta-1 (ETS1) and inhibits apoptosis, angiogenesis. TGM activates Wnt/β-catenin signaling, resulting in chemotherapy-related stress. | [48,49] |
| • Higher expression of TGM2 indicates a poorer overall survival rate (independent prognostic marker). | [50] | |
| • TGM2 affects the metastatic potential, self-renewal, and stemness of CRC stem cells by regulating epithelial–mesenchymal transition- and stemness-related proteins. | [51] | |
| ALDH1A1 | • A cancer stem cell marker, where its nuclear expression is associated with shortened overall survival in CRC patients. | [52] |
| • Overexpression of ALDH1A1 in CRC is associated with the presence of lymph node metastases and poor prognosis. | [53,54] | |
| • ALDH1A1 expression is associated with poor differentiation, “right-sidedness”, and poor survival in human CRC. | [55] | |
| EpCAM | • A transmembrane glycoprotein cell adhesion molecule highly expressed on the surface of epithelium-originated tumor cells, including CRC. High expression of EpCAM is linked with an aggressive tumor phenotype in primary stages of CRC. | [56,57,58,59] |
| • Loss or reduced expression of EpCAM during disease progression stage is linked with aggressive tumor phenotype AM, tumor differentiation, tumor staging, vascular invasion, depth of tumor invasion, lymph node metastasis, distant metastasis, and tumor budding in CRC. | [60,61,62,63,64,65] | |
| • EpCAM-based assay (the CellSearch® System) is the only FDA-approved test for enrichment and detection of circulating tumor cells of cancers, including CRC. | [66] | |
| CD44 | • A common CRC stem cell marker and is associated with tumor initiation, tumor progression, tumor growth, invasion, and metastasis. | [67,68,69] |
| • Overexpression of CD44 in colon tissue is associated with cancer progression, aggressiveness in stage I and III sporadic CRC, poor differentiation, lymph node metastasis, and distant metastasis. | [70] | |
| • Low alteration frequency of CD44 found in mRNA is linked with the prediction of prognosis in CRC. | [71] |
| Number Stage | TNM System and Duke Staging |
|---|---|
| Stage I | T1 or T2, N0, M0 or Dukes’ A |
| Stage II | T3 or T4, N0, M0 or Dukes’ B |
| Stage III | Any T, N1 or N2, M0 or Dukes’ C |
| Stage IV | Any T, any N, M1 or Dukes’ D |
| Characteristics | Number of Patients | |
|---|---|---|
| Gender | Female | 20 |
| Male | 40 | |
| Distant metastatic CRC | Absent | 36 |
| Present | 24 | |
| Number staging | Stage I | 5 |
| Stage II | 7 | |
| Stage III | 24 | |
| Stage IV | 24 | |
| Chemotherapy | Absent | 50 |
| Present | 10 (all Stage IV) | |
| Lymph node metastasis | Absent | 42 |
| Present | 18 | |
| Model | Sensitivity (%) | Specificity (%) | ROC AUC | 95% CI | ROC p-Value | SE | dAUC | p-value |
|---|---|---|---|---|---|---|---|---|
| Primary vs. metastatic CRC | ||||||||
| L1CAM | 58.330 * | 77.780 * | 0.661 | 0.527–0.778 a | 0.034 | 0.076 b | / | 0.034 |
| CA9 | 70.830 * | 61.110 * | 0.686 | 0.554–0.800 a | 0.008 | 0.070 b | / | 0.345 |
| HPN | 50.000 * | 80.560 * | 0.685 | 0.552–0.799 a | 0.007 | 0.069 b | / | 0.345 |
| L1CAM/CA9/HPN | 88.890 | 50.000 | 0.719 | 0.588–0.827 | / | 0.071 | / | / |
| Number stage | ||||||||
| KLK6 stage I & II vs. III | 87.500 * | 58.330 * | 0.757 | 0.586–0.884 a | 0.007 | 0.095 b | / | 0.023 |
| KLK6 stage III vs. IV | 58.330 * | 87.500 * | 0.727 | 0.580–0.846 a | 0.002 | 0.075 b | / | 0.023 |
| HPN stage III vs. IV | 50.000 * | 83.330 * | 0.701 | 0.551–0.824 a | 0.010 | 0.078 b | / | 0.111 |
| KLK6/HPN stage III vs. IV | 66.670 | 62.500 | 0.727 | 0.580–0.846 | 0.868 | 0.074 | 0.013 | / |
| Chemo versus no chemo | ||||||||
| HPN | 76.000 * | 70.000 * | 0.710 | 0.578–0.820 a | 0.015 | 0.086 b | / | 0.858 |
| ALDH1A1 | 86.000 * | 70.000 * | 0.764 | 0.637–0.864 a | 0.013 | 0.106 b | / | 0.003 |
| HPN/ALDH1A1 | 40.000 | 98.000 | 0.748 | 0.619–0.851 | 0.466 | 0.109 | 0.054 | / |
| Stage IV chemo versus no chemo | ||||||||
| ALDH1A1 | 78.570 * | 70.000 * | 0.743 | 0.525–0.898 a | 0.031 | 0.110 b | / | 0.039 |
© 2020 by the authors. Licensee MDPI, Basel, Switzerland. This article is an open access article distributed under the terms and conditions of the Creative Commons Attribution (CC BY) license (http://creativecommons.org/licenses/by/4.0/).
Share and Cite
Tieng, F.Y.F.; Abu, N.; Sukor, S.; Mohd Azman, Z.A.; Mahamad Nadzir, N.; Lee, L.-H.; Ab Mutalib, N.S. L1CAM, CA9, KLK6, HPN, and ALDH1A1 as Potential Serum Markers in Primary and Metastatic Colorectal Cancer Screening. Diagnostics 2020, 10, 444. https://doi.org/10.3390/diagnostics10070444
Tieng FYF, Abu N, Sukor S, Mohd Azman ZA, Mahamad Nadzir N, Lee L-H, Ab Mutalib NS. L1CAM, CA9, KLK6, HPN, and ALDH1A1 as Potential Serum Markers in Primary and Metastatic Colorectal Cancer Screening. Diagnostics. 2020; 10(7):444. https://doi.org/10.3390/diagnostics10070444
Chicago/Turabian StyleTieng, Francis Yew Fu, Nadiah Abu, Surani Sukor, Zairul Azwan Mohd Azman, Norshahidah Mahamad Nadzir, Learn-Han Lee, and Nurul Syakima Ab Mutalib. 2020. "L1CAM, CA9, KLK6, HPN, and ALDH1A1 as Potential Serum Markers in Primary and Metastatic Colorectal Cancer Screening" Diagnostics 10, no. 7: 444. https://doi.org/10.3390/diagnostics10070444
APA StyleTieng, F. Y. F., Abu, N., Sukor, S., Mohd Azman, Z. A., Mahamad Nadzir, N., Lee, L.-H., & Ab Mutalib, N. S. (2020). L1CAM, CA9, KLK6, HPN, and ALDH1A1 as Potential Serum Markers in Primary and Metastatic Colorectal Cancer Screening. Diagnostics, 10(7), 444. https://doi.org/10.3390/diagnostics10070444