Magnetic Resonance Imaging Derived Biomarkers of IDH Mutation Status and Overall Survival in Grade III Astrocytomas

 ,
,  , ,
, ,  ,
, 
Abstract
1. Introduction
2. Materials and Methods
2.1. Patient Cohort
2.2. MR Imaging Acquisition
2.3. Pathology and Immunohistochemical Analysis
2.4. Imaging Analysis
2.5. Statistical Analyses
3. Results
4. Discussion
Limits of the Study
5. Conclusions
Author Contributions
Funding
Conflicts of Interest
References
- Louis, D.N.; Perry, A.; Reifenberger, G.; Von Deimling, A.; Figarella-Branger, D.; Cavenee, W.K.; Ohgaki, H.; Wiestler, O.D.; Kleihues, P.; Ellison, D.W. The 2016 World Health Organization Classification of Tumors of the Central Nervous System: A summary. Acta Neuropathol. 2016, 131, 803–820. [Google Scholar] [CrossRef] [PubMed]
- Jalbert, L.E.; Elkhaled, A.; Phillips, J.J.; Neill, E.; Williams, A.; Crane, J.C.; Olson, M.P.; Molinaro, A.M.; Berger, M.S.; Ronen, S.M.; et al. Metabolic profiling of IDH mutation and malignant progression in infiltrating glioma. Sci. Rep. 2017, 7, 44792. [Google Scholar] [CrossRef] [PubMed]
- Sanson, M.; Marie, Y.; Paris, S.; Idbaih, A.; Laffaire, J.; Ducray, F.; El Hallani, S.; Boisselier, B.; Mokhtari, K.; Delattre, J.Y.; et al. Isocitrate dehydrogenase 1 codon 132 mutation is an important prognostic biomarker in gliomas. J. Clin. Oncol. 2009, 27, 4150–4154. [Google Scholar] [CrossRef] [PubMed]
- Yan, H.; Parsons, D.W.; Jin, G.; McLendon, R.; Rasheed, B.A.; Yuan, W.; Kos, I.; Batinic-Haberle, I.; Jones, S.; Friedman, H.; et al. IDH1 and IDH2 mutations in gliomas. N. Engl. J. Med. 2009, 360, 765–773. [Google Scholar] [CrossRef] [PubMed]
- Watanabe, T.; Nobusawa, S.; Kleihues, P.; Ohgaki, H. IDH1 mutations are early events in the development of astrocytomas and oligodendrogliomas. Am. J. Pathol. 2009, 174, 1149–1153. [Google Scholar] [CrossRef] [PubMed]
- Hartmann, C.; Meyer, J.; Balss, J.; Capper, D.; Mueller, W.; Christians, A.; Felsberg, J.; Wolter, M.; Mawrin, C.; Weller, M.; et al. Type and frequency of IDH1 and IDH2 mutations are related to astrocytic and oligodendroglial differentiation and age: A study of 1,010 diffuse gliomas. Acta Neuropathol. 2009, 118, 469–474. [Google Scholar] [CrossRef]
- Kickingereder, P.; Sahm, F.; Radbruch, A.; Wick, W.; Heiland, S.; Von Deimling, A.; Bendszus, M.; Wiestler, B. IDH mutation status is associated with a distinct hypoxia/angiogenesis transcriptome signature which is non-invasively predictable with rCBV imaging in human glioma. Sci. Rep. 2015, 5, 16238. [Google Scholar] [CrossRef]
- Seok, J.; Yoon, S.H.; Lee, S.H.; Jung, J.H.; Lee, Y.M. The oncometabolite d-2-hydroxyglutarate induces angiogenic activity through the vascular endothelial growth factor receptor 2 signaling pathway. Int. J. Oncol. 2019, 54, 753–763. [Google Scholar] [CrossRef]
- Wu, H.; Tong, H.; Du, X.; Guo, H.; Ma, Q.; Zhang, Y.; Zhou, X.; Liu, H.; Wang, S.; Zhang, W.; et al. Vascular habitat analysis based on dynamic susceptibility contrast perfusion MRI predicts IDH mutation status and prognosis in high-grade gliomas. Eur. Radiol. 2020. [Google Scholar] [CrossRef]
- Suh, C.H.; Kim, H.S.; Jung, S.C.; Choi, C.G.; Kim, S.J. Imaging prediction of isocitrate dehydrogenase (IDH) mutation in patients with glioma: A systemic review and meta-analysis. Eur. Radiol. 2019, 29, 745–758. [Google Scholar] [CrossRef]
- Le Bihan, D. Looking into the functional architecture of the brain with diffusion MRI. Nat. Rev. Neurosci. 2003, 4, 469–480. [Google Scholar] [CrossRef] [PubMed]
- Surov, A.; Meyer, H.J.; Wienke, A. Correlation between apparent diffusion coefficient (ADC) and cellularity is different in several tumors: A meta-analysis. Oncotarget 2017, 8, 59492–59499. [Google Scholar] [CrossRef] [PubMed]
- Surov, A.; Hamerla, G.; Meyer, H.J.; Winter, K.; Schob, S.; Fiedler, E. Whole lesion histogram analysis of meningiomas derived from ADC values. Correlation with several cellularity parameters, proliferation index KI 67, nucleic content, and membrane permeability. Magn. Reson. Imaging 2018, 51, 158–162. [Google Scholar] [CrossRef] [PubMed]
- Liu, T.; Cheng, G.; Kang, X.; Xi, Y.; Zhu, Y.; Wang, K.; Sun, C.; Ye, J.; Li, P.; Yin, H. Noninvasively evaluating the grading and IDH1 mutation status of diffuse gliomas by three-dimensional pseudo-continuous arterial spin labeling and diffusion-weighted imaging. Neuroradiology 2018, 60, 693–702. [Google Scholar] [CrossRef]
- Xing, Z.; Yang, X.; She, D.; Lin, Y.; Zhang, Y.; Cao, D. Noninvasive Assessment of IDH Mutational Status in World Health Organization Grade II and III Astrocytomas Using DWI and DSC-PWI Combined with Conventional MR Imaging. AJNR Am. J. Neuroradiol. 2017, 38, 1138–1144. [Google Scholar] [CrossRef]
- Shboul, Z.A.; Chen, J.; Miftekharuddin, K. Prediction of Molecular Mutations in Diffuse Low-Grade Gliomas using MR Imaging Features. Sci. Rep. 2020, 10, 3711. [Google Scholar] [CrossRef]
- Delfanti, R.L.; Piccioni, D.E.; Handwerker, J.; Bahrami, N.; Krishnan, A.; Karunamuni, R.; Snyder, V.S. Imaging Correlates for the 2016 Update on WHO Classification of Grade II/III Gliomas: Implications for IDH, 1p/19q and ATRX Status. J. Neuro-Oncol. 2017, 135, 601–609. [Google Scholar] [CrossRef] [PubMed]
- Bulakbaşı, N.; Paksoy, Y. Advanced imaging in adult diffusely infiltrating low-grade gliomas. Insights Imaging 2019, 10, 122. [Google Scholar] [CrossRef] [PubMed]
- Hu, Y.C.; Yan, L.F.; Sun, Q.; Liu, Z.C.; Wang, S.M.; Han, Y.; Tian, Q.; Sun, Y.Z.; Zheng, D.D.; Cui, G.B.; et al. Comparison between ultra-high and conventional mono b-value DWI for preoperative glioma grading. Oncotarget 2017, 8, 37884–37895. [Google Scholar] [CrossRef] [PubMed]
- Wang, Q.P.; Lei, D.Q.; Yuan, Y.; Xiong, N.X. Accuracy of ADC derived from DWI for differentiating high-grade from low-grade gliomas: Systematic review and meta-analysis. Medicine 2020, 99, e19254. [Google Scholar] [CrossRef] [PubMed]
- Tan, Y.; Zhang, H.; Wang, X.C.; Qin, J.B.; Wang, L. The value of multi ultra high-b-value DWI in grading cerebral astrocytomas and its association with aquaporin-4. Br. J. Radiol. 2018, 91, 20170696. [Google Scholar] [CrossRef] [PubMed]
- Chen, S.D.; Hou, P.F.; Lou, L.; Jin, X.; Wang, T.H.; Xu, J.L. The correlation between MR diffusion-weighted imaging and pathological grades on glioma. Eur. Rev. Med. Pharmacol. Sci. 2014, 18, 1904–1909. [Google Scholar] [PubMed]
- Suzuki, H.; Aoki, K.; Chiba, K.; Sato, Y.; Shiozawa, Y.; Shiraishi, Y.; Shimamura, T.; Niida, A.; Motomura, K.; Yamamoto, T.; et al. Mutational landscape and clonal architecture in grade II and III gliomas. Nat. Genet. 2015, 47, 458–468. [Google Scholar] [CrossRef] [PubMed]
- Van Den Bent, M.J.; Hartmann, C.; Preusser, M.; Ströbel, T.; Dubbink, H.J.; Kros, J.M.; von Deimling, A.; Boisselier, B.; Sanson, M.; Diefes, K.L.; et al. Interlaboratory comparison of IDH mutation detection. J. Neuro-Oncol. 2013, 112, 173–178. [Google Scholar] [CrossRef]
- Horbinski, C.; Miller, C.R.; Perry, A. Gone FISHing: Clinical lessons learned in brain tumor molecular diagnostics over the last decade. Brain Pathol. 2011, 21, 57–73. [Google Scholar] [CrossRef]
- Reuss, D.E.; Mamatjan, Y.; Schrimpf, D.; Capper, D.; Hovestadt, V.; Kratz, A.; Sahm, F.; Koelsche, C.; Korshunov, A.; Hartmann, C.; et al. IDH mutant diffuse and anaplastic astrocytomas have similar age at presentation and little difference in survival: A grading problem for WHO. Acta Neuropathol. 2015, 129, 867–873. [Google Scholar] [CrossRef]
- Qi, S.; Yu, L.; Li, H.; Ou, Y.; Qiu, X.; Ding, Y.; Han, H.; Zhang, X. Isocitrate dehydrogenase mutation is associated with tumor location and magnetic resonance imaging characteristics in astrocytic neoplasms. Oncol. Lett. 2014, 7, 1895–1902. [Google Scholar] [CrossRef]
- Yan, R.; Haopeng, P.; Xiaoyuan, F.; Jinsong, W.; Jiawen, Z.; Chengjun, Y.; Tianming, Q.; Ji, X.; Mao, S.; Yong, Z.; et al. Non-Gaussian diffusion MR imaging of glioma: Comparisons of multiple diffusion parameters and correlation with histologic grade and MIB-1 (Ki-67 labeling) index. Neuroradiology 2016, 58, 121–132. [Google Scholar] [CrossRef]
- Calvar, J.A.; Meli, F.J.; Romero, C.; Yánez, M.C.P.; Martinez, A.R.; Lambre, H.; Taratuto, A.L.; Sevlever, G. Characterization of brain tumors by MRS, DWI, Ki-67 labeling index. J. Neuro-Oncol. 2005, 72, 273–280. [Google Scholar] [CrossRef]
- Olar, A.; Wani, K.M.; Alfaro-Munoz, K.D.; Heathcock, L.E.; van Thuijl, H.F.; Gilbert, M.R.; Armstrong, T.S.; Sulman, E.P.; Cahill, D.P.; Yuan, Y.; et al. IDH mutation status and role of WHO grade and mitotic index in overall survival in grade II–III diffuse gliomas. Acta Neuropathol. 2015, 129, 585–596. [Google Scholar] [CrossRef]
- Yamasaki, F.; Sugiyama, K.; Ohtaki, M.; Takeshima, Y.; Abe, N.; Akiyama, Y.; Takaba, J.; Amatya, V.J.; Saito, T.; Hanaya, R.; et al. Glioblastoma treated with postoperative radiochemotherapy: Prognostic value of apparent diffusion coefficient at MR imaging. Eur. J. Radiol. 2010, 73, 532–537. [Google Scholar] [CrossRef] [PubMed]
- Nakamura, H.; Murakami, R.; Hirai, T.; Kitajima, M.; Yamashita, Y. Can MRI-derived factors predict the survival in glioblastoma patients treated with postoperative chemoradiation therapy? Acta Radiol. 2013, 54, 214–220. [Google Scholar] [CrossRef] [PubMed]
- Sonoda, Y. Clinical impact of revisions to the WHO classification of diffuse gliomas and associated future problems. Int. J. Clin. Oncol. 2020. [Google Scholar] [CrossRef] [PubMed]
- Hartmann, C.; Hentschel, B.; Wick, W.; Capper, D.; Felsberg, J.; Simon, M.; Westphal, M.; Schackert, G.; Meyermann, R.; Reifenberger, G.; et al. Patients with IDH1 wild type anaplastic astrocytomas exhibit worse prognosis than IDH1-mutated glioblastomas, and IDH1 mutation status accounts for the unfavorable prognostic effect of higher age: Implications for classification of gliomas. Acta Neuropathol. 2010, 120, 707–718. [Google Scholar] [CrossRef] [PubMed]
- Beiko, J.; Suki, D.; Hess, K.R.; Fox, B.D.; Cheung, V.; Cabral, M.; Shonka, N.; Gilbert, M.R.; Sawaya, R.; Weinberg, J.; et al. IDH1 mutant malignant astrocytomas are more amenable to surgical resection and have a survival benefit associated with maximal surgical resection. Neuro Oncol. 2014, 16, 81–91. [Google Scholar] [CrossRef] [PubMed]
- Dang, L.; Yen, K.; Attar, E.C. IDH mutations in cancer and progress toward development of targeted therapeutics. Ann. Oncol. 2016, 27, 599–608. [Google Scholar] [CrossRef]


| IDH Mutation (10) | IDH Wild-Type (12) | p-Value | |
|---|---|---|---|
| Sex (male/female) | 6/4 | 8/4 | 0.564 |
| Age | 43 ± 13 | 58 ± 14 | * 0.041 |
| Location | 0.456 | ||
| Frontal lobe | 8 | 6 | |
| Parietal lobe | 0 | 2 | |
| Temporal lobe | 2 | 3 | |
| Occipital lobe | 0 | 0 | |
| Insular lobe | 0 | 1 | |
| T2w Signal Intensity | 0.092 | ||
| Homogeneous | 3 | 8 | |
| Heterogeneous | 7 | 4 | |
| Borders | 0.194 | ||
| Defined | 7 | 4 | |
| Indistinct | 3 | 8 | |
| Edema | 0.665 | ||
| Yes | 5 | 8 | |
| No | 5 | 4 | |
| Contrast enhancement | * 0.039 | ||
| Yes | 0 | 5 | |
| No | 10 | 7 |
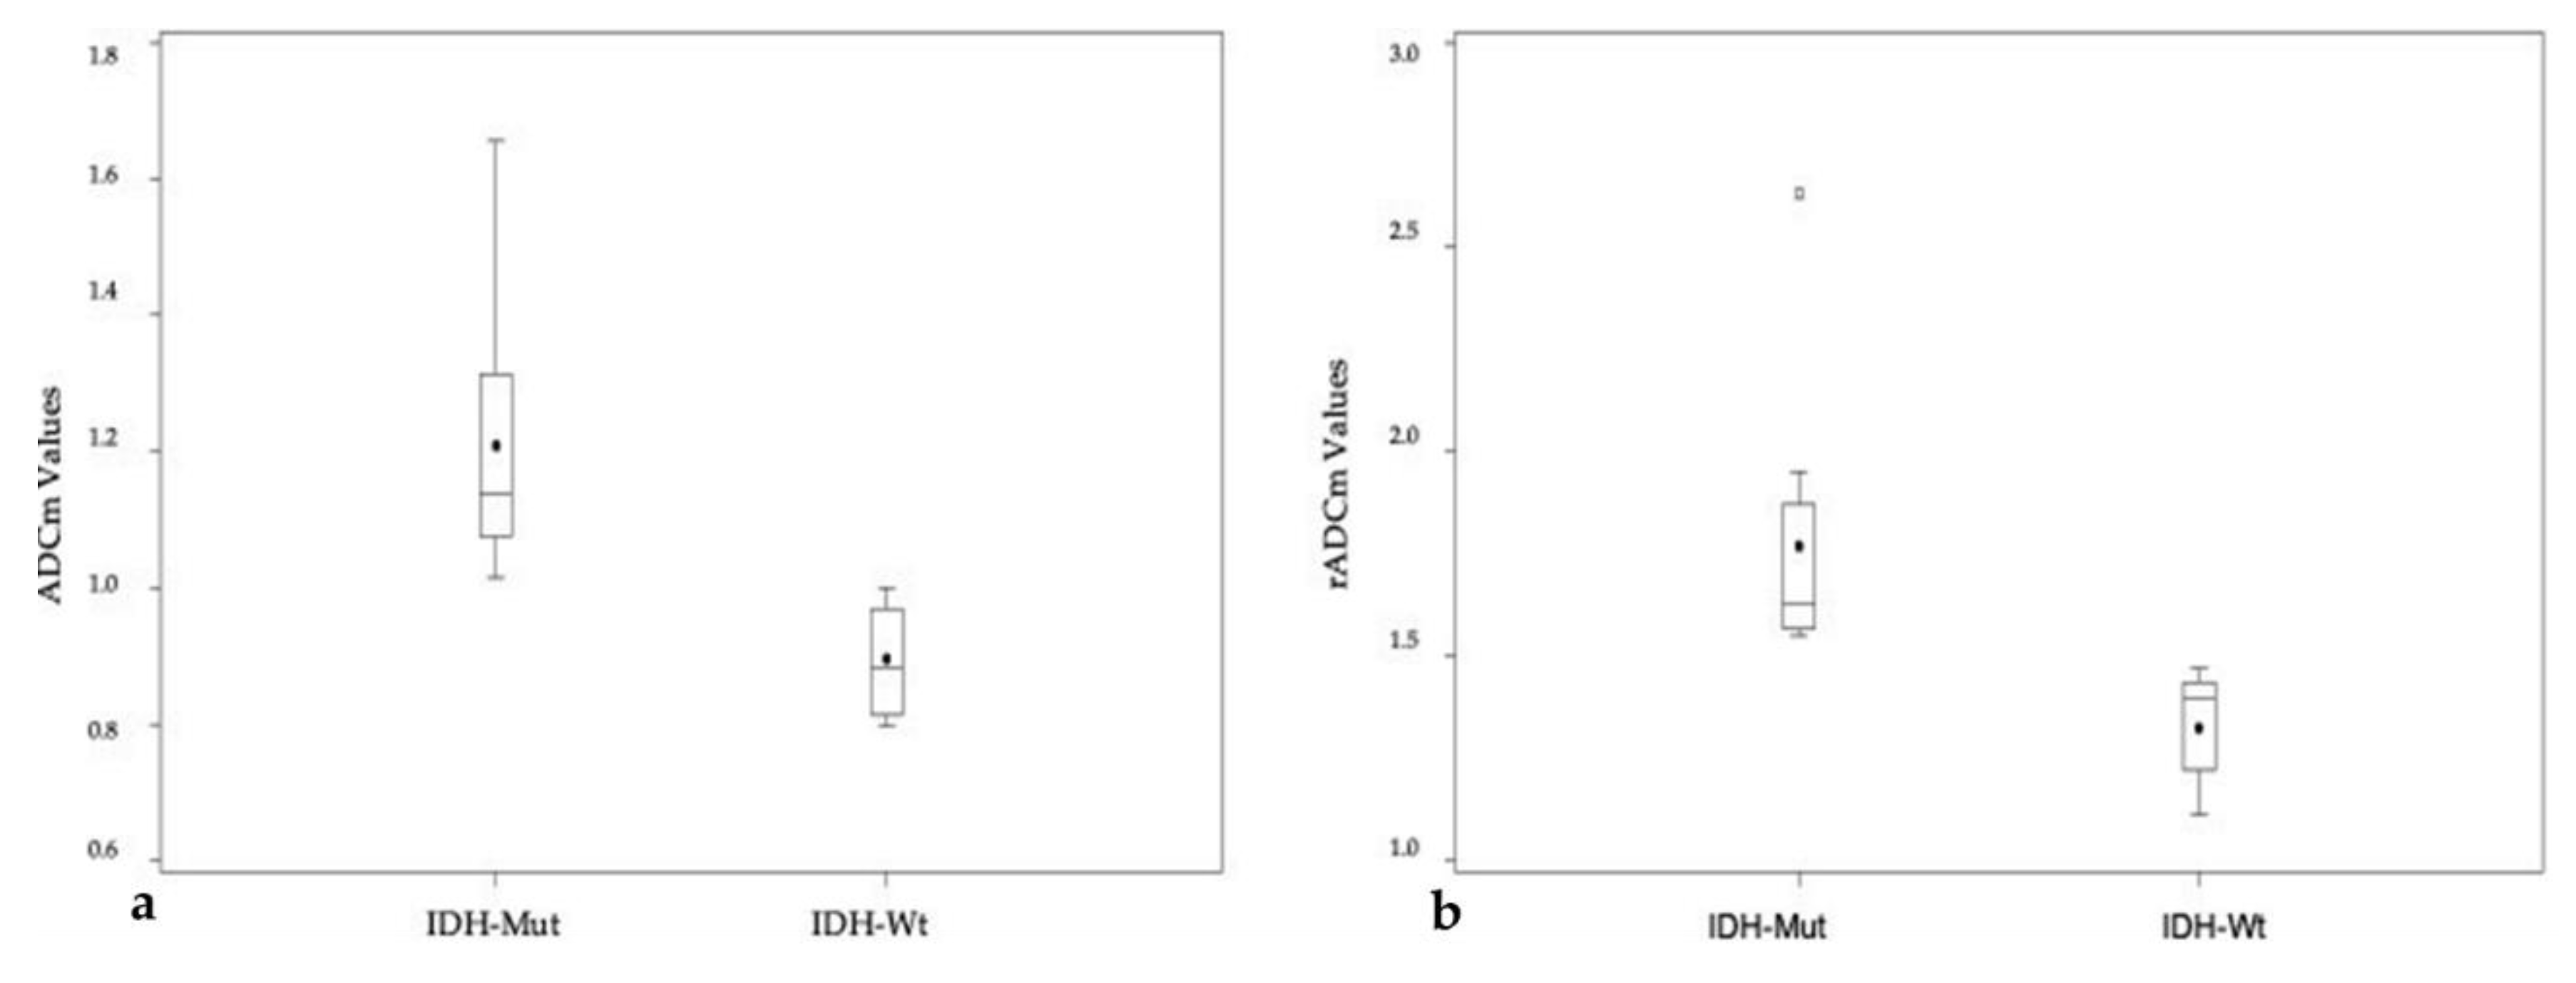
| IDH-Mutation | IDH Wild Type | p-Value | |
|---|---|---|---|
| ADCm | 1.21 ± 0.19 | 0.90 ± 0.08 | 0.0004 (* 0.0012) |
| rADCm | 1.77 ± 0.33 | 1.33 ± 0.13 | 0.0021 |
© 2020 by the authors. Licensee MDPI, Basel, Switzerland. This article is an open access article distributed under the terms and conditions of the Creative Commons Attribution (CC BY) license (http://creativecommons.org/licenses/by/4.0/).
Share and Cite
Feraco, P.; Bacci, A.; Ferrazza, P.; van den Hauwe, L.; Pertile, R.; Girlando, S.; Barbareschi, M.; Gagliardo, C.; Morganti, A.G.; Petralia, B. Magnetic Resonance Imaging Derived Biomarkers of IDH Mutation Status and Overall Survival in Grade III Astrocytomas. Diagnostics 2020, 10, 247. https://doi.org/10.3390/diagnostics10040247
Feraco P, Bacci A, Ferrazza P, van den Hauwe L, Pertile R, Girlando S, Barbareschi M, Gagliardo C, Morganti AG, Petralia B. Magnetic Resonance Imaging Derived Biomarkers of IDH Mutation Status and Overall Survival in Grade III Astrocytomas. Diagnostics. 2020; 10(4):247. https://doi.org/10.3390/diagnostics10040247
Chicago/Turabian StyleFeraco, Paola, Antonella Bacci, Patrizia Ferrazza, Luc van den Hauwe, Riccardo Pertile, Salvatore Girlando, Mattia Barbareschi, Cesare Gagliardo, Alessio Giuseppe Morganti, and Benedetto Petralia. 2020. "Magnetic Resonance Imaging Derived Biomarkers of IDH Mutation Status and Overall Survival in Grade III Astrocytomas" Diagnostics 10, no. 4: 247. https://doi.org/10.3390/diagnostics10040247
APA StyleFeraco, P., Bacci, A., Ferrazza, P., van den Hauwe, L., Pertile, R., Girlando, S., Barbareschi, M., Gagliardo, C., Morganti, A. G., & Petralia, B. (2020). Magnetic Resonance Imaging Derived Biomarkers of IDH Mutation Status and Overall Survival in Grade III Astrocytomas. Diagnostics, 10(4), 247. https://doi.org/10.3390/diagnostics10040247