Limited Diagnostic Utility of Chromogranin A Measurements in Workup of Neuroendocrine Tumors

 ,
,  ,
, 
Abstract
1. Introduction
2. Methods
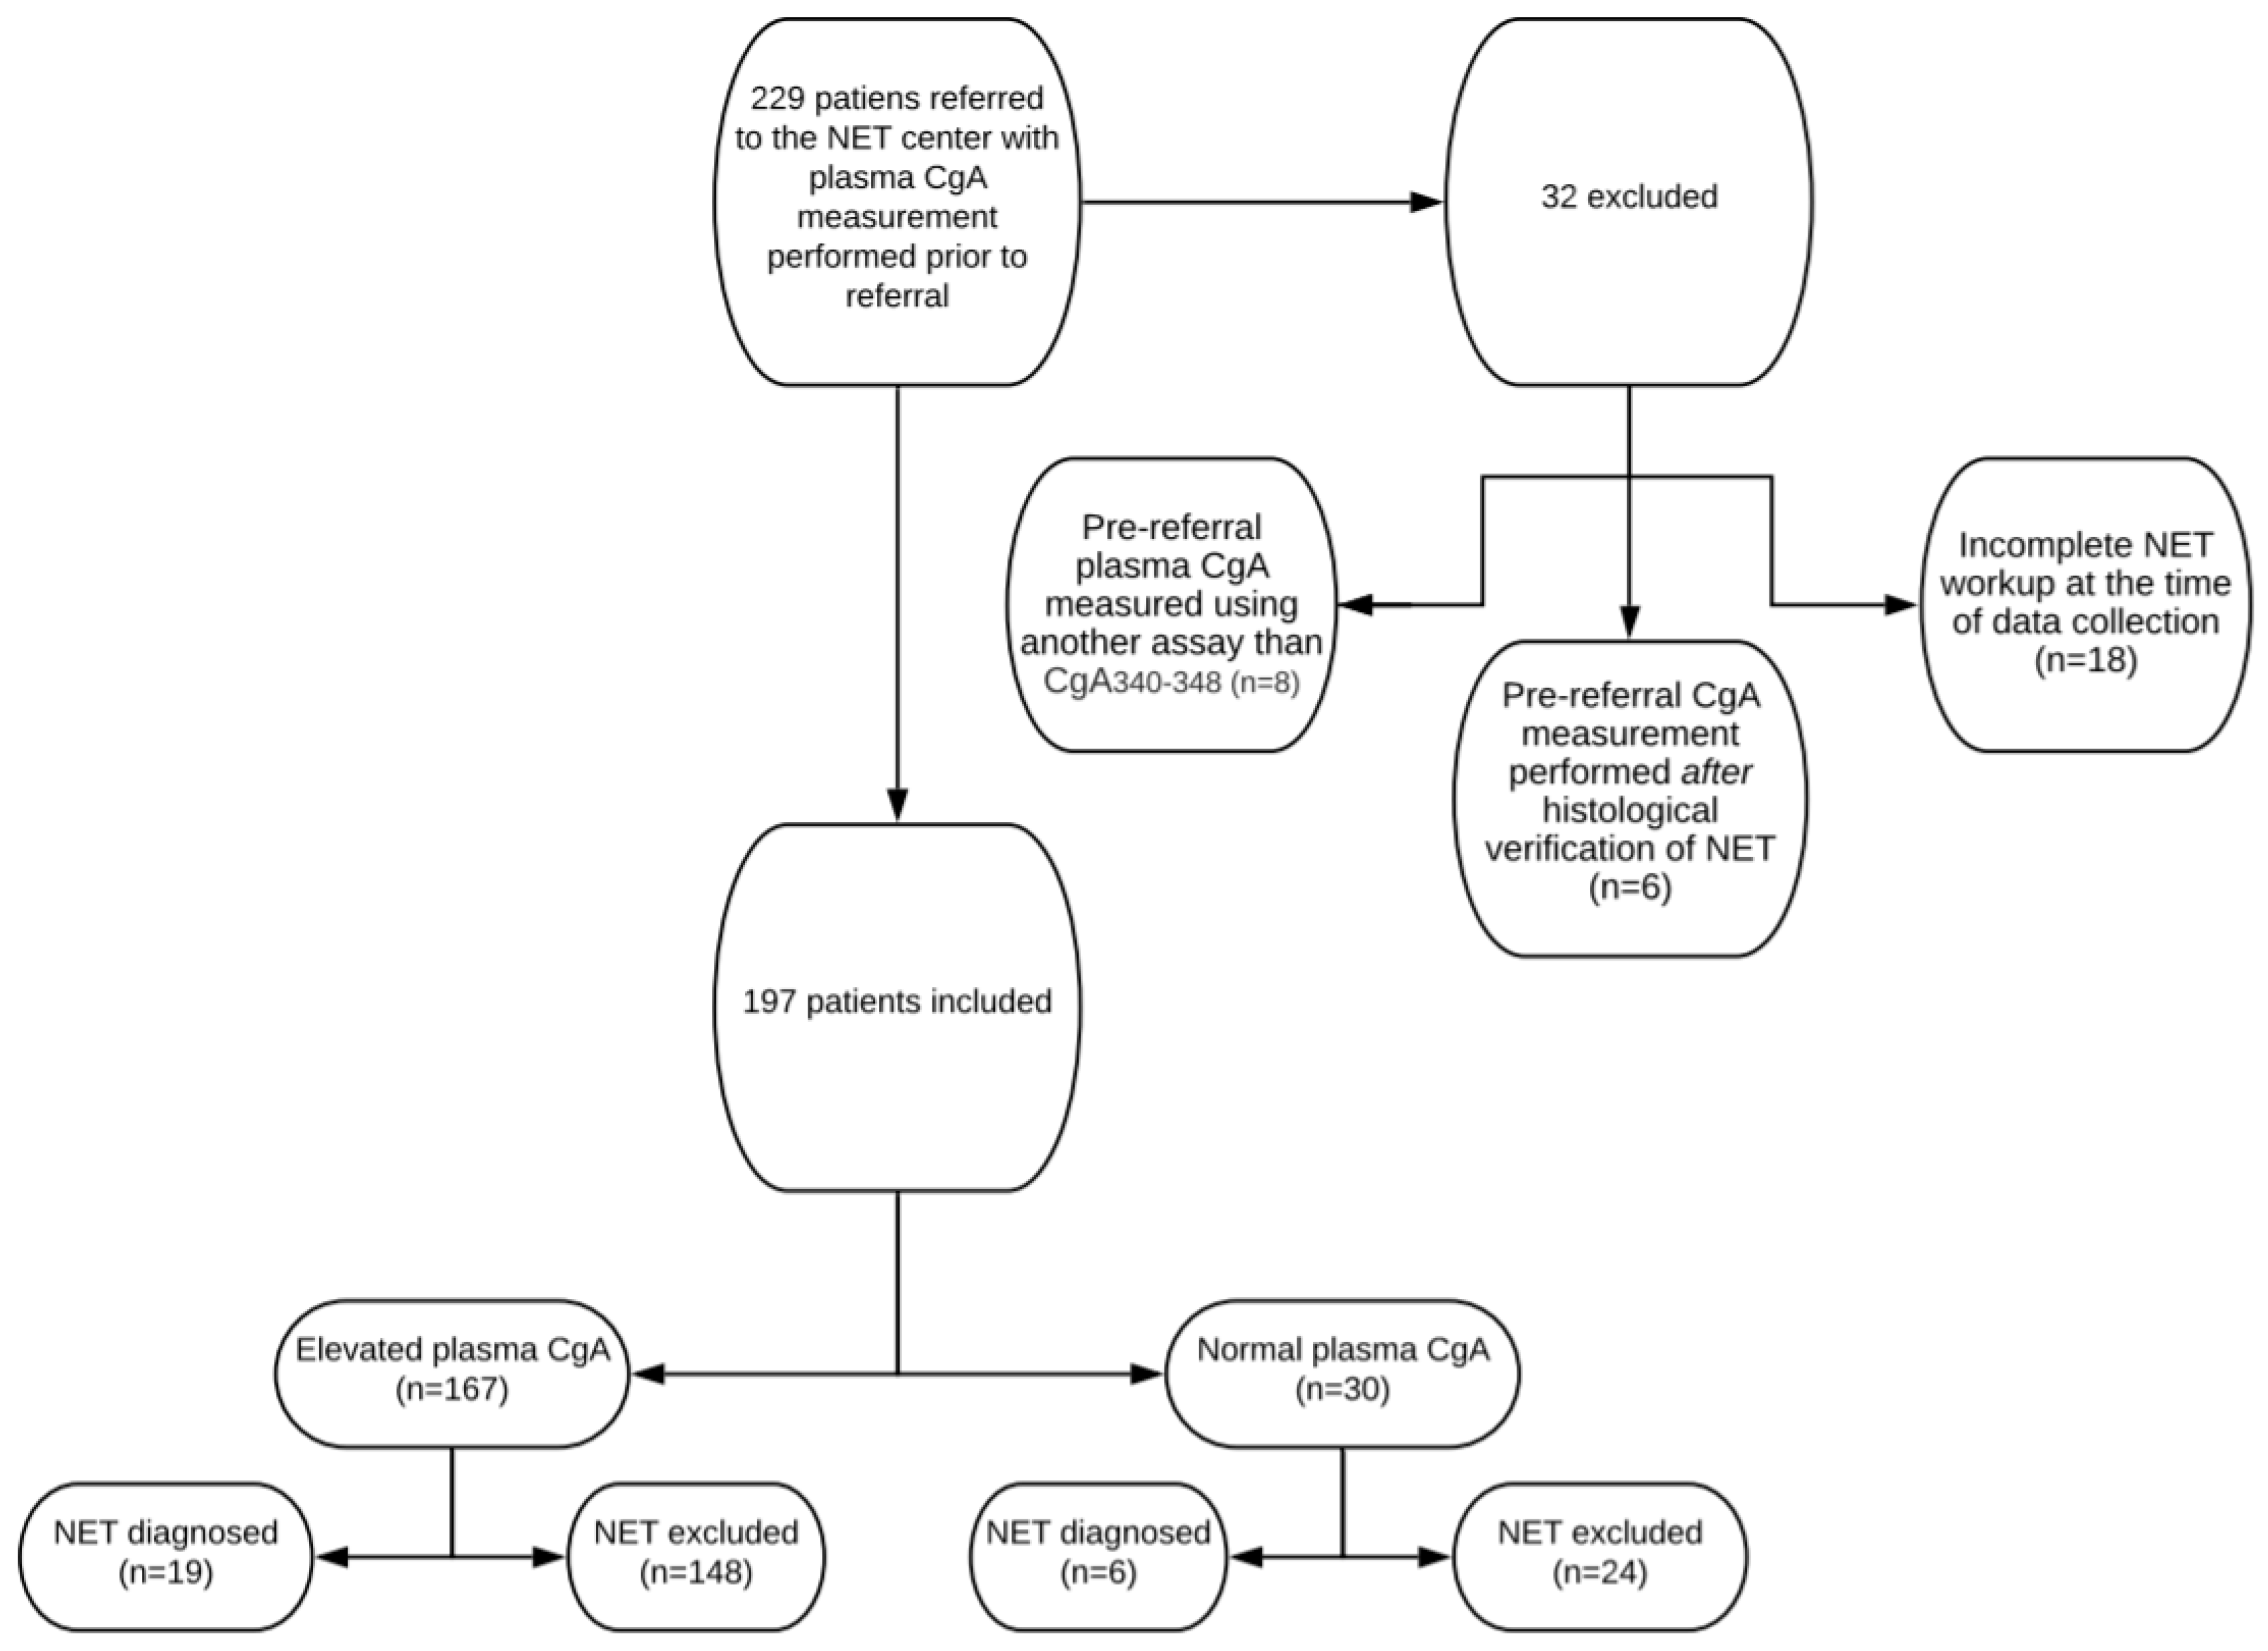
2.1. Patients
2.2. CgA340-348 Radioimmunassay
2.3. Processing-Independent Analysis of CgA
2.4. Definitions
2.5. Statistics
3. Results
3.1. Baseline Characteristics
3.2. Examinations Post-Referral
3.3. Positive Predictive Value Of Elevated CgA Prior to Referral
3.4. Causes of Elevated CgA Apart From NET
4. Discussion
Author Contributions
Funding
Conflicts of Interest
References
- Leoncini, E.; Boffetta, P.; Shafir, M.; Aleksovska, K.; Boccia, S.; Rindi, G. Increased incidence trend of low-grade and high-grade neuroendocrine neoplasms. Endocrine 2017, 58, 368–379. [Google Scholar] [CrossRef]
- Nagtegaal, I.D.; Odze, R.D.; Klimstra, D.; Paradis, V.; Rugge, M.; Schirmacher, P.; Washington, M.K.; Carneiro, F.; Cree, I.A.; The WHO Classification of Tumours Editorial Board. The 2019 WHO classification of tumours of the digestive system. Histopathology 2019, 76, 182–188. [Google Scholar] [CrossRef]
- Miettinen, M. Synaptophysin and neurofilament proteins as markers for neuroendocrine tumors. Arch. Pathol. Lab. Med. 1987, 111, 813–818. [Google Scholar]
- Parbhu, S.K.; Adler, D.G. Pancreatic neuroendocrine tumors: Contemporary diagnosis and management. Hosp. Pract. 2016, 44, 109–119. [Google Scholar] [CrossRef]
- Marotta, V.; Zatelli, M.C.; Sciammarella, C.; Ambrosio, M.R.; Bondanelli, M.; Colao, A.; Faggiano, A. Chromogranin A as circulating marker for diagnosis and management of neuroendocrine neoplasms: More flaws than fame. Endocr. Relat. Cancer 2018, 25, R11–R29. [Google Scholar] [CrossRef]
- Cives, M.; Strosberg, J. Gastroenteropancreatic Neuroendocrine Tumors. CA Cancer J. Clin. 2018, 68, 471–487. [Google Scholar] [CrossRef]
- Basuroy, R.; Bouvier, C.; Ramage, J. (John); Sissons, M.; Kent, A.; Srirajaskanthan, R. Presenting Symptoms and Delay in Diagnosis of Gastrointestinal and Pancreatic Neuroendocrine Tumours. Neuroendocrinology 2018, 107, 42–49. [Google Scholar] [CrossRef]
- Modlin, I.M.; Oberg, K.; Chung, D.C.; Jensen, R.T.; De Herder, W.W.; Thakker, R.V.; Caplin, M.; Fave, G.D.; Kaltsas, G.A.; Krenning, E.P.; et al. Gastroenteropancreatic neuroendocrine tumours. Lancet Oncol. 2008, 9, 61–72. [Google Scholar] [CrossRef]
- Guilmette, J.M.; Nosé, V. Neoplasms of the Neuroendocrine Pancreas. Adv. Anat. Pathol. 2019, 26, 13–30. [Google Scholar] [CrossRef]
- Mota, J.M.; Sousa, L.G.; Riechelmann, R.P. Complications from carcinoid syndrome: Review of the current evidence. Ecancermedicalscience 2016, 10, 662. [Google Scholar] [CrossRef]
- Fanciulli, G.; Nike, O.B.O.; Ruggeri, R.M.; Grossrubatscher, E.; Calzo, F.L.; Wood, T.D.; Faggiano, A.; Isidori, A.; Colao, A. Serotonin pathway in carcinoid syndrome: Clinical, diagnostic, prognostic and therapeutic implications. Rev. Endocr. Metab. Disord. 2020, 21, 599–612. [Google Scholar] [CrossRef]
- Konecki, D.S.; Benedum, U.M.; Gerdes, H.H.; Huttner, W.B. The primary structure of human chromogranin A and pancreastatin. J. Biol. Chem. 1987, 262, 17026–17030. [Google Scholar]
- Ardill, J.E.; O’Dorisio, T.M. Circulating Biomarkers in Neuroendocrine Tumors of the Enteropancreatic Tract: Application to Diagnosis, Monitoring Disease, and as Prognostic Indicators. Endocrinol. Metab. Clin. N. Am. 2010, 39, 777–790. [Google Scholar] [CrossRef]
- Børglum, T.; Rehfeld, J.F.; Drivsholm, L.B.; Hilsted, L. Processing-Independent Quantitation of Chromogranin A in Plasma from Patients with Neuroendocrine Tumors and Small-Cell Lung Carcinomas. Clin. Chem. 2007, 53, 438–446. [Google Scholar] [CrossRef][Green Version]
- Gut, P.; Czarnywojtek, A.; Fischbach, J.; Bączyk, M.; Ziemnicka, K.; Wrotkowska, E.; Gryczyńska, M.; Ruchała, M. Chromogranin A—unspecific neuroendocrine marker. Clinical utility and potential diagnostic pitfalls. Arch. Med. Sci. 2016, 1, 1–9. [Google Scholar] [CrossRef]
- Lyubimova, N.V.; Churikova, T.K.; Kushlinskii, N.E. Chromogranin As a Biochemical Marker of Neuroendocrine Tumors. Bull. Exp. Biol. Med. 2016, 160, 702–704. [Google Scholar] [CrossRef]
- Jilesen, A.P.J.; Busch, O. (Olivier); Van Gulik, T.M.; Gouma, D.J.; Van Dijkum, E.J.N. Standard Pre- and Postoperative Determination of Chromogranin A in Resectable Non-Functioning Pancreatic Neuroendocrine Tumors—Diagnostic Accuracy: NF-pNET and Low Tumor Burden. Dig. Surg. 2014, 31, 407–414. [Google Scholar] [CrossRef]
- Rehfeld, J.F.; Broedbaek, K.; Goetze, J.P.; Knigge, U.; Hilsted, L.M. True Chromogranin A concentrations in plasma from patients with small intestinal neuroendocrine tumours. Scand. J. Gastroenterol. 2020, 55, 565–573. [Google Scholar] [CrossRef]
- Rehfeld, J.; Goetze, J.F.R.A.J.P. The Posttranslational Phase of Gene Expression: New Possibilities in Molecular Diagnosis. Curr. Mol. Med. 2003, 3, 25–38. [Google Scholar] [CrossRef]
- Jensen, T.B.; Hilsted, L.; Rehfeld, J.F. Library of Sequence-specific Radioimmunoassays for Human Chromogranin A. Clin. Chem. 1999, 45, 549–560. [Google Scholar] [CrossRef]
- Knigge, U.; Capdevila, J.; Bartsch, D.K.; Baudin, E.; Falkerby, J.; Kianmanesh, R.; Kos-Kudla, B.; Niederle, B.; Van Dijkum, E.N.; O’Toole, D.; et al. ENETS Consensus Recommendations for the Standards of Care in Neuroendocrine Neoplasms: Follow-Up and Documentation. Neuroendocrinology 2017, 105, 310–319. [Google Scholar] [CrossRef]
- Fuksiewicz, M.; Kowalska, M.; Kolasińska-Ćwikła, A.; Ćwikła, J.B.; Sawicki, Ł.; Roszkowska-Purska, K.; Drygiel, J.; Kotowicz, B. Prognostic value of chromogranin A in patients with GET/NEN in the pancreas and the small intestine. Endocr. Connect. 2018, 7, 803–810. [Google Scholar] [CrossRef]
- Dam, G.; Grønbæk, H.; Sorbye, H.; Evensen, E.T.; Paulsson, B.; Sundin, A.; Jensen, C.; Ebbesen, D.; Knigge, U.; Janson, E.T. Prospective Study of Chromogranin A as a Predictor of Progression in Patients with Pancreatic, Small-Intestinal, and Unknown Primary Neuroendocrine Tumors. Neuroendocrinology 2019, 110, 217–224. [Google Scholar] [CrossRef]
- Niederle, B.; Pape, U.-F.; Costa, F.; Gross, D.; Kelestimur, F.; Knigge, U.; Öberg, K.; Pavel, M.; Perren, A.; Toumpanakis, C.; et al. ENETS Consensus Guidelines Update for Neuroendocrine Neoplasms of the Jejunum and Ileum. Neuroendocrinology 2016, 103, 125–138. [Google Scholar] [CrossRef]
- Janson, E.T.; Sorbye, H.; Welin, S.; Federspiel, B.; Gronbaek, H.; Hellman, P.; Ladekarl, M.; Langer, S.W.; Mortensen, J.; Schalin-Jäntti, C.; et al. Nordic guidelines 2014 for diagnosis and treatment of gastroenteropancreatic neuroendocrine neoplasms. Acta Oncol. 2014, 53, 1284–1297. [Google Scholar] [CrossRef]
- González-Flores, E.; Serrano, R.; Sevilla, I.; Viúdez, A.; Barriuso, J.; Benavent, M.; Capdevila, J.; Jimenez-Fonseca, P.; López, C.; Garcia-Carbonero, R. SEOM clinical guidelines for the diagnosis and treatment of gastroenteropancreatic and bronchial neuroendocrine neoplasms (NENs) (2018). Clin. Transl. Oncol. 2018, 21, 55–63. [Google Scholar] [CrossRef]
- Bardram, L.; Rehfeld, J.F. Processing-independent radioimmunoanalysis: A general analytical principle applied to progastrin and its products. Anal. Biochem. 1988, 175, 537–543. [Google Scholar] [CrossRef]
- Tramonti, G.; Ferdeghini, M.; Annichiarico, C.; Norpoth, M.; Donadio, C.; Bianchi, R.; Bianchi, C. Relationship between renal function and blood level of chromogranin A. Ren. Fail. 2001, 23, 449–457. [Google Scholar] [CrossRef]
- Johnbeck, C.B.; Knigge, U.; Loft, A.; Berthelsen, A.K.; Mortensen, J.; Oturai, P.; Langer, S.W.; Elema, D.R.; Kjaer, A. Head-to-Head Comparison of 64 Cu-DOTATATE and 68 Ga-DOTATOC PET/CT: A Prospective Study of 59 Patients with Neuroendocrine Tumors. J. Nucl. Med. 2016, 58, 451–457. [Google Scholar] [CrossRef]
- Nehar, D.; Lombard-Bohas, C.; Olivieri, S.; Claustrat, B.; Chayvialle, J.-A.; Penes, M.-C.; Sassolas, G.; Borson-Chazot, F. Interest of Chromogranin A for diagnosis and follow-up of endocrine tumours. Clin. Endocrinol. 2004, 60, 644–652. [Google Scholar] [CrossRef]
- Nikou, G.C.; Marinou, K.; Thomakos, P.; Papageorgiou, D.; Sanzanidis, V.; Nikolaou, P.; Kosmidis, C.; Moulakakis, A.; Mallas, E. Chromogranin A Levels in Diagnosis, Treatment and Follow-Up of 42 Patients with Non-Functioning Pancreatic Endocrine Tumours. Pancreatology 2008, 8, 510–519. [Google Scholar] [CrossRef]
- Waldum, H.L.; Sørdal, Ø.F.; Mjønes, P.G. The Enterochromaffin-like [ECL] Cell—Central in Gastric Physiology and Pathology. Int. J. Mol. Sci. 2019, 20, 2444. [Google Scholar] [CrossRef]
- Bektas, M.; Saraç, N.; Cetinkaya, H.; Törüner, M.; Erdemli, E.; Keskin, O.; Soykan, I.; Oktay, E.I.; Korkut, E.; Ustün, Y.; et al. Effects of Helicobacter pylori infection and long-term proton pump inhibitor use on enterochromaffin-like cells. Ann. Gastroenterol. 2012, 25, 123–127. [Google Scholar]
- Lundell, L.; Vieth, M.; Gibson, F.; Nagy, P.; Kahrilas, P.J. Systematic review: The effects of long-term proton pump inhibitor use on serum gastrin levels and gastric histology. Aliment. Pharmacol. Ther. 2015, 42, 649–663. [Google Scholar] [CrossRef]
- Korse, C.M.; Muller, M.; Taal, B.G. Discontinuation of proton pump inhibitors during assessment of chromogranin A levels in patients with neuroendocrine tumours. Br. J. Cancer 2011, 105, 1173–1175. [Google Scholar] [CrossRef][Green Version]
- Lanzon-Miller, S.; Pounder, R.E.; Hamilton, M.R.; Ball, S.; Chronos, N.A.F.; Raymond, F.; Olausson, M.; Cederberg, C. Twenty-four-hour intragastric acidity and plasma gastrin concentration before and during treatment with either ranitidine or omeprazole. Aliment. Pharmacol. Ther. 2007, 1, 239–251. [Google Scholar] [CrossRef]
- Braga, F.; Ferraro, S.; Mozzi, R.; Dolci, A.; Panteghini, M. Biological variation of neuroendocrine tumor markers chromogranin A and neuron-specific enolase. Clin. Biochem. 2013, 46, 148–151. [Google Scholar] [CrossRef]
- Dittadi, R.; Meo, S.; Gion, M. Italian Committee for the Quality Control in the Oncology L, Italian Network for Quality Assessment of Tumor B. Biological variation of plasma chromogranin A. Clin. Chem. Lab. Med. 2004, 42, 109–110. [Google Scholar]
- Modlin, I.M.; Kidd, M.; Malczewska, A.; Drozdov, I.; Bodei, L.; Matar, S.; Chung, K.-Y. The NETest: The Clinical Utility of Multigene Blood Analysis in the Diagnosis and Management of Neuroendocrine Tumors. Endocrinol. Metab. Clin. N. Am. 2018, 47, 485–504. [Google Scholar] [CrossRef]
- Basuroy, R.; Bouvier, C.; Ramage, J.K.; Sissons, M.; Srirajaskanthan, R. Delays and routes to diagnosis of neuroendocrine tumours. BMC Cancer 2018, 18, 1122. [Google Scholar] [CrossRef]
- Zhang, P.; Yu, J.; Li, J.; Shen, L.; Li, N.; Zhu, H.; Zhai, S.; Zhang, Y.; Yang, Z.; Lu, M. Clinical and Prognostic Value of PET/CT Imaging with Combination of 68Ga-DOTATATE and 18F-FDG in Gastroenteropancreatic Neuroendocrine Neoplasms. Contrast Media Mol. Imaging 2018, 2018, 2340389. [Google Scholar] [CrossRef]


| Total | Normal CgA | [CgA] 1–2 × URL | [CgA] 2–4 × URL | [CgA] 4–8 × URL | [CgA]>8 × URL | ||
|---|---|---|---|---|---|---|---|
| Patients included, n (%) | 197 | 30 (15%) | 91 (46%) | 41 (20%) | 20 (10%) | 15 (8%). | |
| Female, n (%) | 132 (67%) | 17 | 63 | 29 | 12 | 9 | |
| Age, years, median (IQR) | 60 (49–70) | 59 (45–70) | 56 (42–69) | 63 (56–69) | 61 (50–69) | 71 (64–75) | |
| PPI-treated, n (%) | 61 (31%) | 3 | 23 | 22 | 7 | 6 | |
| NET at referral, n | 7 | 1 | 2 | 0 | 2 | 2 | |
| Referred for NET workup, n | 190 | 29 | 89 | 41 | 18 | 13 | |
| Main Indication for CgA measurement | GI symptoms, n | 65 (33%) | 4 (13%) | 33 (36%) | 18 (44%) | 5 (25%) | 5 (33%) |
| Attack-Like Phenomena, n | 41 (20%) | 5 (17%) | 22 (24%) | 8 (7%) | 3 (15%) | 2 (13%) | |
| Examination suggestive of NET, n | 36 (18%) | 17 (57%) | 10 (11%) | 2 (5%) | 4 (20%) | 4 (27%) | |
| Flushing, n | 34 (17%) | 4 (13%) | 17 (19%) | 7 (17%) | 3 (15%) | 3 (20%) | |
| Unspecific symptoms, n | 14 (7%) | 0 | 8 (9%) | 3 (7%) | 2 (10%) | 1 (7%) | |
| Coincidental, n | 7 (4%) | 0 | 1 (1%) | 3 (7%) | 3 (15%) | 0 | |
| Pre- and Post-Referral Imaging | ||||||||
|---|---|---|---|---|---|---|---|---|
| CT Thorax and Abdomen | CT Abdomen | 18F-FDG-PET/CT | MRI Abdomen | Transabdominal Ultrasound | 64CuDotatate or 68GaDotatoc PET/CT | CT Thorax | 131I-Meta-Iodbenzylguanidine (MIBG) Scintigraphy | |
| Pre-referral | 54 | 31 | 27 | 10 | 9 | 6 | 3 | 0 |
| Post-referral | 1 | 4 | 8 | 10 | 1 | 146 | 0 | 1 |
| Pre-and post-referral endoscopic examinations | ||||||||
| Colonoscopy | Gastroscopy | Capsule Endoscopy | Endoscopic Ultrasound | |||||
| Pre-referral | 33 | 27 | 12 | 1 | ||||
| Post-referral | 0 | 6 | 0 | 0 | ||||
| Total | Localized | Lymph Node Metastases | Distant Metastases | |
|---|---|---|---|---|
| Total (normal CgA) | 25 (6) | 10 (5) | 5 (1) | 10 (0) |
| Small intestine (normal CgA) | 16 (2) | 2 (1) | 4 (1) | 10 (0) |
| Pancreas (normal CgA) | 6 (4) | 5 (4) | 1 (0) | 0 |
| Adrenals (normal CgA) | 2 (0) | 2 (0) | 0 | 0 |
| Stomach (normal CgA) | 1 (0) | 1 (0) | 0 | 0 |
| Total | 1–2 × URL | 2–4 × URL | 4–8 × URL | >8 × URL | |
|---|---|---|---|---|---|
| All elevated CgA plasma concentrations (true elevated) and PPV, % | 167 (19) 11% | 91 (5) 5% | 41 (2) 5% | 20 (6) 30% | 15 (6) 40% |
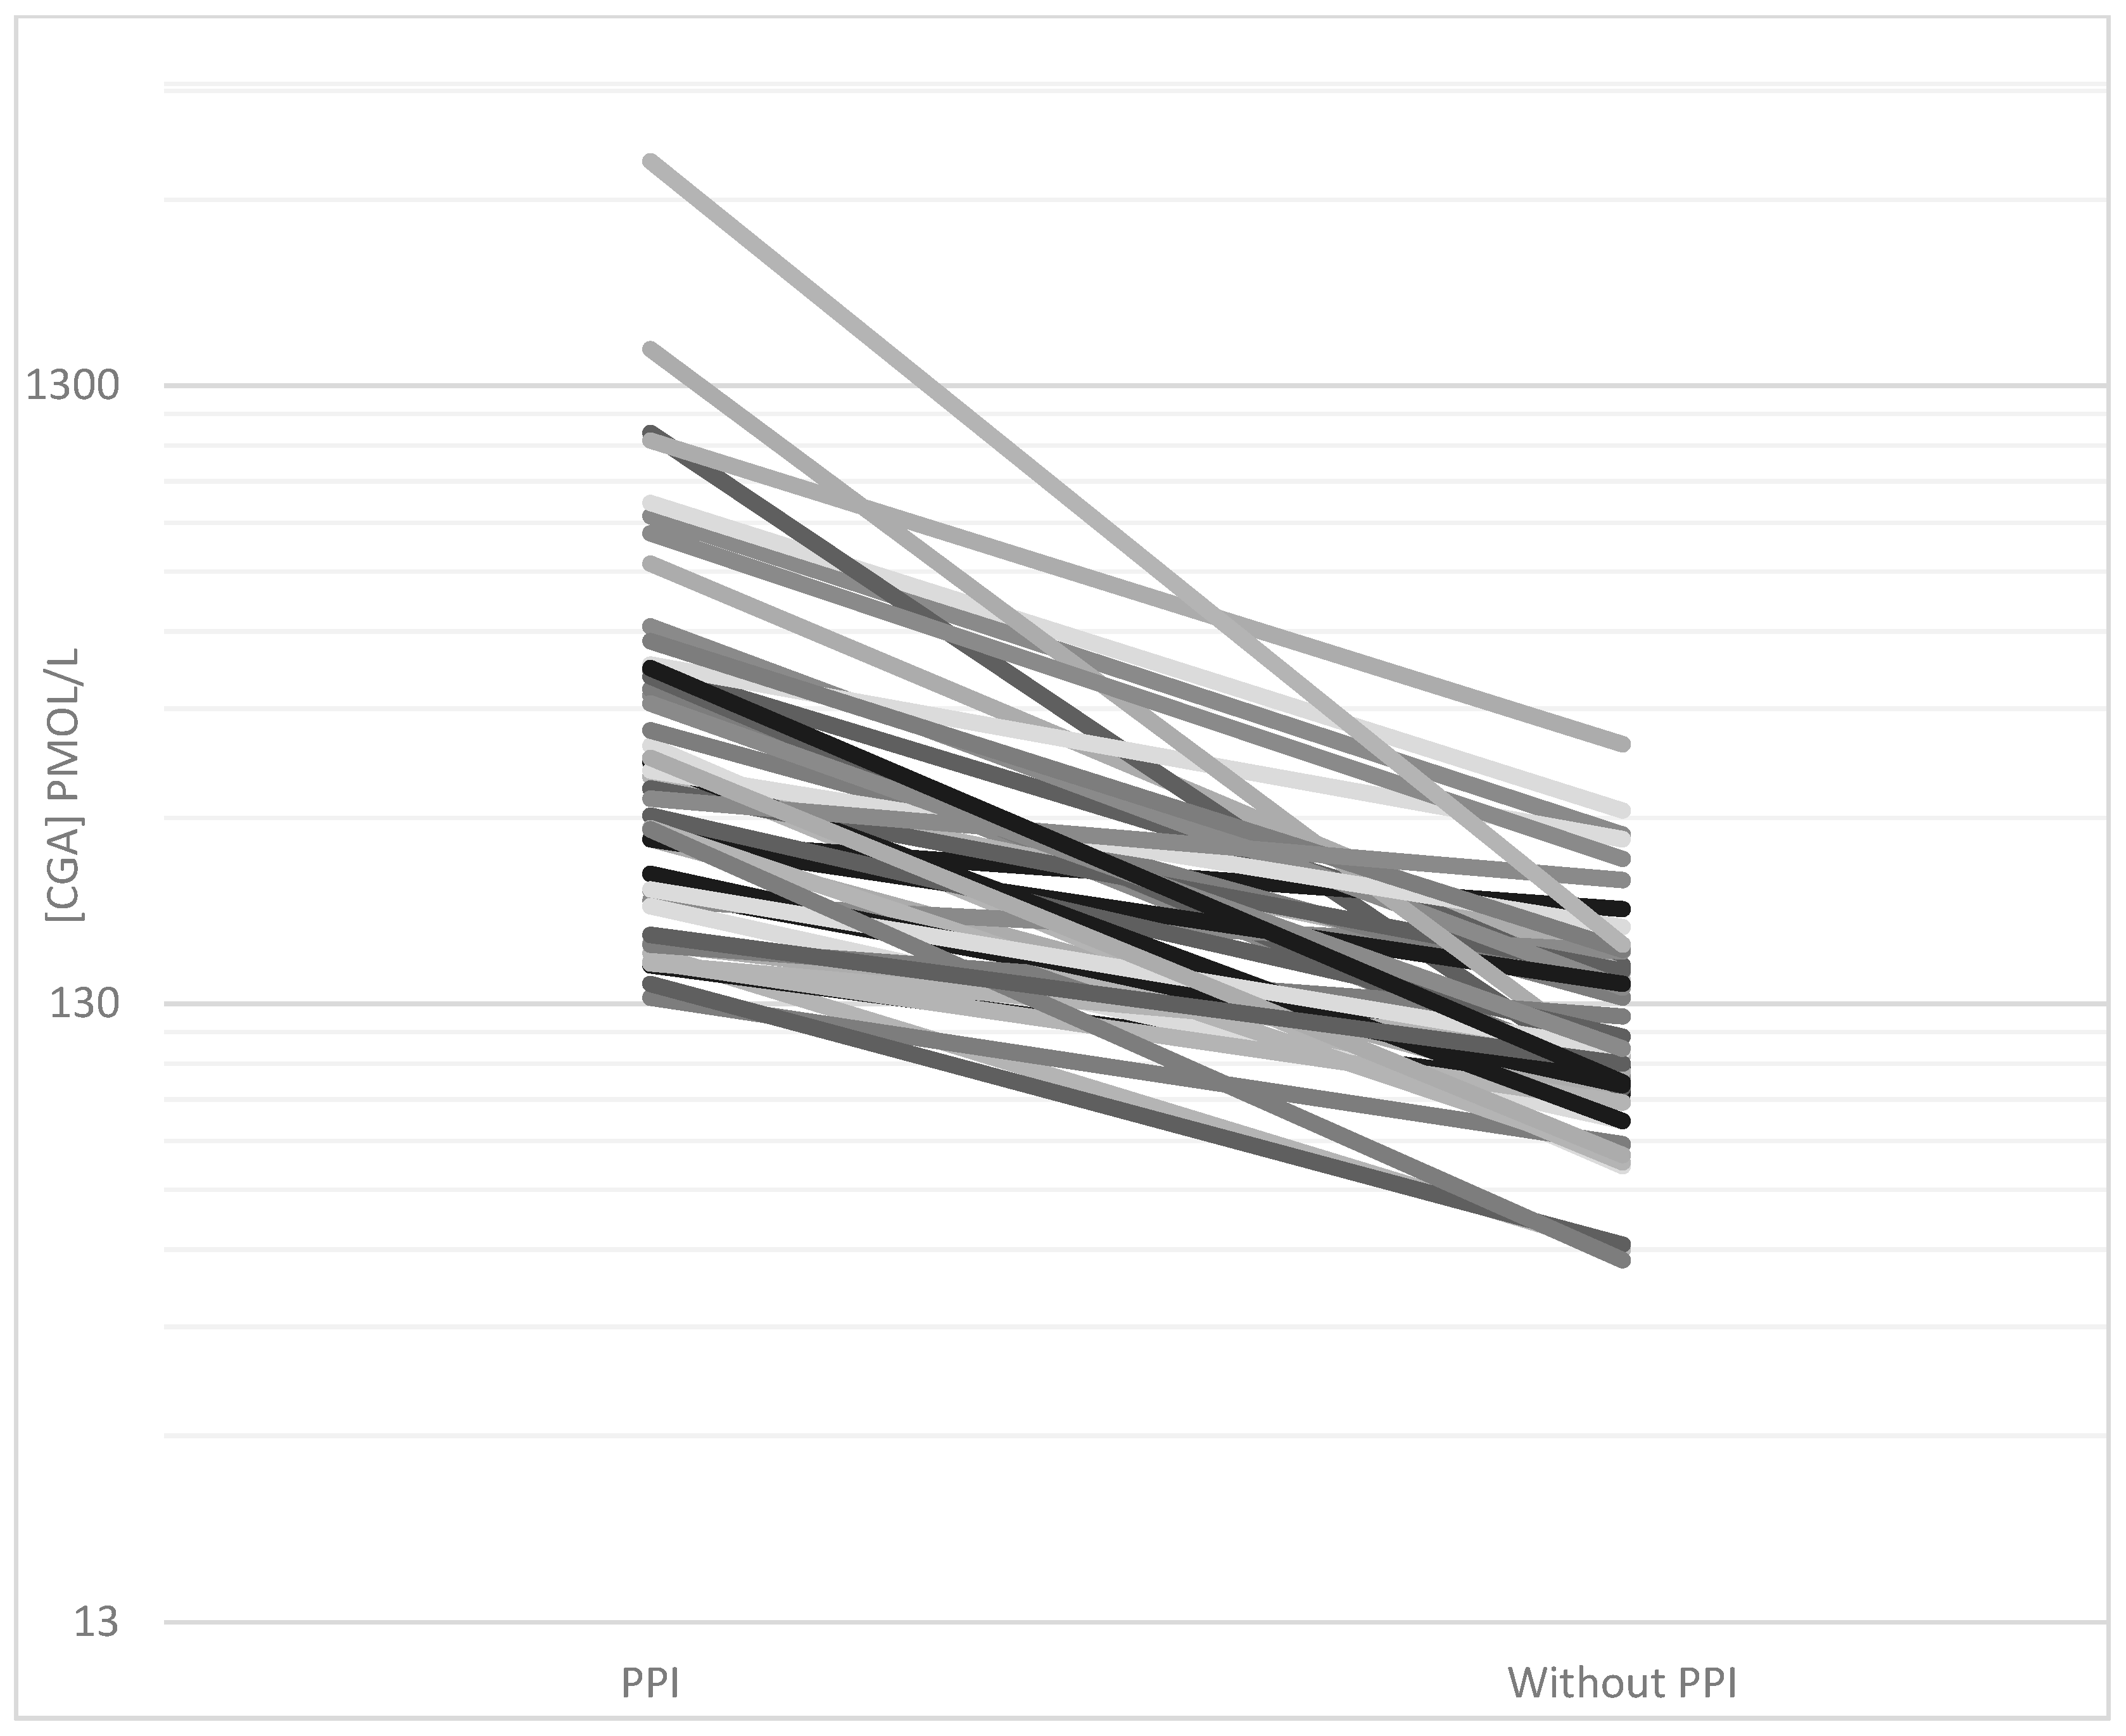
| Elevated CgA without PPI (true elevated) and PPV, % | 109 (16) 15% | 68 (4) 6% | 19 (2) 11% | 13 (4) 31% | 9 (6) 67% |
| Elevated CgA with PPI (true elevated) and PPV, % | 61 (3) 5% | 23 (1) 4% | 22 (0) 0% | 7 (2) 29% | 6 (0) 0% |
| Indication for CgA, n | NET Diagnosed, n (%) | NET Type, Location, Extent of Disease and CgA Level | |
|---|---|---|---|
| GI symptoms | 65 | 2 (3%) | Small intestine NET, distant metastases, elevated CgA (n = 1) |
| ECL’oma, stomach, localized, elevated CgA (n = 1) | |||
| Attack-like phenomena | 41 | 3 (7%) | Pheochromocytoma, localized, elevated CgA (n = 1) |
| Insulinoma, localized, normal CgA (n = 1) | |||
| Insulinoma, localized, elevated CgA (n = 1) | |||
| Examination suggestive of NET | 36 | 16 (44%) | Small intestine NET, localized, normal CgA (n = 1) |
| Small intestine NET, localized, elevated CgA (n = 1) | |||
| Small intestine NET, lymph node metastases, normal CgA (n = 1) | |||
| Small intestine NET, lymph node metastases, elevated CgA (n = 3) | |||
| Small intestine NET, distant metastases, elevated CgA (n = 6) | |||
| Pancreas NET, localized, normal CgA (n = 3) | |||
| Pancreas NET, lymph node metastases, elevated CgA (n = 1) | |||
| Flushing | 34 | 4 (12%) | Pheochromocytoma, localized, elevated CgA (n = 1) |
| Small intestine NET, distant metastases, elevated CgA (n = 3) | |||
| Unspecific symptoms | 14 | 0 | |
| Coincidental | 7 | 0 |
Publisher’s Note: MDPI stays neutral with regard to jurisdictional claims in published maps and institutional affiliations. |
© 2020 by the authors. Licensee MDPI, Basel, Switzerland. This article is an open access article distributed under the terms and conditions of the Creative Commons Attribution (CC BY) license (http://creativecommons.org/licenses/by/4.0/).
Share and Cite
Baekdal, J.; Krogh, J.; Klose, M.; Holmager, P.; Langer, S.W.; Oturai, P.; Kjaer, A.; Federspiel, B.; Hilsted, L.; Rehfeld, J.F.; et al. Limited Diagnostic Utility of Chromogranin A Measurements in Workup of Neuroendocrine Tumors. Diagnostics 2020, 10, 881. https://doi.org/10.3390/diagnostics10110881
Baekdal J, Krogh J, Klose M, Holmager P, Langer SW, Oturai P, Kjaer A, Federspiel B, Hilsted L, Rehfeld JF, et al. Limited Diagnostic Utility of Chromogranin A Measurements in Workup of Neuroendocrine Tumors. Diagnostics. 2020; 10(11):881. https://doi.org/10.3390/diagnostics10110881
Chicago/Turabian StyleBaekdal, Jonas, Jesper Krogh, Marianne Klose, Pernille Holmager, Seppo W. Langer, Peter Oturai, Andreas Kjaer, Birgitte Federspiel, Linda Hilsted, Jens F. Rehfeld, and et al. 2020. "Limited Diagnostic Utility of Chromogranin A Measurements in Workup of Neuroendocrine Tumors" Diagnostics 10, no. 11: 881. https://doi.org/10.3390/diagnostics10110881
APA StyleBaekdal, J., Krogh, J., Klose, M., Holmager, P., Langer, S. W., Oturai, P., Kjaer, A., Federspiel, B., Hilsted, L., Rehfeld, J. F., Knigge, U., & Andreassen, M. (2020). Limited Diagnostic Utility of Chromogranin A Measurements in Workup of Neuroendocrine Tumors. Diagnostics, 10(11), 881. https://doi.org/10.3390/diagnostics10110881