
The Effects of Temperature and Growth Phase on the Lipidomes of Sulfolobus islandicus and Sulfolobus tokodaii

Abstract
:1. Introduction

2. Materials and Methods
2.1. Chemicals
2.2. Cell Culture
2.3. Lipid Extraction
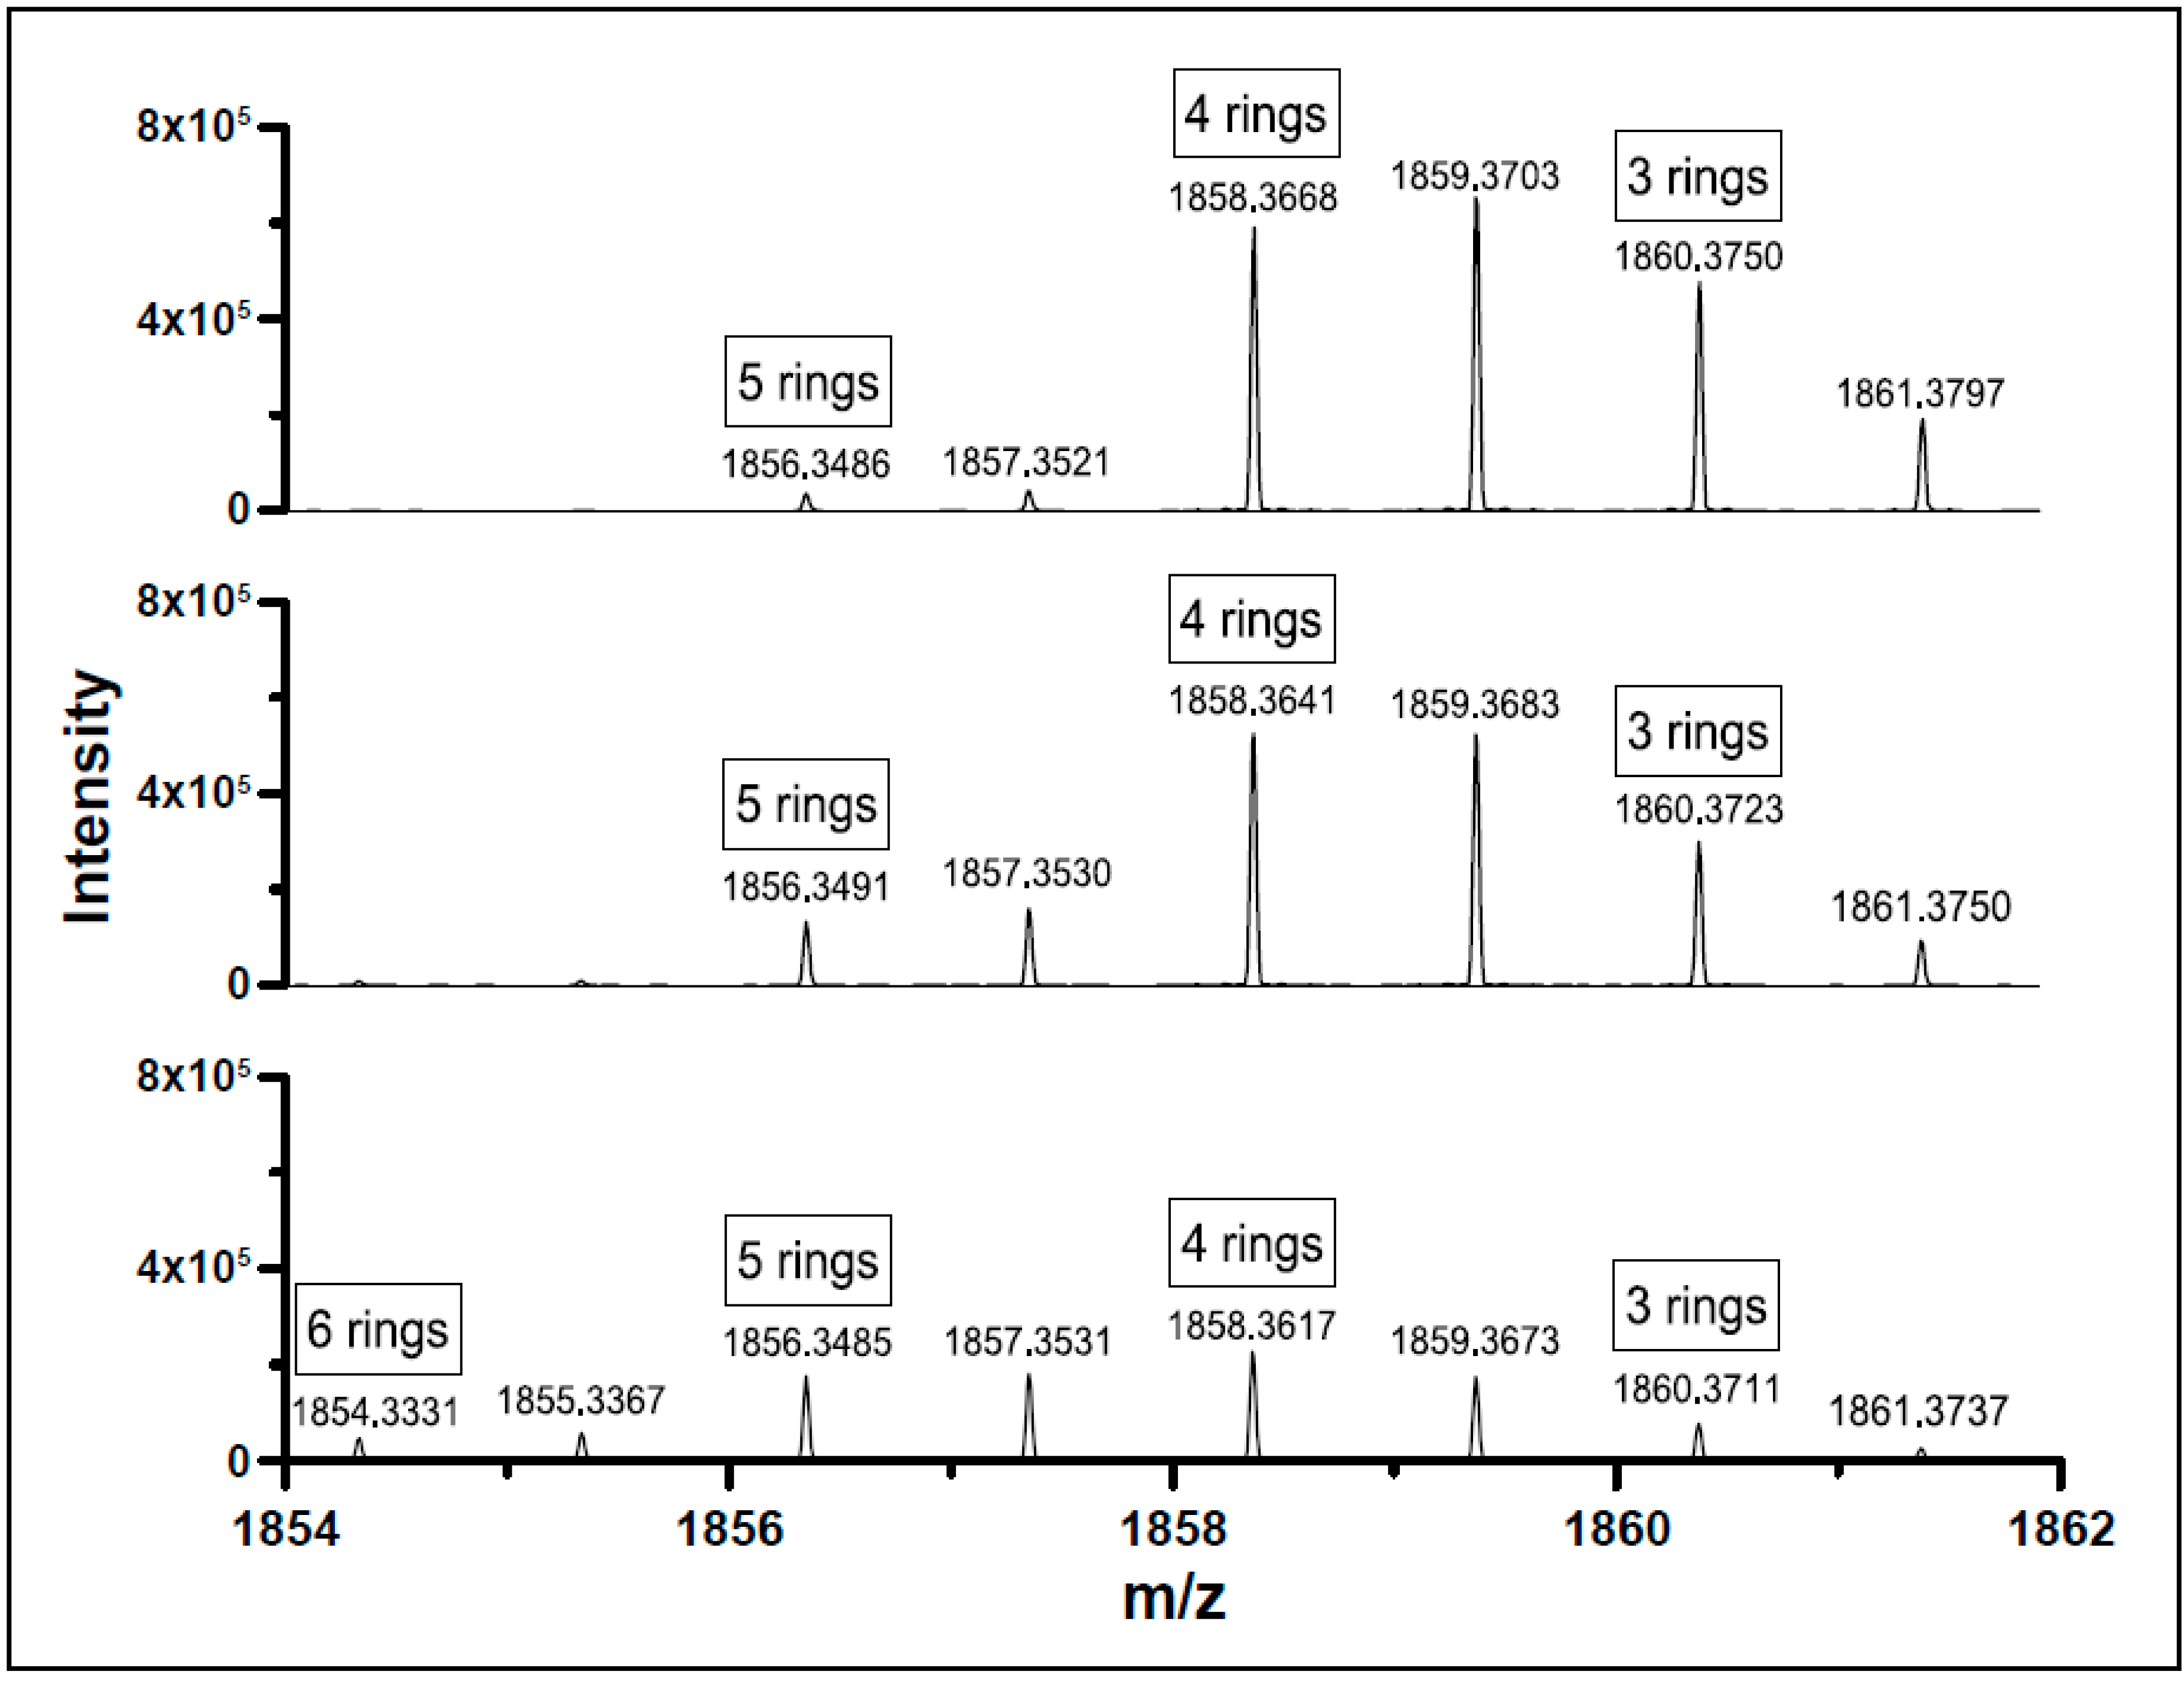
2.4. Structural Analysis by Hybrid Ion-Trap Orbitrap Mass Spectrometry
2.5. Data Analysis
2.6. Isotope Correction
2.7. Statistical Analysis
3. Results
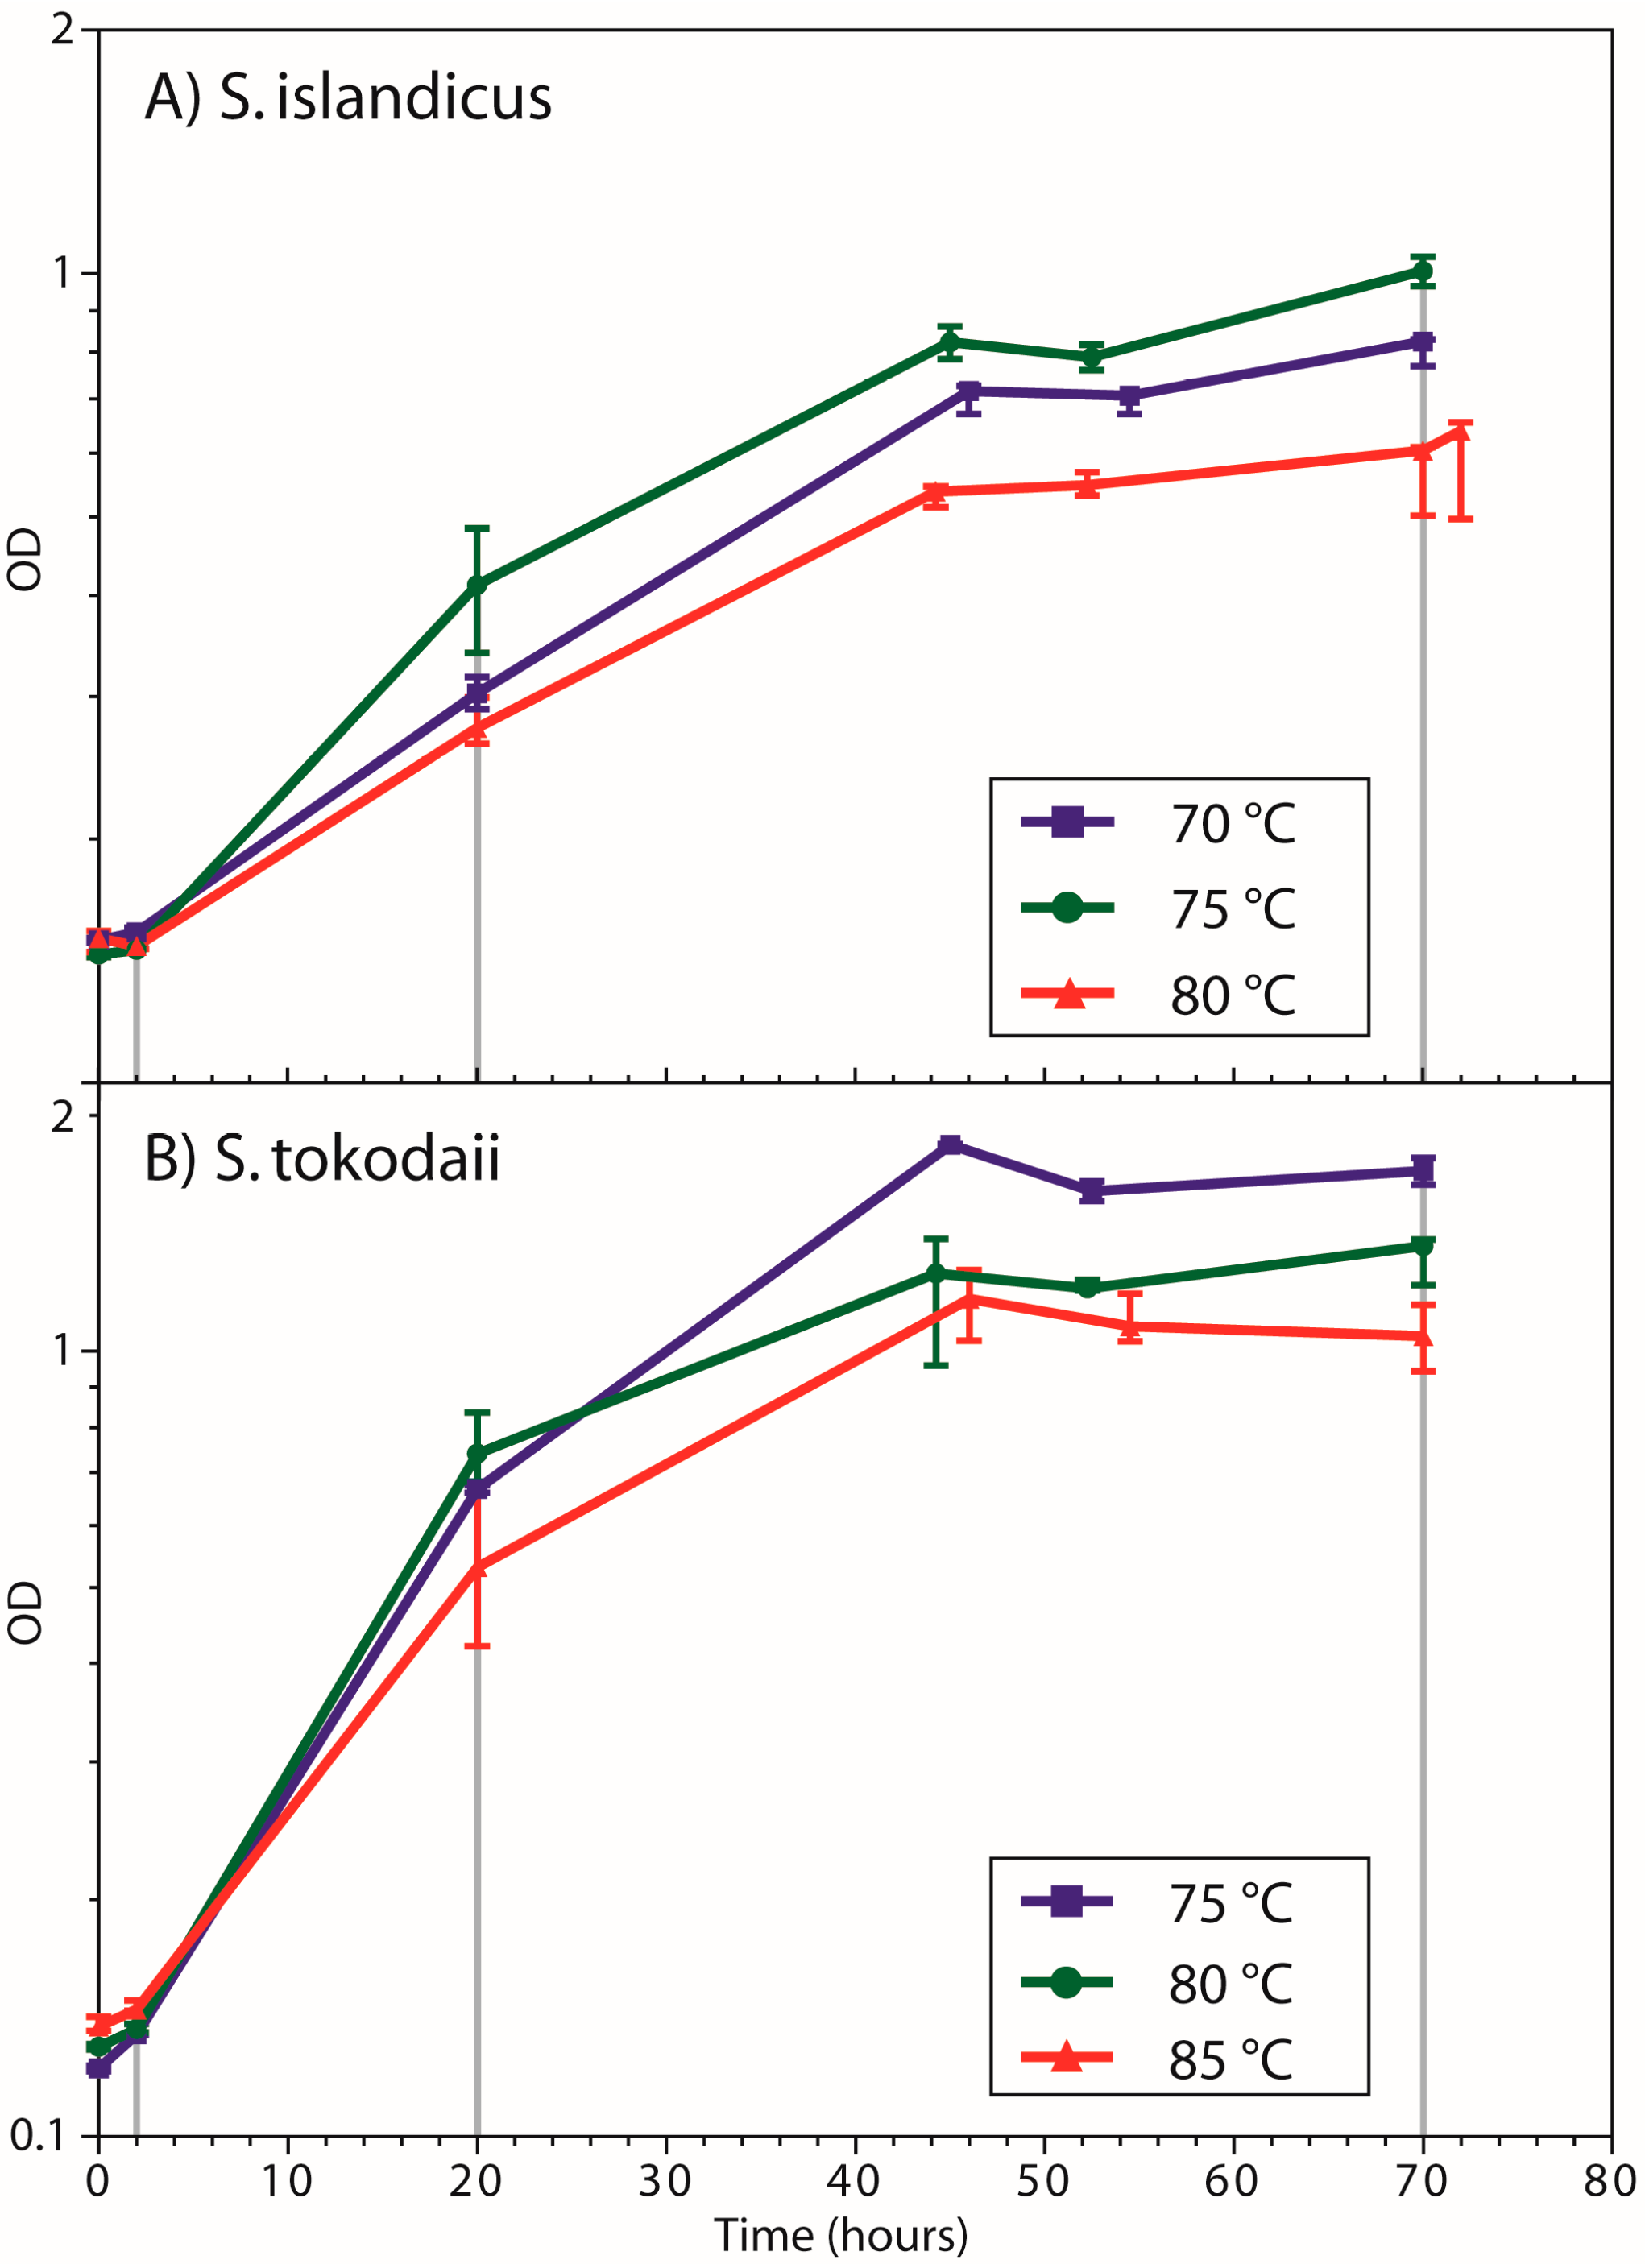
3.1. Growth Curves
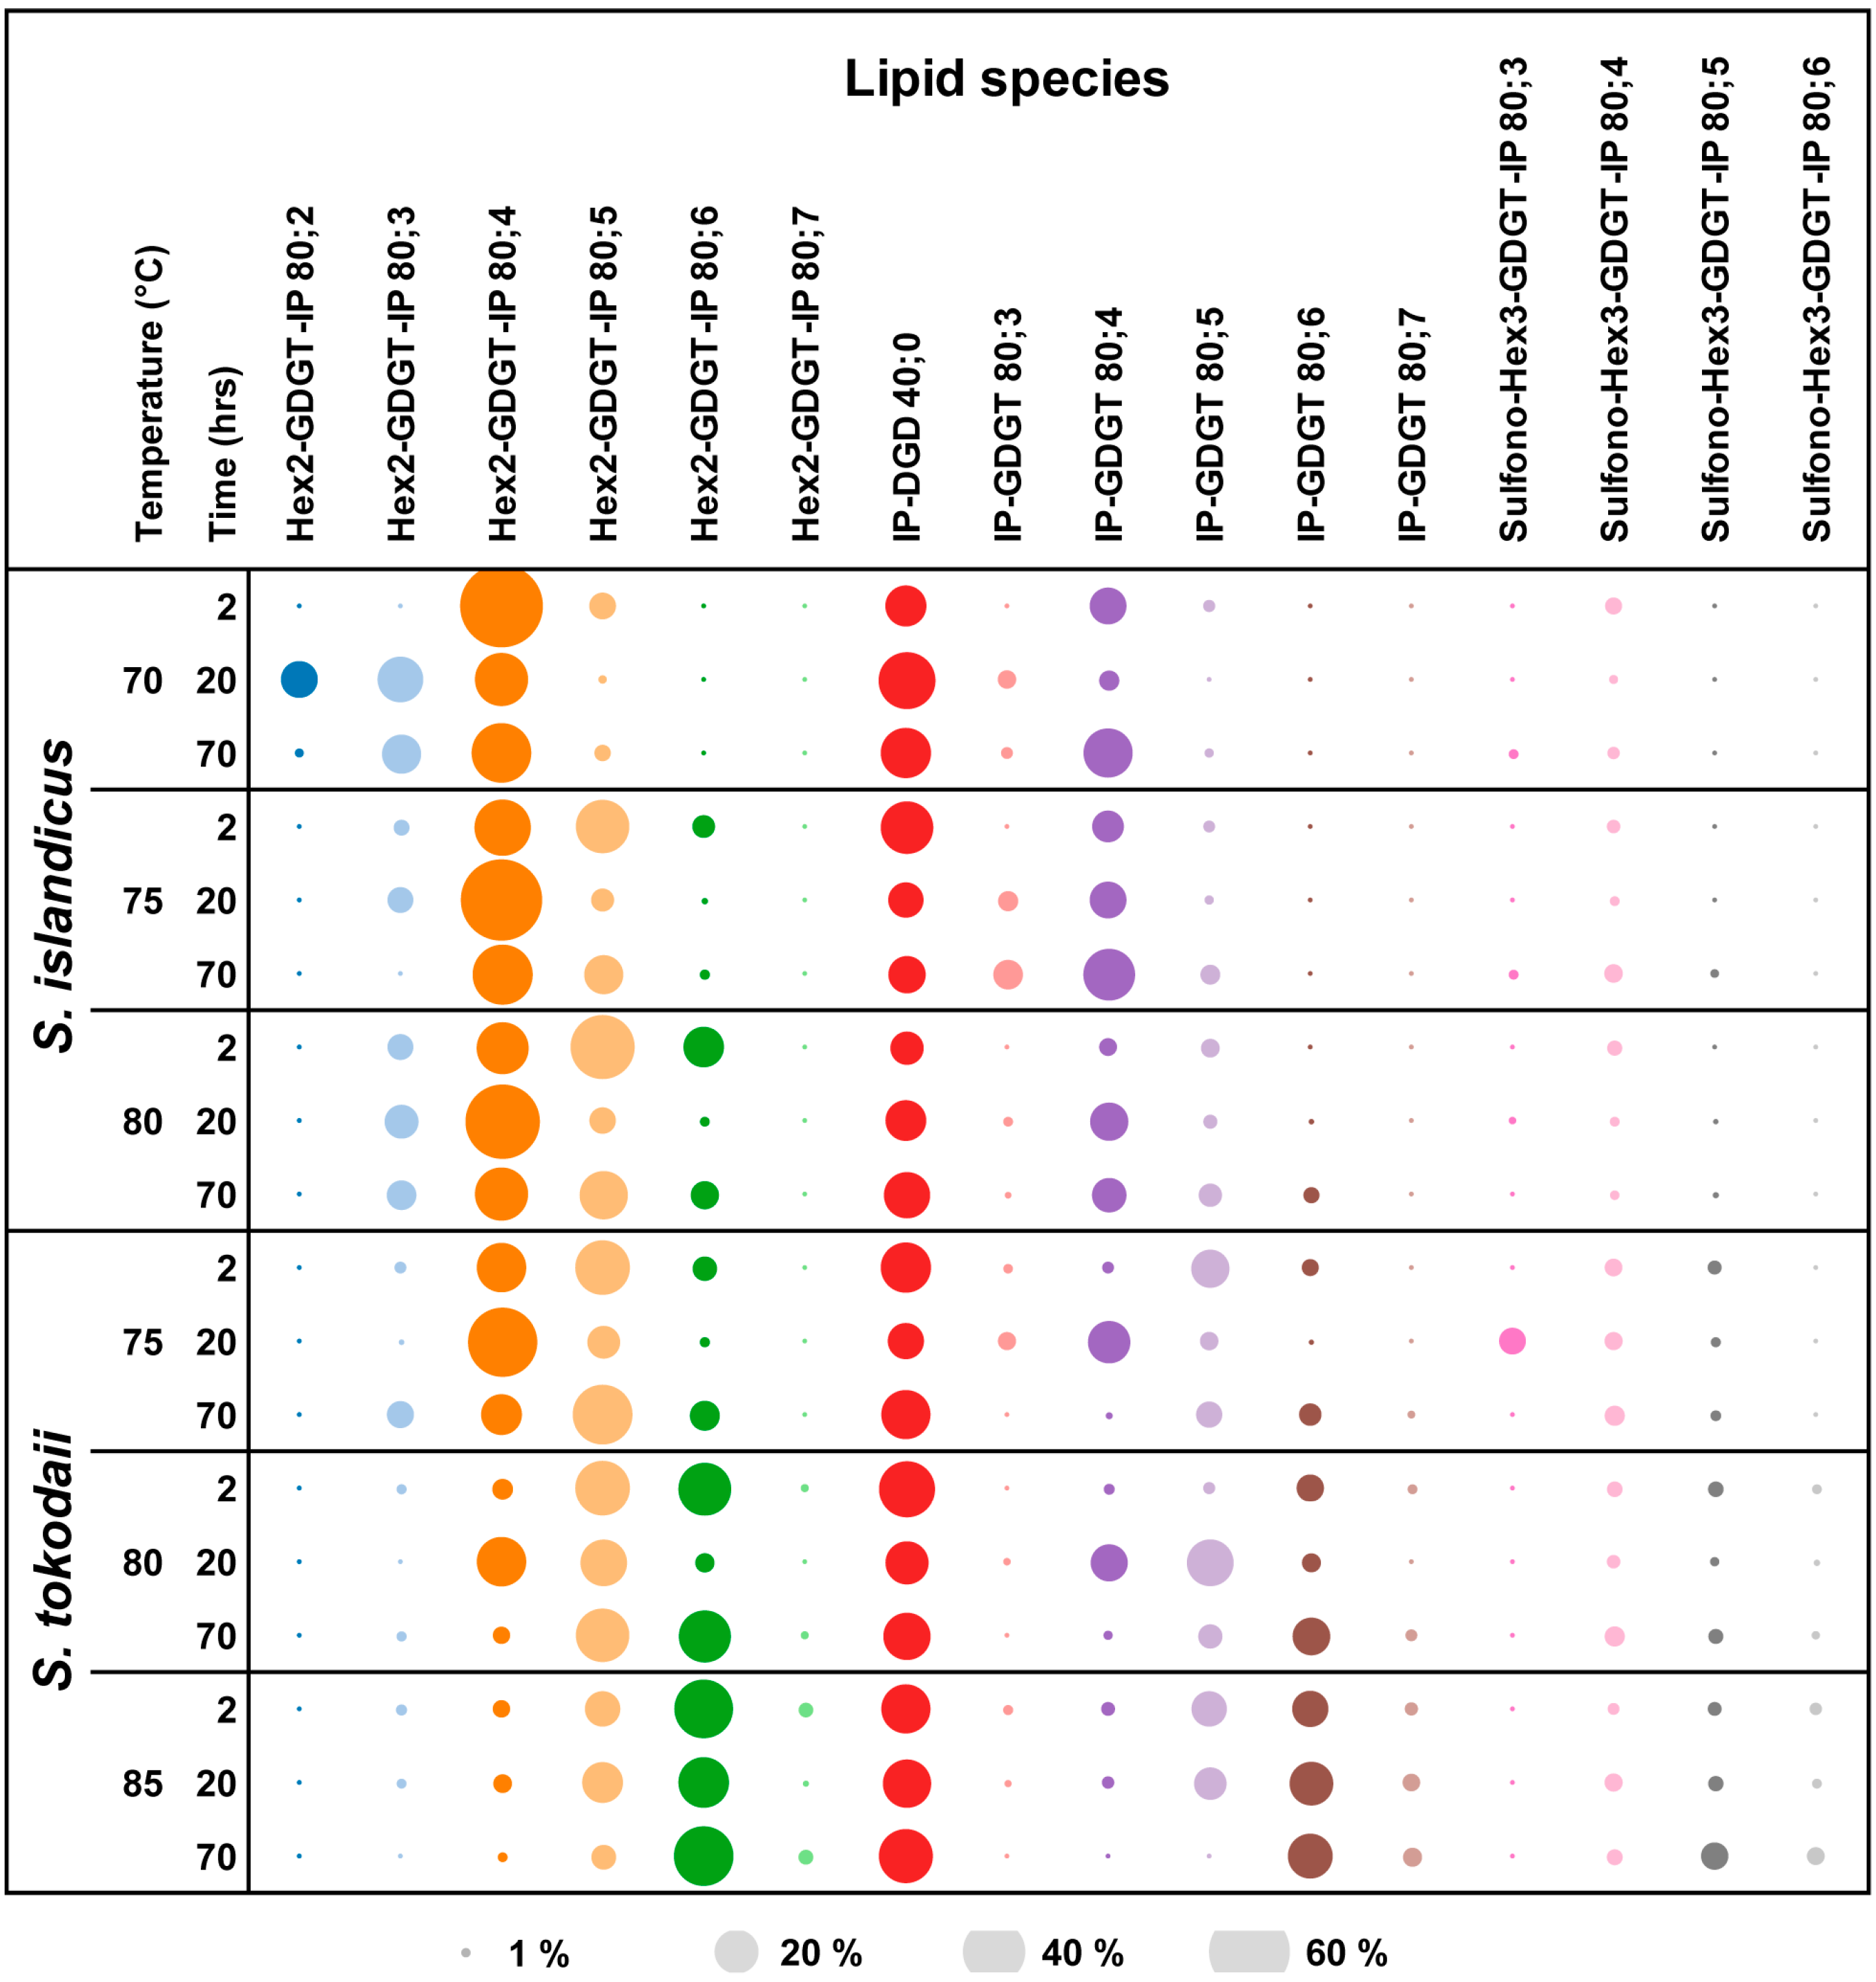
3.2. Lipid Composition


| Temp | Hours | Lipid class/number of rings in [%] | ||||||||||||||||||||
|---|---|---|---|---|---|---|---|---|---|---|---|---|---|---|---|---|---|---|---|---|---|---|
| Hex2-GDGT-IP | IP-GDGT | Sulfono-Hex3-GDGT-IP | IP-DGD | DEL:TEL ratio | ||||||||||||||||||
| 1 | 2 | 3 | 4 | 5 | 6 | 7 | 1 | 2 | 3 | 4 | 5 | 6 | 7 | 3 | 4 | 5 | 6 | 0 | ||||
| S. islandicus | 70 | 2 | 63 | 6 | 12 | 1 | 2 | 15 | 1:6 | |||||||||||||
| 20 | 1 | 12 | 19 | 26 | 1 | 1 | 3 | 3 | 3 | 30 | 1:2 | |||||||||||
| 70 | 14 | 32 | 2 | 1 | 1 | 22 | 1 | 1 | 23 | 1:3 | ||||||||||||
| 75 | 2 | 2 | 29 | 26 | 4 | 1 | 8 | 1 | 1 | 26 | 1:3 | |||||||||||
| 20 | 6 | 61 | 5 | 3 | 12 | 11 | 1:8 | |||||||||||||||
| 70 | 32 | 14 | 9 | 24 | 3 | 1 | 3 | 12 | 1:7 | |||||||||||||
| 80 | 2 | 6 | 24 | 37 | 15 | 3 | 3 | 2 | 10 | 1:9 | ||||||||||||
| 20 | 11 | 51 | 6 | 13 | 2 | 15 | 1:6 | |||||||||||||||
| 70 | 7 | 27 | 21 | 7 | 11 | 5 | 2 | 19 | 1:4 | |||||||||||||
| S. tokodaii | 75 | 2 | 1 | 22 | 27 | 5 | 1 | 14 | 2 | 2 | 1 | 23 | 1:3 | |||||||||
| 20 | 44 | 10 | 3 | 16 | 3 | 7 | 3 | 1 | 12 | 1:7 | ||||||||||||
| 70 | 6 | 15 | 33 | 8 | 6 | 4 | 4 | 1 | 21 | 1:4 | ||||||||||||
| 80 | 2 | 1 | 4 | 27 | 25 | 1 | 1 | 7 | 1 | 2 | 2 | 1 | 29 | 1:2 | ||||||||
| 20 | 22 | 20 | 3 | 12 | 20 | 3 | 1 | 16 | 1:5 | |||||||||||||
| 70 | 1 | 3 | 27 | 23 | 5 | 12 | 1 | 4 | 2 | 20 | 1:4 | |||||||||||
| 85 | 2 | 1 | 3 | 11 | 31 | 2 | 1 | 2 | 11 | 12 | 1 | 1 | 2 | 1 | 22 | 1:4 | ||||||
| 20 | 3 | 13 | 23 | 1 | 10 | 18 | 3 | 3 | 2 | 1 | 22 | 1:4 | ||||||||||
| 70 | 1 | 6 | 32 | 2 | 18 | 3 | 2 | 6 | 3 | 27 | 1:3 | |||||||||||
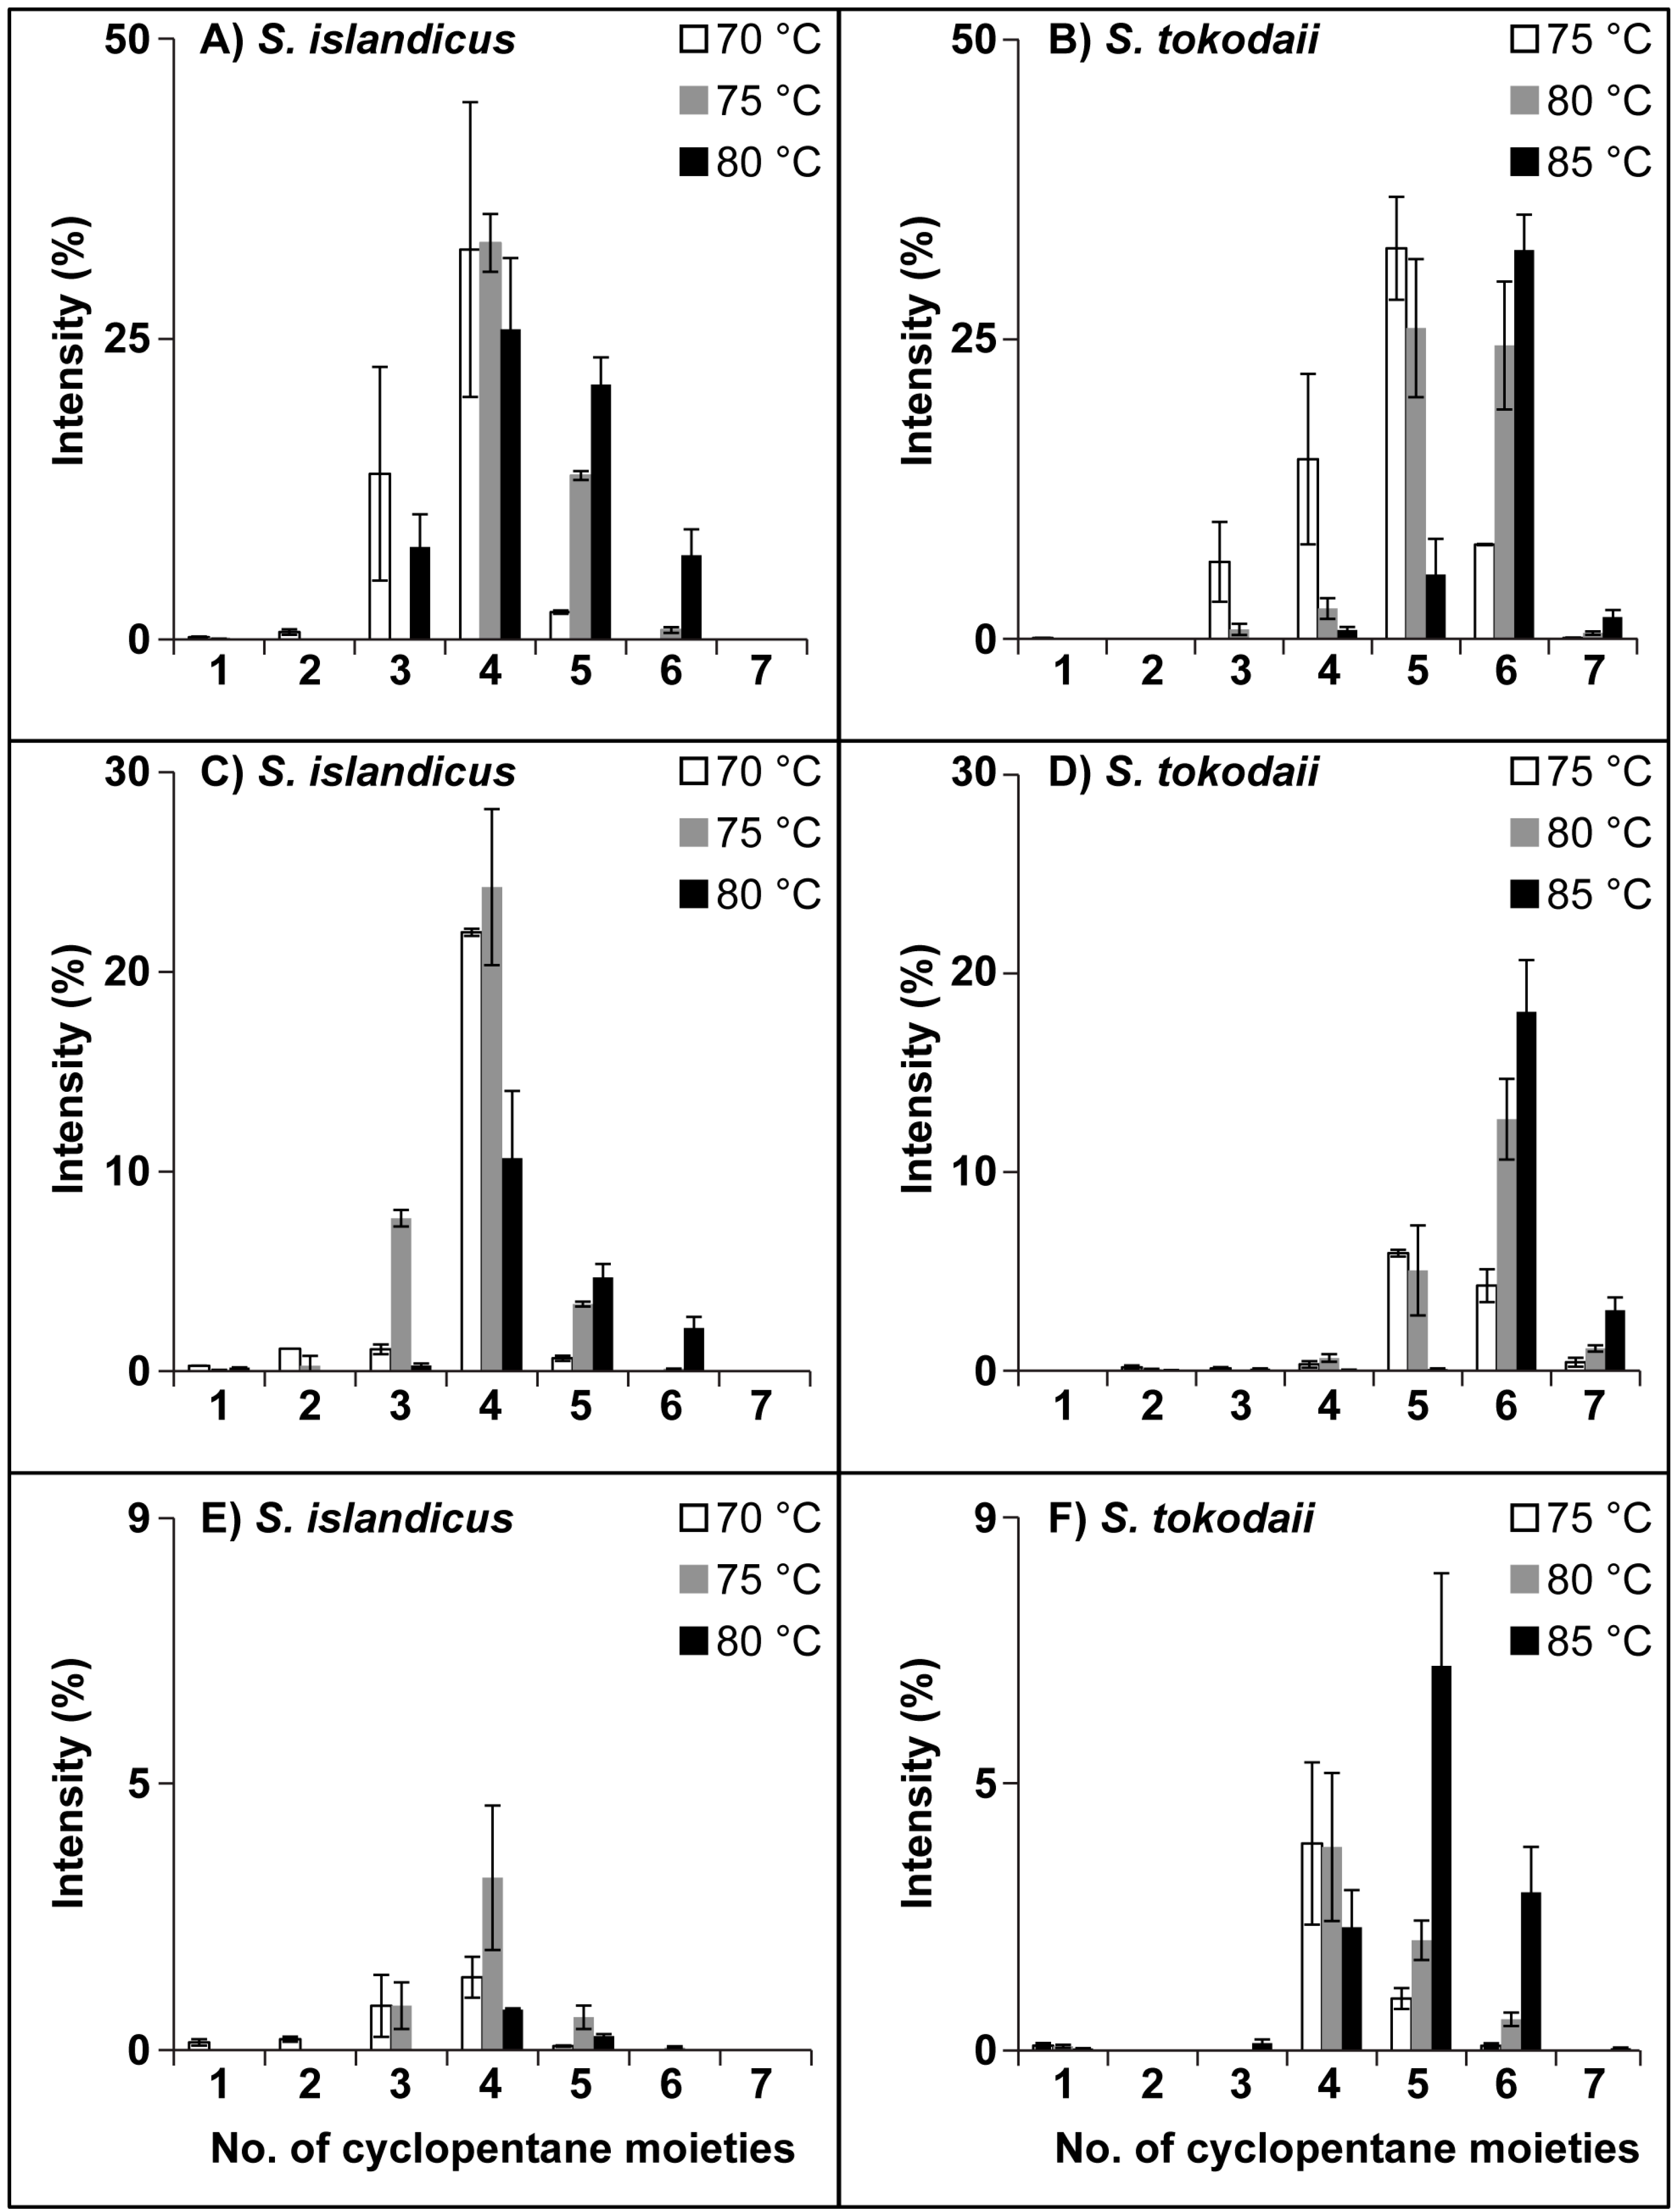
3.3. Ring Distribution at Different Temperatures

| S. islandicus | S. tokodaii | ||||||||||||||||||
|---|---|---|---|---|---|---|---|---|---|---|---|---|---|---|---|---|---|---|---|
| 70 °C | 75 °C | 80 °C | 75 °C | 80 °C | 85 °C | ||||||||||||||
| Time [h] | Avg. | SD | Avg. | SD | Avg. | SD | Avg. | SD | Avg. | SD | Avg. | SD | |||||||
| Hex2-GDGT-IP | 2 | 4.09 | ± | 0.002 | 4.50 | ± | 0.043 | 4.74 | ± | 0.067 | 4.66 | ± | 0.014 | 5.37 | ± | 0.013 | 5.64 | ± | 0.026 |
| 20 | 3.18 | ± | 0.068 | 3.99 | ± | 0.031 | 3.96 | ± | 0.099 | 4.19 | ± | 0.010 | 4.58 | ± | 0.066 | 5.46 | ± | 0.223 | |
| 70 | 3.73 | ± | 0.349 | 4.32 | ± | 0.003 | 4.45 | ± | 0.156 | 4.68 | ± | 0.022 | 5.39 | ± | 0.181 | 5.88 | ± | 0.105 | |
| IP-GDGT | 2 | 4.09 | ± | 0.041 | 3.88 | ± | 0.115 | 4.53 | ± | 2.133 | 5.00 | ± | 0.032 | 5.76 | ± | 0.033 | 5.43 | ± | 0.159 |
| 20 | 2.73 | ± | 0.010 | 3.80 | ± | 0.057 | 4.03 | ± | 0.030 | 3.82 | ± | 0.074 | 4.65 | ± | 0.071 | 5.59 | ± | 0.133 | |
| 70 | 3.82 | ± | 0.083 | 3.85 | ± | 0.102 | 4.46 | ± | 0.209 | 5.25 | ± | 0.098 | 5.68 | ± | 0.147 | 6.05 | ± | 0.031 | |
| Sulfono-Hex3-GDGT-IP | 2 | 4.00 | ± | 0.000 | 4.00 | ± | 0.000 | 4.00 | ± | 1.886 | 4.38 | ± | 0.143 | 4.73 | ± | 0.093 | 5.03 | ± | 0.063 |
| 20 | 3.42 | ± | 0.051 | 4.13 | ± | 0.054 | 3.84 | ± | 0.118 | 3.46 | ± | 0.232 | 4.49 | ± | 0.132 | 4.59 | ± | 0.076 | |
| 70 | 3.39 | ± | 0.176 | 3.97 | ± | 0.080 | 4.26 | ± | 0.037 | 4.17 | ± | 0.043 | 4.46 | ± | 0.133 | 5.02 | ± | 0.016 | |
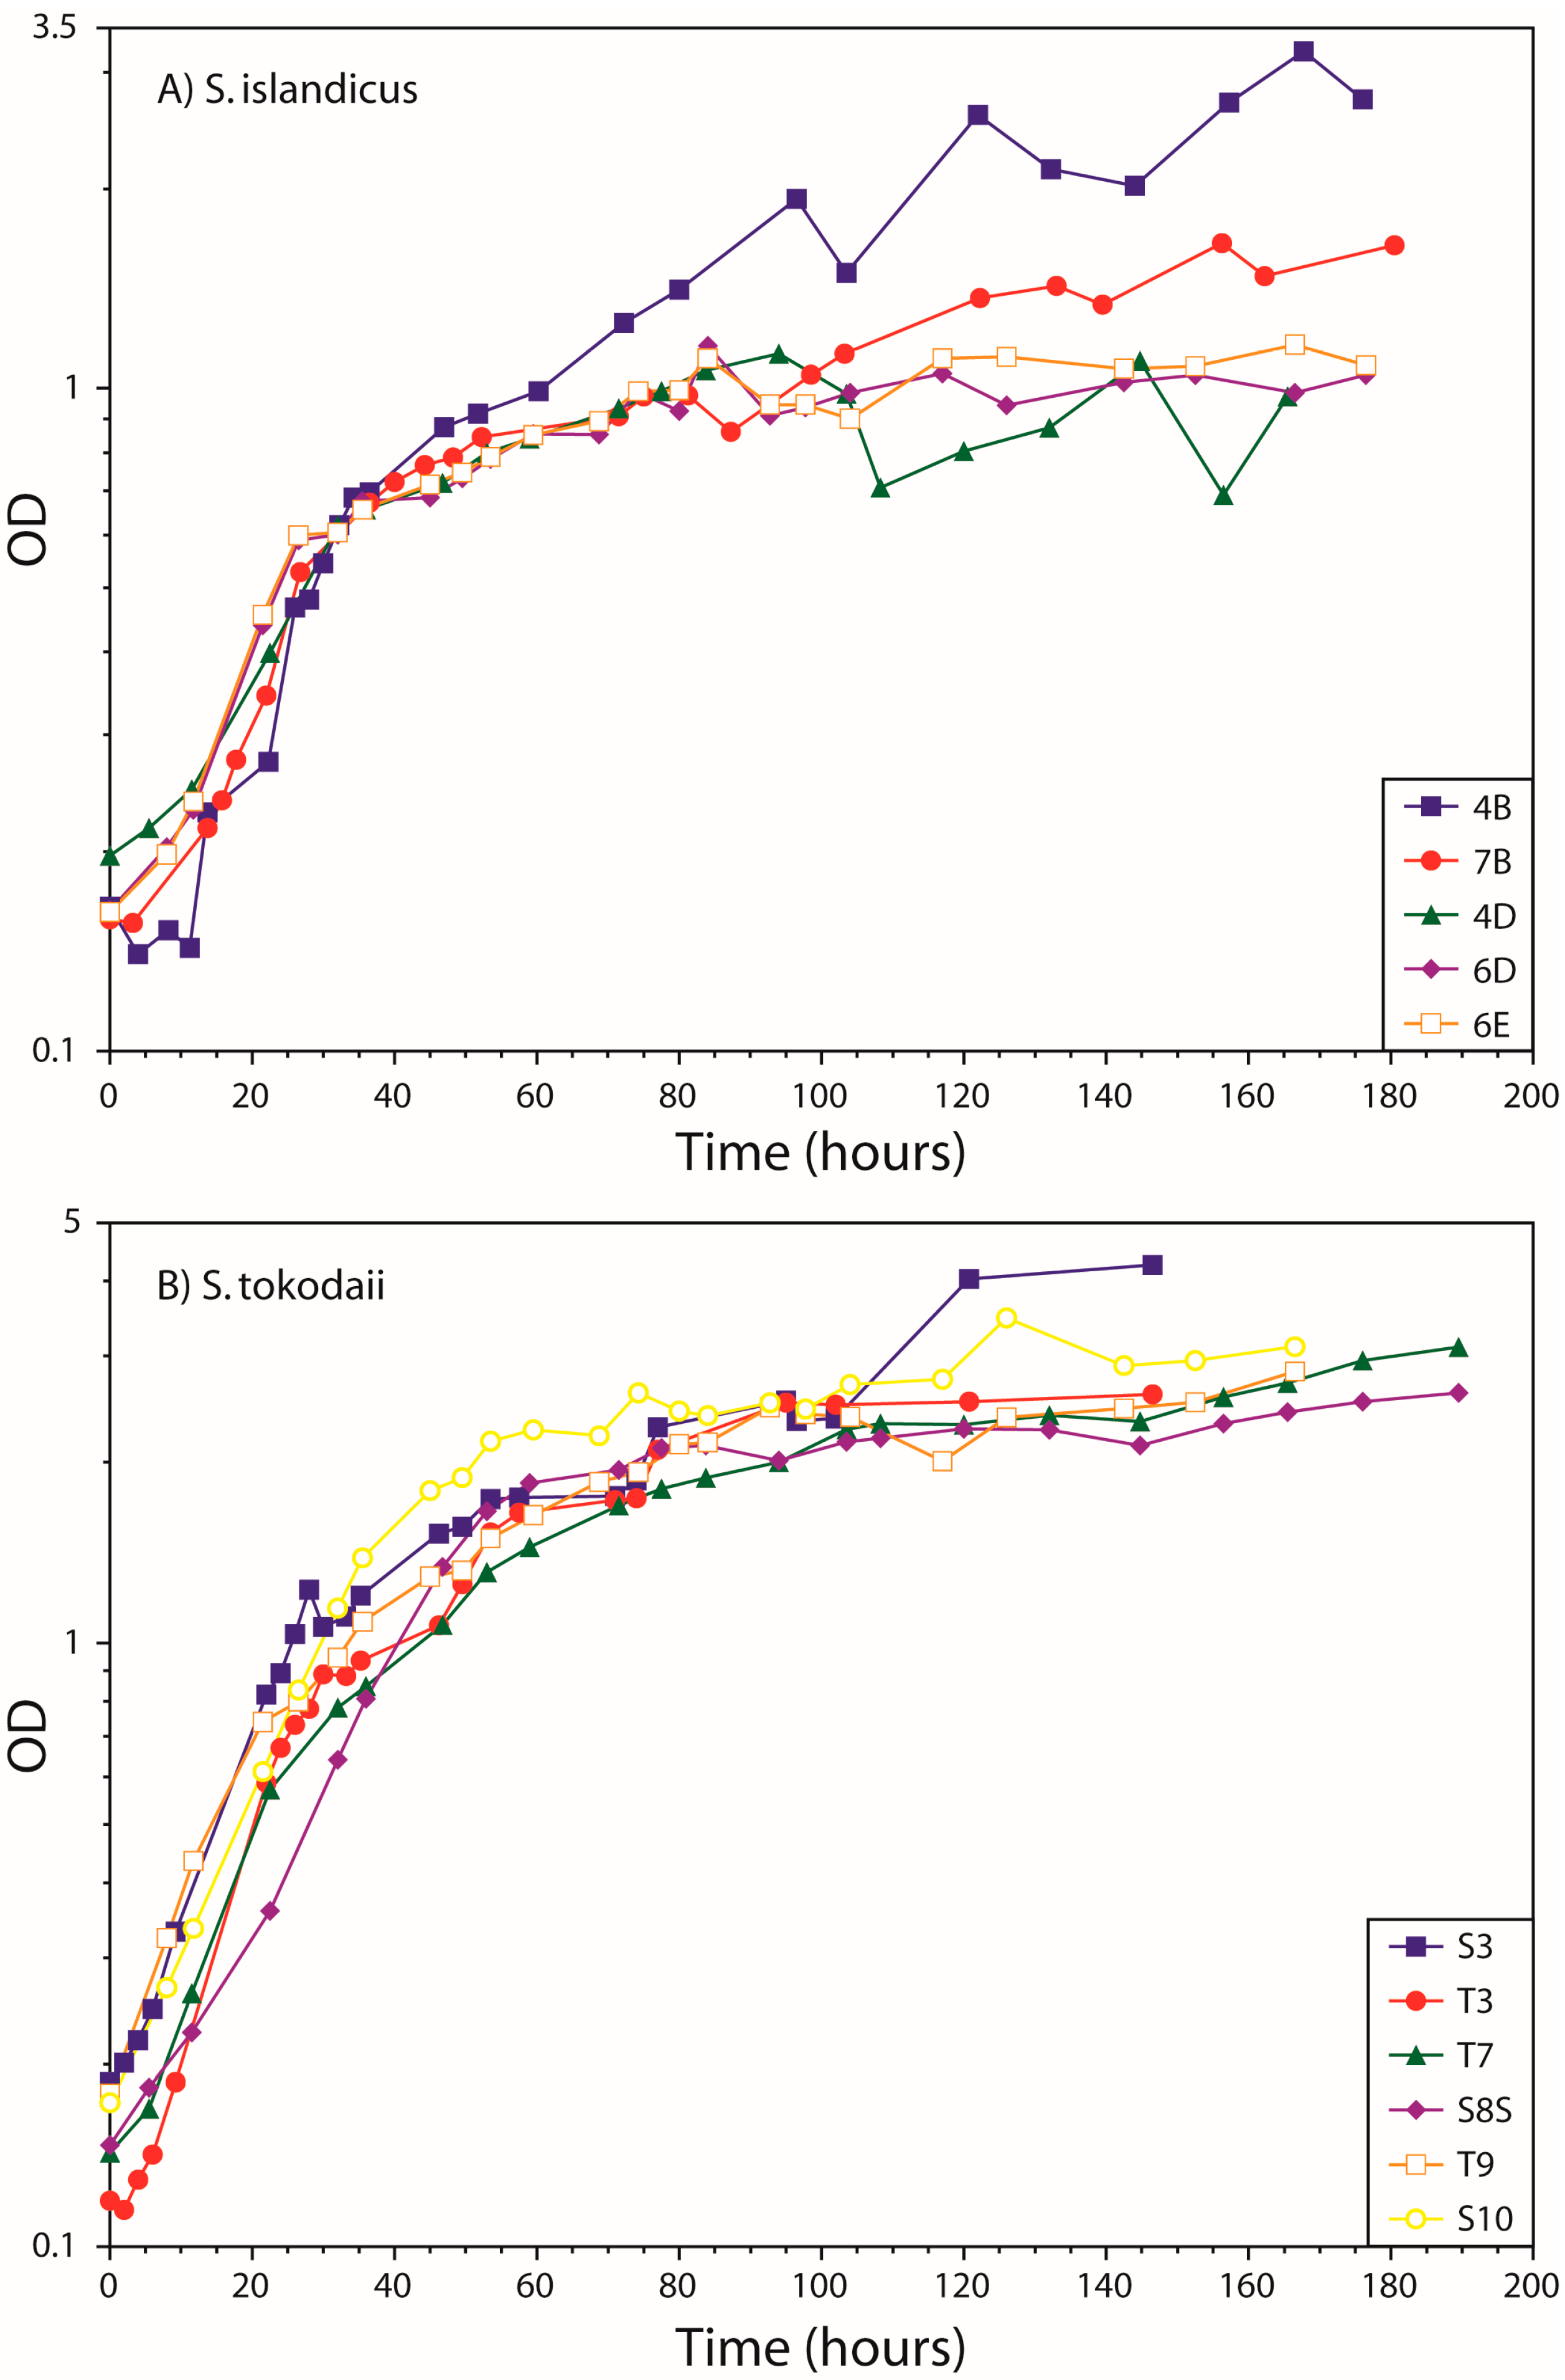
3.4. Lipid Composition at Different Growth Phases
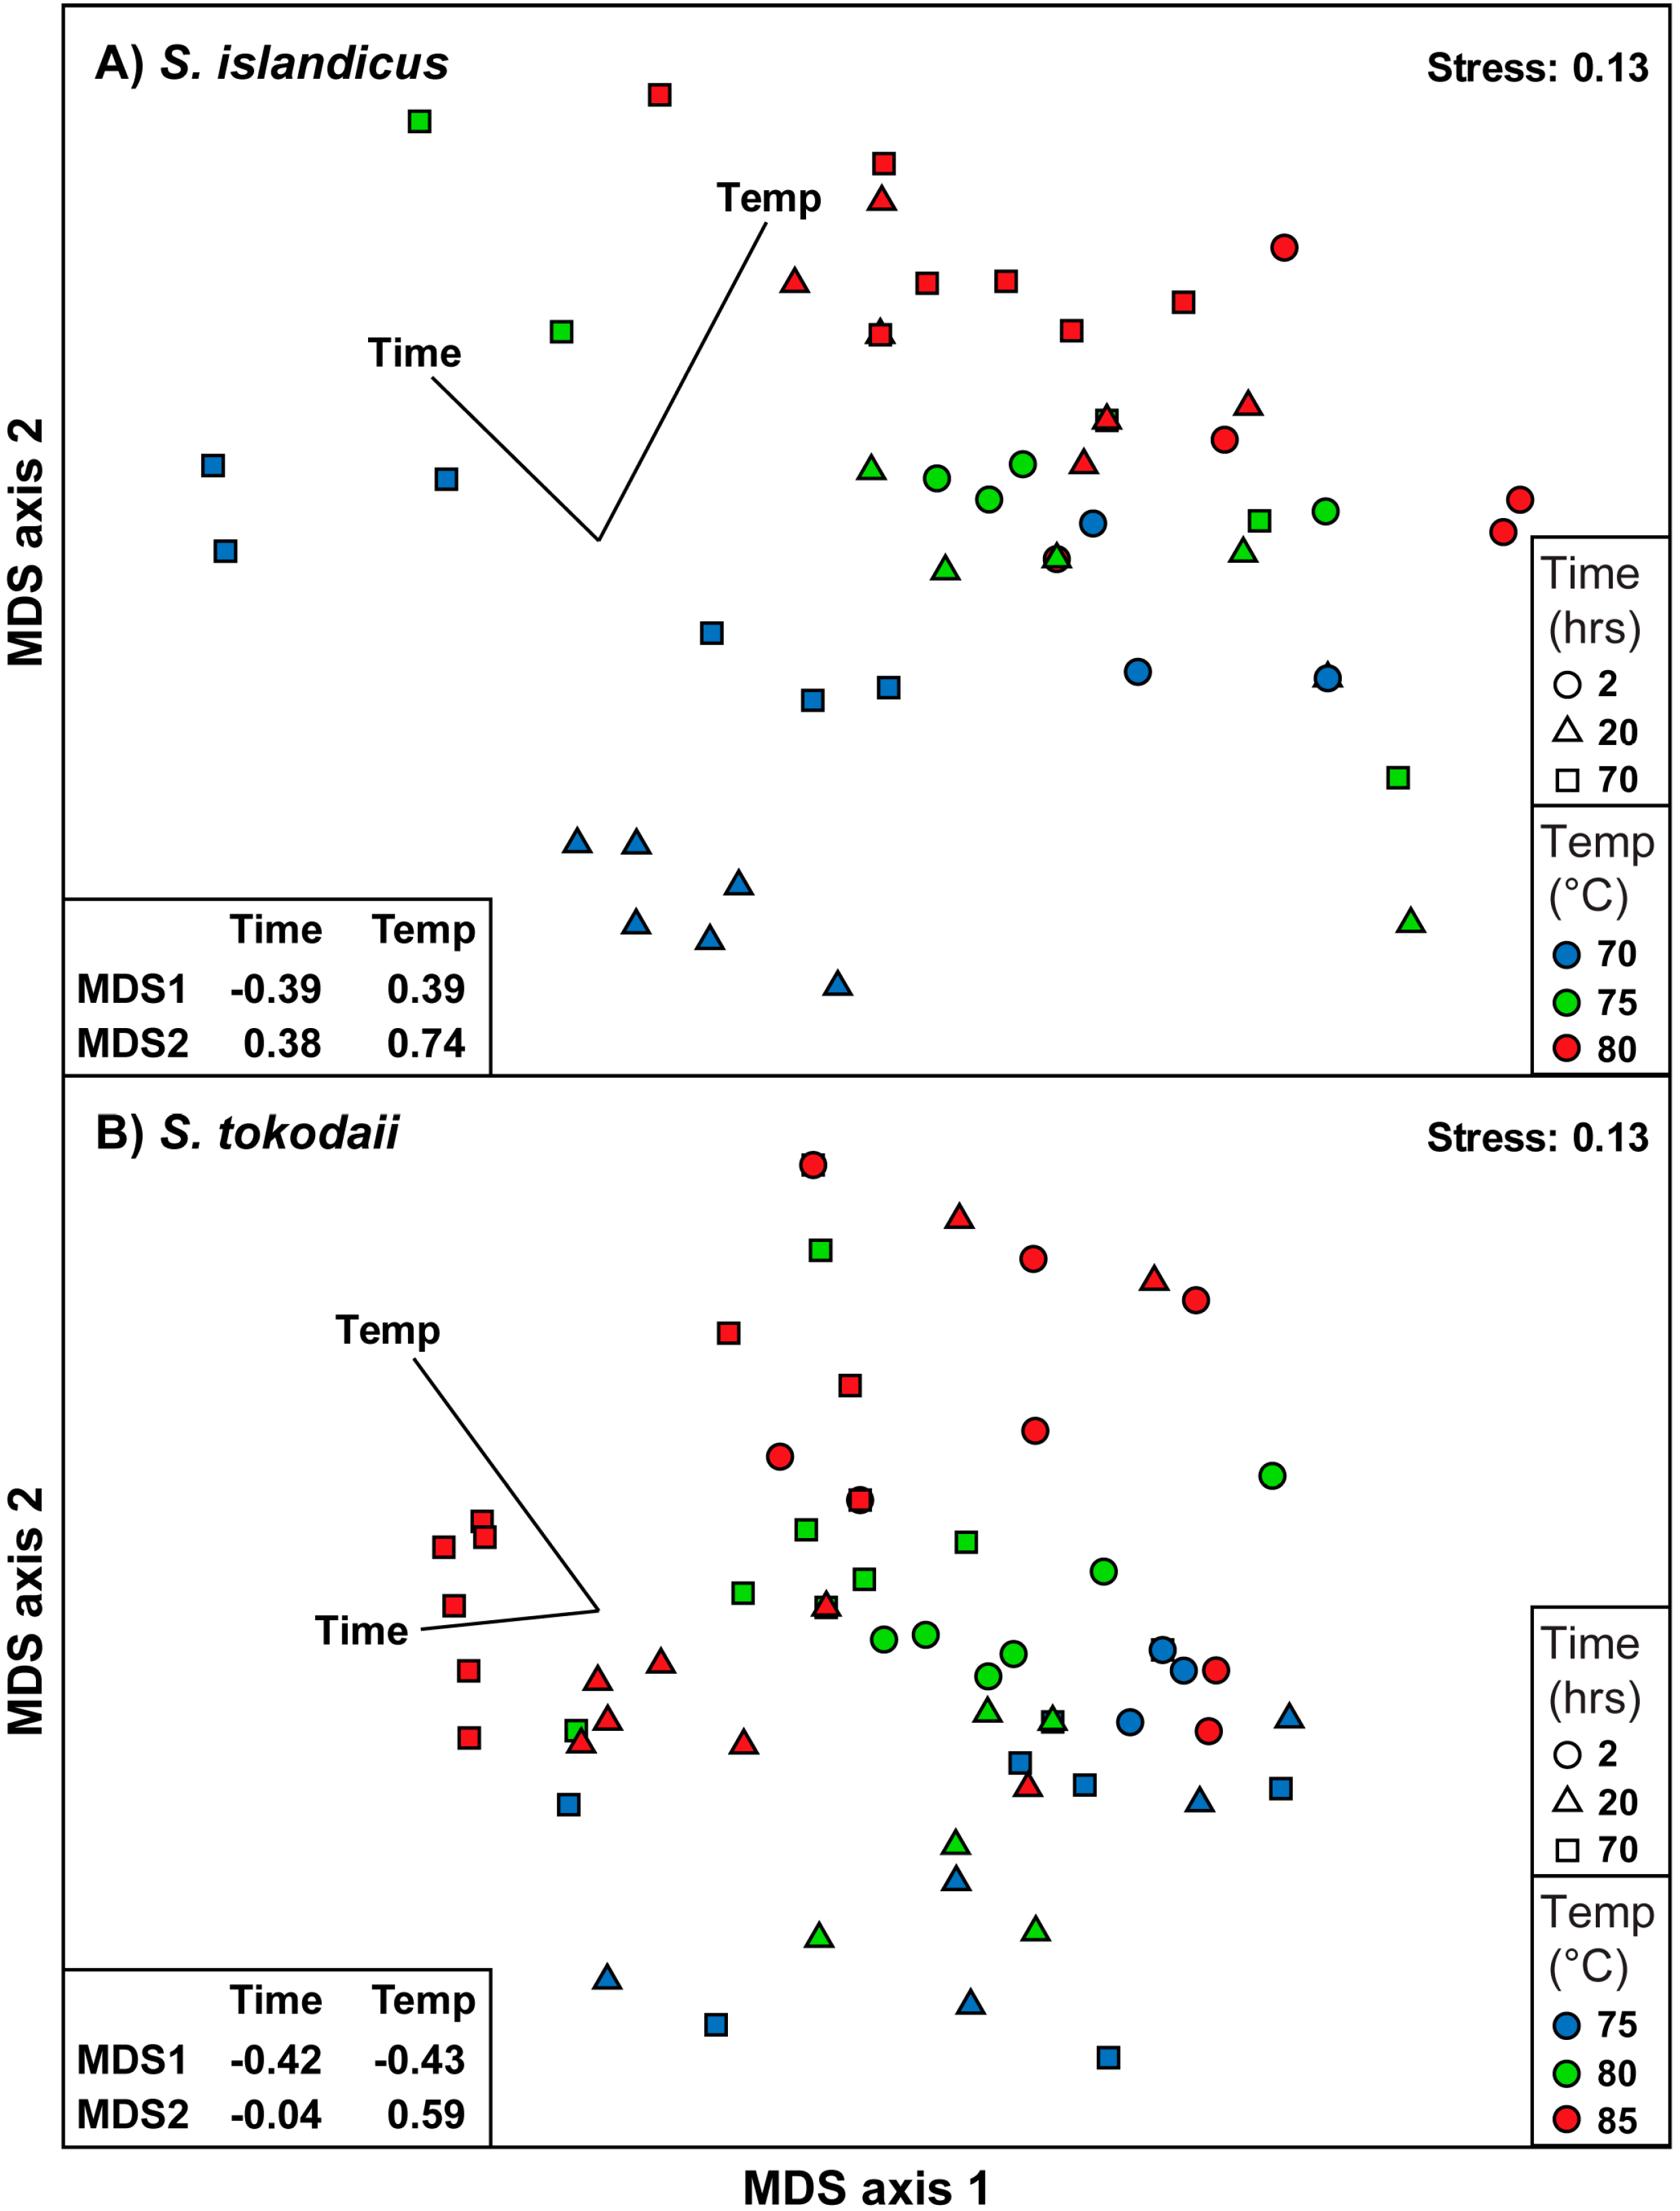
3.5. Statistical Analysis of the Dataset
4. Discussion
4.1. Growth Curves
4.2 Lipid Profile
4.3. Ring Distribution at Different Temperatures
4.4. Average Number of Cyclization
5. Conclusions
Acknowledgments
Author Contributions
Conflicts of Interest
Appendix

| Lipid class | Temp | Hours | Number of rings (SEM values) | ||||||||
|---|---|---|---|---|---|---|---|---|---|---|---|
| 1 | 2 | 3 | 4 | 5 | 6 | 7 | 1 * | ||||
| Hex2-GDGT-IP | S. islandicus | 70 | 2 | 63 (0.4) | 6(0.1) | 15 (1.1) | |||||
| 20 | 1 (0.1) | 12 (2.4) | 19 (2.0) | 26 (0.7) | 1 (0.1) | 30 (1.6) | |||||
| 70 | 14 (8.9) | 32 (12.3) | 2 (0.1) | 23 (1.5) | |||||||
| 75 | 2 | 2 (1.0) | 29 (2.6) | 26 (0.5) | 4 (0.8) | 26 (10.7) | |||||
| 20 | 6 (1.4) | 61 (2.0) | 5 (0.7) | 11 (0.7) | |||||||
| 70 | 32 (2.4) | 14 (0.4) | 12 (0.4) | ||||||||
| 80 | 2 | 6 (2.0) | 24 (0.8) | 37 (1.2) | 15 (0.7) | 10 (0.9) | |||||
| 20 | 11 (3.9) | 51 (2.1) | 6 (0.8) | 15 (1.0) | |||||||
| 70 | 7 (2.7) | 27 (5.9) | 21 (2.3) | 7 (0.1) | 19 (2.2) | ||||||
| S. tokodaii | 75 | 2 | 1 (0.5) | 22 (4.2) | 27 (2.8) | 5 (0.2) | 23 (0.8) | ||||
| 20 | 44 (0.2) | 10 (0.4) | 12 (1.7) | ||||||||
| 70 | 6 (3.3) | 15 (7.1) | 33 (4.3) | 8 (0.1) | 21 (10.5) | ||||||
| 80 | 2 | 1 (0.3) | 4 (0.6) | 27 (0.2) | 25 (1.4) | 29 (1.8) | |||||
| 20 | 22 (1.6) | 20 (1.9) | 3 (0.5) | 16 (3.3) | |||||||
| 70 | 1 (0.5) | 3 (0.9) | 27 (5.8) | 23 (2.3) | 20 (2.9) | ||||||
| 85 | 2 | 1 (0.3) | 3 (0.6) | 11 (1.6) | 31 (3.9) | 2 (0.7) | 22 (1.4) | ||||
| 20 | 3 (1.8) | 13 (5.9) | 23 (2.7) | 22 (2.3) | |||||||
| 70 | 1 (0.3) | 6 (3.0) | 32 (3.0) | 2 (0.6) | 27 (7.0) | ||||||
| IP-GDGT | S. islandicus | 70 | 2 | 12 (1.3) | 1 (0.4) | ||||||
| 20 | 1 (0.3) | 3 (0.4) | 3 (0.5) | 3 (0.5) | |||||||
| 70 | 1 (0.5) | 1 (0.4) | 22 (3.9) | ||||||||
| 75 | 2 | 1 (0.2) | 8 (5.7) | 1 (0.1) | |||||||
| 20 | 3 (0.7) | 12 (1.7) | |||||||||
| 70 | 9 (4.0) | 24 (2.4) | 3 (0.1) | ||||||||
| 80 | 2 | 3 (0.9) | 3 (1.0) | ||||||||
| 20 | 13 (0.3) | 2 (0.1) | |||||||||
| 70 | 11 (3.4) | 5 (0.7) | 2 (0.6) | ||||||||
| S. tokodaii | 75 | 2 | 1 (0.1) | 14 (8.4) | 2 (0.1) | ||||||
| 20 | 3 (1.5) | 16 (1.9) | 3 (0.1) | ||||||||
| 70 | 6 (0.2) | 4 (0.8) | |||||||||
| 80 | 2 | 1 (0.1) | 1 (0.4) | 7 (6.5) | 1 (0.3) | ||||||
| 20 | 12 (1.8) | 20 (2.9) | 3 (0.8) | ||||||||
| 70 | 5 (2.3) | 12 (2.0) | 1 (0.2) | ||||||||
| 85 | 2 | 1 (0.3) | 2 (0.4) | 11 (3.9) | 12 (1.0) | 1 (0.2) | |||||
| 20 | 1 (0.6) | 10 (3.2) | 18 (1.6) | 3 (0.7) | |||||||
| 70 | 18 (2.6) | 3 (0.6) | |||||||||
| Sulfono-Hex3-GDGT-IP | S. islandicus | 70 | 2 | 2 (0.1) | |||||||
| 20 | |||||||||||
| 70 | 1 (0.5) | 1 (0.3) | |||||||||
| 75 | 2 | 1 (0.1) | |||||||||
| 20 | |||||||||||
| 70 | 1 (0.4) | 3 (1.2) | |||||||||
| Sulfono-Hex3-GDGT-IP | S. islandicus | 80 | 2 | 2 (0.6) | |||||||
| 20 | |||||||||||
| 70 | |||||||||||
| S. tokodaii | 75 | 2 | 2 (1.3) | ||||||||
| 20 | 7 (3.3) | 3 (1.8) | |||||||||
| 70 | 4 (1.4) | ||||||||||
| 80 | 2 | 2 (0.3) | 1 (0.2) | ||||||||
| 20 | 1 (0.3) | ||||||||||
| 70 | 4 (1.2) | ||||||||||
| 85 | 2 | 1 (0.1) | 1 (0.1) | ||||||||
| 20 | 3 (1.2) | 1 (0.3) | |||||||||
| 70 | 2 (0.6) | 3 (08) | |||||||||
References
- Koga, Y. Thermal adaptation of the archaeal and bacterial lipid membranes. Archaea 2012, 2012, 789652. [Google Scholar] [CrossRef] [PubMed]
- Jain, S.; Caforio, A.; Driessen, A.J. Biosynthesis of archaeal membrane ether lipids. Front. Microbiol. 2014, 5, 641. [Google Scholar] [CrossRef] [PubMed]
- Koga, Y.; Morii, H. Biosynthesis of ether-type polar lipids in archaea and evolutionary considerations. Microbiol. Mol. Biol. Rev 2007, 71, 97–120. [Google Scholar] [CrossRef] [PubMed]
- Nemoto, N.; Shida, Y.; Shimada, H.; Oshima, T.; Yamagishi, A. Characterization of the precursor of tetraether lipid biosynthesis in the thermoacidophilic archaeon Thermoplasma acidophilum. Extremophiles 2003, 7, 235–243. [Google Scholar] [PubMed]
- Poulter, C.D.; Aoki, T.; Daniels, L. Biosynthesis of isoprenoid membranes in the methanogenic archaebacterium Methanospirillum hungatei. J. Am. Chem. Soc. 1988, 110, 2620–2624. [Google Scholar] [CrossRef]
- Eguchi, T.; Nishimura, Y.; Kakinuma, K. Importance of the isopropylidene terminal of geranylgeranyl group for the formation of tetraether lipid in methanogenic archaea. Tetrahedron Lett. 2003, 44, 3275–3279. [Google Scholar] [CrossRef]
- Villanueva, L.; Damste, J.S.; Schouten, S. A re-evaluation of the archaeal membrane lipid biosynthetic pathway. Nat. Rev. Microbiol. 2014, 12, 438–448. [Google Scholar] [CrossRef] [PubMed]
- De Rosa, M.; Esposito, E.; Gambacorta, A.; Nicolaus, B.; Bu’Lock, J.D. Effects of temperature on ether lipid composition of Caldariella acidophila. Phytochemistry 1980, 19, 827–831. [Google Scholar]
- Lai, D.; Springstead, J.R.; Monbouquette, H.G. Effect of growth temperature on ether lipid biochemistry in Archaeoglobus fulgidus. Extremophiles 2008, 12, 271–278. [Google Scholar] [CrossRef] [PubMed]
- Shimada, H.; Nemoto, N.; Shida, Y.; Oshima, T.; Yamagishi, A. Effects of pH and temperature on the composition of polar lipids in Thermoplasma acidophilum ho-62. J. Bacteriol. 2008, 190, 5404–5411. [Google Scholar] [CrossRef] [PubMed]
- Yang, L.L.; Haug, A. Structure of membrane lipids and physico-biochemical properties of the plasma membrane from Thermoplasma acidophilum, adapted to growth at 37 °C. Biochim. Biophys. Acta—Lipids Lipid Metab. 1979, 573, 308–320. [Google Scholar] [CrossRef]
- Murae, T.; Ryohei, M.; Fumio, K. Examination of intact ether lipid components of thermoacidophile Sulfolobus sp. By esi/tof mass spectrometry. J. Mass Spectrom. Soc. Jpn. 2001, 49, 195–200. [Google Scholar] [CrossRef]
- Matsuno, Y.; Sugai, A.; Higashibata, H.; Fukuda, W.; Ueda, K.; Uda, I.; Sato, I.; Itoh, T.; Imanaka, T.; Fujiwara, S. Effect of growth temperature and growth phase on the lipid composition of the archaeal membrane from Thermococcus kodakaraensis. Biosci. Biotechnol. Biochem. 2009, 73, 104–108. [Google Scholar] [CrossRef] [PubMed]
- Gambacorta, A.; Gliozzi, A.; De Rosa, M. Archaeal lipids and their biotechnological applications. World J. Microbiol. Biotechnol. 1995, 11, 115–131. [Google Scholar] [CrossRef] [PubMed]
- Gabriel, J.L.; Chong, P.L.G. Molecular modeling of archaebacterial bipolar tetraether lipid membranes. Chem. Phys. Lipids 2000, 105, 193–200. [Google Scholar] [CrossRef]
- Yoshinaga, M.Y.; Gagen, E.J.; Wörmer, L.; Broda, N.K.; Meador, T.B.; Wendt, J.; Thomm, M.; Hinrichs, K.U. Methanothermobacter thermautotrophicus modulates its membrane lipids in response to hydrogen and nutrient availability. Front. Microbiol. 2015, 6. [Google Scholar] [CrossRef] [PubMed]
- Meador, T.B.; Gagen, E.J.; Loscar, M.E.; Goldhammer, T.; Yoshinaga, M.Y.; Wendt, J.; Thomm, M.; Hinrichs, K.U. Thermococcus kodakarensis modulates its polar membrane lipids and elemental composition according to growth stage and phosphate availability. Front. Microbiol. 2014, 5. [Google Scholar] [CrossRef] [PubMed]
- Elling, F.J.; Könneke, M.; Lipp, J.S.; Becker, K.W.; Gagen, E.J.; Hinrichs, K.-U. Effects of growth phase on the membrane lipid composition of the thaumarchaeon Nitrosopumilus maritimus and their implications for archaeal lipid distributions in the marine environment. Geochim. Cosmochim. Acta 2014, 141, 579–597. [Google Scholar] [CrossRef]
- Kramer, J.K.G.; Sauer, F.D. Changes in the diether-to-tetraether-lipid ratio during cell growth in Methanobacterium thermoautotrophicum. FEMS Microbiol. Lett. 1991, 83, 45–50. [Google Scholar] [CrossRef]
- Morii, H.; Koga, Y. Tetraether type polar lipids increase after logarithmic growth phase of Methanobacterium thermoautotrophicum in compensation for the decrease of diether lipids. FEMS Microbiol. Lett. 1993, 109, 283–287. [Google Scholar] [CrossRef]
- Fröls, S.; Gordon, P.M.K.; Panlilio, M.A.; Schleper, C.; Sensen, C.W. Elucidating the transcription cycle of the UV-inducible hyperthermophilic archaeal virus SSV1 by DNA microarrays. Virology 2007, 365, 48–59. [Google Scholar] [CrossRef] [PubMed]
- Prangishvili, D.; Garrett, R.A. Exceptionally diverse morphotypes and genomes of crenarchaeal hyperthermophilic viruses. Biochem. Soc. Trans. 2004, 32, 204–208. [Google Scholar] [CrossRef] [PubMed]
- Reno, M.L.; Held, N.L.; Fields, C.J.; Burke, P.V.; Whitaker, R.J. Biogeography of the Sulfolobus islandicus pan-genome. Proc. Natl. Acad. Sci. USA 2009, 106, 8605–8610. [Google Scholar] [CrossRef] [PubMed]
- Langworthy, T.A.; Mayberry, W.R.; Smith, P.F. Long-chain glycerol diether and polyol dialkyl glycerol triether lipids of Sulfolobus acidocaldarius. J. Bacteriol. 1974, 119, 106–116. [Google Scholar] [PubMed]
- Sturt, H.F.; Summons, R.E.; Smith, K.; Elvert, M.; Hinrichs, K.U. Intact polar membrane lipids in prokaryotes and sediments deciphered by high-performance liquid chromatography/electrospray ionization multistage mass spectrometry—New biomarkers for biogeochemistry and microbial ecology. Rapid Commun. Mass Spectrom. 2004, 18, 617–628. [Google Scholar] [CrossRef] [PubMed]
- Zillig, W.; Kletzin, A.; Schleper, C.; Holz, I.; Janekovic, D.; Hain, J.; Lanzendorfer, M.; Kristjansson, J.K. Screening for Sulfolobales, their plasmids and their viruses in icelandic solfataras. Syst. Appl. Microbiol. 1994, 16, 609–628. [Google Scholar] [CrossRef]
- Whitaker, R.J.; Grogan, D.W.; Taylor, J.W. Geographic barriers isolate endemic populations of hyperthermophilic archaea. Science 2003, 301, 976–978. [Google Scholar] [CrossRef] [PubMed]
- Zhang, C.; Krause, D.J.; Whitaker, R.J. Sulfolobus islandicus: A model system for evolutionary genomics. Biochem. Soc. Trans. 2013, 41, 458–462. [Google Scholar] [CrossRef] [PubMed]
- Jensen, S.M.; Brandl, M.; Treusch, A.H.; Ejsing, C.S. Structural characterization of ether lipids from the archaeon Sulfolobus islandicus by high-resolution shotgun lipidomics. J. Mass Spectrom. 2015, 50, 476–487. [Google Scholar] [CrossRef] [PubMed]
- Suzuki, T.; Iwasaki, T.; Uzawa, T.; Hara, K.; Nemoto, N.; Kon, T.; Ueki, T.; Yamagishi, A.; Oshima, T. Sulfolobus tokodaii sp. nov. (f. Sulfolobus sp. Strain 7), a new member of the genus sulfolobus isolated from Beppu Hot Springs, Japan. Extremophiles 2002, 6, 39–44. [Google Scholar]
- Han, X.; Gross, R.W. Shotgun lipidomics: Electrospray ionization mass spectrometric analysis and quantitation of cellular lipidomes directly from crude extracts of biological samples. Mass Spectrom. Rev. 2005, 24, 367–412. [Google Scholar] [CrossRef] [PubMed]
- Ejsing, C.S.; Sampaio, J.L.; Surendranath, V.; Duchoslav, E.; Ekroos, K.; Klemm, R.W.; Simons, K.; Shevchenko, A. Global analysis of the yeast lipidome by quantitative shotgun mass spectrometry. Proc. Natl. Acad. Sci. USA 2009, 106, 2136–2141. [Google Scholar] [CrossRef] [PubMed]
- Almeida, R.; Pauling, J.K.; Sokol, E.; Hannibal-Bach, H.K.; Ejsing, C.S. Comprehensive lipidome analysis by shotgun lipidomics on a hybrid quadrupole-orbitrap-linear ion trap mass spectrometer. J. Am. Soc. Mass Spectrom. 2014, 26, 133–148. [Google Scholar] [CrossRef] [PubMed]
- Zhu, C.; Lipp, J.S.; Wörmer, L.; Becker, K.W.; Schröder, J.; Hinrichs, K.-U. Comprehensive glycerol ether lipid fingerprints through a novel reversed phase liquid chromatography-mass spectrometry protocol. Org. Geochem. 2013, 65, 53–62. [Google Scholar] [CrossRef]
- Tarasov, K.; Stefanko, A.; Casanovas, A.; Surma, M.A.; Berzina, Z.; Hannibal-Bach, H.K.; Ekroos, K.; Ejsing, C.S. High-content screening of yeast mutant libraries by shotgun lipidomics. Mol. BioSyst. 2014, 10, 1364–1376. [Google Scholar] [CrossRef] [PubMed]
- Brock, T.D.; Brock, K.M.; Belly, R.T.; Weiss, R.L. Sulfolobus: A new genus of sulfur-oxidizing bacteria living at low pH and high temperature. Archiv. Mikrobiol. 1972, 84, 54–68. [Google Scholar] [CrossRef]
- Husen, P.; Tarasov, K.; Katafiasz, M.; Sokol, E.; Vogt, J.; Baumgart, J.; Nitsch, R.; Ekroos, K.; Ejsing, C.S. Analysis of lipid experiments (ALEX): A software framework for analysis of high-resolution shotgun lipidomics data. PLoS ONE 2013, 8, e79736. [Google Scholar] [CrossRef] [PubMed]
- De Rosa, M.; Gambacorta, A.; Nicolaus, B.; Bu’Lock, J.D. Complex lipids of Caldariella acidophila, a thermoacidophile archaebacterium. Phytochemistry 1980, 19, 821–825. [Google Scholar] [CrossRef]
- Langworthy, T.A. Comparative lipid composition of heterotrophically and autotrophically grown Sulfolobus acidocaldarius. J. Bacteriol. 1977, 130, 1326–1332. [Google Scholar] [PubMed]
- Clarke, K.R.; RN, G. Primer v6: User Manual/Tutorial; PRIMER-E: Plymouth, UK, 2006. [Google Scholar]
- Clarke, K.R.; Ainsworth, M. A method of linking multivariate community structure to environmental variables. Mar. Ecol. Prog. Ser. 1993, 92, 205–219. [Google Scholar] [CrossRef]
- Boyd, E.S.; Pearson, A.; Pi, Y.; Li, W.J.; Zhang, Y.G.; He, L.; Zhang, C.L.; Geesey, G.G. Temperature and PH controls on glycerol dibiphytanyl glycerol tetraether lipid composition in the hyperthermophilic crenarchaeon Acidilobus sulfurireducens. Extremophiles 2011, 15, 59–65. [Google Scholar] [CrossRef] [PubMed]
- Uda, I.; Sugai, A.; Itoh, Y.H.; Itoh, T. Variation in molecular species of core lipids from the order Thermoplasmales strains depends on the growth temperature. J. Oleo Sci. 2004, 53, 399–404. [Google Scholar] [CrossRef]
- Oger, P.M.; Cario, A. Adaptation of the membrane in archaea. Biophys. Chem. 2013, 183, 42–56. [Google Scholar] [CrossRef] [PubMed]
- Uda, I.; Sugai, A.; Itoh, Y.H.; Itoh, T. Variation in molecular species of polar lipids from Thermoplasma acidophilum depends on growth temperature. Lipids 2001, 36, 103–105. [Google Scholar] [CrossRef] [PubMed]
- Damste, J.S.; Schouten, S.; Hopmans, E.C.; van Duin, A.C.; Geenevasen, J.A. Crenarchaeol: The characteristic core glycerol dibiphytanyl glycerol tetraether membrane lipid of cosmopolitan pelagic Crenarchaeota. J. Lipid Res. 2002, 43, 1641–1651. [Google Scholar] [CrossRef] [PubMed]
- Damste, J.S.; Rijpstra, W.I.; Hopmans, E.C.; Jung, M.Y.; Kim, J.G.; Rhee, S.K.; Stieglmeier, M.; Schleper, C. Intact polar and core glycerol dibiphytanyl glycerol tetraether lipids of group I.1a and I.1b Thaumarchaeota in soil. Appl. Environ. Microbiol. 2012, 78, 6866–6874. [Google Scholar] [CrossRef] [PubMed]
- Casanovas, A.; Sprenger, R.R.; Tarasov, K.; Ruckerbauer, D.E.; Hannibal-Bach, H.K.; Zanghellini, J.; Jensen, O.N.; Ejsing, C.S. Quantitative analysis of proteome and lipidome dynamics reveals functional regulation of global lipid metabolism. Chem. Biol. 2015, 22, 412–425. [Google Scholar] [CrossRef] [PubMed]
- Cronan, J.E., Jr. Phospholipid alterations during growth of Escherichia coli. J. Bacteriol. 1968, 95, 2054–2061. [Google Scholar] [PubMed]
© 2015 by the authors; licensee MDPI, Basel, Switzerland. This article is an open access article distributed under the terms and conditions of the Creative Commons Attribution license (http://creativecommons.org/licenses/by/4.0/).
Share and Cite
Jensen, S.M.; Neesgaard, V.L.; Skjoldbjerg, S.L.N.; Brandl, M.; Ejsing, C.S.; Treusch, A.H. The Effects of Temperature and Growth Phase on the Lipidomes of Sulfolobus islandicus and Sulfolobus tokodaii. Life 2015, 5, 1539-1566. https://doi.org/10.3390/life5031539
Jensen SM, Neesgaard VL, Skjoldbjerg SLN, Brandl M, Ejsing CS, Treusch AH. The Effects of Temperature and Growth Phase on the Lipidomes of Sulfolobus islandicus and Sulfolobus tokodaii. Life. 2015; 5(3):1539-1566. https://doi.org/10.3390/life5031539
Chicago/Turabian StyleJensen, Sara Munk, Vinnie Lund Neesgaard, Sandra Landbo Nedergaard Skjoldbjerg, Martin Brandl, Christer S. Ejsing, and Alexander H. Treusch. 2015. "The Effects of Temperature and Growth Phase on the Lipidomes of Sulfolobus islandicus and Sulfolobus tokodaii" Life 5, no. 3: 1539-1566. https://doi.org/10.3390/life5031539
APA StyleJensen, S. M., Neesgaard, V. L., Skjoldbjerg, S. L. N., Brandl, M., Ejsing, C. S., & Treusch, A. H. (2015). The Effects of Temperature and Growth Phase on the Lipidomes of Sulfolobus islandicus and Sulfolobus tokodaii. Life, 5(3), 1539-1566. https://doi.org/10.3390/life5031539