
Which Is More Valuable in the Diagnosis of Pulmonary Thromboembolism? The Wells Score, the Revised Geneva Score, or the Padua Score?
 , , and
Abstract
1. Introduction
2. Patients and Methods
2.1. Patient Groups and Collection of Data
2.2. Clinical Scoring Systems
2.3. Statistical Analysis
3. Results
4. Discussion
Limitations
5. Conclusions
Author Contributions
Funding
Institutional Review Board Statement
Informed Consent Statement
Data Availability Statement
Conflicts of Interest
References
- Wendelboe, A.M.; Raskob, G.E. Global Burden of Thrombosis: Epidemiological Aspects. Circ. Res. 2016, 118, 1340–1347. [Google Scholar] [CrossRef] [PubMed]
- Wendelboe, A.M.; McCumber, M.; Hylek, E.M.; Buller, H.; Weitz, J.I.; Raskob, G. Global public awareness of venous thromboembolism. J. Thromb. Haemost. 2015, 13, 1365–1371. [Google Scholar] [CrossRef] [PubMed]
- Raskob, G.E.; Angchaisuksiri, P.; Blanco, A.N.; Buller, H.; Gallus, A.; Hunt, B.J.; Hylek, E.M.; Kakkar, A.; Konstantinides, S.V.; McCumber, M.; et al. Thrombosis: A major contributor to global disease burden. Arterioscler. Thromb. Vasc. Biol. 2014, 34, 2363–2371. [Google Scholar] [CrossRef] [PubMed]
- Konstantinides, S.V.; Barco, S.; Lankeit, M.; Meyer, G. Management of pulmonary embolism: An update. J. Am. Coll. Cardiol. 2016, 67, 976–990. [Google Scholar] [CrossRef] [PubMed]
- Carrier, M.; Righini, M.; Wells, P.S.; Perrier, A.; Anderson, D.R.; Rodger, M.A.; Pleasance, S.; Le Gal, G. Subsegmental pulmonary embolism diagnosed by computed tomography: Incidence and clinical implications. A systematic review and meta-analysis of the management outcome studies. J. Thromb. Haemost. 2010, 8, 1716–1722. [Google Scholar] [CrossRef] [PubMed]
- Jiménez, D.; de Miguel-Díez, J.; Guijarro, R.; Trujillo-Santos, J.; Otero, R.; Barba, R.; Muriel, A.; Meyer, G.; Yusen, R.D.; Monreal, M.; et al. Trends in the Management and Outcomes of Acute Pulmonary Embolism: Analysis From the RIETE Registry. J. Am. Coll. Cardiol. 2016, 67, 162–170. [Google Scholar] [CrossRef] [PubMed]
- Nieto, J.A.; Vicente, J.A.; Prieto, L.M.; Jiménez, D.; Bikdeli, B.; Rivas, A.; Porras, J.A.; Morales, M.d.V.; Bosevski, M.; Monreal, M. Thirty-day outcomes in patients with acute pulmonary embolism who discontinued anticoagulant therapy before 90 days. Am. Heart J. 2018, 206, 1–10. [Google Scholar] [CrossRef] [PubMed]
- Stein, P.D.; Henry, J.W. Clinical characteristics of patients with acute pulmonary embolism stratified according to their presenting syndromes. Chest 1997, 112, 974–979. [Google Scholar] [CrossRef] [PubMed]
- Wells, P.S.; Anderson, D.R.; Rodger, M.; Stiell, I.; Dreyer, J.F.; Barnes, D.; Forgie, M.; Kovacs, G.; Ward, J.; Kovacs, M.J. Excluding pulmonary embolism at the bedside without diagnostic imaging: Management of patients with suspected pulmonary embolism presenting to the emergency department by using a simple clinical model and d-dimer. Ann. Intern. Med. 2001, 135, 98–107. [Google Scholar] [CrossRef] [PubMed]
- Wicki, J.; Perneger, T.V.; Junod, A.F.; Bounameaux, H.; Perrier, A. Assessing clinical probability of pulmonary embolism in the emergency ward: A simple score. Arch. Intern. Med. 2001, 161, 92–97. [Google Scholar] [CrossRef] [PubMed]
- Barbar, S.; Noventa, F.; Rossetto, V.; Ferrari, A.; Brandolin, B.; Perlati, M.; De Bon, E.; Tormene, D.; Pagnan, A.; Prandoni, P. A risk assessment model for the identification of hospitalised medical patients at risk for venous thromboembolism: The Padua Prediction Score. J. Thromb. Haemost. 2010, 8, 2450–2457. [Google Scholar] [CrossRef] [PubMed]
- Kandagatla, P.; Goranta, S.; Antoine, H.; Marashi, S.M.; Schmoekel, N.; Gupta, A.H. PADUA score as a predictor for pulmonary embolism: A potential strategy for reducing unnecessary imaging. J. Thromb. Thrombolysis 2019, 47, 566–571. [Google Scholar] [CrossRef] [PubMed]
- Van Es, N.; Kraaijpoel, N.; Klok, F.A.; Huisman, M.V.; Den Exter, P.L.; Mos, I.C.M.; Galipienzo, J.; Büller, H.R.; Bossuyt, P.M. The original and simplified Wells rules and age-adjusted D-dimer testing to rule out pulmonary embolism: An individual patient data meta-analysis. J. Thromb. Haemost. 2017, 15, 678–684. [Google Scholar] [CrossRef] [PubMed]
- Penaloza, A.; Roy, P.M.; Kline, J.; Verschuren, F.; LE Gal, G.; Quentin-Georget, S.; Delvau, N.; Thys, F. Performance of age-adjusted D-dimer cut-off to rule out pulmonary embolism. J. Thromb. Haemost. 2012, 10, 1291–1296. [Google Scholar] [CrossRef] [PubMed]
- Wong, D.D.; Ramaseshan, G.; Mendelson, R.M. Comparison of the Wells and Revised Geneva Scores for the diagnosis of pulmonary embolism: An Australian experience. Intern. Med. J. 2011, 41, 258–263. [Google Scholar] [CrossRef] [PubMed]
- Shen, J.H.; Chen, H.L.; Chen, J.R.; Xing, J.L.; Gu, P.; Zhu, B.F. Comparison of the Wells score with the revised Geneva score for assessing suspected pulmonary embolism: A systematic review and meta-analysis. J. Thromb. Thrombolysis 2016, 41, 482–492. [Google Scholar] [CrossRef] [PubMed]
- Di Marca, S.; Cilia, C.; Campagna, A.; D’Arrigo, G.; ElHafeez, S.A.; Tripepi, G.; Puccia, G.; Pisano, M.; Mastrosimone, G.; Terranova, V.; et al. Comparison of Wells and Revised Geneva Rule to Assess Pretest Probability of Pulmonary Embolism in High-Risk Hospitalised Elderly Adults. J. Am. Geriatr. Soc. 2015, 63, 1091–1097. [Google Scholar] [CrossRef] [PubMed]
- Guo, X.-J.; Liu, M.; Guo, Y.-M.; Ma, H.-X.; Guo, Y.-L.; Zhu, L.; Wang, J.-G.; Yang, Y.-H.; Wang, C. A comparison of the predictive values of three clinical scoring systems for suspected acute pulmonary embolism based on multidetector CT angiography. Zhonghua Jie He He Hu Xi Za Zhi 2009, 32, 119–123. [Google Scholar] [PubMed]
- Wells, P.S.; Anderson, D.R.; Rodger, M.; Ginsberg, J.S.; Kearon, C.; Gent, M.; Turpie, A.G.; Bormanis, J.; Weitz, J.; Chamberlain, M.; et al. Derivation of a simple clinical model to categorise patients probability of pulmonary embolism: Increasing the models utility with the SimpliRED D-dimer. Thromb. Haemost. 2000, 83, 416–420. [Google Scholar] [PubMed]
- Van Belle, A.; Büller, H.R.; Huisman, M.V.; Huisman, P.M.; Kaasjager, K.; Kamphuisen, P.W.; Kramer, M.H.H.; Kruip, M.J.H.A.; Erp, J.M.K.-V.; Leebeek, F.W.G.; et al. Effectiveness of managing suspected pulmonary embolism using an algorithm combining clinical probability, D-dimer testing, and computed tomography. JAMA 2006, 295, 172–179. [Google Scholar] [CrossRef] [PubMed]
- Ten Cate-Hoek, A.J.; Prins, M.H. Management studies using a combination of D-dimer test result and clinical probability to rule out venous thromboembolism: A systematic review. J. Thromb. Haemost. 2005, 3, 2465–2470. [Google Scholar] [CrossRef] [PubMed]
- Klok, F.A.; Kruisman, E.; Spaan, J.; Nijkeuter, M.; Righini, M.; Aujesky, D.; Roy, P.M.; Perrier, A.; Gal, G.; Huisman, M.V. Comparison of the revised Geneva score with the Wells rule for assessing clinical probability of pulmonary embolism. J. Thromb. Haemost. 2008, 6, 40–44. [Google Scholar] [CrossRef] [PubMed]
- Iles, S.; Hodges, A.M.; Darley, J.R.; Frampton, C.; Epton, M.; Beckert, L.E.; Town, G.I. Clinical experience and pre-test probability scores in the diagnosis of pulmonary embolism. QJM 2003, 96, 211–215. [Google Scholar] [CrossRef] [PubMed]
- Kabrhel, C.; McAfee, A.T.; Goldhaber, S.Z. The contribution of the subjective component of the Canadian Pulmonary Embolism Score to the overall score in emergency department patients. Acad. Emerg. Med. 2005, 12, 915–920. [Google Scholar] [CrossRef] [PubMed]

| Score Points | |
|---|---|
| Wells Score * | |
| Symptoms and signs of DVT | 3 |
| Alternative diagnosis less likely than PTE | 3 |
| Tachycardia (>100 beats/min) | 1.5 |
| Immobilization or surgery in the last 4 weeks | 1.5 |
| History of DVT or pulmonary embolism | 1.5 |
| Hemoptysis | 1 |
| Cancer Presence | 1 |
| * Greater than 2: low clinical probability; 2 to 6: moderate clinical probability; greater than 6: high clinical probability. | |
| Modified Geneva Score ** | |
| Previous history of DVT or PTE | 3 |
| Age > 65 years | 1 |
| Surgery or extremity fracture within 4 weeks | 2 |
| Hemoptysis | 2 |
| Unilateral lower limb pain | 3 |
| Presence of active cancer | 2 |
| Heart rate 75–94 beats/min | 3 |
| Heart rate > 95 beats/min | 5 |
| Pain on lower limb deep vein palpation and unilateral edema | 4 |
| ** Zero to 3: low clinical probability; 4 to 10: moderate clinical probability; greater than or equal to 11: high clinical probability | |
| Padua Score *** | |
| Active cancer a | 3 |
| History of venous thromboembolism | 3 |
| Immobilization b | 3 |
| Known thrombophilic disease c | 3 |
| Recent (within the last 1 month) trauma and/or operation | 2 |
| Advanced age (>70 years) | 1 |
| Heart and/or respiratory failure | 1 |
| Acute myocardial infarction/ischemic stroke | 1 |
| Acute infection and/or rheumatic disease | 1 |
| Obesity (body mass index > 30 kg/m2) | 1 |
| Hormone replacement therapy | 1 |
| *** Low risk of VTE < 4, High risk of VTE ≥ 4 | |
| Variable | PTE Group (n = 140) | Control Group (n = 117) | p-Value |
|---|---|---|---|
| Age, median (min–max) | 74 (19–99) | 71 (19–97) | 0.269 |
| Gender (Male/Female) | 90/50 | 54/63 | 0.004 |
| Symptoms, n (%) | |||
| Shortness of breath | 114 (81.4%) | 92 (78.6%) | 0.576 |
| Chest pain | 41 (29.2%) | 15 (12.8%) | 0.001 |
| Syncope | 29 (20.7%) | 5 (4.3%) | <0.001 |
| Change in consciousness | 25 (13.0%) | 13 (11.1%) | 0.129 |
| Leg swelling | 21 (15.0%) | 8 (6.8%) | 0.547 |
| Hemoptysis | 11 (7.8%) | 18 (15.3%) | 0.058 |
| Risk Factors, n (%) | |||
| Immobility | 85 (60.7%) | 45 (38.4%) | <0.001 |
| Hospitalization (last 3 months) | 46 (32.8%) | 41 (35.0%) | 0.712 |
| History of DVT/PTE | 32 (22.8%) | 2 (1.7%) | <0.001 |
| Active malignancy | 29 (20.7%) | 37 (31.6%) | 0.046 |
| Recent surgery (last 3 months) | 12 (8.5%) | 7 (5.9%) | 0.430 |
| Recent trauma (last 1 month) | 10 (7.1%) | 1 (0.85%) | 0.013 |
| Long-term travel | 6 (4.2%) | 2 (1.7%) | 0.236 |
| Pregnancy | 2 (1.4%) | 0 (0%) | 0.194 |
| Comorbidities, n (%) | |||
| Hypertension | 69 (49.2%) | 61 (43.5%) | 0.649 |
| Malignancy | 29 (20.7%) | 37 (26.4%) | 0.046 |
| Cerebrovascular disease | 23 (16.4%) | 10 (7.1%) | 0.060 |
| Coronary artery disease (CAD) | 20 (14.2%) | 13 (9.2%) | 0.449 |
| Alzheimer’s disease | 23 (16.4%) | 10 (7.1%) | 0.056 |
| Diabetes mellitus (DM) | 19 (13.5%) | 21 (15.0%) | 0.335 |
| Congestive heart failure | 13 (9.2%) | 12 (8.5%) | 0.794 |
| Atrial fibrillation (AF) | 13 (9.2%) | 20 (14.2%) | 0.062 |
| Asthma | 13 (9.2%) | 3 (2.1%) | 0.026 |
| Chronic obstructive pulmonary disease (COPD) | 11 (7.8%) | 16 (11.4%) | 0.130 |
| PTE Group | Control Group | ||
|---|---|---|---|
| n = 140 Median (Min–Max) | n = 117 Median (Min–Max) | p Value | |
| Pulse | 92 (50–160) | 89 (60–150) | 0.391 |
| Systolic Blood Pressure (SBP) | 120 (70–190) | 120 (70–200) | 0.398 |
| Diastolic Blood Pressure (DBP) | 70 (37–120) | 80 (50–100) | 0.162 |
| Fever | 36.6 (36.1–38.6) | 36.6 (36.2–38.4) | 0.876 |
| Respiratory Rate (RR) | 20 (16–40) | 18 (16–36) | 0.009 |
| Arterial blood gas pH | 7.43 (7.13–7.60) | 7.41 (7.20–7.54) | 0.007 |
| PCO2 (mm/Hg) | 32 (21–63) | 43 (19–91) | <0.001 |
| PO2 (mm/Hg) | 59 (44–108) | 59 (45–119) | 0.706 |
| SO2 | 90 (72–99) | 90 (75–99) | 0.363 |
| Lactate (mmol/L) | 1.6 (0.5–6.9) | 1.2 (0.4–6.5) | 0.018 |
| Haemogram | 9 (2.8–28) | 9.5 (2.9–27.8) | 0.327 |
| WBC (103/uL) | 12 (7–16.7) | 12.7 (7.2–16.9) | 0.552 |
| HGB (g/dL) PLT (103/uL) | 208 (50–548) | 239 (45–666) | 0.002 |
| Other | 0.82 (0.3–7.1) | 0.88 (0.35–8) | 0.233 |
| Creatine (mg/dL) | 18.1 (0–348) | 64 (0.2–400) | <0.001 |
| CRP (mg/L) | 4300 (250–10,000) | 1235 (200–8590) | <0.001 |
| D-dimer(µg/mL) Troponin (µg/L) | 0.04 (0.003–1810) | 0.03 (0.003–1513) | 0.012 |
| “PTE Unlikely” D-Dimer in Patients Median (Min–Max) | “PTE Likely” D-Dimer in Patients Median (Min–Max) | p Value | |
|---|---|---|---|
| Wells | 1690 (200–10,000) | 3760 (250–10,000) | <0.001 |
| Modified Geneva | 1855 (200–10,000) | 2870 (200–10,000) | 0.028 |
| Padua | 1770 (200–10,000) | 2880 (250–10,000) | 0.023 |
| Scoring System | PTE Group n = 140 | Control Group n = 117 | p Value |
|---|---|---|---|
| Wells Scoring | Likely (>4): 84 (60%) Unlikely (≤4): 56 (40%) | Likely (>4): 11 (9%) Unlikely (≤4): 106 (91%) | 0.001 |
| Modified Geneva Scoring | Likely (≥6): 97 (69%) Unlikely (<5): 43 (31%) | Likely (≥6): 61 (52%) Unlikely (<5): 56 (48%) | 0.005 |
| Padua Scoring | Likely (>4): 107 (76%) Unlikely (≤4): 33 (24%) | Likely (>4): 69 (59%) Unlikely (≤4): 48 (41%) | 0.003 |
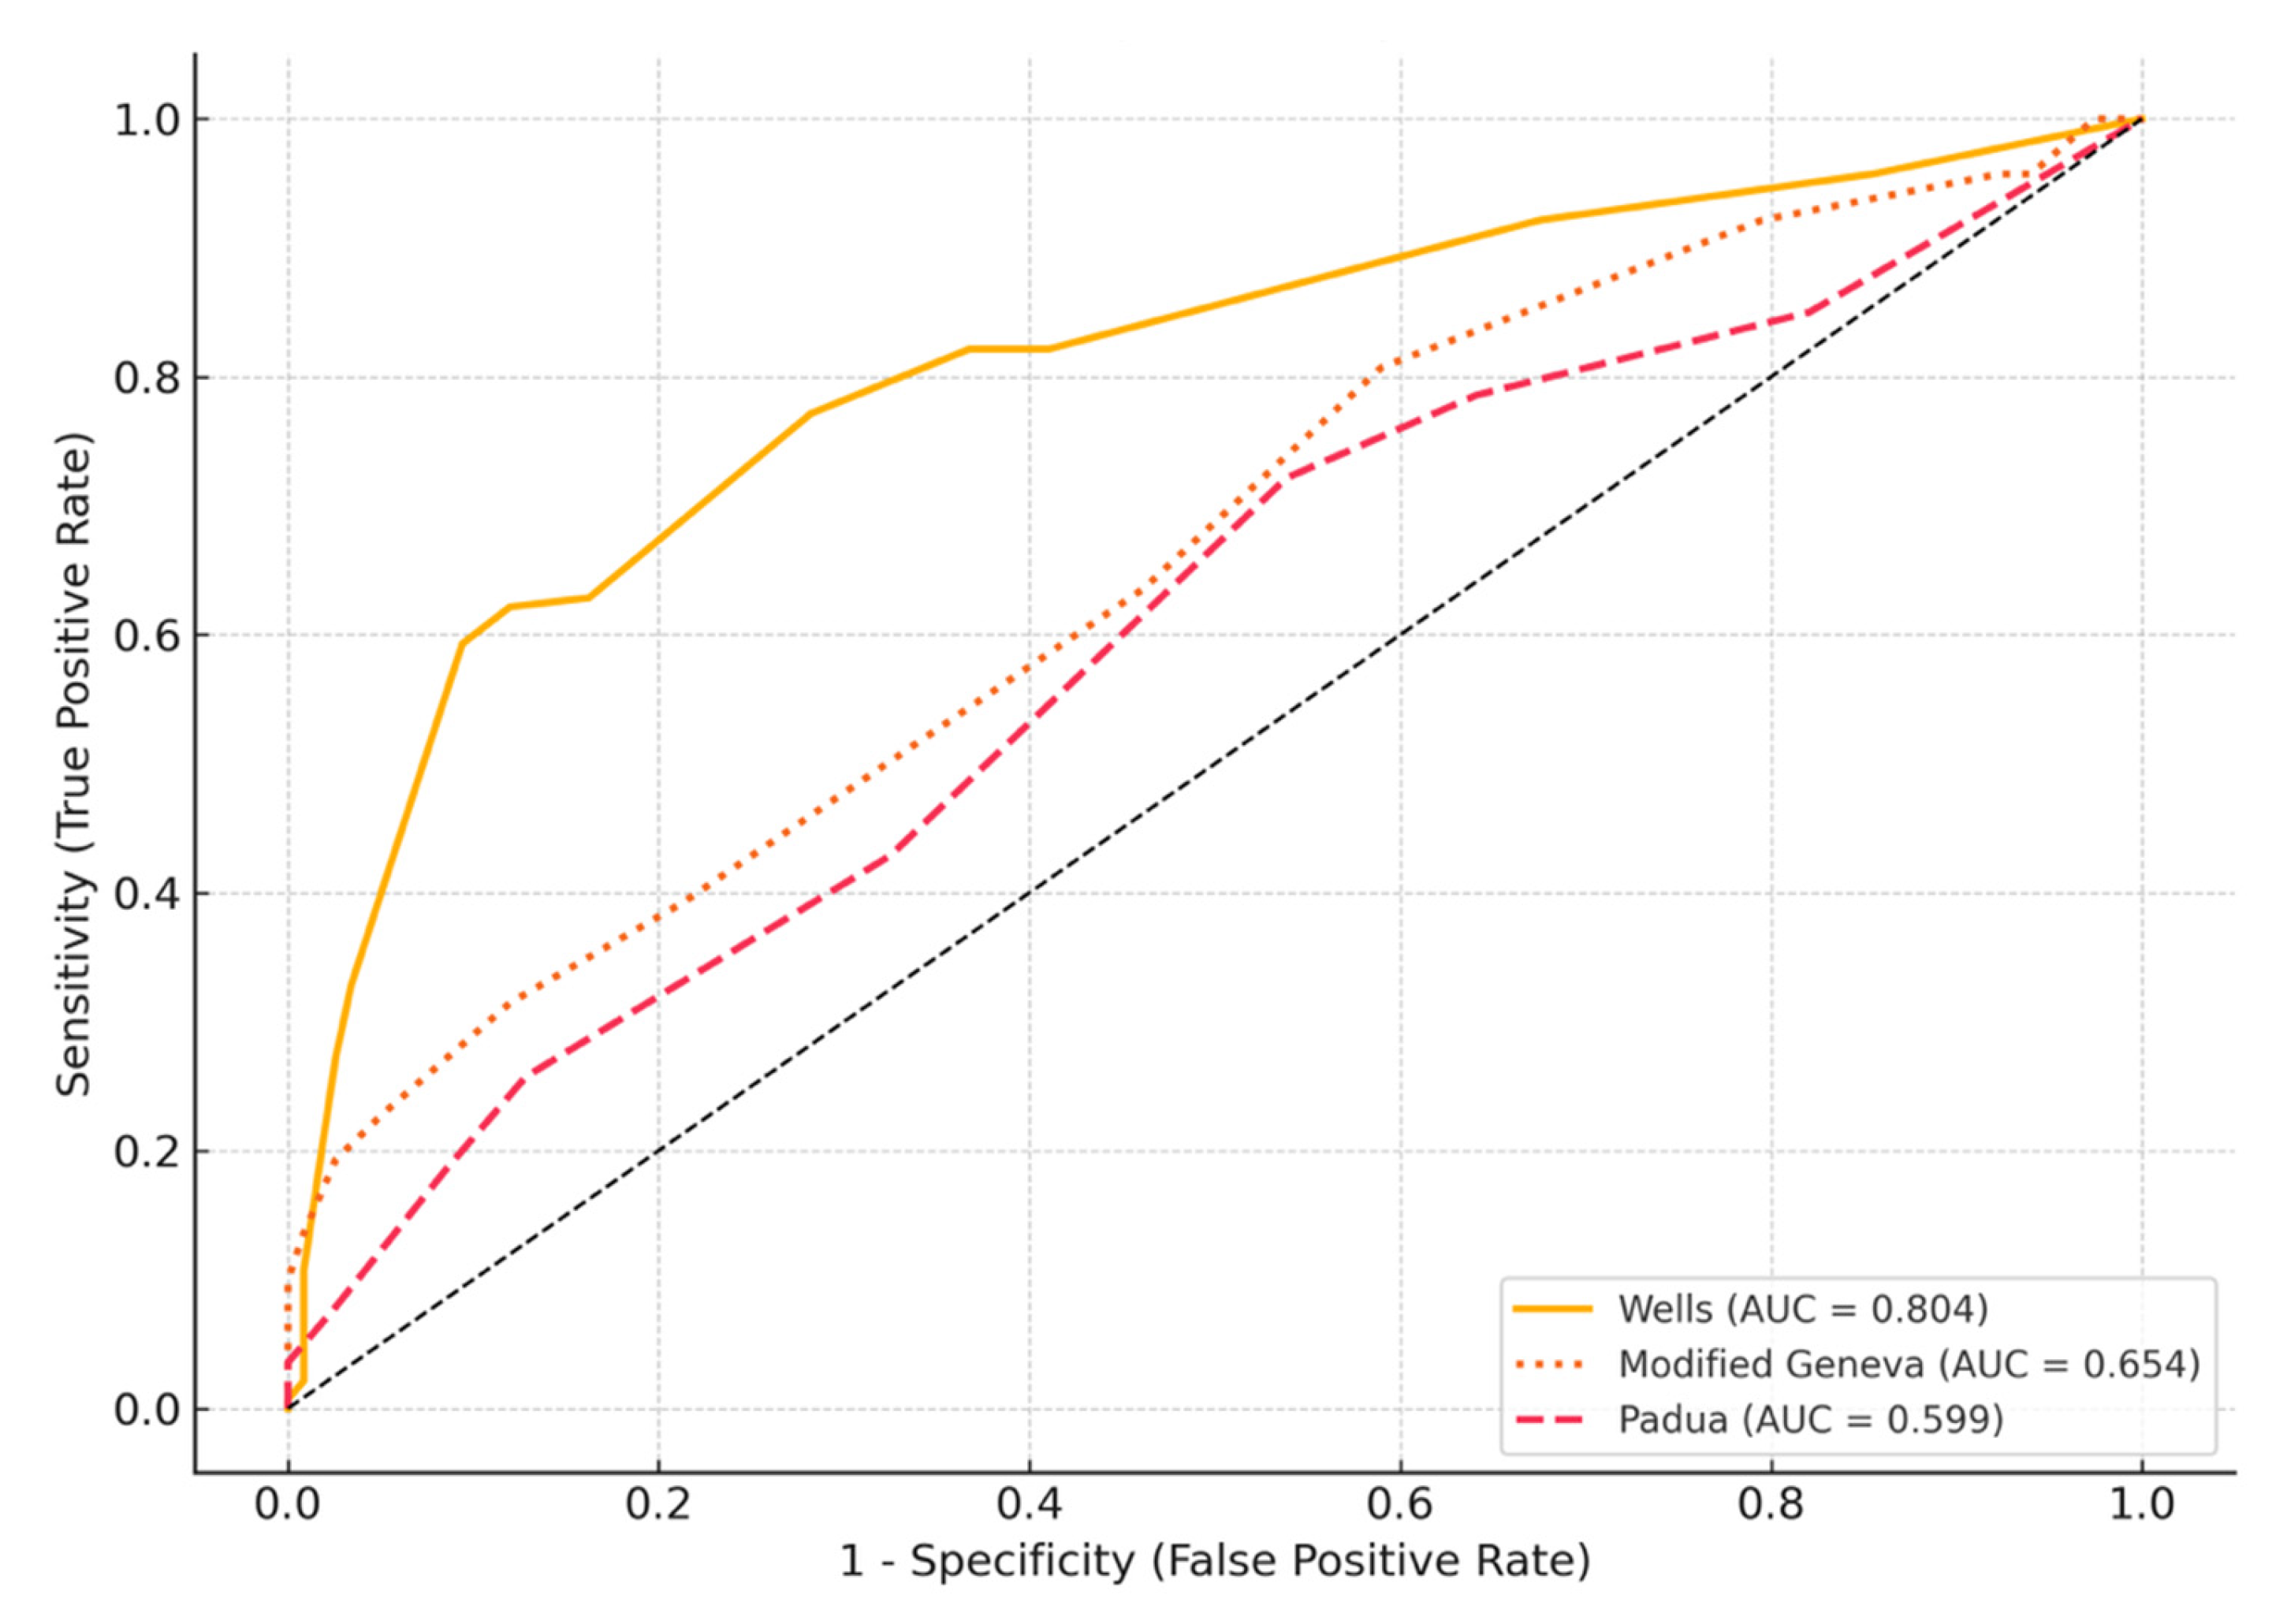
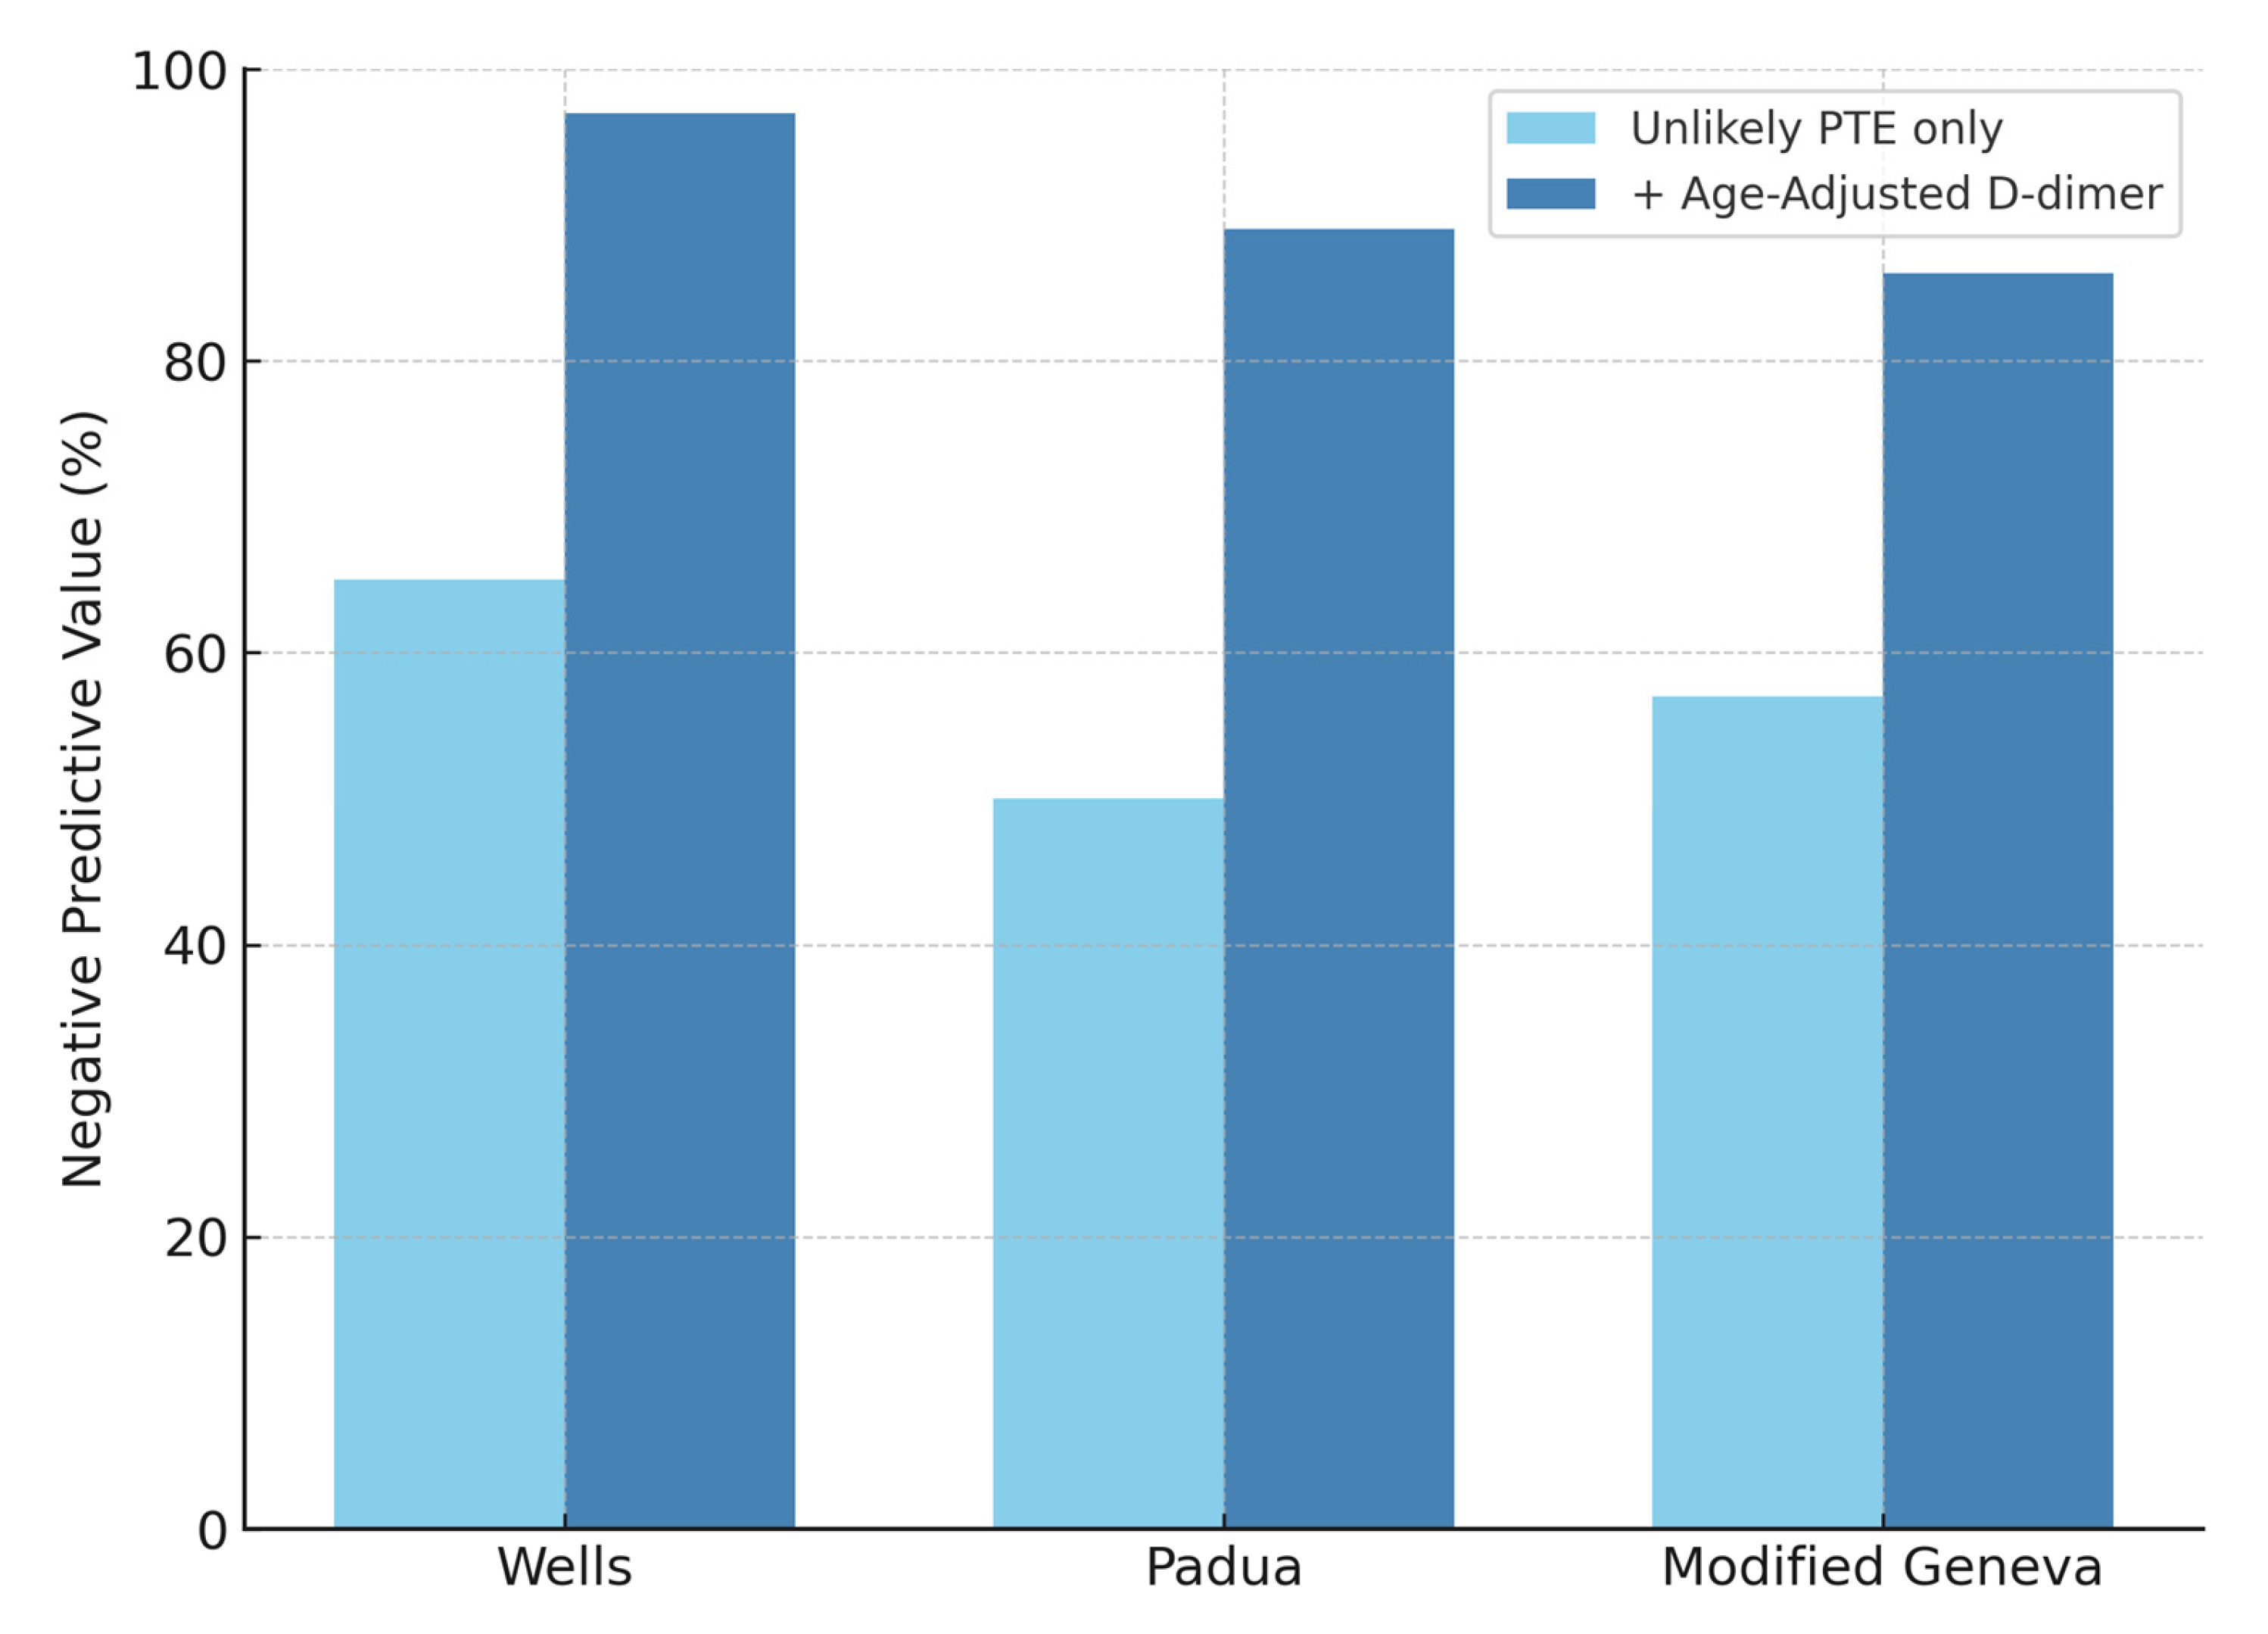
| Test | Sensitivity % (95% CI) | Specificity % (95% CI) | PPV % (95% CI) | NPV % (95% CI) |
|---|---|---|---|---|
| Wells | 60 (51.7–67.7) | 91 (83.9–94.7) | 88 (80.4–93.4) | 65 (57.8–72.3) |
| Padua | 47 (39.1–55.4) | 63 (54.2–71.4) | 61 (51.2–69.2) | 50 (42.0–58.0) |
| Modified Geneva | 69 (61.2–76.3) | 48 (39.0–56.8) | 61 (53.6–68.6) | 57 (46.7–65.9) |
| D-Dimer | 97 (92.9–98.9) | 34 (26.2–43.2) | 56 (57.2–70.0) | 92 (78.8–96.4) |
Disclaimer/Publisher’s Note: The statements, opinions and data contained in all publications are solely those of the individual author(s) and contributor(s) and not of MDPI and/or the editor(s). MDPI and/or the editor(s) disclaim responsibility for any injury to people or property resulting from any ideas, methods, instructions or products referred to in the content. |
© 2025 by the authors. Licensee MDPI, Basel, Switzerland. This article is an open access article distributed under the terms and conditions of the Creative Commons Attribution (CC BY) license (https://creativecommons.org/licenses/by/4.0/).
Share and Cite
Keskin, H.V.; Ozcelik, N.; Senturk Topaloglu, E.; Ozyurt, S.; Gumus, A.; Sahin, U. Which Is More Valuable in the Diagnosis of Pulmonary Thromboembolism? The Wells Score, the Revised Geneva Score, or the Padua Score? Life 2025, 15, 1115. https://doi.org/10.3390/life15071115
Keskin HV, Ozcelik N, Senturk Topaloglu E, Ozyurt S, Gumus A, Sahin U. Which Is More Valuable in the Diagnosis of Pulmonary Thromboembolism? The Wells Score, the Revised Geneva Score, or the Padua Score? Life. 2025; 15(7):1115. https://doi.org/10.3390/life15071115
Chicago/Turabian StyleKeskin, Hasan Veysel, Neslihan Ozcelik, Elvan Senturk Topaloglu, Songul Ozyurt, Aziz Gumus, and Unal Sahin. 2025. "Which Is More Valuable in the Diagnosis of Pulmonary Thromboembolism? The Wells Score, the Revised Geneva Score, or the Padua Score?" Life 15, no. 7: 1115. https://doi.org/10.3390/life15071115
APA StyleKeskin, H. V., Ozcelik, N., Senturk Topaloglu, E., Ozyurt, S., Gumus, A., & Sahin, U. (2025). Which Is More Valuable in the Diagnosis of Pulmonary Thromboembolism? The Wells Score, the Revised Geneva Score, or the Padua Score? Life, 15(7), 1115. https://doi.org/10.3390/life15071115