
Ginsenosides as Potential Natural Ligands of SLC3A2: Computational Insights in Cancer

Abstract
1. Introduction
2. Materials and Methods
2.1. Targets of SLC Family and Ginsenoside Acquisition
2.2. Gene Ontology (GO) Analysis and Kyoto Encyclopaedia of Genes and Genomes (KEGG) Pathway Analysis
2.3. Protein–Protein Interaction Network Construction
2.4. Expression Levels of the Target Proteins
2.5. Core Target Gene Expression and Survival Analysis
2.6. Ligand Selection and Preparation
2.7. Selection and Preparation of Protein Targets
2.8. Molecular Docking
2.9. Molecular Dynamics Simulation (MDS) Studies
ADMET Studies
3. Results
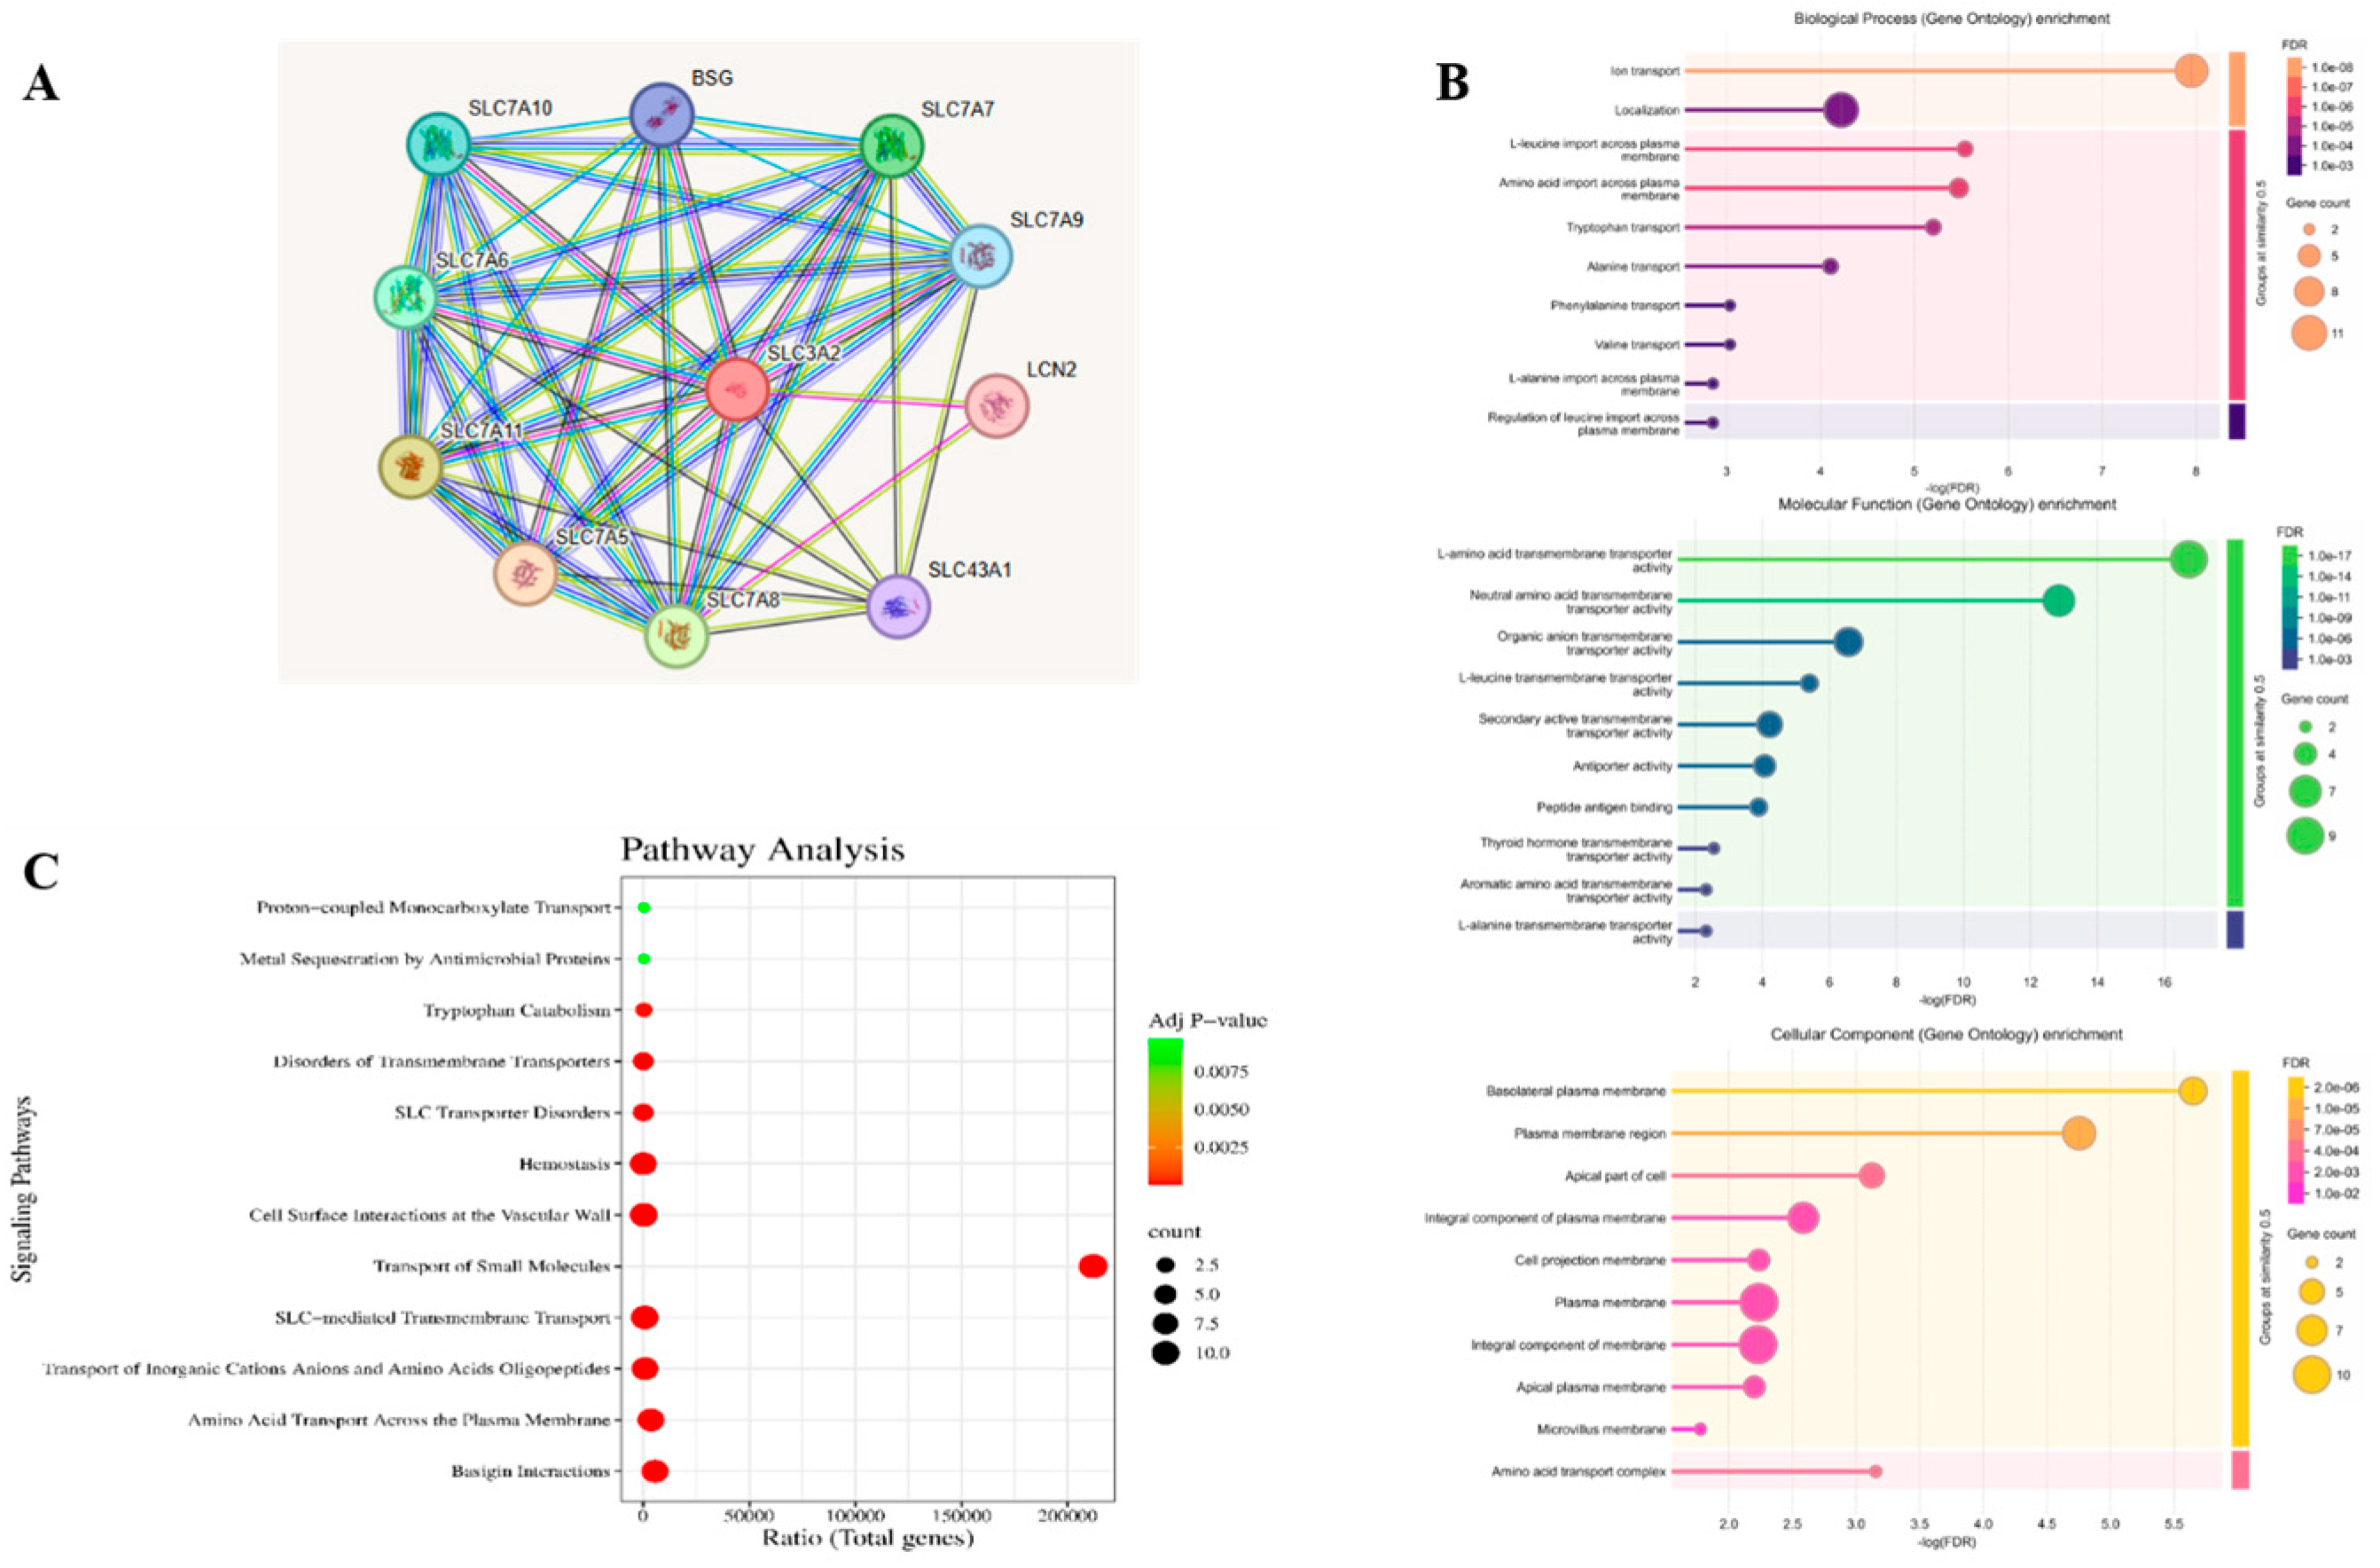
3.1. Retrieval of Target Proteins from the SLC Family Linked with Cancer and from GO Analysis and KEGG Pathway Analysis
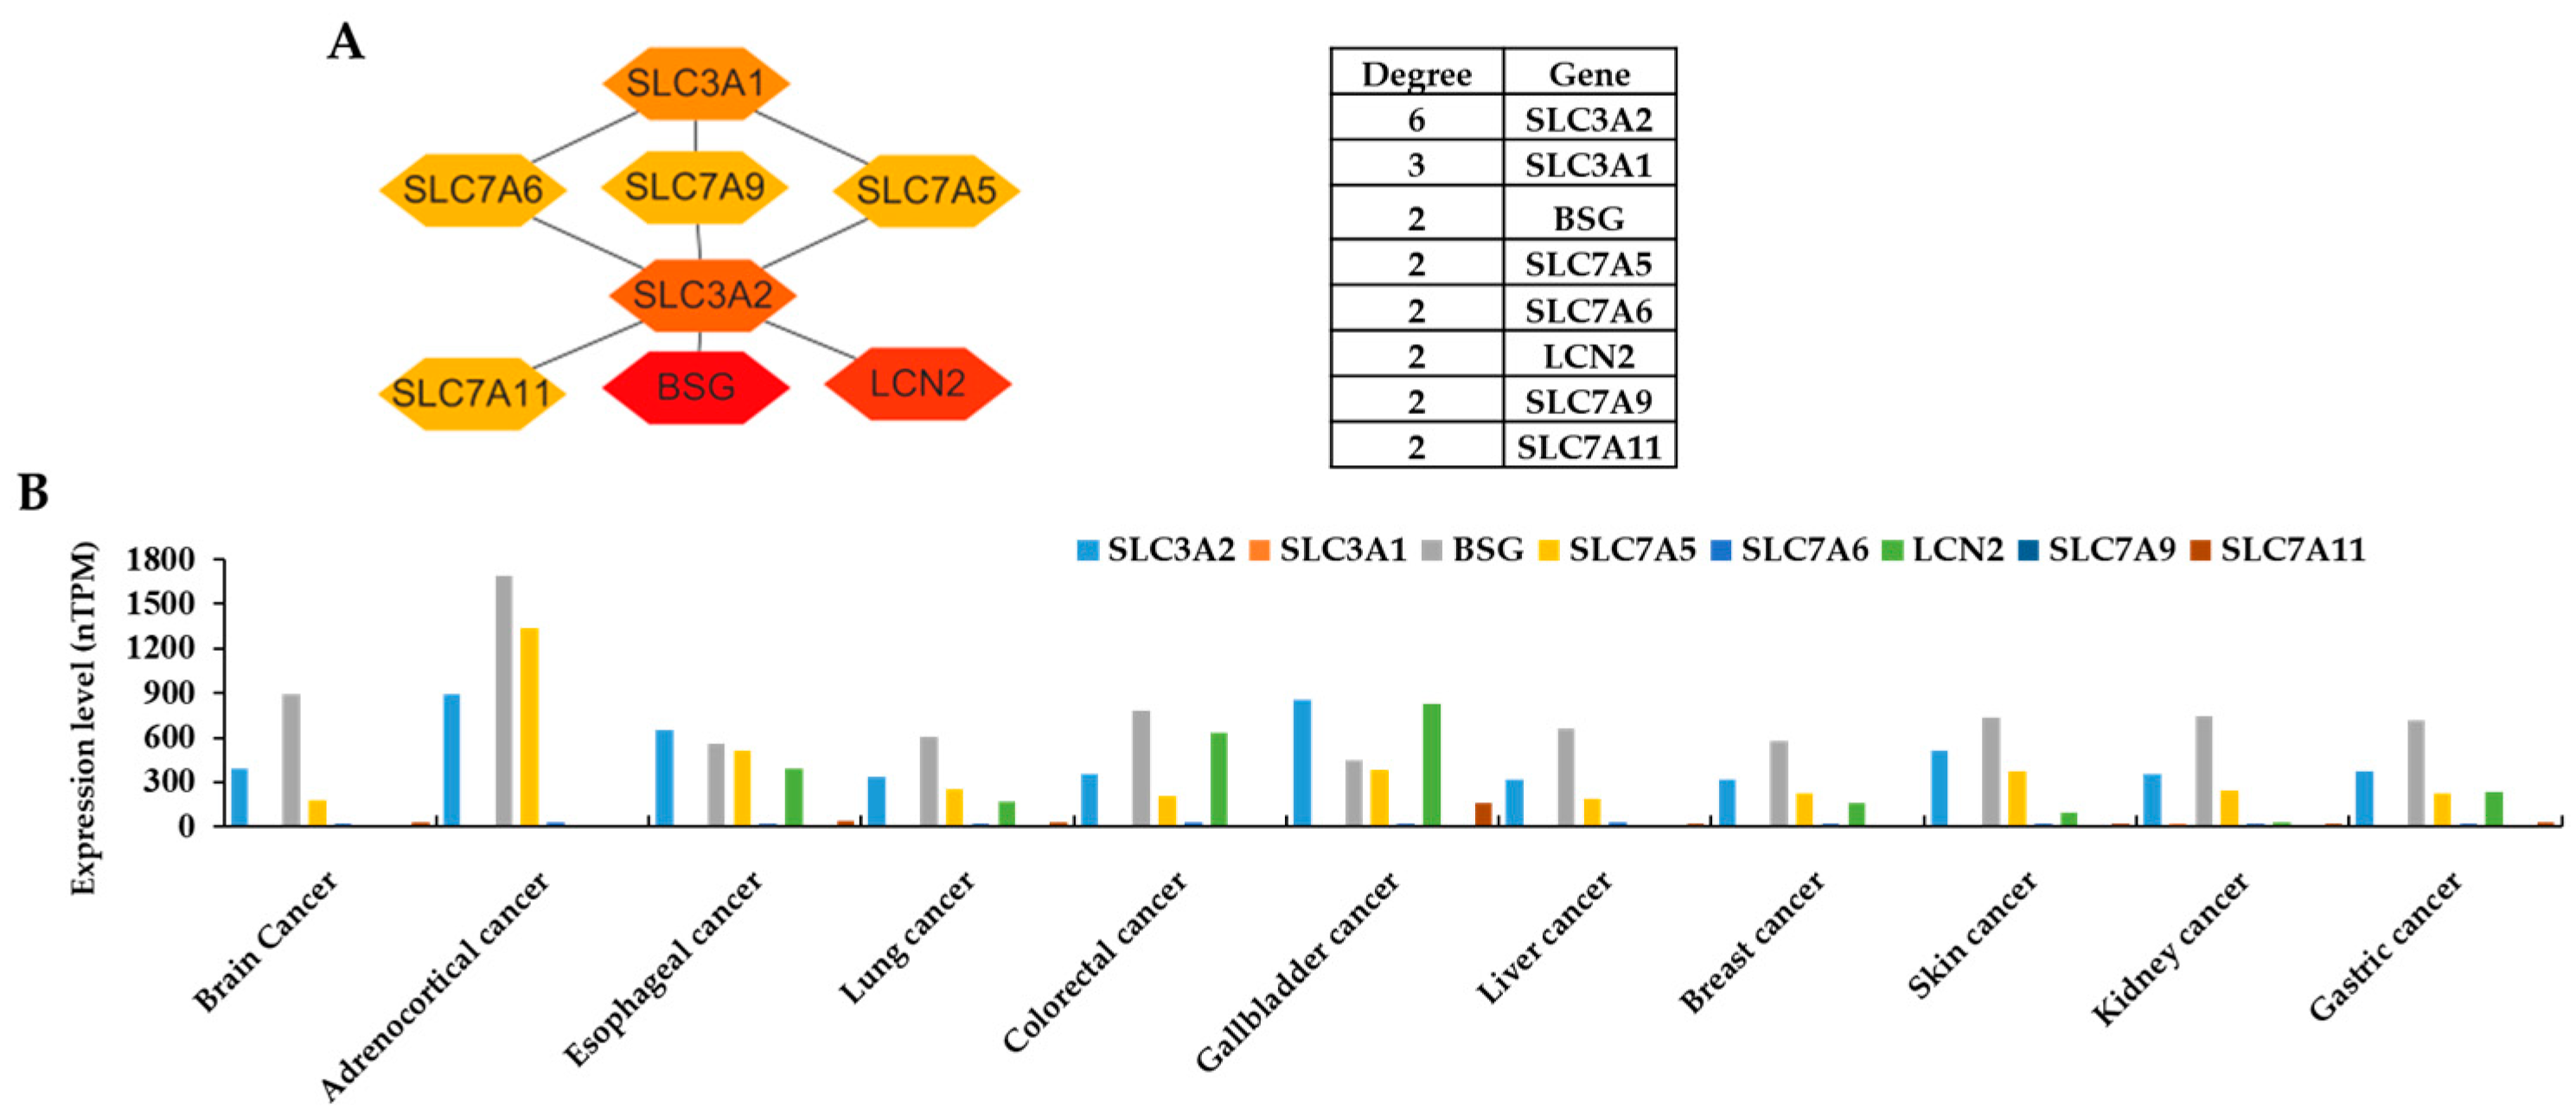
3.2. Protein–Protein Interaction (PPI) Network and the Expression Levels of Hub Genes
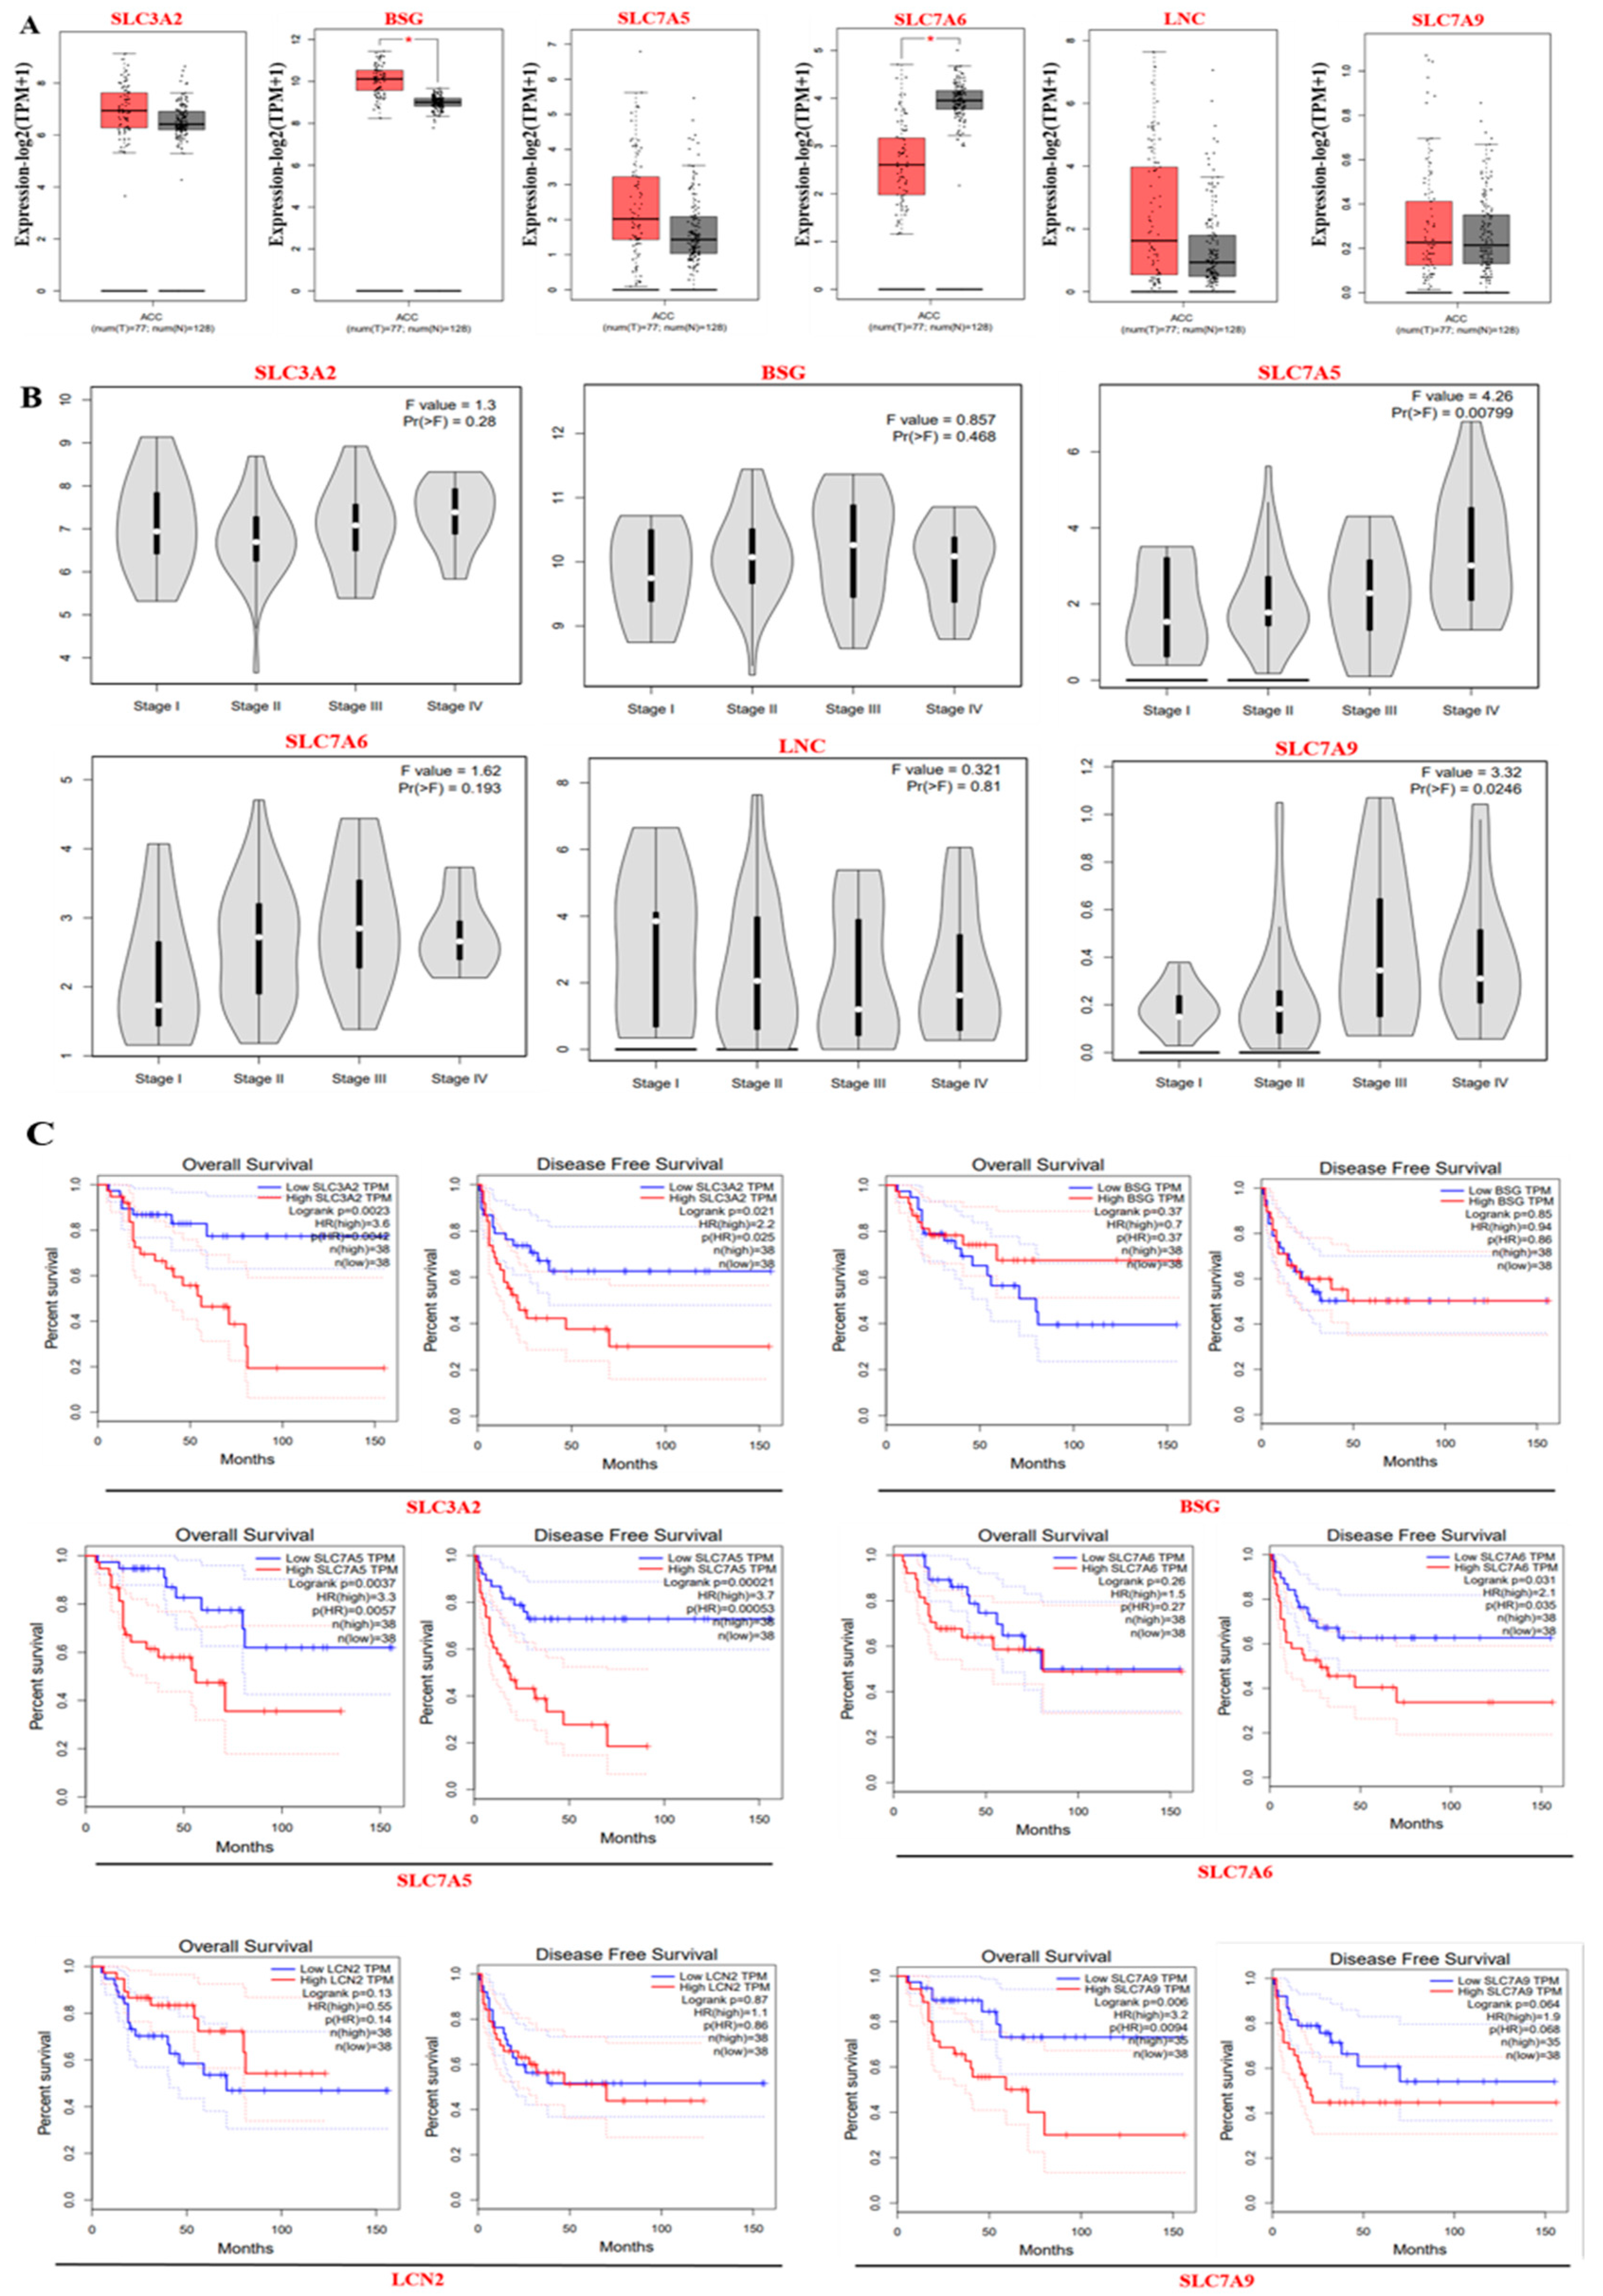
3.3. Gene Expression and Survival Analysis of ACC Core Targets
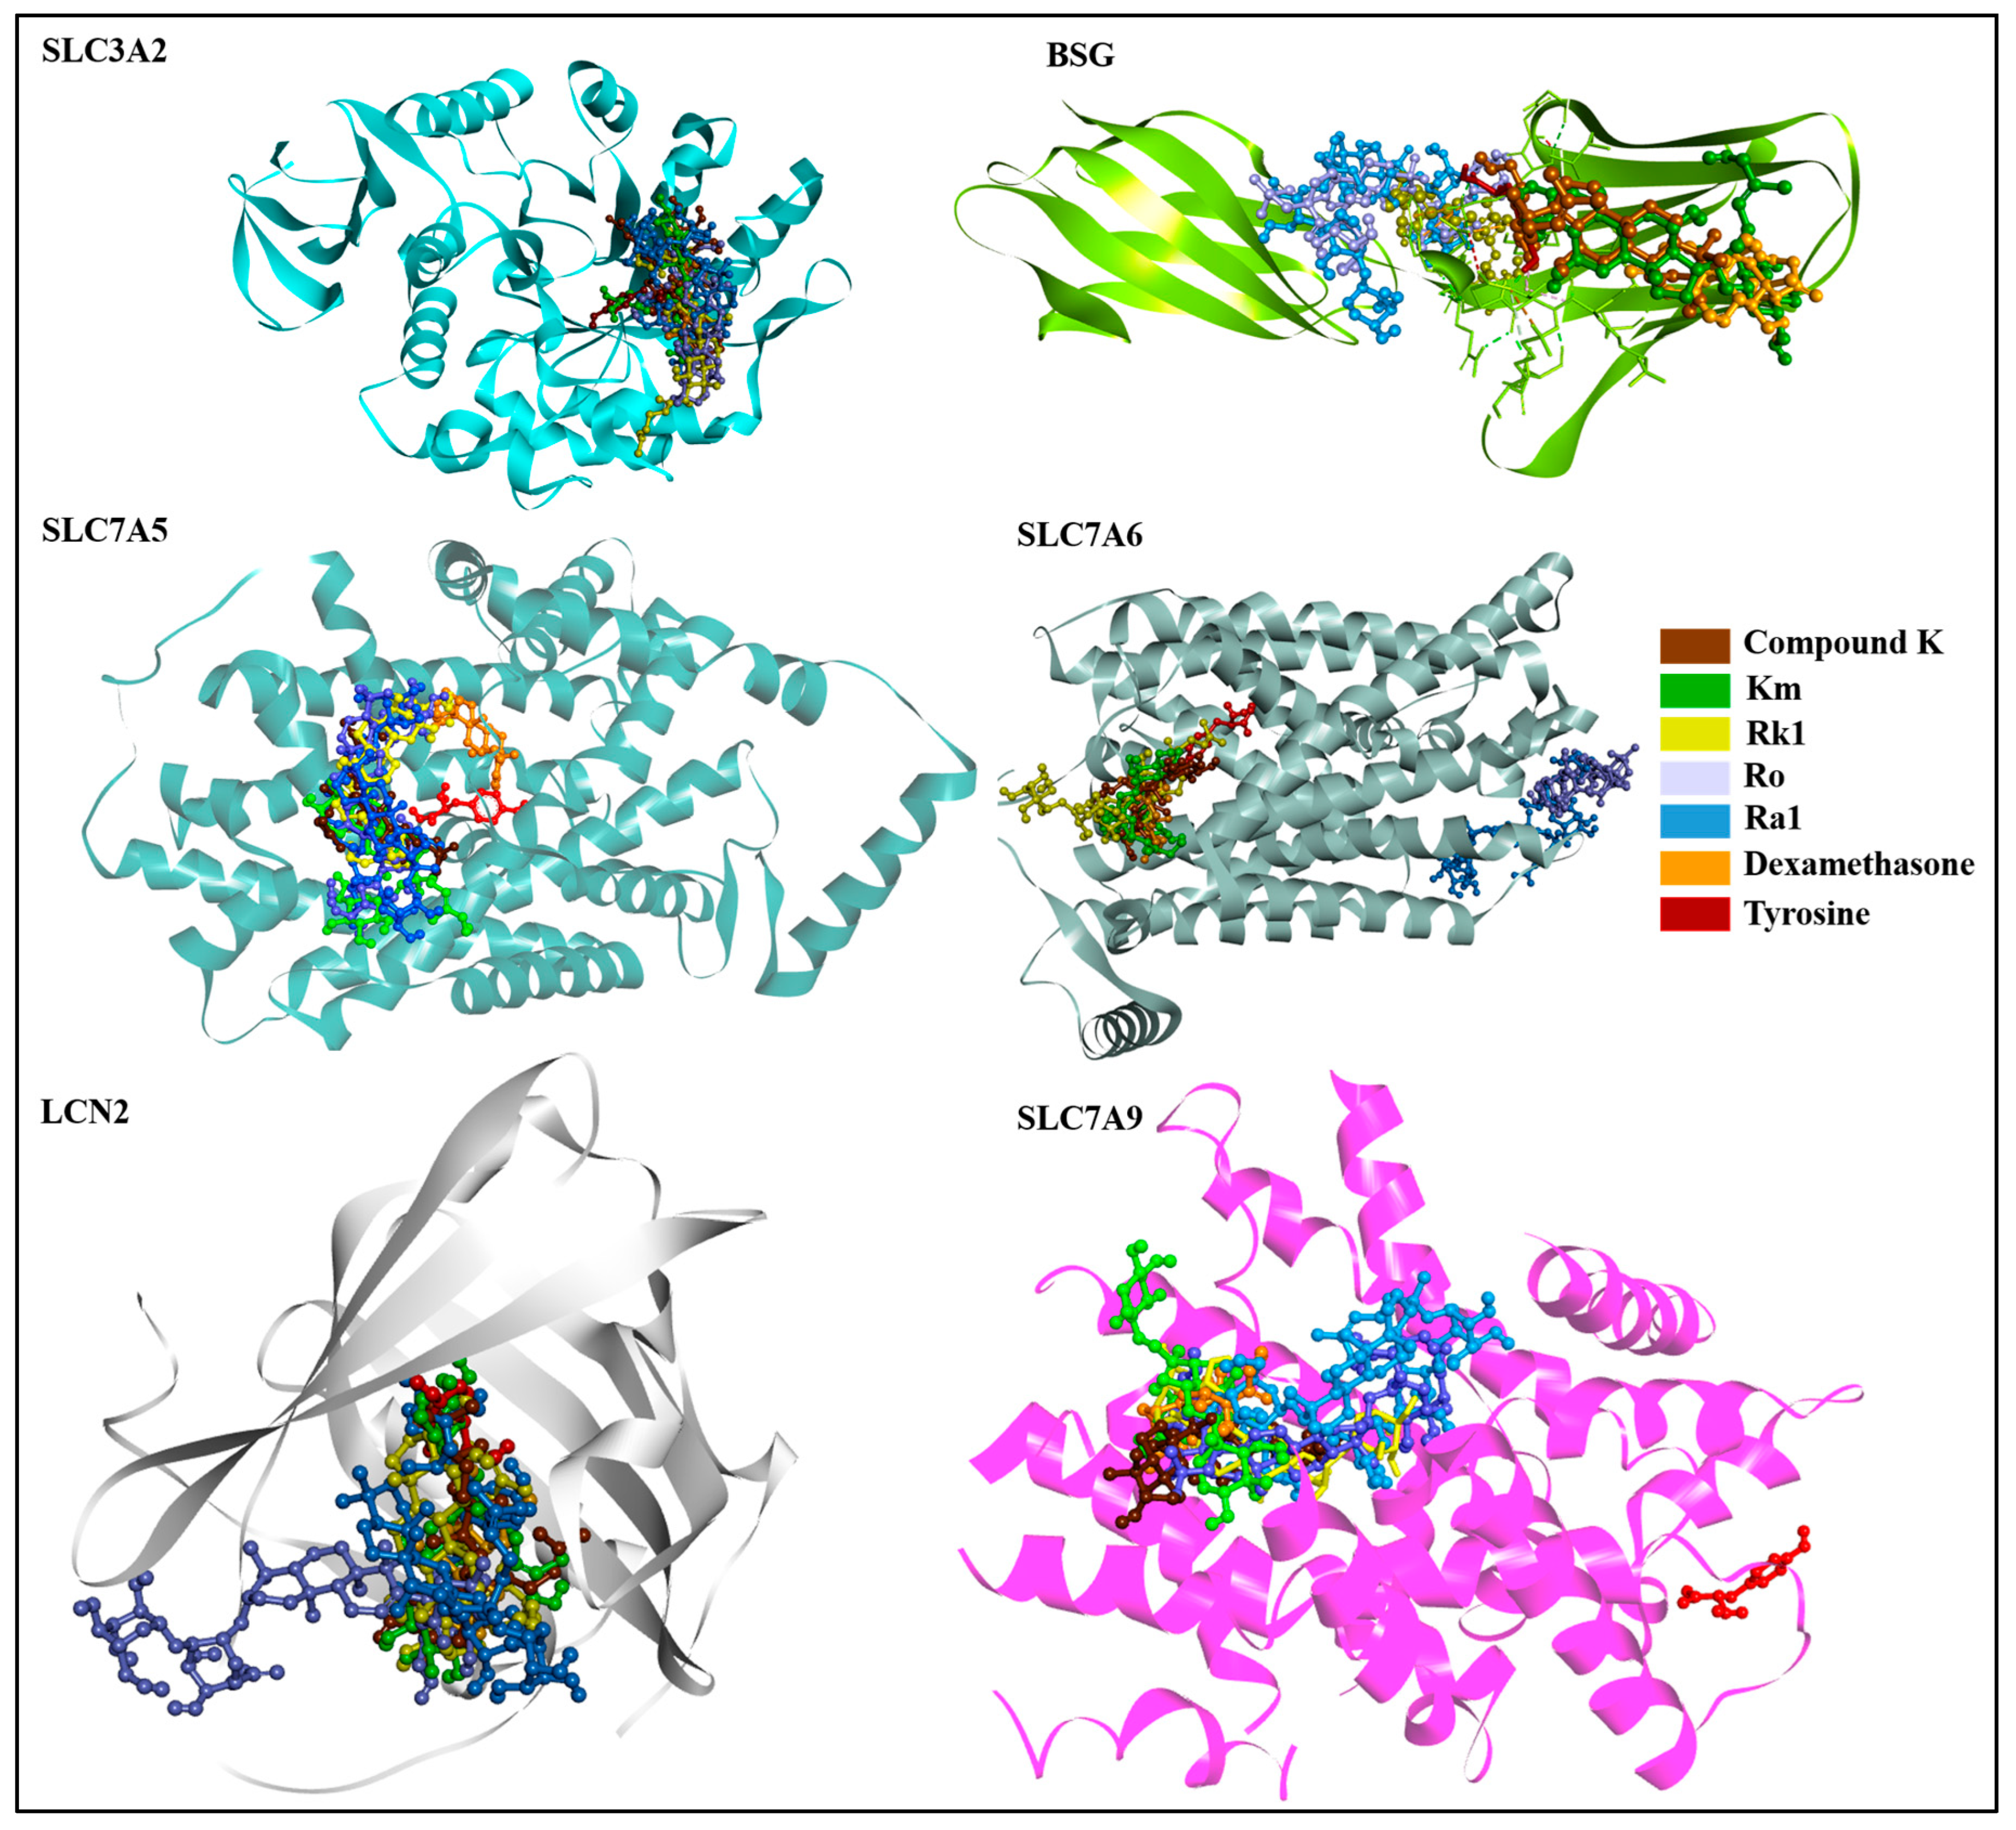
3.4. Molecular Docking-Based Virtual Screening
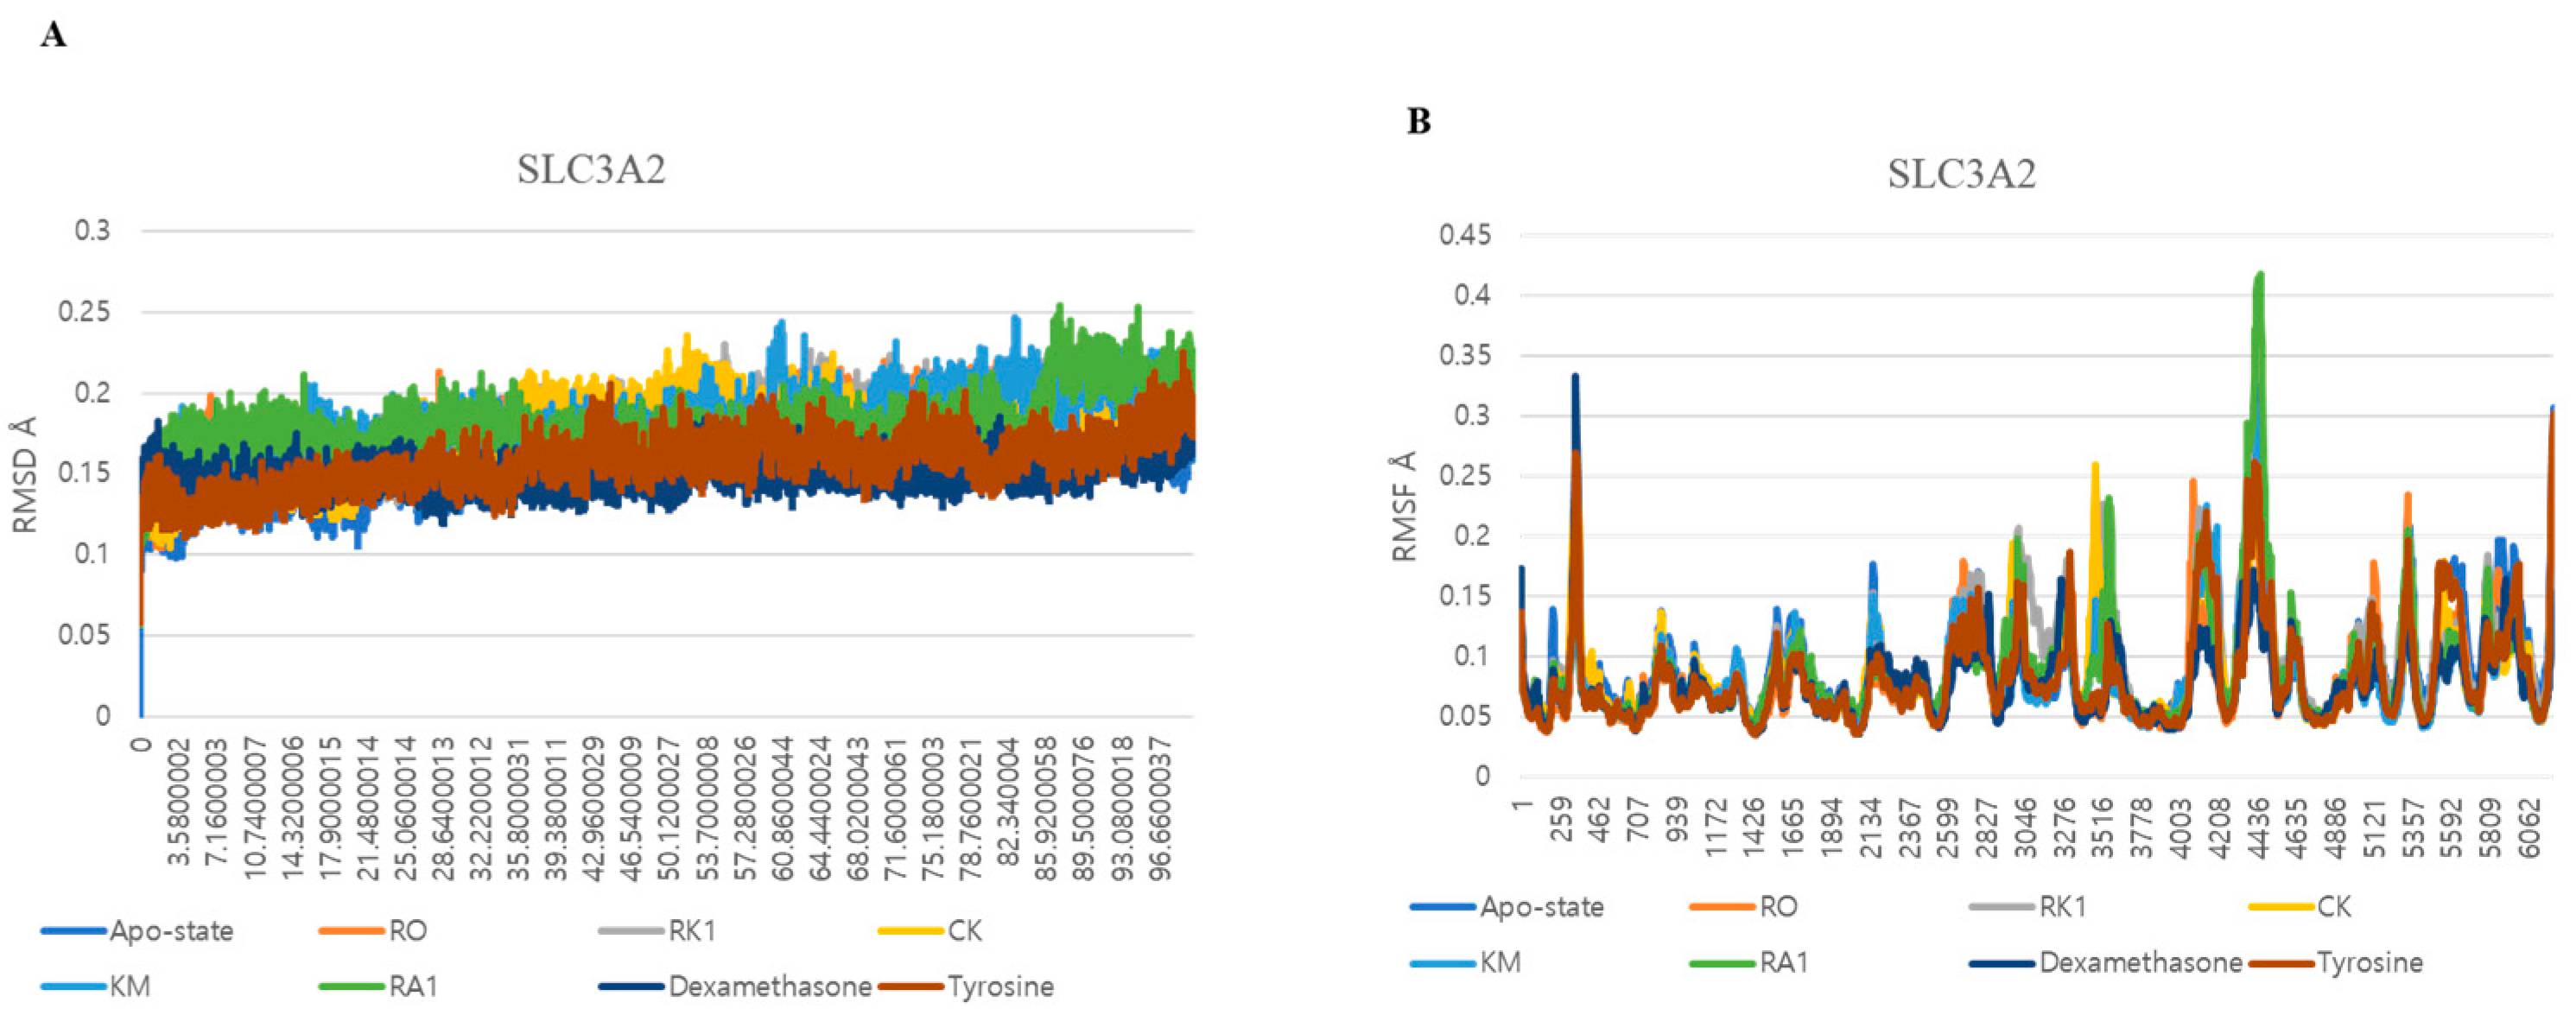
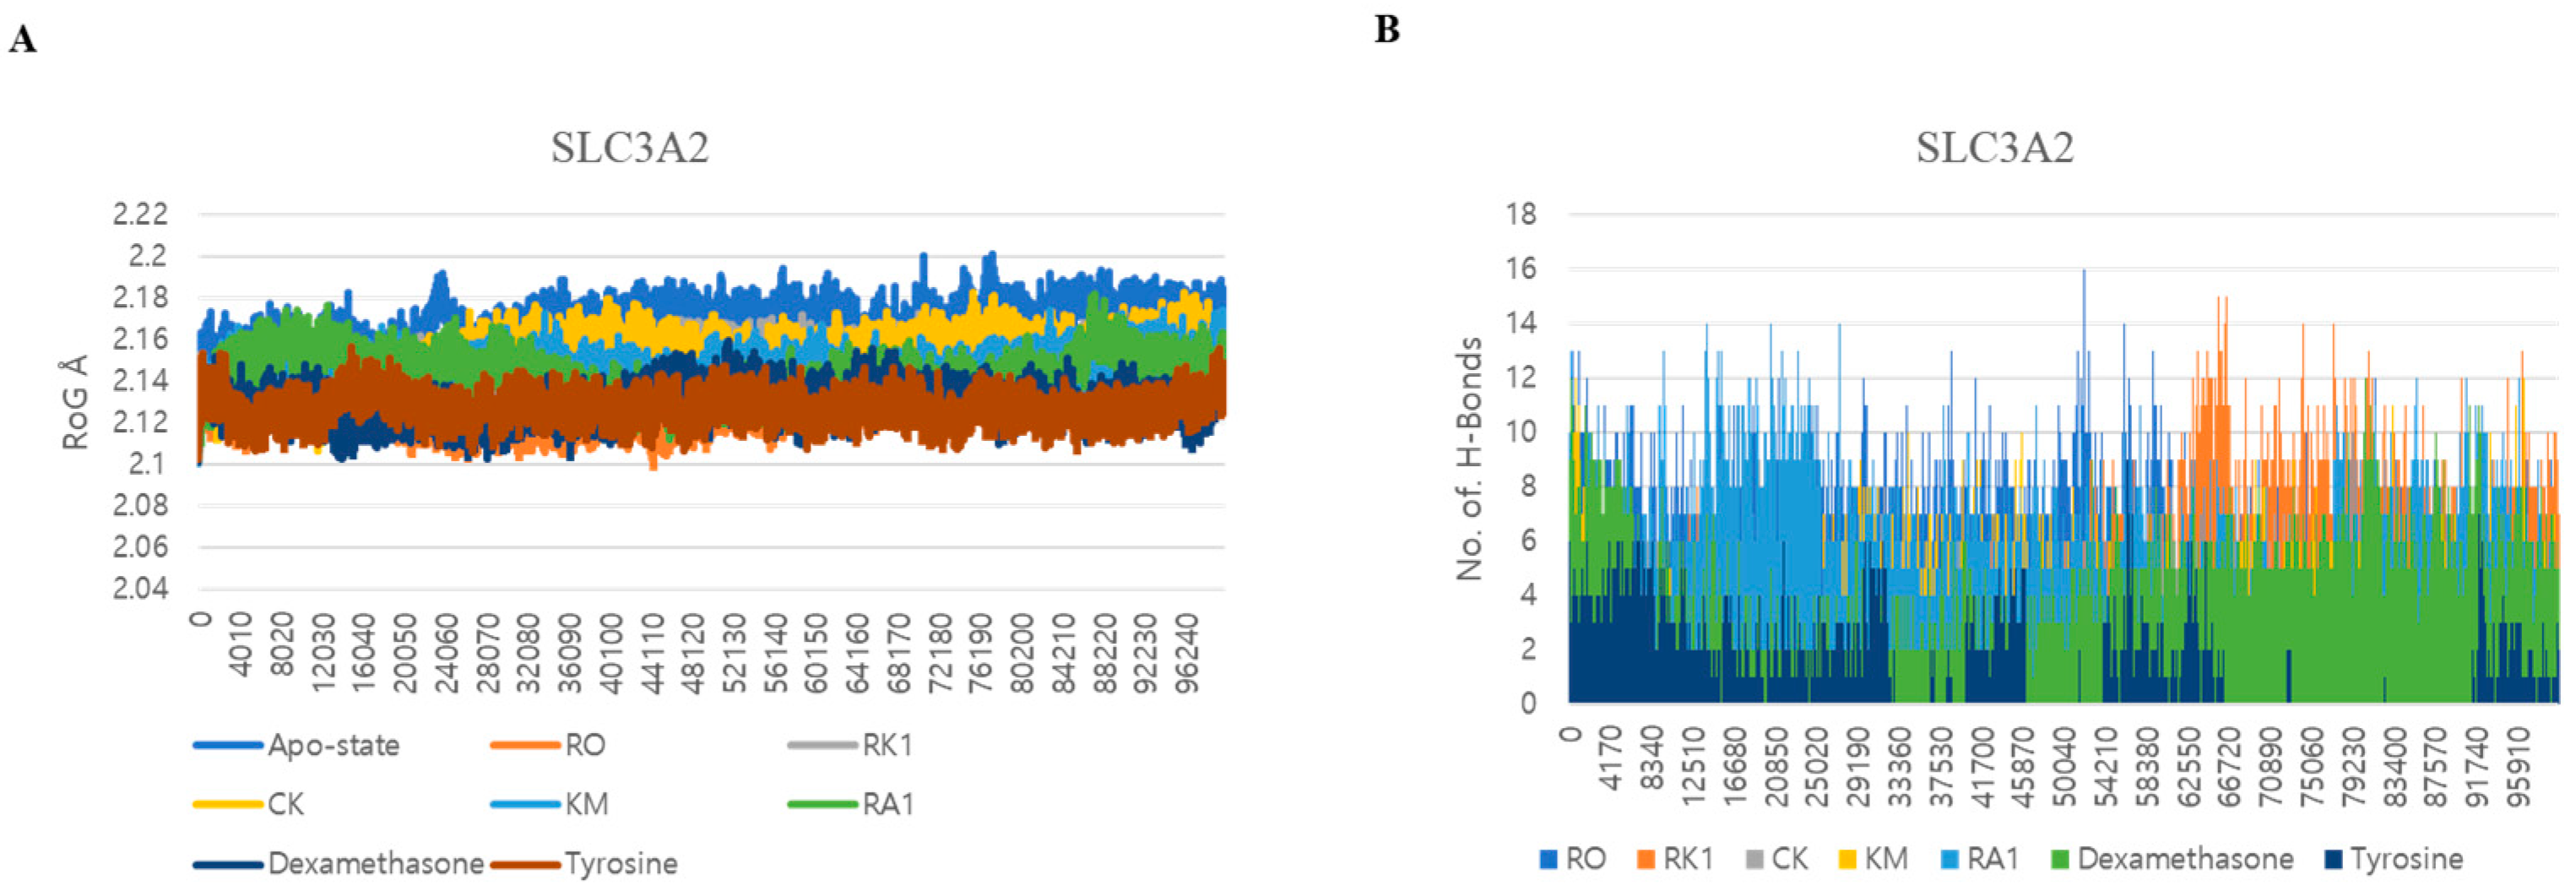
3.5. Dynamic Interactions and Stability Analysis of SLC3A2 Protein
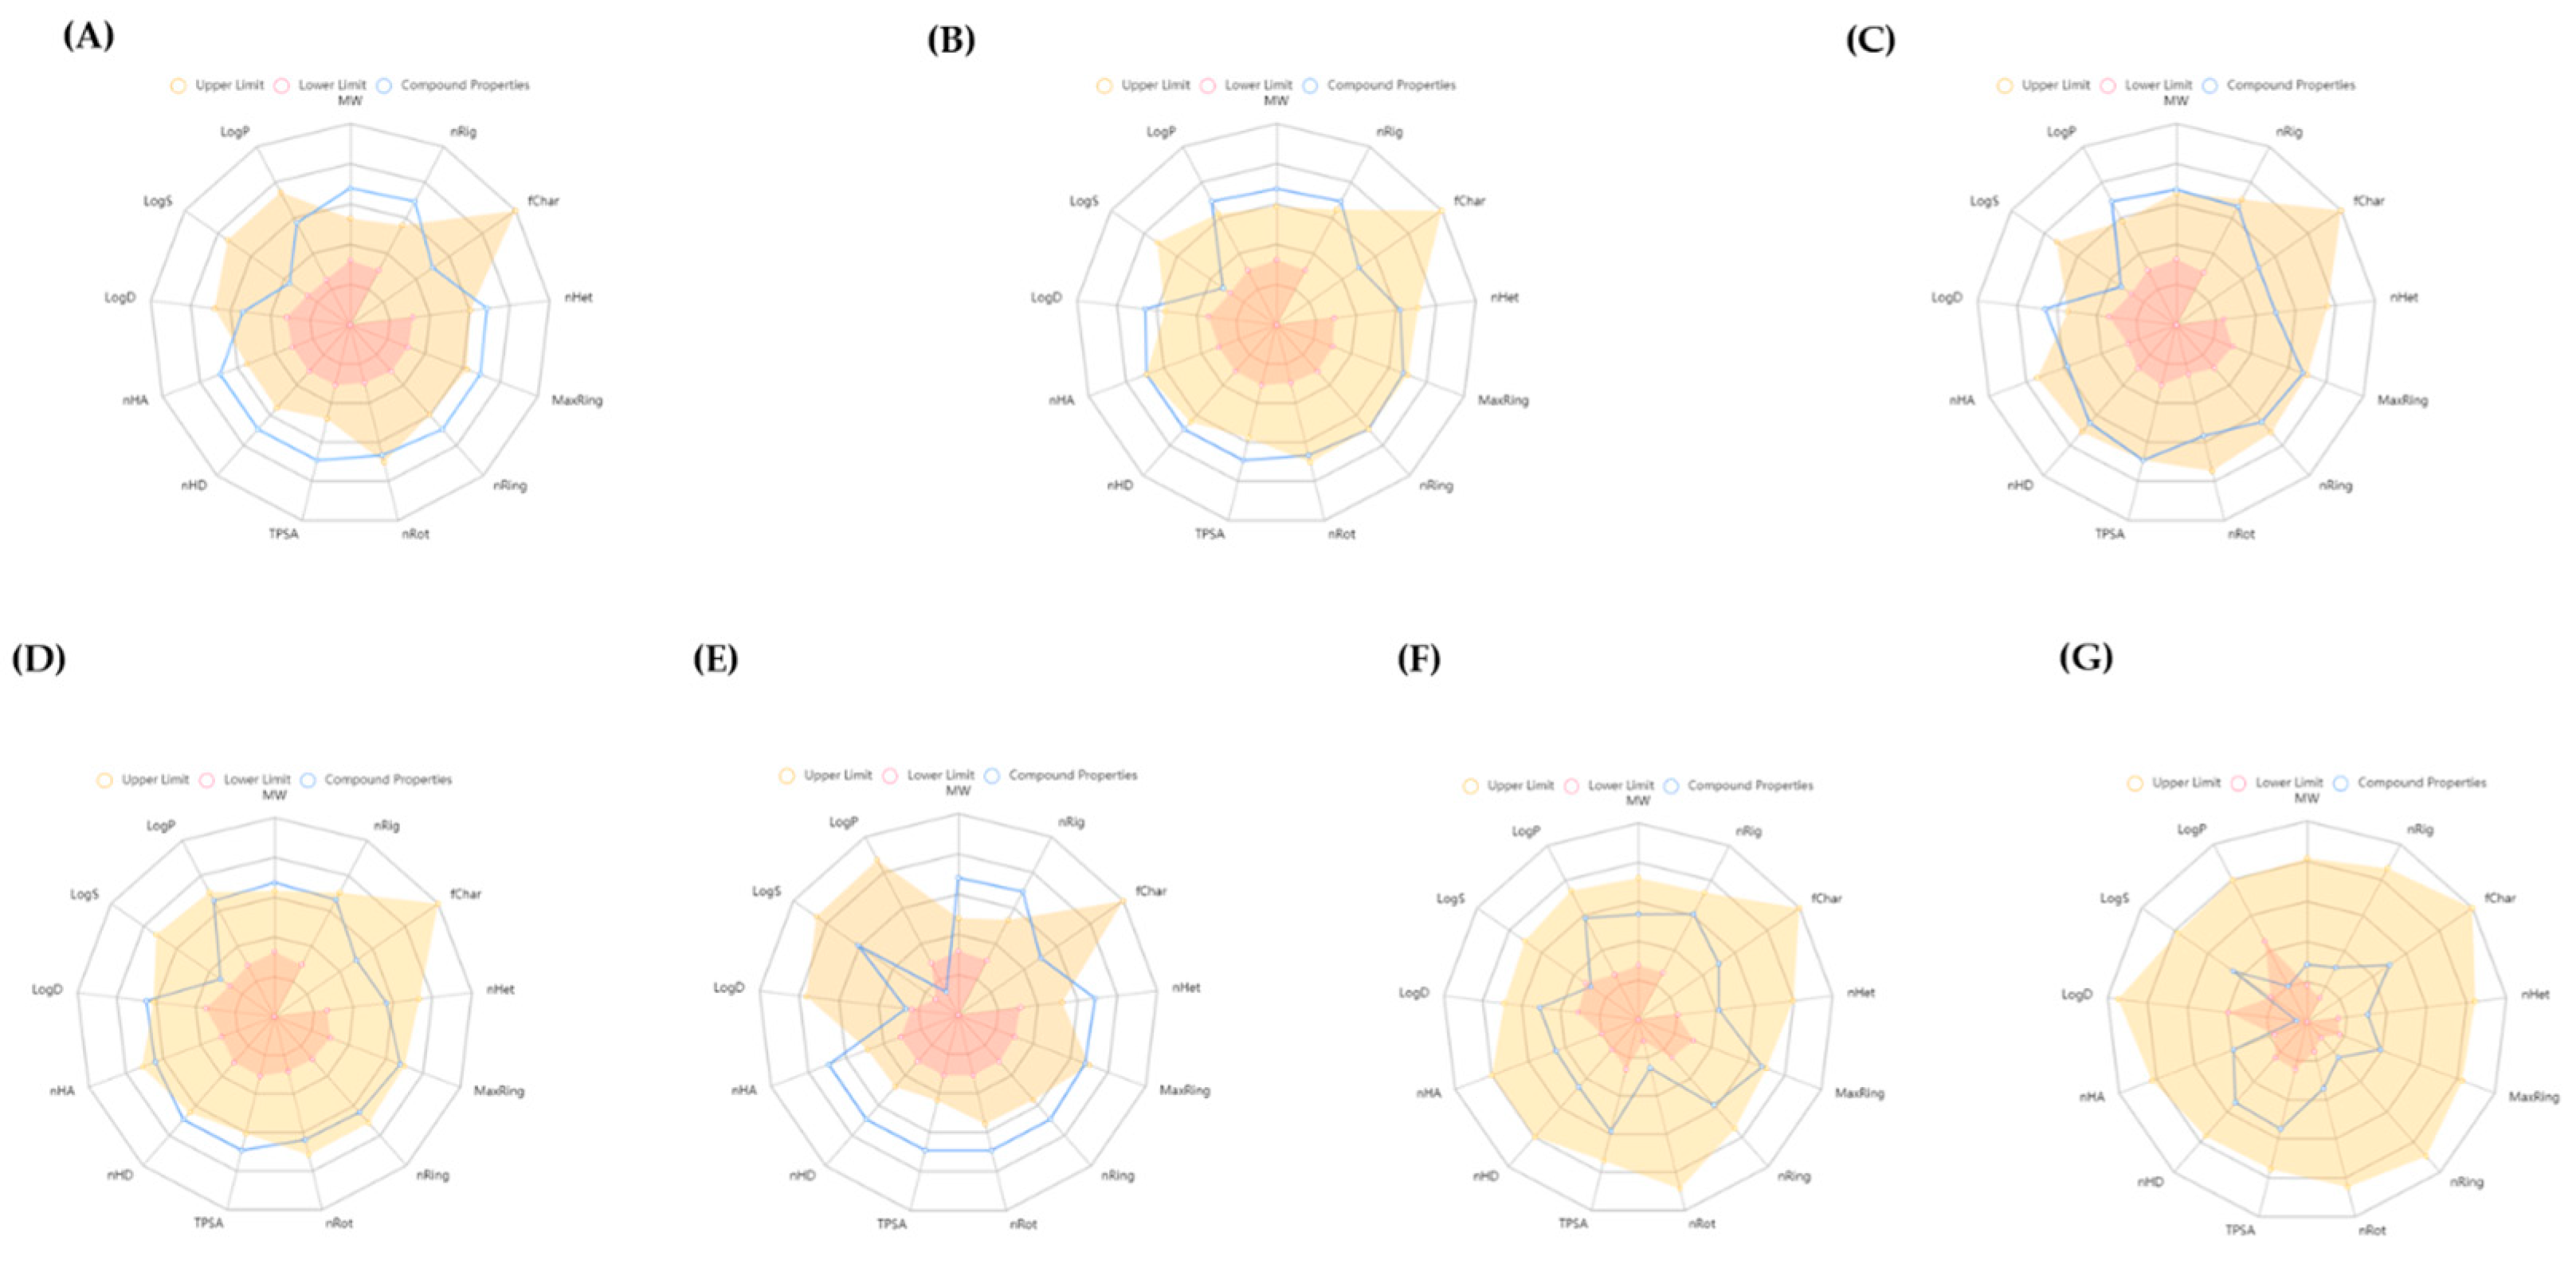
3.6. ADMET Study
4. Discussion
5. Conclusions
Supplementary Materials
Funding
Institutional Review Board Statement
Informed Consent Statement
Data Availability Statement
Acknowledgments
Conflicts of Interest
References
- Kim, L.C.; Cook, R.S.; Chen, J. mTORC1 and mTORC2 in cancer and the tumor microenvironment. Oncogene 2017, 36, 2191–2201. [Google Scholar] [CrossRef] [PubMed]
- Yang, M.; Brackenbury, W.J. Membrane potential and cancer progression. Front. Physiol. 2013, 4, 185. [Google Scholar] [CrossRef] [PubMed]
- Bhutia, Y.; Ganapathy, V. Glutamine transporters in mammalian cells and their functions in physiology and cancer. Biochim. Biophys. Acta BBA Mol. Cell Res. 2016, 1863, 2531–2539. [Google Scholar] [CrossRef] [PubMed]
- César-Razquin, A.; Snijder, B.; Frappier-Brinton, T.; Isserlin, R.; Gyimesi, G.; Bai, X.; Superti-Furga, G. A Call for Systematic Research on Solute Carriers. Cell 2015, 162, 478–487. [Google Scholar] [CrossRef]
- Häfliger, P.; Charles, R.-P. The L-type amino acid transporter LAT1—An emerging target in cancer. Int. J. Mol. Sci. 2019, 20, 2428. [Google Scholar] [CrossRef]
- Kaira, K.; Oriuchi, N.; Imai, H.; Shimizu, K.; Yanagitani, N.; Sunaga, N. L-type amino acid transporter 1 and CD98 expression in primary and metastatic sites of human neoplasms. Cancer Sci. 2008, 99, 2380–2386. [Google Scholar] [CrossRef]
- Scalise, M.; Pochini, L.; Pingitore, P.; Hedfalk, K.; Indiveri, C. Functional properties of SLC transporters: New perspectives in structural and transport mechanisms. Biochim. Biophys. Acta BBA Gen. Subj. 2018, 1862, 1386–1396. [Google Scholar]
- Wang, Q.; Holst, J. L-type amino acid transport and cancer: Targeting the mTORC1 pathway to inhibit neoplasia. Am. J. Cancer Res. 2015, 5, 1281–1294. [Google Scholar]
- Maimaiti, A.; Mukaisho, K.; Yokoyama, S. CD98hc (SLC3A2) as a molecular target for cancer therapy: Focus on triple-negative breast cancer. Int. J. Mol. Sci. 2022, 23, 4123. [Google Scholar]
- Fuchs, B.; Bode, B. Amino acid transporters ASCT2 and LAT1 in cancer: Partners in crime? Semin. Cancer Biol. 2005, 15, 254–266. [Google Scholar] [CrossRef]
- Yan, R.; Zhao, X.; Lei, J.; Zhou, Q. Structure of the human LAT1–4F2hc heteromeric amino acid transporter complex. Nat. Struct. Mol. Biol. 2019, 26, 510–517. [Google Scholar] [CrossRef] [PubMed]
- Kobayashi, K. CD98hc as a novel prognostic marker and its therapeutic potential in head and neck squamous cell carcinoma. Cancer Med. 2011, 6, 2342–2351. [Google Scholar]
- Cantor, J.; Ginsberg, M. CD98 at the crossroads of adaptive immunity and cancer. J. Cell Sci. 2012, 125, 1373–1382. [Google Scholar] [CrossRef]
- Feral, C.C.; Nishiya, N.; Fenczik, C.A.; Stuhlmann, H.; Slepak, M.; Ginsberg, M.H. CD98hc (SLC3A2) mediates integrin signaling. Proc. Natl. Acad. Sci. USA 2005, 102, 355–360. [Google Scholar] [CrossRef] [PubMed]
- Morshed, M.N.; Ahn, J.C.; Mathiyalagan, R.; Rupa, E.J.; Akter, R.; Karim, M.R.; Jung, D.H.; Yang, D.U.; Yang, D.C.; Jung, S.K. Antioxidant Activity of Panax ginseng to Regulate ROS in Various Chronic Diseases. Appl. Sci. 2023, 13, 2893. [Google Scholar] [CrossRef]
- Mathiyalagan, R.; Murugesan, M.; Ramadhania, Z.M.; Nahar, J.; Manivasagan, P.; Boopathi, V.; Jang, E.-S.; Yang, D.C.; Conde, J.; Thambi, T. Triterpenoid saponin-based supramolecular host-guest injectable hydrogels inhibit the growth of melanoma via ROS-mediated apoptosis. Mater. Sci. Eng. R Rep. 2024, 160, 100824. [Google Scholar] [CrossRef]
- Ahn, J.C.; Mathiyalagan, R.; Nahar, J.; Ramadhania, Z.M.; Kong, B.M.; Lee, D.-W.; Choi, S.K.; Lee, C.S.; Boopathi, V.; Yang, D.U.; et al. Transcriptome expression profile of compound-K-enriched red ginseng extract (DDK-401) in Korean volunteers and its apoptotic properties. Front. Pharmacol. 2022, 13, 999192. [Google Scholar] [CrossRef]
- Li, X.; Cao, D.; Sun, S.; Wang, Y. Anticancer therapeutic effect of ginsenosides through mediating reactive oxygen species. Front. Pharmacol. 2023, 14, 1215020. [Google Scholar] [CrossRef]
- Zheng, S.W.; Xiao, S.Y.; Wang, J.; Hou, W.; Wang, Y.P. Inhibitory effects of ginsenoside Ro on the growth of B16F10 melanoma via its metabolites. Molecules 2019, 24, 2985. [Google Scholar] [CrossRef]
- Kim, J.; Yi, Y.; Kim, M.; Cho, J. Role of ginsenosides, the main active components of Panax ginseng, in inflammatory responses and diseases. J. Ginseng Res. 2019, 43, 11–21. [Google Scholar] [CrossRef]
- Wang, Y.; Liu, Y.; Zhang, X.-Y.; Xu, L.-H.; Ouyang, D.-Y.; Liu, K.-P.; Pan, H.; He, J.; He, X.-H. Ginsenoside Rg1 regulates innate immune responses in macrophages through differentially modulating the NF-κB and PI3K/Akt/mTOR pathways. Int. Immunopharmacol. 2014, 23, 77–84. [Google Scholar] [CrossRef] [PubMed]
- Xia, W.; Zhu, Z.; Xiang, S.; Yang, Y. Ginsenoside Rg5 promotes wound healing in diabetes by reducing the negative regulation of SLC7A11 on the efferocytosis of dendritic cells. J. Ginseng Res. 2023, 47, 784–794. [Google Scholar] [CrossRef]
- Yanagida, O.; Kanai, Y.; Chairoungdua, A.; Kim, D.K.; Segawa, H.; Nii, T.; Cha, S.H.; Matsuo, H.; Fukushima, J.-i.; Fukasawa, Y.; et al. Human L-type amino acid transporter 1 (LAT1): Characterization of function and expression in tumor cell lines. Biochim. Biophys. Acta BBA Biomembr. 2001, 1514, 291–302. [Google Scholar] [CrossRef]
- Locasale, J.W. Serine, glycine and one-carbon units: Cancer metabolism in full circle. Nat. Rev. Cancer 2013, 13, 572–583. [Google Scholar] [CrossRef]
- Morshed, M.N.; Karim, M.R.; Akter, R.; Iqbal, S.; Mathiyalagan, R.; Ahn, J.C.; Yang, D.C.; Song, J.H.; Kang, S.C.; Yang, D.U. Potential of Gut Microbial Metabolites in Treating Osteoporosis and Obesity: A Network Pharmacology and Bioinformatics Approach. Med. Sci. Monit. Int. Med. J. Exp. Clin. Res. 2024, 30, e942899-942891. [Google Scholar] [CrossRef]
- Chen, E.Y.; Tan, C.M.; Kou, Y.; Duan, Q.; Wang, Z.; Meirelles, G.V.; Clark, N.R.; Ma’ayan, A. Enrichr: Interactive and collaborative HTML5 gene list enrichment analysis tool. BMC Bioinform. 2013, 14, 128. [Google Scholar] [CrossRef] [PubMed]
- Tang, Y.; Li, M.; Wang, J.; Pan, Y.; Wu, F.X. CytoNCA: A cytoscape plugin for centrality analysis and evaluation of protein interaction networks. Biosystems 2015, 127, 67–72. [Google Scholar] [CrossRef]
- Thul, P.J.; Lindskog, C. The human protein atlas: A spatial map of the human proteome. Protein Sci. 2018, 27, 233–244. [Google Scholar] [CrossRef]
- Liang, X.Z.; Liu, X.C.; Li, S.; Wen, M.T.; Chen, Y.R.; Luo, D.; Xu, B.; Li, N.H.; Li, G. IRF8 and its related molecules as potential diagnostic biomarkers or therapeutic candidates and immune cell infiltration characteristics in steroid-induced osteonecrosis of the femoral head. J. Orthop. Surg. Res. 2023, 18, 27. [Google Scholar] [CrossRef]
- Tang, Z.; Kang, B.; Li, C.; Chen, T.; Zhang, Z. GEPIA2: An enhanced web server for large-scale expression profiling and interactive analysis. Nucleic Acids Res. 2019, 47, W556-w560. [Google Scholar] [CrossRef]
- Piao, X.; Zhang, H.; Kang, J.P.; Yang, D.U.; Li, Y.; Pang, S.; Jin, Y.; Yang, D.C.; Wang, Y. Advances in Saponin Diversity of Panax ginseng. Molecules 2020, 25, 3452. [Google Scholar] [CrossRef] [PubMed]
- Trott, O.; Olson, A.J. AutoDock Vina: Improving the speed and accuracy of docking with a new scoring function, efficient optimization, and multithreading. J. Comput. Chem. 2010, 31, 455–461. [Google Scholar] [CrossRef]
- Xia, P.; Dubrovska, A. CD98 heavy chain as a prognostic biomarker and target for cancer treatment. Front. Oncol. 2023, 13, 1251100. [Google Scholar]
- Shifeng, P.; Boopathi, V.; Murugesan, M.; Mathiyalagan, R.; Ahn, J.; Xiaolin, C.; Yang, D.-U.; Kwak, G.-Y.; Kong, B.M.; Yang, D.-C.; et al. Molecular Docking and Dynamics Simulation Studies of Ginsenosides with SARS-CoV-2 Host and Viral Entry Protein Targets. Nat. Prod. Commun. 2022, 17. [Google Scholar] [CrossRef]
- Lu, J. Computational Prediction of Ginsenosides Targeting ADGRG3/GPR97 in Cancer and Immune Pathways: A Multi-Faceted In Silico Approach. Appl. Sci. 2025, 15, 4332. [Google Scholar] [CrossRef]
- Van Der Spoel, D.; Lindahl, E.; Hess, B.; Groenhof, G.; Mark, A.E.; Berendsen, H.J. GROMACS: Fast, flexible, and free. J. Comput. Chem. 2005, 26, 1701–1718. [Google Scholar] [CrossRef]
- Xiong, G.; Wu, Z.; Yi, J.; Fu, L.; Yang, Z.; Hsieh, C.; Yin, M.; Zeng, X.; Wu, C.; Lu, A.; et al. ADMETlab 2.0: An integrated online platform for accurate and comprehensive predictions of ADMET properties. Nucleic Acids Res. 2021, 49, W5–W14. [Google Scholar] [CrossRef] [PubMed]
- Zhang, H.; Park, S.; Huang, H.; Kim, E.; Yi, J.; Choi, S.K.; Ryoo, Z.; Kim, M. Anticancer effects and potential mechanisms of ginsenoside Rh2 in various cancer types. Oncol. Rep. 2021, 45, 33. [Google Scholar] [CrossRef]
- Zhou, Y.; Qian, M.; Li, J.; Ruan, L.; Wang, Y.; Cai, C.; Gu, S.; Zhao, X. The role of tumor-associated macrophages in lung cancer: From mechanism to small molecule therapy. Biomed. Pharmacother. 2024, 170, 116014. [Google Scholar] [CrossRef]
- Zheng, K.; Li, Y.; Wang, S.; Wang, X.; Liao, C.; Hu, X.; Fan, L.; Kang, Q.; Zeng, Y.; Wu, X.; et al. Inhibition of autophagosome-lysosome fusion by ginsenoside Ro via the ESR2-NCF1-ROS pathway sensitizes esophageal cancer cells to 5-fluorouracil-induced cell death via the CHEK1-mediated DNA damage checkpoint. Autophagy 2016, 12, 1593–1613. [Google Scholar] [CrossRef]
- Elshafay, A.; Tinh, N.X.; Salman, S.; Shaheen, Y.S.; Othman, E.B.; Elhady, M.T.; Kansakar, A.R.; Tran, L.; Van, L.; Hirayama, K.; et al. Ginsenoside Rk1 bioactivity: A systematic review. PeerJ 2017, 5, e3993. [Google Scholar] [CrossRef] [PubMed]
- Zhou, L.; Li, Z.K.; Li, C.Y.; Liang, Y.Q.; Yang, F. Anticancer properties and pharmaceutical applications of ginsenoside compound K: A review. Chem. Biol. Drug Des. 2022, 99, 286–300. [Google Scholar] [CrossRef] [PubMed]
- Murugesan, M.; Mathiyalagan, R.; Boopathi, V.; Kong, B.M.; Choi, S.-K.; Lee, C.-S.; Yang, D.C.; Kang, S.C.; Thambi, T. Production of Minor Ginsenoside CK from Major Ginsenosides by Biotransformation and Its Advances in Targeted Delivery to Tumor Tissues Using Nanoformulations. Nanomaterials 2022, 12, 3427. [Google Scholar] [CrossRef]
- Chiduza, G.N.; Johnson, R.M.; Wright, G.S.; Antonyuk, S.V.; Muench, S.P.; Hasnain, S.S. LAT1 (SLC7A5) and CD98hc (SLC3A2) complex dynamics revealed by single-particle cryo-EM. Acta Crystallogr. Sect. D Struct. Biol. 2019, 75, 660–669. [Google Scholar] [CrossRef]
- Digomann, D.; Linge, A.; Dubrovska, A. SLC3A2/CD98hc, autophagy and tumor radioresistance: A link confirmed. Autophagy 2019, 15, 1850–1851. [Google Scholar] [CrossRef]
- Lee, Y.; Chung, E.; Lee, K.Y.; Lee, Y.H.; Huh, B.; Lee, S.K. Ginsenoside-Rg1, one of the major active molecules from Panax ginseng, is a functional ligand of glucocorticoid receptor. Mol. Cell. Endocrinol. 1997, 133, 135–140. [Google Scholar] [CrossRef]
- Sadybekov, A.V.; Katritch, V. Computational approaches streamlining drug discovery. Nature 2023, 616, 673–685. [Google Scholar] [CrossRef]
- Schottlender, G.; Prieto, J.M.; Palumbo, M.C.; Castello, F.A.; Serral, F.; Sosa, E.J.; Turjanski, A.G.; Martì, M.A.; Fernández Do Porto, D. From drugs to targets: Reverse engineering the virtual screening process on a proteomic scale. Front. Drug Discov. 2022, 2, 969983. [Google Scholar] [CrossRef]
- Zheng, Q.; Qiu, Z.; Sun, Z.; Cao, L.; Li, F.; Liu, D.; Wu, D. In Vitro Validation of Network Pharmacology Predictions: Ginsenoside Rg3 Inhibits Hepatocellular Carcinoma Cell Proliferation via SIRT2. Nat. Prod. Commun. 2021, 16. [Google Scholar] [CrossRef]
- Kim, H.J.; Oh, T.K.; Kim, Y.H.; Lee, J.; Moon, J.M.; Park, Y.S.; Sung, C.M. Pharmacokinetics of Ginsenoside Rb1, Rg3, Rk1, Rg5, F2, and Compound K from Red Ginseng Extract in Healthy Korean Volunteers. Evid. Based Complement. Altern. Med. 2022, 2022, 8427519. [Google Scholar] [CrossRef]
- Liu, H.; Yang, J.; Du, F.; Gao, X.; Ma, X.; Huang, Y.; Xu, F.; Niu, W.; Wang, F.; Mao, Y.; et al. Absorption and disposition of ginsenosides after oral administration of Panax notoginseng extract to rats. Drug Metab. Dispos. 2009, 37, 2290–2298. [Google Scholar] [CrossRef] [PubMed]

| KM | RO | Compound K (CK) | Rk1 | Ra1 |
|---|---|---|---|---|
 | 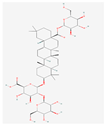 | 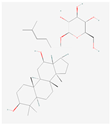 | 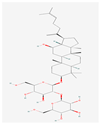 | 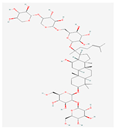 |
| Leaf | Root, flower, fruit, leaf | Bioconversion of Root, fruit, leaf | Root (steamed) fruit, leaf | Root |
| C36H62O10 | C49H80O18 | C36H62O8 | C42H70O12 | C58H98O26 |
| Targets | Compounds | Docking Score (kcal/mol) | Hydrogen Bonds | Other Bonds |
|---|---|---|---|---|
| SLC3A2 (7DF1) | Compound K (9852086) | −8.7 | LYS75 | ASP80 and TYR85 |
| Km (2754977172) | −9.3 | GLU64, LYS71, and ASP77 | LYS75 | |
| Rk1 (11499198) | −8.0 | GLU84, GLN100, and HIS102 | 0 | |
| Ro (11815492) | −9.1 | LYS57, TRP82, GLU84, and GLY103 | 0 | |
| Ra1 (1009441542) | −7.7 | SER78, ASP79, GLN81, SER193, and pro105 | GLN100, GLY103, and VAL131 | |
| Dexamethasone (5743) | −7.8 | GLU64, LYS71, and LYS75 | GLU73 | |
| Tyrosine (6057) | −5.3 | GLY161 and ARG247 | ARG1258, PRO162, and ALA337 | |
| BSG (4U0Q) | Compound K (9852086) | −6.2 | LYS75 | ASAP80 and TYR85 |
| Km (2754977172) | −7.1 | GLU64, LYS71, and ASP77 | LYS75 | |
| Rk1 (11499198) | −6.1 | GLU84, GLN100, and HIS102 | 0 | |
| Ro (11815492) | −7.4 | LYS57, TRP82, GLU84, and GLY103 | 0 | |
| Ra1 (1009441542) | −7 | SER78, ASP79, GLN81, PRO105, and SER193 | TRP82, GLN100, GLY103, and VAL131 | |
| Dexamethasone (5743) | −4.8 | GLU64, LYS71, and LYS75 | GLU73 | |
| Tyrosine (6057) | −6.5 | LYS57 and ASP77 | Val76 and ASP80 | |
| SLC7A5 (7DSL) | Compound K (9852086) | −7 | THR73 | 0 |
| Km (2754977172) | −7.9 | GLU309 | PHE394 | |
| Rk1 (11499198) | −8.6 | GLY74 | THR73, TYR248, LEu251, GLU309, ILE397, and TRP405 | |
| Ro (11815492) | −8.9 | GLU309 and ASN398 | 0 | |
| Ra1 (1009441542) | −7.7 | VAL70, GLU78, and THR154 | THR73, GLU309, and PHE394 | |
| Dexamethasone (5743) | −9.1 | TYR248 and ASN398 | SER401 | |
| Tyrosine (6057) | −7 | ILE63, GLY65, SER66, PHE252, and GLY255 | SER342 | |
| SLC7A6 (AF-Q92536-F1) | Compound K (9852086) | −7.7 | THR189 and ARG190 | LYS42 |
| Km (2754977172) | −7.8 | GLU44, LYS186, and ARG363 | 0 | |
| Rk1 (11499198) | −7.5 | LYS42 and LYS186 | GLN40 | |
| Ro (11815492) | −8.2 | GLN153, PRO154, PRO157, ASP297, SER300, GLY314, SER317, and TRP318 | 0 | |
| Ra1 (1009441542) | −7 | ASN149, GLN153, ASP160, and ASP302 | PRO157, ARG167, and G: U384 | |
| Dexamethasone (5743) | −7.9 | ARG341 | SER340 | |
| Tyrosine (6057) | −5.7 | ASN49 and ASp193 | ILE45 | |
| LCN2 (3DSZ) | Compound K (9852086) | −7 | ARG36 and GLY38 | ALA40, ALA41, and LYS125 |
| Km (2754977172) | −8.6 | GLN54, VAL66, and PHE133 | 0 | |
| Rk1 (11499198) | −6.9 | GLY38, ALN39, MET81, SER134, and HIS165 | ALA40 and PHE123 | |
| Ro (11815492) | −8.2 | ARG36, ALA41, LEU42, ASP47, PRO48, GLN49, LYS50, PHE71, LYS73, and HIS165 | 0 | |
| Ra1 (1009441542) | −7.7 | VAL66, LEU79, LYS125, SER127, and TYR132 | 0 | |
| Dexamethasone (5743) | −7.1 | GLY38 | GLN54 and SER134 | |
| Tyrosine (6057) | −5.4 | VAL66, LEu79, and THR136 | ALA68, MET81, TYR106, and PHE123 | |
| SLC7A9 (6YV1) | Compound K (9852086) | −8.5 | SER116, ASN236, and GLN237 | MET101 and PHE116 |
| Km (2754977172) | −8 | THR91, ASN239, TYR358, and TYR389 | 0 | |
| Rk1 (11499198) | −9.3 | ILE120, ASP233, and TYR386 | ASN236 and GLN237 | |
| Ro (11815492) | −8.3 | GLY41, ILE44, TYR99, and ASP233 | ASN236 | |
| Ra1 (1009441542) | −7.3 | ILE43, SER124, THR181, and GLN237 | 0 | |
| Dexamethasone (5743) | −7.1 | GLN237 and THR398 | ASN236 | |
| Tyrosine (6057) | −6.2 | ALA138, TYR141, SER286, and ASP295 | VAL142 and VAL291 |
Disclaimer/Publisher’s Note: The statements, opinions and data contained in all publications are solely those of the individual author(s) and contributor(s) and not of MDPI and/or the editor(s). MDPI and/or the editor(s) disclaim responsibility for any injury to people or property resulting from any ideas, methods, instructions or products referred to in the content. |
© 2025 by the author. Licensee MDPI, Basel, Switzerland. This article is an open access article distributed under the terms and conditions of the Creative Commons Attribution (CC BY) license (https://creativecommons.org/licenses/by/4.0/).
Share and Cite
Lu, J. Ginsenosides as Potential Natural Ligands of SLC3A2: Computational Insights in Cancer. Life 2025, 15, 907. https://doi.org/10.3390/life15060907
Lu J. Ginsenosides as Potential Natural Ligands of SLC3A2: Computational Insights in Cancer. Life. 2025; 15(6):907. https://doi.org/10.3390/life15060907
Chicago/Turabian StyleLu, Jing. 2025. "Ginsenosides as Potential Natural Ligands of SLC3A2: Computational Insights in Cancer" Life 15, no. 6: 907. https://doi.org/10.3390/life15060907
APA StyleLu, J. (2025). Ginsenosides as Potential Natural Ligands of SLC3A2: Computational Insights in Cancer. Life, 15(6), 907. https://doi.org/10.3390/life15060907