1. Introduction
Sacroiliitis, an inflammation of the sacroiliac joint (SIJ), is a clinical feature observed in various rheumatic and nonrheumatic disorders, including ankylosing spondylitis, other spondyloarthropathies, Bechet’s disease, osteoarthritis, and infectious conditions [
1]. Due to the nonspecific nature of clinical symptoms associated with sacroiliitis, diagnosis heavily relies on imaging studies [
2]. In routine clinical practice, pelvic radiography is typically the initial imaging modality employed for diagnosing sacroiliitis. However, radiographic changes in the SIJ of patients with sacroiliitis often lack sensitivity and specificity, particularly during early disease stages [
1,
2,
3]. This diagnostic limitation has been partially addressed through more sensitive imaging techniques such as computed tomography (CT) and magnetic resonance imaging (MRI) [
1]. While MRI excels at detecting bone marrow edema as an indicator of sacroiliac joint inflammation, CT provides superior visualization of erosions, bone sclerosis, and ankyloses, and offers guidance for interventional procedures [
4,
5]. In clinical practice, CT is frequently preferred for sacroiliitis diagnosis due to its relatively lower cost compared to MRI. However, the high radiation exposure and limited accessibility of CT often restricts its use, making pelvic radiographs the most feasible option for initial diagnosis. Unfortunately, the low sensitivity of conventional radiography for detecting sacroiliitis frequently leads to missed diagnosis in clinical settings [
2].
Machine learning (ML) encompasses computer algorithms capable of autonomous learning from data without explicit programming [
6,
7,
8,
9]. ML has effectively addressed limitations inherent in conventional image analysis methods, facilitating significant advancements in medical imaging [
6,
7,
8,
9]. Deep learning (DL), an advanced iteration of ML, integrates numerous hidden layers to construct artificial neural networks that mimic the structure and functions of the human brain. DL methodologies surpass conventional ML approaches, particularly in learning from unstructured and perceptual image data [
10,
11]. Importantly, DL can recognize image characteristics that may be imperceptible to human observers [
10,
11]. Among DL architectures, the convolutional neural network (CNN) has proven exceptionally effective for image recognition and classification tasks [
12].
Recent research has explored DL applications for sacroiliitis diagnosis. In 2025, Uzelaltinbulat et al. developed a simplified custom CNN model using four MRI sequences and compared its performance with three state-of-the-art pretrained models [
13]. Their proposed model achieved high diagnostic accuracy (0.977 for image-based and 0.951 for patient-based classification), demonstrating potential for clinical implementation. Similarly, Martins et al. introduced a DL approach using both 2D and 3D convolutional neural networks for sacroiliitis detection from MRI scans, with the 3D CNN yielding superior performance (66.6% validation accuracy) compared to 2D models [
14].
The present study aimed to develop a CNN model using pelvic radiographs as input data to determine the presence of sacroiliitis. Additionally, we utilized the presence or absence of sacroiliitis confirmed by pelvic CT as the reference standard output data for model development and validation.
2. Materials and Methods
2.1. Subjects
We retrospectively recruited 1853 patients (3706 SIJs; mean age = 37.69 (standard deviation = ±10.87) years; male/female = 1254:599) who visited Ulsan University Hospital between January 2010 and December 2022. Inclusion criteria were (1) adults over 18 years of age; (2) patients with no history of bony fracture involving the SIJ, such as pelvic fracture; and (3) patients who underwent both pelvic anteroposterior (AP) radiograph and CT examinations on the same day. Exclusion criteria comprised (1) patients who underwent either a pelvic AP radiograph or a CT scan alone and (2) patients with a history of pelvic surgery. Based on CT evaluation, 390 SIJs were classified as without sacroiliitis, and 1463 SIJs with sacroiliitis among the 1853 right and left SIJs that were assessed.
2.2. Pelvic AP Radiograph and CT for SIJ Evaluation
All 1853 patients underwent both pelvic AP radiography and pelvic CT. The entire pelvis was scanned using a multidetector-row helical CT scanner (LightSpeed VCT, GE Healthcare, Milwaukee, USA), with images obtained while patients maintained a supine position on the CT table. CT acquisition parameters included a slice thickness of 0.625 mm and a tube voltage of 120 kV. A radiologist with over 10 years of experience in musculoskeletal imaging reviewed the pelvic AP radiographs and CT images of all included patients. The presence of sacroiliitis was confirmed based on findings from pelvic CT images, which served as the reference standard.
2.3. The Deep Learning Model
We developed a DL model using Python 3.8.8, TensorFlow 2.10.1 (with Keras), and the Scikit-Learn 1.1.2 library to diagnose sacroiliitis in the left and right SIJs from pelvic AP radiographs. We employed two pretrained CNN models based on EfficientNetV2S architecture and trained them from scratch on the left and right SIJ regions of interest (ROIs).
Table 1 summarizes the architectural details of the employed model.
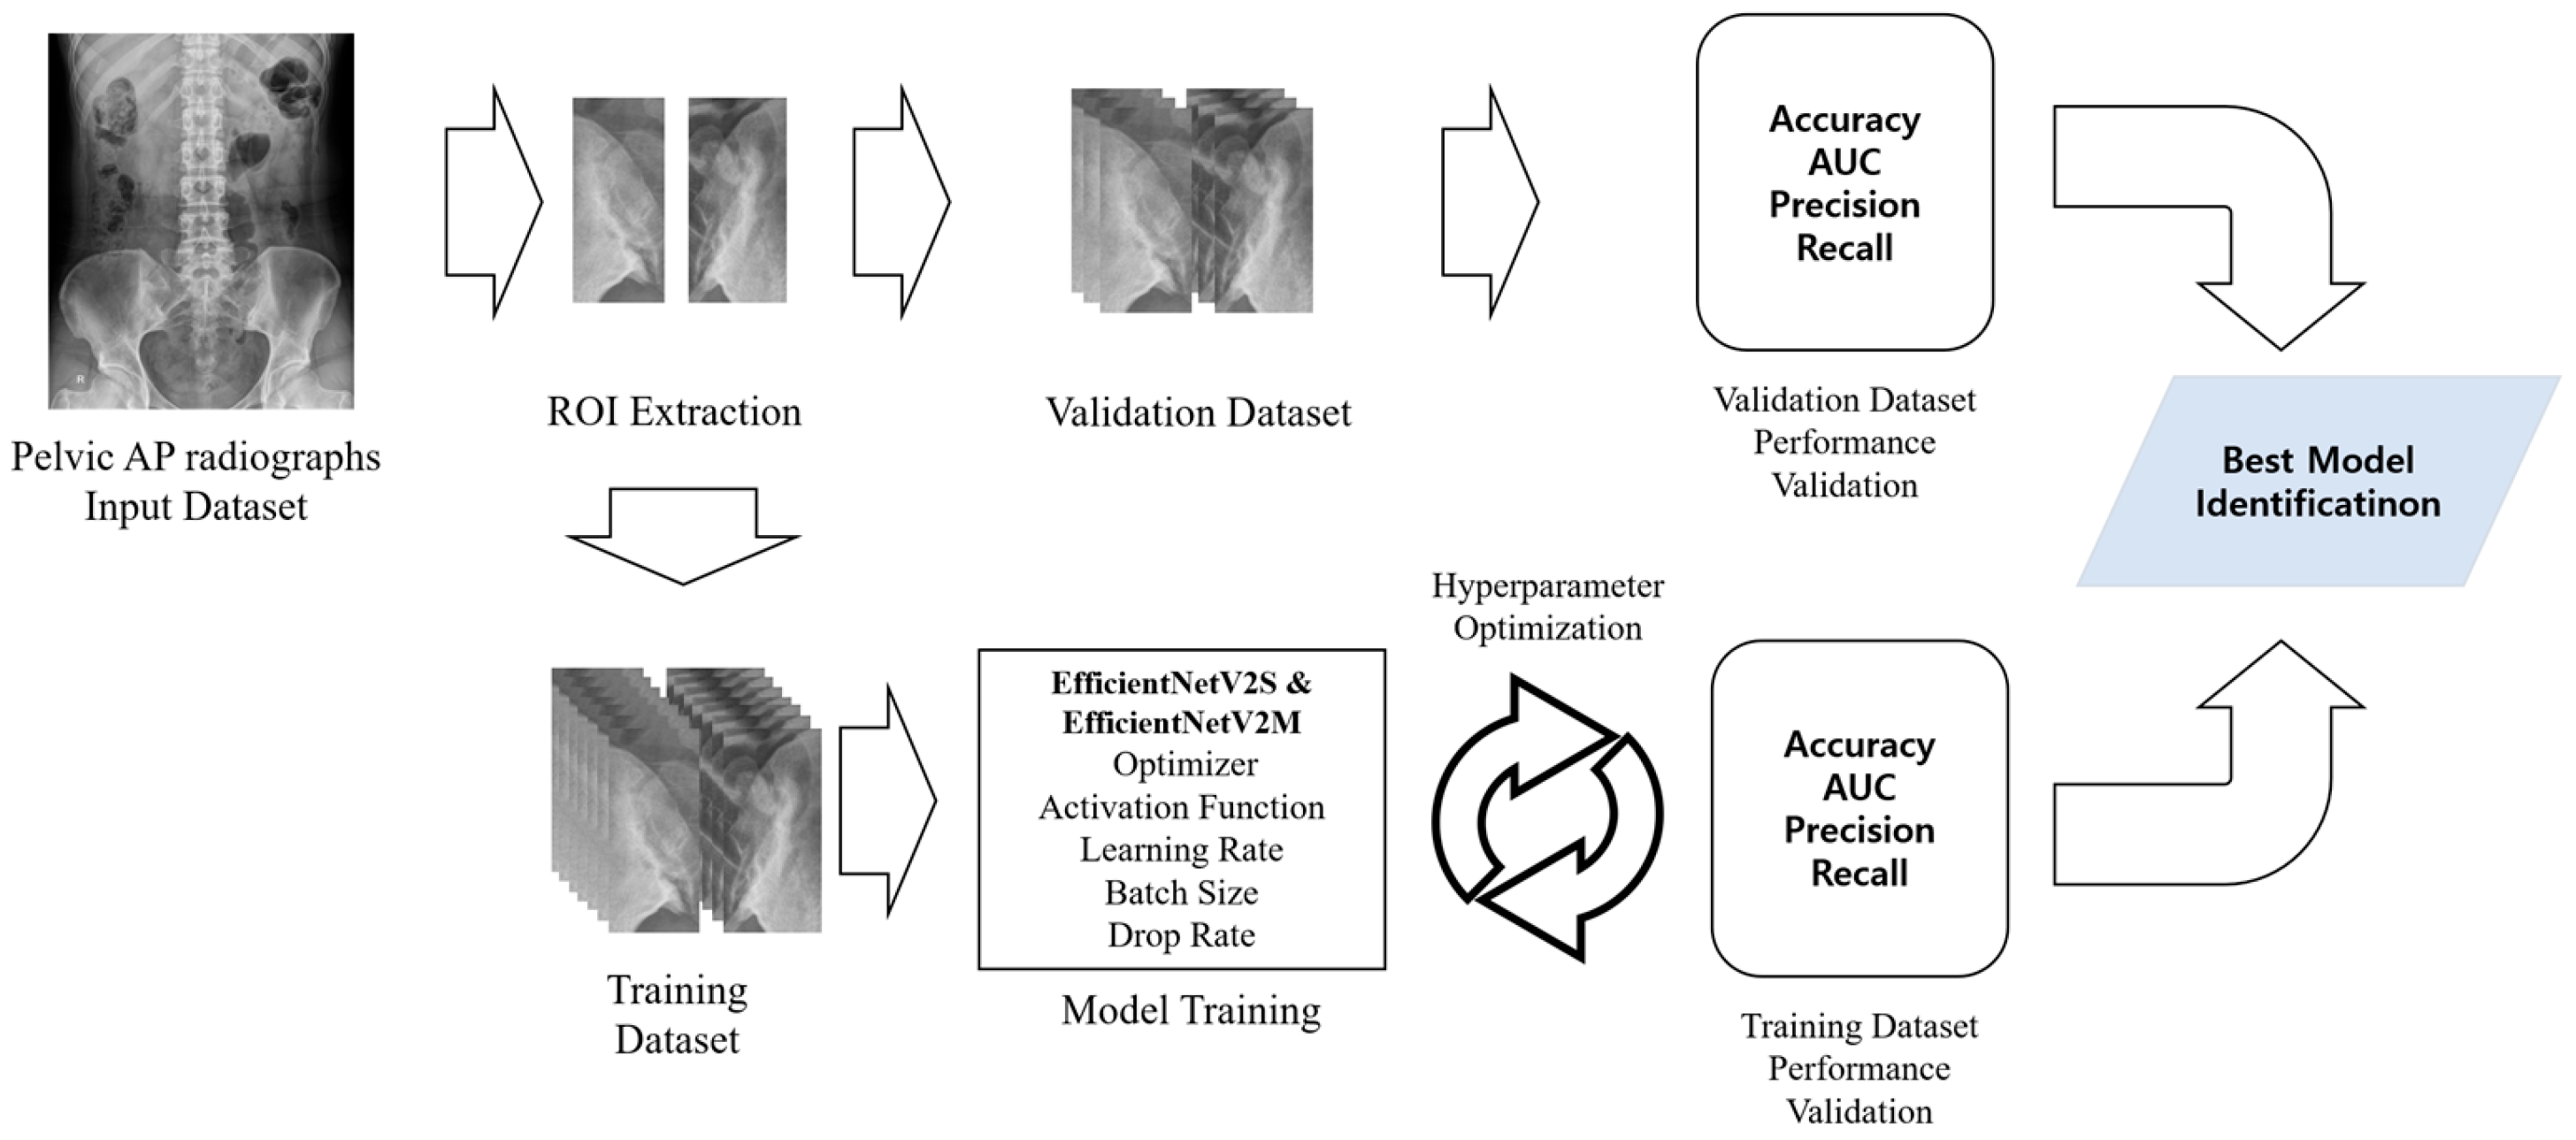
From each patient’s pelvic AP radiograph, initial ROI images were extracted and standardized to a size of 600 (height) × 300 (width) pixels. The ROI images included the left and right SIJs. Two separate ROI images containing the left or right SIJ portions were extracted from the initial ROI images of size 2865 (height) × 2344 (width) pixels. These left and right SIJ ROI images were used for training the models to detect sacroiliitis.
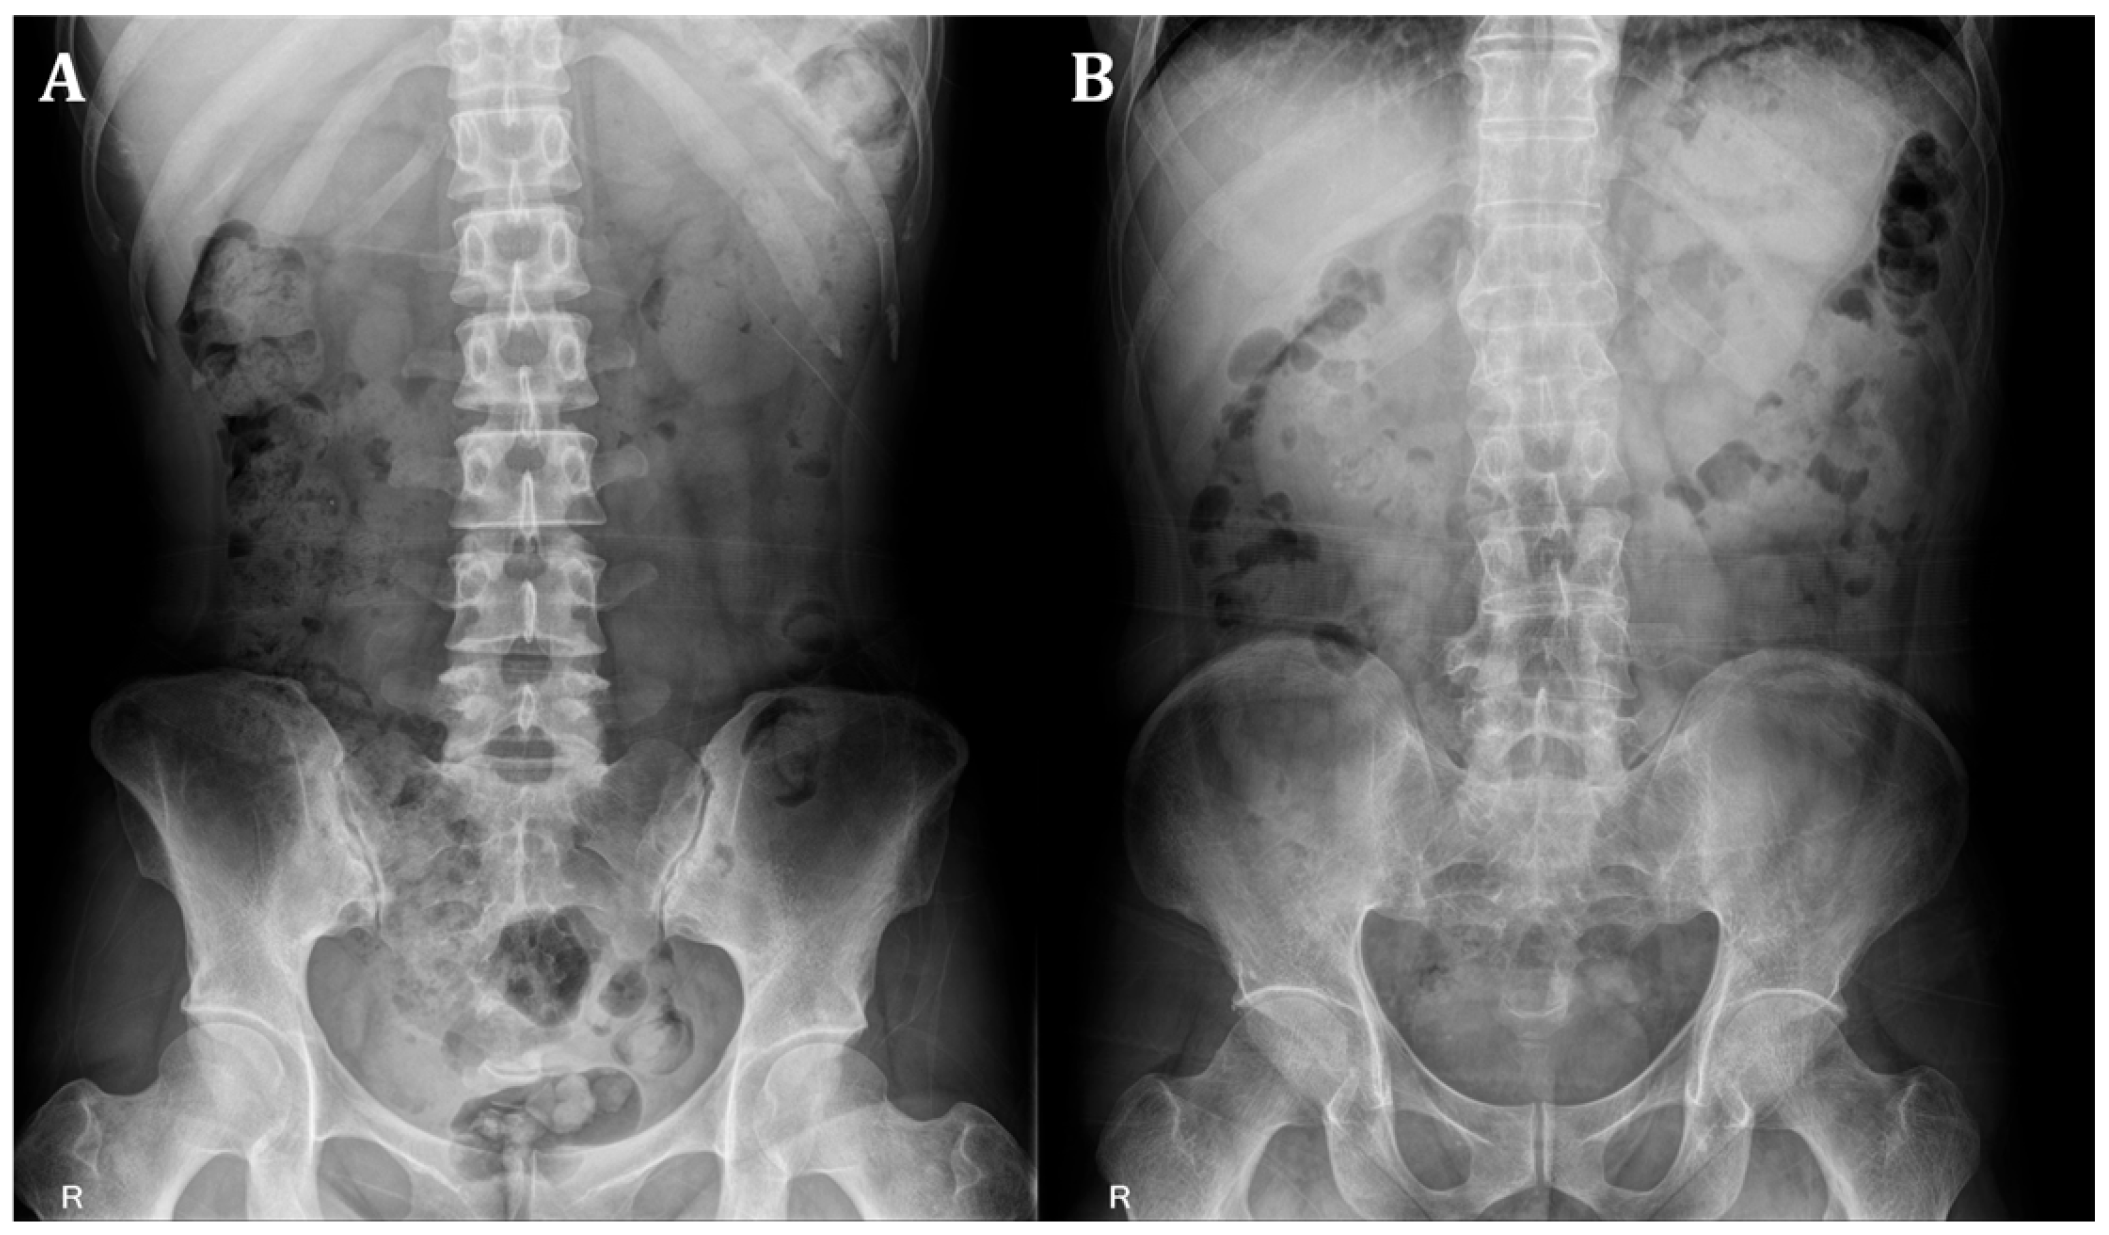
Figure 1 provides representative examples of absence and presence sacroiliitis on bilateral SIJs.
Figure 2 illustrates the overall process of sacroiliitis diagnosis using the proposed DL models, both designed for binary classification. In the models for diagnosing left and right sacroiliitis, each SIJs was classified as either 0 (absence of sacroiliitis) or 1 (presence of sacroiliitis). Results from the two models were then combined to determine the diagnosis for each patient, classified as either absence of sacroiliitis (left and right SIJs: 0), left sacroiliitis (left SIJ: 1, right SIJ: 0), right sacroiliitis (left SIJ: 0, right SIJ: 1), or bilateral sacroiliitis (left and right SIJs: 1).
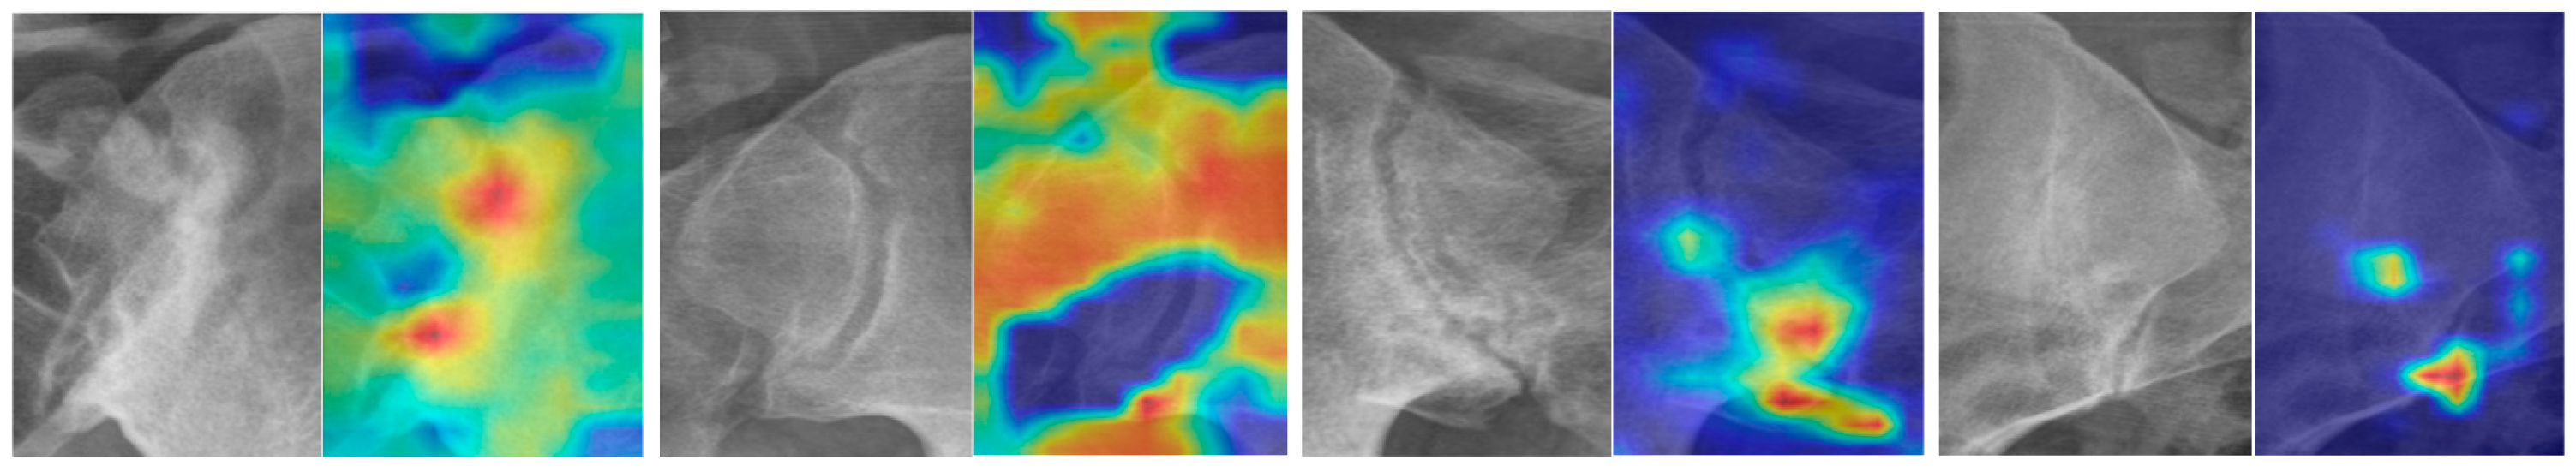
The images in
Figure 3 show the regions of interest and corresponding heatmaps. This representation effectively highlights variations in data intensity across the regions of interest, facilitating an intuitive visual assessment. The heatmap colors delineate the intensity of model attention or activation within the region of interest. Warmer colors, such as red and orange, highlight areas of high importance that significantly influenced the model’s prediction. In contrast, cooler colors, like blue and purple, indicate regions of lower importance with minimal impact on the outcome.
Table 1 shows the core architecture table [
15] of the EfficientNetV2S model, and
Table 2 summarizes the architectural details of the employed model.
2.4. Experiment
To mitigate overfitting risk in the developed model, the 1853 images were partitioned into two separate sets: 70% (1297 images) were assigned for training, and 30% (556 images) were allocated for validation. The specifics of the dataset configuration are summarized in
Table 3. The ML model was trained using TensorFlow version 2.10.1 (Google, Mountain View, CA, USA) and the Scikit-Learn toolkit version 1.1.2.
2.5. Statistical Analysis
Statistical analyses were conducted using Python 3.8.10 and the Scikit-Learn toolkit version 1.1.2. Receiver operating characteristic (ROC) curve analysis was performed, and the area under the curve (AUC) was calculated. The 95% confidence interval (CI) for the AUC was determined using the method previously described by DeLong et al. [
16].
3. Results
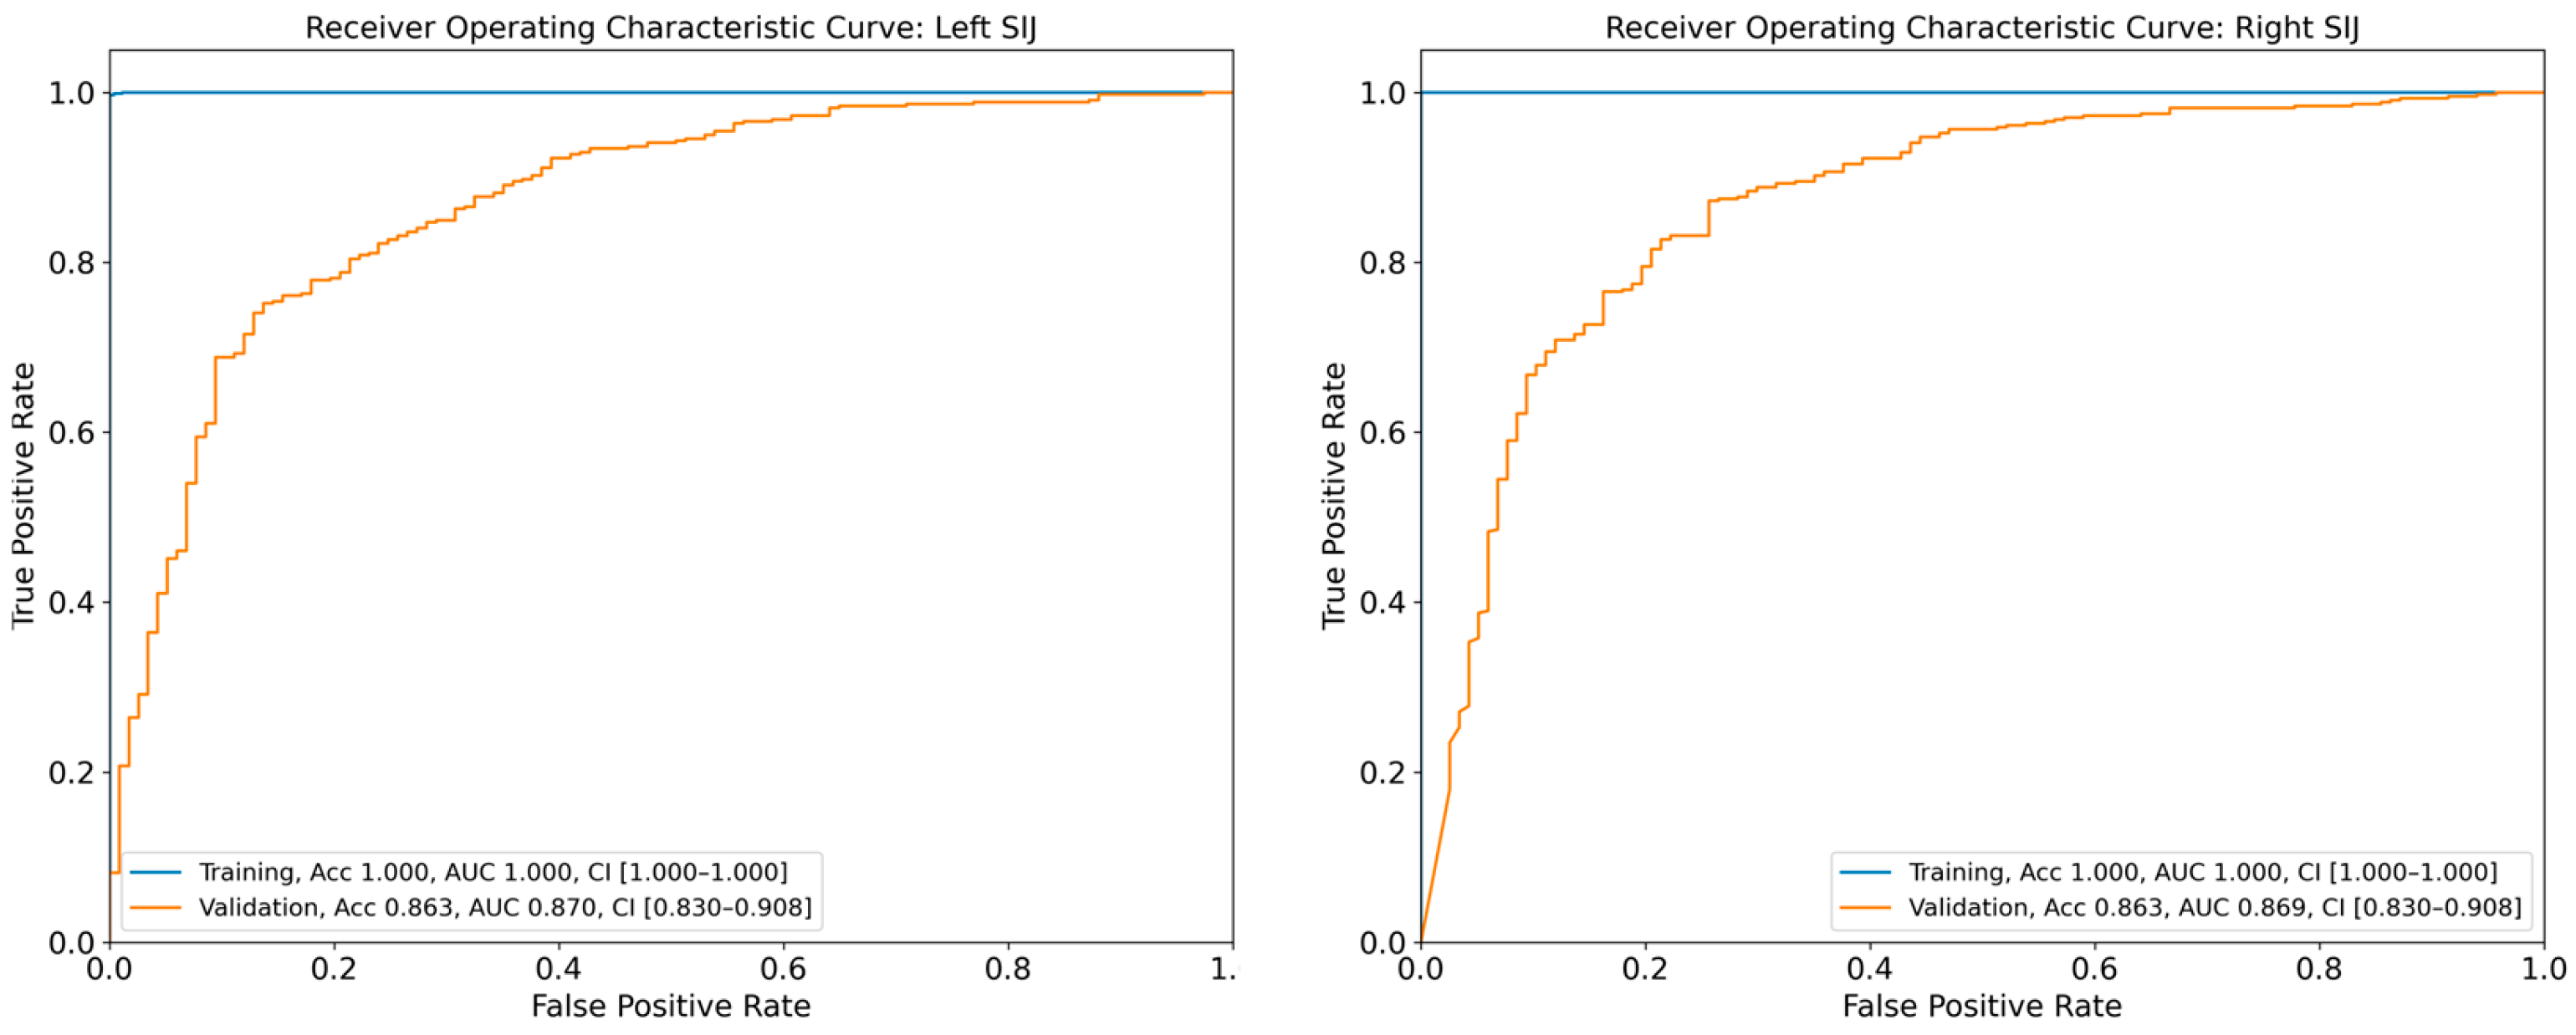
The DL model achieved AUCs of 0.870 (95% CI: 0.830–0.908) and 0.869 (95% CI: 0.830–0.908) for the diagnosis of sacroiliitis in the left and right SIJs, respectively, based on the validation dataset (
Figure 4). The diagnostic accuracies of sacroiliitis for the left and right sides were 86.3% and 86.3%, respectively, as assessed using the validation set. Additional performance metrics for the diagnostic models are presented in
Table 3.
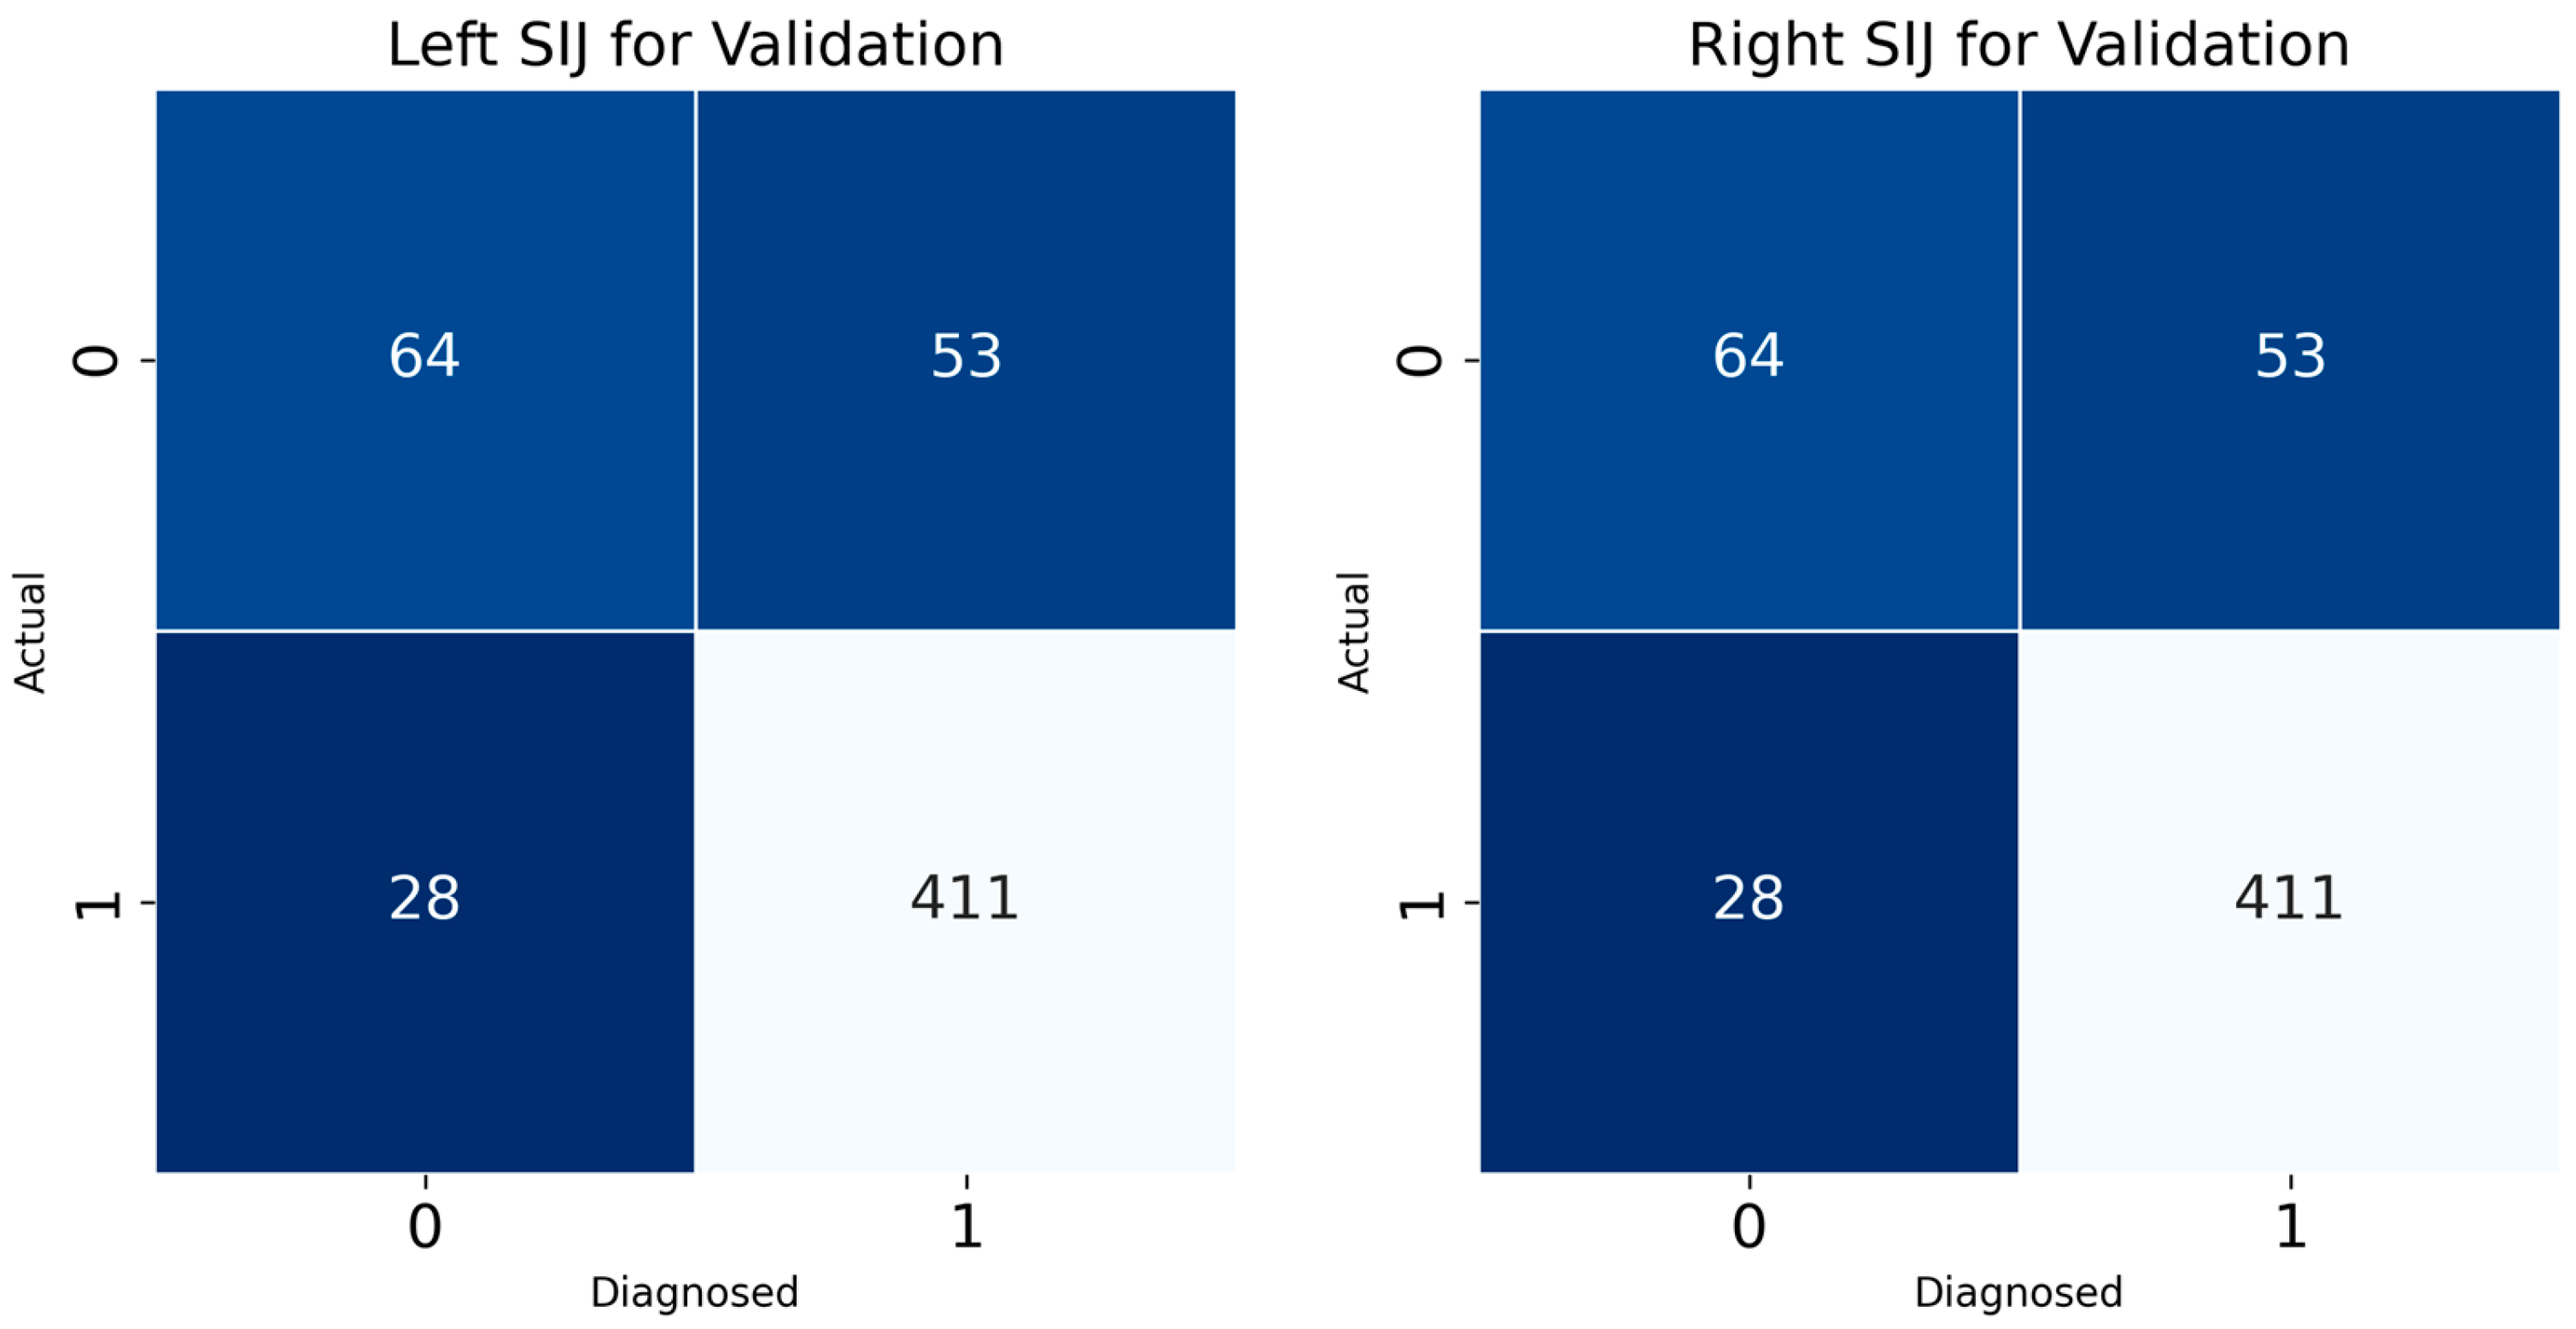
Confusion matrix results for the left and right SIJ models provided insight into the classification accuracy of the developed DL model for sacroiliitis diagnosis (
Figure 5). For the left SIJ model validation dataset, of 117 “absence of sacroiliitis” images, 64 were correctly classified, while 28 were misclassified as “presence of sacroiliitis”. Of the 439 “presence of sacroiliitis” images, 411 were correctly classified, while 53 were misclassified as “absence of sacroiliitis”. Similarly, for the SIJ right model, of the 117 “absence of sacroiliitis” images, 65 were correctly classified, while 23 were misclassified as “presence of sacroiliitis”. Of the 439 “presence of sacroiliitis” images, 416 were correctly classified, while 54 were misclassified as “absence of sacroiliitis”.
For the purpose of performance comparison with the deep learning model developed in this study, a traditional machine learning technique, Support Vector Machine (SVM), was trained, and its performance was subsequently measured using validation data. The SVM employed a radial basis function (RBF) kernel, and the optimal model was selected after performing iterative training by adjusting the C parameter ten times.
The performance of the SVM designated as the ‘left model’ was as follows: accuracy of 0.787, precision of 0.815, recall of 0.942, and an F1-score of 0.873. For the ‘right model’, the performance metrics were an accuracy of 0.787, precision of 0.815, recall of 0.945, and an F1-score of 0.875. These results demonstrated a relatively lower performance for the SVM models compared to the deep learning model.
To benchmark the developed model’s diagnostic accuracy, two experienced clinicians (A and B) with over 15 years of experience in musculoskeletal imaging independently evaluated the presence of sacroiliitis using the same 556 pelvic AP radiographs from the validation set without access to CT images or DL model results. For the right and left SIJs, the diagnostic accuracies of clinicians A and B were 58.5% and 58.1%, and 57.4% and 58.8%, respectively.
4. Discussion
In this study, we developed a CNN model capable of determining the presence of sacroiliitis based on pelvic radiographs. Our model classified the output into “absence of sacroiliitis” and “presence of sacroiliitis”. The AUC values of our model, as evaluated on the validation dataset, were 0.871 and 0.869 for the left and right SIJs, respectively. Considering that an AUC between 0.8 and 0.9 is generally regarded as indicating excellent diagnostic capability, our model demonstrates highly effective performance for determining the presence of sacroiliitis using pelvic AP radiographs [
17]. Furthermore, the diagnostic accuracy of our developed model (approximately 85%) substantially exceeded that of clinicians experienced in the field of musculoskeletal disorders.
A DL algorithm is constructed with a multilayer perceptron comprising multiple hidden layers and a feedforward neural network, enabling the recognition of detailed features or patterns within input data [
18,
19]. CNNs specifically process image data through repeated convoluting and pooling operations [
20,
21]. Through these processes, important features or patterns in the input data can be extracted and classified [
19,
20]. We postulate that our CNN algorithm can recognize valuable radiographic features and extract specific characteristics associated with sacroiliitis, such as erosion, subchondral sclerosis, change in joint space, and ankylosis, from the input images.
To our knowledge, two previous studies have developed DL models for detecting sacroiliitis in pelvic radiographs [
22,
23]. In 2021, Brassem et al. utilized 1553 pelvic AP radiographs (training: 1324, validation: 229) [
22] and reported an AUC of 0.97, with sensitivity and specificity of 88% and 95%, respectively. In 2023, Üreten et al. analyzed 585 pelvic AP radiographs, with 70%, 15%, and 15% allocated for training, validation, and testing, respectively [
23]. Their study employed VGG-16, ResNet-101, and Inception-v3 networks, achieving AUC values of 0.9–0.96 and accuracies of 82–89.9%.
While the diagnostic accuracies reported in these previous studies appear slightly higher than those of our model, it is crucial to note that their reference standard for sacroiliitis was based solely on radiographic findings, not on CT or MRI confirmation. The diagnosis of sacroiliitis using radiographs alone is limited. In 2017, Melchior et al. reported that the sensitivity and specificity of pelvic radiography for diagnosing sacroiliitis typically ranged between 70% and 80%. Moreover, in our study, the diagnostic accuracy based on pelvic radiographs was approximately 58% [
3]. Therefore, the diagnostic performance of previously developed DL models may not reflect true accuracy against a more definitive reference standard.
Although CT is not as accurate as MRI for detecting the presence of sacroiliitis, its accuracy is significantly higher than that of radiography [
2,
3]. A distinctive strength of our study is the development of a DL model for detecting sacroiliitis based on pelvic radiographs, using CT-confirmed sacroiliitis status as the reference standard. This approach likely enables our model to more accurately represent the actual condition of the SIJ compared with previously developed models that relied on radiographic findings alone.
5. Conclusions
This study demonstrates that a DL model trained using AP pelvic radiographs can effectively assist in diagnosing sacroiliitis when validated against CT findings. Our model is unique because we used information on the presence or absence of sacroiliitis presented on pelvic CT as the output data. We believe this DL model could provide valuable clinical assistance for more accurate sacroiliitis diagnosis in situations where MRI or CT imaging is unavailable and only radiography can be performed.
However, our study has several limitations. First, we did not use pelvic MRI findings, which represent the gold standard for sacroiliitis diagnosis, to develop our DL model. Second, the relatively limited dataset size may constrain the model’s generalizability. We anticipate that integrating novel models, such as state space models [
24,
25,
26], with DL techniques could address certain limitations of current research in this domain, particularly by enhancing temporal dynamics modeling and improving predictive robustness, thus warranting further investigation to overcome these limitations.
Author Contributions
M.X.W., J.K.K., D.P. and M.C.C. contributed to the study conception, design, material preparation, data collection, data analysis, and drafting of the manuscript. All authors have read and agreed to the published version of the manuscript.
Funding
This work was supported by the 2023 Yeungnam University Research Grant.
Institutional Review Board Statement
This study was approved by the Investigational Review Board (IRB) of Yeungnam University Hospital (2024-06-005). The requirement for informed consent was waived by the Institutional Review Board of Yeungnam University Hospital owing to the retrospective nature of the study. The study was conducted in accordance with the Declaration of Helsinki.
Informed Consent Statement
The requirement for informed consent was waived by the institutional review board of Yeungnam University Hospital owing to the retrospective nature of the study.
Data Availability Statement
The datasets generated during and/or analyzed during the current study are available from the corresponding author on reasonable request.
Conflicts of Interest
The authors declare no conflicts of interest.
Abbreviations
| AUC | area under the curve |
| CI | confidence interval |
| CNN | convolutional neural network |
| CT | computed tomography |
| DL | deep learning |
| ML | machine learning |
| MRI | magnetic resonance imaging |
| ReLU | rectified linear unit |
| ROI | region of interest |
| ROC | receiver operating characteristic |
| SIJ | sacroiliac joint |
References
- Slobodin, G.; Hussein, H.; Rosner, I.; Eshed, I. Sacroiliitis—Early diagnosis is key. J. Inflamm. Res. 2018, 11, 339–344. [Google Scholar] [CrossRef]
- Tsoi, C.; Griffith, J.F.; Lee, R.K.L.; Wong, P.C.H.; Tam, L.S. Imaging of sacroiliitis: Current status, limitations and pitfalls. Quant. Imaging Med. Surg. 2019, 9, 318–335. [Google Scholar] [CrossRef] [PubMed]
- Melchior, J.; Azraq, Y.; Chary-Valckenaere, I.; Rat, A.C.; Texeira, P.; Blum, A.; Loeuille, D. Radiography and abdominal CT compared with sacroiliac joint CT in the diagnosis of sacroiliitis. Acta Radiol. 2017, 58, 1252–1259. [Google Scholar] [CrossRef] [PubMed]
- Taurog, J.D.; Chhabra, A.; Colbert, R.A. Ankylosing spondylitis and axial spondyloarthritis. N. Engl. J. Med. 2016, 374, 2563–2574. [Google Scholar] [CrossRef] [PubMed]
- Weber, U.; Lambert, R.G.; Østergaard, M.; Hodler, J.; Pedersen, S.J.; Maksymowych, W.P. The diagnostic utility of magnetic resonance imaging in spondylarthritis: An international multicenter evaluation of one hundred eighty-seven subjects. Arthrit. Rheumat. 2010, 62, 3048–3058. [Google Scholar] [CrossRef]
- Nazar, W.; Nazar, K.; Daniłowicz-Szymanowicz, L. Machine learning and deep learning methods for fast and accurate assessment of transthoracic echocardiogram image quality. Life 2024, 14, 761. [Google Scholar] [CrossRef]
- Valente, J.; António, J.; Mora, C.; Jardim, S. Developments in image processing using deep learning and reinforcement learning. J. Imaging 2023, 9, 207. [Google Scholar] [CrossRef]
- Xu, Y.; Quan, R.; Xu, W.; Huang, Y.; Chen, X.; Liu, F. Advances in medical image segmentation: A comprehensive review of traditional, deep learning and hybrid approaches. Bioengineering 2024, 11, 1034. [Google Scholar] [CrossRef]
- Zhu, Z.; Sun, Y.; Honarvar Shakibaei Asli, B. Early breast cancer detection using artificial intelligence techniques based on advanced image processing tools. Electronics 2024, 13, 3575. [Google Scholar] [CrossRef]
- Du, K.-L.; Zhang, R.; Jiang, B.; Zeng, J.; Lu, J. Understanding machine learning principles: Learning, inference, generalization, and computational learning theory. Mathematics 2025, 13, 451. [Google Scholar] [CrossRef]
- Taye, M.M. Understanding of machine learning with deep learning: Architectures, workflow, applications and future directions. Computers 2023, 12, 91. [Google Scholar] [CrossRef]
- Kim, J.K.; Park, D.; Chang, M.C. Assessment of bone age based on hand radiographs using regression-based multi-modal deep learning. Life 2024, 14, 774. [Google Scholar] [CrossRef]
- Uzelaltinbulat, S.; Kucukciloglu, Y.; Ilhan, A.; Mirzaei, O.; Sekeroglu, B. Diagnosis of sacroiliitis using MR images with a simplified custom deep learning model. J. Supercomput. 2025, 81, 781. [Google Scholar] [CrossRef]
- Martins, T.M.M.; de Lima, M.A.; Miyoshi, N.S.B.; de Azevedo Marques, P.M. Deep learning methods for sacroiliitis detection. Procedia Comput. Sci. 2025, 256, 918–924. [Google Scholar] [CrossRef]
- Tan, M.; Le, Q. Efficientnetv2: Smaller models and faster training. In Proceedings of the 38th International Conference on Machine Learning, Virtual Event, 18–24 July 2021; pp. 10096–10106. [Google Scholar]
- DeLong, E.R.; DeLong, D.M.; Clarke-Pearson, D.L. Comparing the areas under two or more correlated receiver operating characteristic curves: A nonparametric approach. Biometrics 1988, 44, 837–845. [Google Scholar] [CrossRef]
- Mandrekar, J.N. Receiver operating characteristic curve in diagnostic test assessment. J. Thorac. Oncol. 2010, 5, 1315–1316. [Google Scholar] [CrossRef]
- Fei, L.; Han, B. Multi-object multi-camera tracking based on deep learning for intelligent transportation: A review. Sensors 2023, 23, 3852. [Google Scholar] [CrossRef]
- Zhou, T.; Cheng, Q.; Lu, H.; Li, Q.; Zhang, X.; Qiu, S. Deep learning methods for medical image fusion: A review. Comput. Biol. Med. 2023, 160, 106959. [Google Scholar] [CrossRef] [PubMed]
- Chen, C.; Mat Isa, N.A.; Liu, X. A review of convolutional neural network based methods for medical image classification. Comput. Biol. Med. 2025, 185, 109507. [Google Scholar] [CrossRef]
- Mienye, I.D.; Swart, T.G.; Obaido, G.; Jordan, M.; Ilono, P. Deep convolutional neural networks in medical image analysis: A review. Information 2025, 16, 195. [Google Scholar] [CrossRef]
- Bressem, K.K.; Vahldiek, J.L.; Adams, L.; Niehues, S.M.; Haibel, H.; Rodriguez, V.R.; Torgutalp, M.; Protopopov, M.; Proft, F.; Rademacher, J.; et al. Deep learning for detection of radiographic sacroiliitis: Achieving expert-level performance. Arthrit. Res. Ther. 2021, 23, 106. [Google Scholar] [CrossRef] [PubMed]
- Üreten, K.; Maraş, Y.; Duran, S.; Gök, K. Deep learning methods in the diagnosis of sacroiliitis from plain pelvic radiographs. Mod. Rheumatol. 2023, 33, 202–206. [Google Scholar] [CrossRef] [PubMed]
- Wickramasuriya, D.S.; Faghih, R.T. State-space model with one MPP and one continuous observation. In Bayesian Filter Design for Computational Medicine; Springer: Cham, Switzerland, 2024. [Google Scholar] [CrossRef]
- Yeganeh, A.; Johannssen, A.; Chukhrova, N.; Rasouli, M. Monitoring multistage healthcare processes using state space models and a machine learning based framework. Artif. Intell. Med. 2024, 151, 102826. [Google Scholar] [CrossRef] [PubMed]
- Prashad, C.D. State-space modelling for infectious disease surveillance data: Dynamic regression and covariance analysis. Infect. Dis. Modell. 2025, 10, 591–627. [Google Scholar] [CrossRef]
| Disclaimer/Publisher’s Note: The statements, opinions and data contained in all publications are solely those of the individual author(s) and contributor(s) and not of MDPI and/or the editor(s). MDPI and/or the editor(s) disclaim responsibility for any injury to people or property resulting from any ideas, methods, instructions or products referred to in the content. |
© 2025 by the authors. Licensee MDPI, Basel, Switzerland. This article is an open access article distributed under the terms and conditions of the Creative Commons Attribution (CC BY) license (https://creativecommons.org/licenses/by/4.0/).


