
A Combined Approach Using T2*-Weighted Dynamic Susceptibility Contrast MRI Perfusion Parameters and Radiomics to Differentiate Between Radionecrosis and Glioma Progression: A Proof-of-Concept Study
 , , , and
Abstract
1. Introduction
2. Materials and Methods
2.1. Study Design
- -
- Inclusion criteria:
- Histologically-confirmed brain glioma;
- Treatment with radiotherapy among other treatments;
- Lesion suspicion of recurrence or radionecrosis on follow-up DSC MRI;
- Minimum follow-up of 6 months.
- -
- Exclusion criteria:
- Suboptimal quality of imaging examinations, including susceptibility or motion artifacts that precluded from correctly assessing the suspicious area on perfusion MRI. For quality check, several control measures were followed according to the recommendations of the American Society of Functional Neuroradiology [20];
- Uncertainty about the nature of the suspicious lesion due to either absence of follow-up or lack of histological confirmation.
2.2. Imaging Protocol and Preprocessing
2.3. Radiomics Features Extraction
2.4. Perfusion Curve Estimation and Analysis
2.5. Machine Learning Pipeline and Statistical Analysis
3. Results
3.1. Characteristics of Patients and Imaging Data
3.2. Performance of the Selected Models
3.3. Feature Importance
4. Discussion
5. Conclusions
Supplementary Materials
Author Contributions
Funding
Institutional Review Board Statement
Informed Consent Statement
Data Availability Statement
Conflicts of Interest
Abbreviations
| AUC | Area under the curve |
| DSC | Dynamic Susceptibility Contrast |
| GLCM | Gray Level Co-occurrence Matrix |
| GLDM | Gray Level Dependence Matrix |
| GLRLM | Gray Level Run Length Matrix |
| GLSZM | Gray Level Size Zone Matrix |
| MRI | Magnetic resonance imaging |
| NAWM | Normal-appearing white matter |
| NGTDM | Neighborhood Gray Tone Difference Matrix |
| PSR | Percentage signal recovery |
| rCBV | Relative cerebral blood volume |
| ROI | Region of interest |
| TIC | Time–intensity curve |
| TTA | Time to arrival |
| TTP | Time to peak |
| TR | Repetition time |
References
- Weller, M.; Wen, P.Y.; Chang, S.M.; Dirven, L.; Lim, M.; Monje, M.; Reifenberger, G. Glioma. Nat. Rev. Dis. Primers 2024, 10, 33. [Google Scholar] [CrossRef] [PubMed]
- Nassiri, F.; Patil, V.; Yefet, L.S.; Singh, O.; Liu, J.; Dang, R.M.A.; Yamaguchi, T.N.; Daras, M.; Cloughesy, T.F.; Colman, H.; et al. Oncolytic DNX-2401 Virotherapy plus Pembrolizumab in Recurrent Glioblastoma: A Phase 1/2 Trial. Nat. Med. 2023, 29, 1370–1378. [Google Scholar] [CrossRef] [PubMed]
- Fan, H.; Luo, Y.; Gu, F.; Tian, B.; Xiong, Y.; Wu, G.; Nie, X.; Yu, J.; Tong, J.; Liao, X. Artificial Intelligence-Based MRI Radiomics and Radiogenomics in Glioma. Cancer Imaging 2024, 24, 36. [Google Scholar] [CrossRef] [PubMed]
- Alizadeh, M.; Broomand Lomer, N.; Azami, M.; Khalafi, M.; Shobeiri, P.; Arab Bafrani, M.; Sotoudeh, H. Radiomics: The New Promise for Differentiating Progression, Recurrence, Pseudoprogression, and Radionecrosis in Glioma and Glioblastoma Multiforme. Cancers 2023, 15, 4429. [Google Scholar] [CrossRef]
- Chen, X.; Cui, Y.; Zou, L. Treatment Advances in High-Grade Gliomas. Front. Oncol. 2024, 14, 1287725. [Google Scholar] [CrossRef]
- Wu, J.; Gonzalez Castro, L.N.; Battaglia, S.; El Farran, C.A.; D’Antonio, J.P.; Miller, T.E.; Suvà, M.L.; Bernstein, B.E. Evolving Cell States and Oncogenic Drivers during the Progression of IDH-Mutant Gliomas. Nat. Cancer 2024, 6, 145–157. [Google Scholar] [CrossRef]
- Stitzlein, L.M.; Adams, J.T.; Stitzlein, E.N.; Dudley, R.W.; Chandra, J. Current and Future Therapeutic Strategies for High-Grade Gliomas Leveraging the Interplay between Epigenetic Regulators and Kinase Signaling Networks. J. Exp. Clin. Cancer Res. 2024, 43, 12. [Google Scholar] [CrossRef]
- Lambin, P.; Leijenaar, R.T.H.; Deist, T.M.; Peerlings, J.; de Jong, E.E.C.; van Timmeren, J.; Sanduleanu, S.; Larue, R.T.H.M.; Even, A.J.G.; Jochems, A.; et al. Radiomics: The Bridge between Medical Imaging and Personalized Medicine. Nat. Rev. Clin. Oncol. 2017, 14, 749–762. [Google Scholar] [CrossRef]
- Gillies, R.J.; Kinahan, P.E.; Hricak, H. Radiomics: Images Are More than Pictures, They Are Data. Radiology 2016, 278, 563–577. [Google Scholar] [CrossRef]
- Nahiduzzaman, M.; Abdulrazak, L.F.; Kibria, H.B.; Khandakar, A.; Ayari, M.A.; Ahamed, M.F.; Ahsan, M.; Haider, J.; Moni, M.A.; Kowalski, M. A Hybrid Explainable Model Based on Advanced Machine Learning and Deep Learning Models for Classifying Brain Tumors Using MRI Images. Sci. Rep. 2025, 15, 1649. [Google Scholar] [CrossRef]
- Vijithananda, S.M.; Jayatilake, M.L.; Gonçalves, T.C.; Rato, L.M.; Weerakoon, B.S.; Kalupahana, T.D.; Silva, A.D.; Dissanayake, K.; Hewavithana, P.B. Texture Feature Analysis of MRI-ADC Images to Differentiate Glioma Grades Using Machine Learning Techniques. Sci. Rep. 2023, 13, 15772. [Google Scholar] [CrossRef]
- Kim, Y.; Kim, K.H.; Park, J.; Yoon, H.I.; Sung, W. Prognosis Prediction for Glioblastoma Multiforme Patients Using Machine Learning Approaches: Development of the Clinically Applicable Model. Radiother. Oncol. 2023, 183, 109617. [Google Scholar] [CrossRef]
- Wan, Q.; Lindsay, C.; Zhang, C.; Kim, J.; Chen, X.; Li, J.; Huang, R.Y.; Reardon, D.A.; Young, G.S.; Qin, L. Comparative Analysis of Deep Learning and Radiomic Signatures for Overall Survival Prediction in Recurrent High-Grade Glioma Treated with Immunotherapy. Cancer Imaging 2025, 25, 5. [Google Scholar] [CrossRef] [PubMed]
- Acquitter, C.; Piram, L.; Sabatini, U.; Gilhodes, J.; Cohen-Jonathan, E.M.; Ken, S.; Lemasson, B. Radiomics-Based Detection of Radionecrosis Using Harmonized Multiparametric MRI. Cancers 2022, 14, 286. [Google Scholar] [CrossRef] [PubMed]
- Sheehan, J.P.; Lee, C.; Fadul, C.E. Progression versus Pseudoprogression: Radiological Differentiation with Contrast Clearance Analysis on Brain MRI. J. Neurooncol. 2024, 169, 695–696. [Google Scholar] [CrossRef]
- Elshafeey, N.; Kotrotsou, A.; Hassan, A.; Elshafei, N.; Hassan, I.; Ahmed, S.; Abrol, S.; Agarwal, A.; El Salek, K.; Bergamaschi, S.; et al. Multicenter Study Demonstrates Radiomic Features Derived from Magnetic Resonance Perfusion Images Identify Pseudoprogression in Glioblastoma. Nat. Commun. 2019, 10, 3170. [Google Scholar] [CrossRef]
- Vandenbroucke, J.P. Strengthening the Reporting of Observational Studies in Epidemiology (STROBE): Explanation and Elaboration. Ann. Intern. Med. 2007, 147, W163–W194. [Google Scholar] [CrossRef]
- Kocak, B.; Baessler, B.; Bakas, S.; Cuocolo, R.; Fedorov, A.; Maier-Hein, L.; Mercaldo, N.; Müller, H.; Orlhac, F.; Pinto dos Santos, D.; et al. CheckList for EvaluAtion of Radiomics Research (CLEAR): A Step-by-Step Reporting Guideline for Authors and Reviewers Endorsed by ESR and EuSoMII. Insights Imaging 2023, 14, 75. [Google Scholar] [CrossRef]
- Berger, T.R.; Wen, P.Y.; Lang-Orsini, M.; Chukwueke, U.N. World Health Organization 2021 Classification of Central Nervous System Tumors and Implications for Therapy for Adult-Type Gliomas: A Review. JAMA Oncol. 2022, 8, 1493–1501. [Google Scholar] [CrossRef]
- Welker, K.; Boxerman, J.; Kalnin, A.; Kaufmann, T.; Shiroishi, M.; Wintermark, M. ASFNR Recommendations for Clinical Performance of MR Dynamic Susceptibility Contrast Perfusion Imaging of the Brain. Am. J. Neuroradiol. 2015, 36, E41–E51. [Google Scholar] [CrossRef]
- OpenAI ChatGPT 2025. Available online: https://chatgpt.com/ (accessed on 20 February 2025).
- Ingenia 3.0T CX. Available online: https://www.philips.ie/healthcare/product/HC781271/ingenia-30t-cx#specifications (accessed on 18 February 2025).
- Li, X.; Morgan, P.S.; Ashburner, J.; Smith, J.; Rorden, C. The First Step for Neuroimaging Data Analysis: DICOM to NIfTI Conversion. J. Neurosci. Methods 2016, 264, 47–56. [Google Scholar] [CrossRef] [PubMed]
- Lowekamp, B.C.; Chen, D.T.; Ibáñez, L.; Blezek, D. The Design of SimpleITK. Front. Neuroinform. 2013, 7, 45. [Google Scholar] [CrossRef]
- Yaniv, Z.; Lowekamp, B.C.; Johnson, H.J.; Beare, R. SimpleITK Image-Analysis Notebooks: A Collaborative Environment for Education and Reproducible Research. J. Digit. Imaging 2018, 31, 290–303. [Google Scholar] [CrossRef] [PubMed]
- Beare, R.; Lowekamp, B.; Yaniv, Z. Image Segmentation, Registration and Characterization in R with SimpleITK. J. Stat. Softw. 2018, 86, 1–35. [Google Scholar] [CrossRef]
- Rorden, C.; Brett, M. Stereotaxic Display of Brain Lesions. Behav. Neurol. 2000, 12, 191–200. [Google Scholar] [CrossRef] [PubMed]
- van Griethuysen, J.J.M.; Fedorov, A.; Parmar, C.; Hosny, A.; Aucoin, N.; Narayan, V.; Beets-Tan, R.G.H.; Fillion-Robin, J.-C.; Pieper, S.; Aerts, H.J.W.L. Computational Radiomics System to Decode the Radiographic Phenotype. Cancer Res. 2017, 77, e104–e107. [Google Scholar] [CrossRef] [PubMed]
- Aerts, H.J.W.L.; Velazquez, E.R.; Leijenaar, R.T.H.; Parmar, C.; Grossmann, P.; Carvalho, S.; Bussink, J.; Monshouwer, R.; Haibe-Kains, B.; Rietveld, D.; et al. Decoding Tumour Phenotype by Noninvasive Imaging Using a Quantitative Radiomics Approach. Nat. Commun. 2014, 5, 4006. [Google Scholar] [CrossRef]
- Haralick, R.M.; Shanmugam, K.; Dinstein, I. Textural Features for Image Classification. IEEE Trans. Syst. Man. Cybern. 1973, SMC-3, 610–621. [Google Scholar] [CrossRef]
- Pedregosa, F.; Varoquaux, G.; Gramfort, A.; Michel, V.; Thirion, B.; Grisel, O.; Blondel, M.; Prettenhofer, P.; Weiss, R.; Dubourg, V.; et al. Scikit-Learn: Machine Learning in Python. J. Mach. Learn. Res. 2011, 12, 2825–2830. [Google Scholar]
- Hoefnagels, F.W.A.; Lagerwaard, F.J.; Sanchez, E.; Haasbeek, C.J.A.; Knol, D.L.; Slotman, B.J.; Peter Vandertop, W. Radiological Progression of Cerebral Metastases after Radiosurgery: Assessment of Perfusion MRI for Differentiating between Necrosis and Recurrence. J. Neurol. 2009, 256, 878–887. [Google Scholar] [CrossRef]
- Mayo, Z.S.; Halima, A.; Broughman, J.R.; Smile, T.D.; Tom, M.C.; Murphy, E.S.; Suh, J.H.; Lo, S.S.; Barnett, G.H.; Wu, G.; et al. Radiation Necrosis or Tumor Progression? A Review of the Radiographic Modalities Used in the Diagnosis of Cerebral Radiation Necrosis. J. Neurooncol. 2023, 161, 23–31. [Google Scholar] [CrossRef] [PubMed]
- Nguyen, T.B.; Zakhari, N.; Velasco Sandoval, S.; Guarnizo-Capera, A.; Alexios Gulak, M.; Woulfe, J.; Jansen, G.; Thornhill, R.; Majtenyi, N.; Cron, G.O. Diagnostic Accuracy of Arterial Spin-Labeling, Dynamic Contrast-Enhanced, and DSC Perfusion Imaging in the Diagnosis of Recurrent High-Grade Gliomas: A Prospective Study. Am. J. Neuroradiol. 2023, 44, 134–142. [Google Scholar] [CrossRef] [PubMed]
- Nael, K.; Bauer, A.H.; Hormigo, A.; Lemole, M.; Germano, I.M.; Puig, J.; Stea, B. Multiparametric MRI for Differentiation of Radiation Necrosis From Recurrent Tumor in Patients With Treated Glioblastoma. Am. J. Roentgenol. 2018, 210, 18–23. [Google Scholar] [CrossRef]
- van Raaij, M.E.; Lindvere, L.; Dorr, A.; He, J.; Sahota, B.; Foster, F.S.; Stefanovic, B. Quantification of Blood Flow and Volume in Arterioles and Venules of the Rat Cerebral Cortex Using Functional Micro-Ultrasound. Neuroimage 2012, 63, 1030–1037. [Google Scholar] [CrossRef]
- Kuo, F.; Ng, N.N.; Nagpal, S.; Pollom, E.L.; Soltys, S.; Hayden-Gephart, M.; Li, G.; Born, D.E. Michael DSC Perfusion MRI–Derived Fractional Tumor Burden and Relative CBV Differentiate Tumor Progression and Radiation Necrosis in Brain Metastases Treated with Stereotactic Radiosurgery. Am. J. Neuroradiol. 2022, 43, 689–695. [Google Scholar] [CrossRef]
- Kickingereder, P.; Burth, S.; Wick, A.; Götz, M.; Eidel, O.; Schlemmer, H.-P.; Maier-Hein, K.H.; Wick, W.; Bendszus, M.; Radbruch, A.; et al. Radiomic Profiling of Glioblastoma: Identifying an Imaging Predictor of Patient Survival with Improved Performance over Established Clinical and Radiologic Risk Models. Radiology 2016, 280, 880–889. [Google Scholar] [CrossRef] [PubMed]
- Tiwari, P.; Prasanna, P.; Rogers, L.; Wolansky, L.; Badve, C.; Sloan, A.; Cohen, M.; Madabhushi, A. Texture Descriptors to Distinguish Radiation Necrosis from Recurrent Brain Tumors on Multi-Parametric MRI; Aylward, S., Hadjiiski, L.M., Eds.; SPIE: San Diego, CA, USA, 2014; p. 90352B. [Google Scholar]
- Tiwari, P.; Prasanna, P.; Wolansky, L.; Pinho, M.; Cohen, M.; Nayate, A.P.; Gupta, A.; Singh, G.; Hatanpaa, K.J.; Sloan, A.; et al. Computer-Extracted Texture Features to Distinguish Cerebral Radionecrosis from Recurrent Brain Tumors on Multiparametric MRI: A Feasibility Study. Am. J. Neuroradiol. 2016, 37, 2231–2236. [Google Scholar] [CrossRef]
- Lohmann, P.; Stoffels, G.; Ceccon, G.; Rapp, M.; Sabel, M.; Filss, C.P.; Kamp, M.A.; Stegmayr, C.; Neumaier, B.; Shah, N.J.; et al. Radiation Injury vs. Recurrent Brain Metastasis: Combining Textural Feature Radiomics Analysis and Standard Parameters May Increase 18F-FET PET Accuracy without Dynamic Scans. Eur. Radiol. 2017, 27, 2916–2927. [Google Scholar] [CrossRef]
- Crisi, G.; Filice, S. Predicting MGMT Promoter Methylation of Glioblastoma from Dynamic Susceptibility Contrast Perfusion: A Radiomic Approach. J. Neuroimaging 2020, 30, 458–462. [Google Scholar] [CrossRef]
- Hashido, T.; Saito, S.; Ishida, T. A Radiomics-Based Comparative Study on Arterial Spin Labeling and Dynamic Susceptibility Contrast Perfusion-Weighted Imaging in Gliomas. Sci. Rep. 2020, 10, 6121. [Google Scholar] [CrossRef]
- Sudre, C.H.; Panovska-Griffiths, J.; Sanverdi, E.; Brandner, S.; Katsaros, V.K.; Stranjalis, G.; Pizzini, F.B.; Ghimenton, C.; Surlan-Popovic, K.; Avsenik, J.; et al. Machine Learning Assisted DSC-MRI Radiomics as a Tool for Glioma Classification by Grade and Mutation Status. BMC Med. Inform. Decis. Mak. 2020, 20, 149. [Google Scholar] [CrossRef]
- Kim, J.Y.; Park, J.E.; Jo, Y.; Shim, W.H.; Nam, S.J.; Kim, J.H.; Yoo, R.-E.; Choi, S.H.; Kim, H.S. Incorporating Diffusion- and Perfusion-Weighted MRI into a Radiomics Model Improves Diagnostic Performance for Pseudoprogression in Glioblastoma Patients. Neuro Oncol. 2019, 21, 404–414. [Google Scholar] [CrossRef] [PubMed]
- Lakhani, D.A.; Balar, A.B.; Koneru, M.; Wen, S.; Ozkara, B.B.; Caplan, J.; Dmytriw, A.A.; Wang, R.; Lu, H.; Hoseinyazdi, M.; et al. Perfusion-Based Relative Cerebral Blood Volume Is Associated With Functional Dependence in Large-Vessel Occlusion Ischemic Stroke. J. Am. Heart Assoc. 2024, 13, e034242. [Google Scholar] [CrossRef] [PubMed]
- Wen, P.Y.; van den Bent, M.; Youssef, G.; Cloughesy, T.F.; Ellingson, B.M.; Weller, M.; Galanis, E.; Barboriak, D.P.; de Groot, J.; Gilbert, M.R.; et al. RANO 2.0: Update to the Response Assessment in Neuro-Oncology Criteria for High- and Low-Grade Gliomas in Adults. J. Clin. Oncol. 2023, 41, 5187–5199. [Google Scholar] [CrossRef]
- Szczypiński, P.M.; Strzelecki, M.; Materka, A.; Klepaczko, A. MaZda—The Software Package for Textural Analysis of Biomedical Images BT—Computers in Medical Activity; Kącki, E., Rudnicki, M., Stempczyńska, J., Eds.; Springer: Berlin/Heidelberg, Germany, 2009; pp. 73–84. ISBN 978-3-642-04462-5. [Google Scholar]


| Total (N = 46) | Radionecrosis (n = 25) | Progression (n = 21) | p-Value | |
|---|---|---|---|---|
| Women | 24 (52.2) | 11 (44) | 13 (61.9) | 0.226 |
| Age | 54.4 ± 11.5 | 56.9 ± 11.7 | 51.5 ± 10.8 | 0.110 |
| Location | ||||
| Frontal | 18 (39.1) | 9 (36) | 9 (42.9) | |
| Parietal | 6 (13.0) | 5 (20) | 1 (4.8) | |
| Temporal | 16 (34.8) | 6 (24) | 10 (47.6) | 0.173 |
| Occipital | 2 (4.3) | 2 (8) | 0 (0) | |
| Other * | 4 (8.7) | 3 (12) | 1 (4.8) | |
| Side = right | 18 (39.1) | 11 (44) | 7 (33.3) | 0.551 |
| High-grade glioma | 36 (78.2) | 18 (72) | 18 (85.7) | 0.306 |
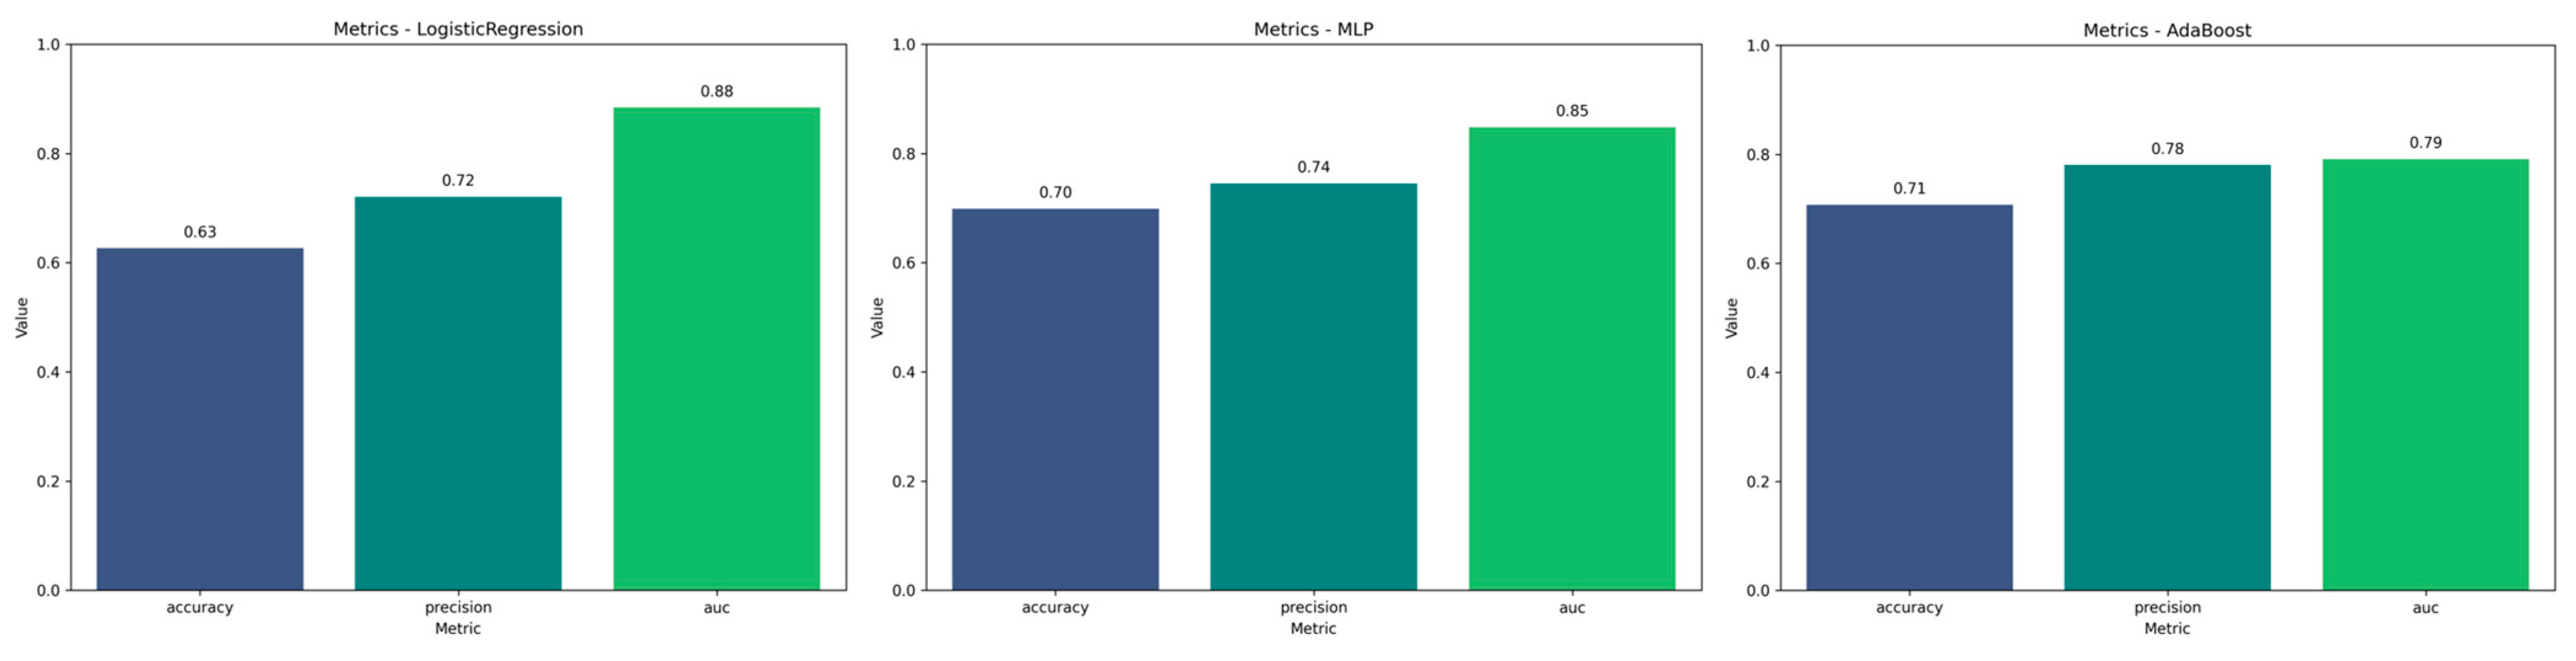
| Model | Accuracy | Precision | AUC mean |
|---|---|---|---|
| LogisticRegression | 0.6264 | 0.7205 | 0.8842 |
| MLP | 0.6986 | 0.7449 | 0.8479 |
| AdaBoost | 0.7074 | 0.7803 | 0.7915 |
| SVC | 0.6727 | 0.7074 | 0.7946 |
| GradientBoosting | 0.6899 | 0.6968 | 0.7854 |
| kNN | 0.7127 | 0.7327 | 0.7388 |
| CatBoost | 0.5673 | 0.6388 | 0.7326 |
| ExtraTrees | 0.6041 | 0.7038 | 0.7185 |
| LDA | 0.6326 | 0.7532 | 0.7055 |
| LightGBM | 0.6015 | 0.6812 | 0.6993 |
| DecisionTree | 0.5906 | 0.6568 | 0.6279 |
| GaussianNB | 0.5236 | 0.6562 | 0.5944 |
| XGBoost | 0.6367 | 0.6854 | 0.7420 |
| RandomForest | 0.5695 | 0.6591 | 0.6781 |
Disclaimer/Publisher’s Note: The statements, opinions and data contained in all publications are solely those of the individual author(s) and contributor(s) and not of MDPI and/or the editor(s). MDPI and/or the editor(s) disclaim responsibility for any injury to people or property resulting from any ideas, methods, instructions or products referred to in the content. |
© 2025 by the authors. Licensee MDPI, Basel, Switzerland. This article is an open access article distributed under the terms and conditions of the Creative Commons Attribution (CC BY) license (https://creativecommons.org/licenses/by/4.0/).
Share and Cite
Martínez Barbero, J.P.; García, F.J.P.; López Cornejo, D.; García Cerezo, M.; Gutiérrez, P.M.J.; Balderas, L.; Lastra, M.; Arauzo-Azofra, A.; Benítez, J.M.; Ramos-Bossini, A.J.L. A Combined Approach Using T2*-Weighted Dynamic Susceptibility Contrast MRI Perfusion Parameters and Radiomics to Differentiate Between Radionecrosis and Glioma Progression: A Proof-of-Concept Study. Life 2025, 15, 606. https://doi.org/10.3390/life15040606
Martínez Barbero JP, García FJP, López Cornejo D, García Cerezo M, Gutiérrez PMJ, Balderas L, Lastra M, Arauzo-Azofra A, Benítez JM, Ramos-Bossini AJL. A Combined Approach Using T2*-Weighted Dynamic Susceptibility Contrast MRI Perfusion Parameters and Radiomics to Differentiate Between Radionecrosis and Glioma Progression: A Proof-of-Concept Study. Life. 2025; 15(4):606. https://doi.org/10.3390/life15040606
Chicago/Turabian StyleMartínez Barbero, José Pablo, Francisco Javier Pérez García, David López Cornejo, Marta García Cerezo, Paula María Jiménez Gutiérrez, Luis Balderas, Miguel Lastra, Antonio Arauzo-Azofra, José M. Benítez, and Antonio Jesús Láinez Ramos-Bossini. 2025. "A Combined Approach Using T2*-Weighted Dynamic Susceptibility Contrast MRI Perfusion Parameters and Radiomics to Differentiate Between Radionecrosis and Glioma Progression: A Proof-of-Concept Study" Life 15, no. 4: 606. https://doi.org/10.3390/life15040606
APA StyleMartínez Barbero, J. P., García, F. J. P., López Cornejo, D., García Cerezo, M., Gutiérrez, P. M. J., Balderas, L., Lastra, M., Arauzo-Azofra, A., Benítez, J. M., & Ramos-Bossini, A. J. L. (2025). A Combined Approach Using T2*-Weighted Dynamic Susceptibility Contrast MRI Perfusion Parameters and Radiomics to Differentiate Between Radionecrosis and Glioma Progression: A Proof-of-Concept Study. Life, 15(4), 606. https://doi.org/10.3390/life15040606