Abstract
Schisandra chinensis (Turcz.) Baill. (S. chinensis) is a widely used medicinal plant whose therapeutic efficacy is closely linked to its lignan content. While previous studies have focused on soil fertility and cultivar variation, the interplay among soil nutrients, rhizosphere microbiota, and lignan accumulation remains poorly understood. This study investigated S. chinensis grown across 20 cultivation sites to elucidate the relationships among soil nutrient profiles, fruit lignan composition, and rhizosphere microbial communities. Six major lignans were quantified using HPLC, soil nutrients were analyzed via standard chemical assays, and rhizosphere bacterial communities were profiled using 16S rRNA sequencing. Multivariate analyses revealed significant variation in soil properties and lignan content across sites. Notably, available phosphorus, organic matter, and total nitrogen showed strong correlations with specific lignan compounds. From the top 50 taxa ranked by relative abundance at the genus level, 18 bacterial genera associated with lignan components were identified. Among them, Mycobacterium, Arthrobacter, Haliangium, Bacillus, Sphingomonas, Rhodanobacter, Ellin6067, Bradyrhizobium, Pseudolabrys, Chujaibacter, Gemmatimonas, Bryobacter, MND1, Candidatus Sollbacter, Gaiella, Paenibacillus, RB41, and Candidatus_Udaeobacter were significantly associated with lignan levels, suggesting potential microbial involvement in lignan biosynthesis. These findings provide insights into the ecological factors shaping the medicinal quality of S. chinensis and offer a foundation for targeted cultivation and breeding strategies.
1. Introduction
Schisandra chinensis (Turcz.) Bail. (S. chinensis) is a plant of the Schisandraceae family, is also known as mountain pepper, and is commonly called “Northern Schisandra chinensis”. It is mainly distributed in Northeast China, the Korean Peninsula, and the Far East of Russia [1]. It has a long history of medicinal use, which can be traced back to the “Compendium of Materia Medica” compiled by Li Shizhen in 1596. It has the effects of astringing and securing, replenishing qi and promoting the production of body fluids, tonifying the kidney and calming the mind, etc. [2]. Modern pharmacological studies have shown that S. chinensis is rich in various bioactive components, including lignans, phenolic acids, triterpenoids, polysaccharides, volatile oils, and vitamins [3]. Among them, lignans, as genus-specific polyphenolic compounds, are its most representative pharmacologically active components [4]. To date, 86 types of lignans have been isolated and identified from S. chinensis. In particular, dibenzocyclooctadiene lignans have shown significant activities in liver protection, anti-inflammatory, anti-oxidation, anti-cancer, and other aspects [5,6,7,8,9,10]. In addition, the fruits of S. chinensis are also rich in functional components such as organic acids, anthocyanins, and vitamins C and E, making them widely used in the fields of traditional Chinese medicine, health products, and cosmetics [11,12]. With the expansion of the application fields of S. chinensis, the industry of S. chinensis Chinese medicinal materials has shown a strong development momentum, and its planting scale has been expanding year by year. However, there is a significant difference in the quality of S. chinensis [13]. Studies have reported that compared with wild S. chinensis resources, the active ingredients of field-grown S. chinensis are lower, while the active ingredients of understory-grown S. chinensis are close to those of the wild type. Therefore, it is imperative to study the cultivation techniques of S. chinensis and improve its medicinal quality [14,15]. Therefore, it is imperative to study the cultivation techniques of S. chinensis and improve its medicinal quality. Up to now, a large number of research reports have still focused on the study of the pharmacological activities of S. chinensis [16,17,18,19,20,21,22,23]. Research on its cultivation techniques remains relatively superficial, and there is still a lack of systematic exploration on the relationships between the soil environment, rhizosphere microbial community, and the active components of S. chinensis [13]. Existing studies have shown that plant rhizosphere microorganisms play an important role in regulating the synthesis of secondary metabolites, and soil physical and chemical properties may also affect the accumulation of medicinal components [24,25].
Given the observed variation in fruit lignan content across cultivation regions, we hypothesize that soil nutrient profiles play a critical role in regulating lignan accumulation in Schisandra chinensis and that site-specific differences in rhizosphere microbial communities are closely linked to lignan biosynthesis. To test these hypotheses, we conducted a comparative study using wild germplasm resources from Zhashui (Shaanxi) and Jingyu (Jilin), analyzing soil physicochemical properties, rhizosphere microbial composition, and fruit lignan profiles. Although previous studies have suggested that soil conditions and microbial communities can influence the production of secondary metabolites in medicinal plants, the integrated mechanism connecting soil–microbe–metabolite interactions in S. chinensis remains largely unexplored. This study aims to elucidate how environmental factors shape the medicinal quality of S. chinensis, thereby providing a scientific foundation for breeding high-quality varieties, developing ecological cultivation strategies, and promoting the sustainable development of the S. chinensis industry.
2. Materials and Methods
2.1. Collection of Plant and Soil Samples
The experimental materials in this study consisted of rhizosphere soil and mature fruit samples from 20 individual S. chinensis plants. Samples Sc1–Sc14 were collected from naturally grown plants in Jingyu County, Jilin Province, while Sc15–Sc20 were obtained from cultivated plants in Zhashui County, Shaanxi Province. For each plant, three subsamples were collected as replicates. Detailed sampling locations and geographic coordinates are provided in Table 1. For each site, healthy and vigorously growing S. chinensis plants, free from visible signs of disease or insect infestation, were selected for sampling.

Table 1.
Origin of the samples.
During the harvest season, mature fruits of S. chinensis were collected, thoroughly rinsed with deionized water, and dried in a forced-air drying oven (DHG-9013A, Shanghai Yiheng Scientific Instruments Co., Ltd., Shanghai, China). The dried fruits were then ground into powder using a laboratory grinder (TQ-500Y, Yongkang Tianqi Shengshi Industry and Trade Co., Ltd., Jinhua, China). To obtain rhizosphere soil samples, surface weeds surrounding the selected plants were carefully removed, and the root systems were gently excavated. Loose soil was shaken off, and the soil tightly adhering to the root surfaces was meticulously brushed off using sterile brushes. The collected rhizosphere soil was transferred into sterile 2 mL centrifuge tubes, flash-frozen in liquid nitrogen, and stored at −80 °C until further analysis.
2.2. Detection of Soil Physicochemical Properties
Soil pH was measured using a calibrated pH meter after mixing soil and water in a ratio of 1:2.5 [26].
Organic matter (OM) content was quantified via the potassium dichromate volumetric method with external heating [26].
Total phosphorus (TP) was determined by sulfuric acid–perchloric acid (H2SO4-HClO4) digestion. Specifically, 1.0000 g of air-dried soil (passed through a 0.149 mm sieve) was digested with 4 mL of concentrated H2SO4 and 1 mL of HClO4 on a heating plate until the sample turned grayish-white. After cooling, the digest was diluted to 100 mL with distilled water and analyzed using a continuous flow chemical analyzer (SKALAR SAN++) [27].
Available phosphorus (AP) was extracted using 0.5 M sodium bicarbonate (NaHCO3). A 1.25 g soil sample (2 mm sieve) was shaken with 25 mL of extractant for 30 min at room temperature. The filtrate was analyzed using the SKALAR SAN++ system [27].
Total potassium (TK) was analyzed using inductively coupled plasma atomic emission spectrometry (ICP-AES, ICPS-7500). A 0.1000 g soil sample (0.149 mm sieve) was digested with a mixture of HNO3, HClO4, and HF. After digestion and evaporation to near dryness, the residue was diluted with 10% HNO3 and analyzed. A blank experiment was conducted in parallel [27].
Available potassium (AK) was extracted using 1 M ammonium acetate (CH3COONH4). A 2.50 g soil sample (2 mm sieve) was shaken with 25 mL of extractant for 30 min and filtered. The filtrate was analyzed using ICP-AES (ICPS-7500) [27].
Total nitrogen (TN) was determined using the SKALAR SAN++ analyzer. A 1.0000 g soil sample (0.149 mm sieve) was digested with 1.8 g of catalyst mixture (Se:CuSO4:K2SO4 = 1:10:100) and 4 mL of concentrated H2SO4 until the solution turned greenish and no black particles remained. The digest was diluted to 100 mL and analyzed [26,27].
Ammonium Nitrogen (AN) was Measured using the diffusion-titration method. A 2.00 g soil sample (2 mm sieve) was placed in the outer chamber of a diffusion dish. The inner chamber contained 3 mL of 2% boric acid (H3BO3) indicator. After sealing, 10 mL of 1 mol/L NaOH was added, and the dish was incubated at 40 °C for 24 h. The boric acid solution was then titrated with 0.012 mol/L HCl until the endpoint color changed. A blank was run simultaneously for calibration [26,27].
2.3. Determination of Schisandra Lignan Content
Standard reference solutions were prepared by accurately weighing 1.00 mg of schisandrol A (CJ), (National Institutes for Food and Drug Control, Beijing, China, Batch No. 110857-201412), 1.43 mg of schisandrol B (CY), (Shanghai Ronghe Pharmaceutical Technology Co., Ltd., Shanghai, China, Batch Number 151024), 1.24 mg of schisantherin A (ZJ), (Shanghai Ronghe Pharmaceutical Technology Co., Ltd., Shanghai, China, Batch Number 151103), 1.25 mg of schisandrin A(JS), (National Institutes for Food and Drug Control, Beijing, China, Batch No. 110764-201513), 1.29 mg of schisandrin B(YS), (National Institutes for Food and Drug Control, Beijing, China, Batch No. 110765-201311) and 1.16 mg of schisandrin C(BS), (Shanghai Ronghe Pharmaceutical Technology Co., Ltd., Shanghai, China, Batch No. 151009). Each compound was dissolved in HPLC-grade methanol (Thermo Fisher China Co., Ltd., Beijing, China, UN1230) and diluted to a final volume of 5 mL. The solutions were vortex-mixed and subsequently filtered through a 0.45 μm organic membrane filter prior to use.
Dried S. chinensis fruit powder (0.10 g per sample) was accurately weighed in six replicates and transferred into 15 mL centrifuge tubes. Each sample was extracted with 10 mL of HPLC-grade methanol. The mixtures were vortexed for 20 min, incubated in a water bath at 65 °C for 20 min, and then subjected to ultrasonic extraction using a 320 W generator (Shenzhen Jiemeng Cleaning Equipment Co., Ltd., Shenzhen, China, JP-010T) at 65 °C for an additional 20 min. The resulting extracts were filtered through a 0.45 μm membrane into vials for chromatographic analysis.
Lignan separation was performed using an Agilent 880975-902 SB-C18 analytical column (4.6 × 250 mm). The mobile phase consisted of methanol (solvent D) and water (solvent C), applied under a gradient elution program as detailed in Table 2. The flow rate was maintained at 1.0 mL/min, the column temperature was set to 35 °C, and detection was carried out at 220 nm. The injection volume was 10 μL.
Table 2.
High-performance liquid gradient elution condition.
2.4. Assessment of Microbial Diversity in Rhizosphere Soil
Microbial DNA was extracted from rhizosphere soil samples using the E.Z.N.A.® Soil Microbial DNA Extraction Kit (Omega Bio-Tek, Norcross, GA, USA). The V3–V4 hypervariable region of the bacterial 16S rRNA gene was amplified using primers 338F (5′-ACTCCTACGGGAGGCAGCAG-3′) and 806R (5′-GGACTACHVGGGTWTCTAAT-3′). Purified amplicons were sequenced on the Illumina MiSeq PE300 platform [28]. Raw sequencing data were deposited in the National Genomics Data Center (NGDC), (https://ngdc.cncb.ac.cn/gsub/submit/bioproject/PRJCA045516) (accessed on 1 September 2025). All sequencing work was performed by Majorbio Bio-Pharm Technology Co., Ltd. (Shanghai, China).
Sequence data were processed using a combination of internal Perl scripts, fastp (v0.19.6) [29], and FLASH (v1.2.7) [30] for quality filtering, merging, and optimization. High-quality sequences were clustered into operational taxonomic units (OTUs) at a 97% similarity threshold using UPARSE (v7.1) [31,32]. Taxonomic classification and annotation were performed using the RDP Classifier Bayesian algorithm [33]. Bioinformatics analyses were conducted on the MeijiYun cloud platform. Alpha diversity indices were calculated using Mothur (v1.30.1) [34] based on OTU data. Differences in microbial community composition among samples were assessed using R (v3.3.1) and the pheatmap package (v1.0.8). Community similarity was evaluated using the Vegan package (v2.5.3), and correlation analyses were also performed using pheatmap.
2.5. Data Analysis
Statistical analyses of the mean values, standard deviations, and multiple comparisons (Tukey’s HSD test) for soil physicochemical properties and schisandrin content in S. chinensis were performed using SPSS 23.0 software. Spearman’s correlation analysis was conducted using GraphPad Prism 8.
3. Results
3.1. Physicochemical Characteristics of Rhizosphere Soil of S. chinensis
Eight physicochemical parameters were analyzed across twenty rhizosphere soil samples collected from S. chinensis cultivation sites (Table 3). The soils exhibited slightly acidic conditions, with pH values ranging from 5.27 to 6.46, which are generally conducive to plant growth [35]. Significant differences were observed in the contents of soil organic matter (OM), available phosphorus (AP), available potassium (AK), and total nitrogen (TN) among the soil samples. OM ranged from 2.84% to 24.55%, with a coefficient of variation (CV) of 59.54%. AP varied between 10.03 mg/kg and 299.16 mg/kg (CV = 93.48%), while AK ranged from 32.28 mg/kg to 244.3 mg/kg (CV = 56.35%). TN concentrations spanned from 1395.72 mg/kg to 11,371.56 mg/kg, indicating substantial variability in nitrogen availability. Further analysis revealed that samples from Zhashui exhibited TN levels between 1395.72 and 1981.05 mg/kg, whereas samples from Jingyu ranged from 3466.88 to 11,371.56 mg/kg—representing a 1.8- to 8.1-fold increase compared to Zhashui. Similarly, available nitrogen (AN) in Zhashui samples ranged from 114.24 to 146.72 mg/kg, while Jingyu samples showed markedly higher values between 266.56 and 688.24 mg/kg, which were 1.8 to 6.0 times greater than those in Zhashui.
Table 3.
Analysis of physicochemical properties of rhizosphere soil in S. chinensis.
These findings highlight substantial spatial heterogeneity in soil nutrient distribution across sampling sites. Such variability may significantly influence the growth performance of Schisandra chinensis and the biosynthesis of its pharmacologically active compounds.
3.2. Variation in Lignan Content Among Schisandra chinensis Fruit Samples
The lignan content in S. chinensis fruit samples is summarized in Table 4, with each value representing the mean ± standard deviation from three replicate measurements. Among the 20 samples, schisandrol A (CJ) ranged from 4.34 to 9.11 mg/g, with a coefficient of variation (CV) of 22.11%, indicating relatively low variability and no significant differences among samples. In contrast, schisantherin A (ZJ) showed a wider range of 0.40 to 2.24 mg/g and a CV of 57.84%; schisandrin B (CY) ranged from 0.67 to 6.96 mg/g (CV = 56.01%); and schisandrin C (BS) varied from 0.13 to 1.37 mg/g (CV = 68.32%). These components exhibited substantial variation across samples, suggesting significant differences in their accumulation patterns.
Table 4.
Analysis of lignan content in S. chinensis fruits.
3.3. Correlation Analysis Among Soil Physicochemical Properties and Lignan Components
Spearman’s correlation analysis (ρ) between soil physicochemical indicators and lignan content was conducted using GraphPad Prism 8 software (Figure 1). The results revealed that total potassium (TK) exhibited extremely significant negative correlations with organic matter (OM), available phosphorus (AP), alkali-hydrolyzable nitrogen (AN), and total nitrogen (TN). Available potassium (AK) was significantly positively correlated with soil pH. Available phosphorus (AP) showed significant negative correlations with both pH and AK. Total phosphorus (TP) was significantly positively correlated with OM, AP, TN, and AN but significantly negatively correlated with TK (Figure 1).
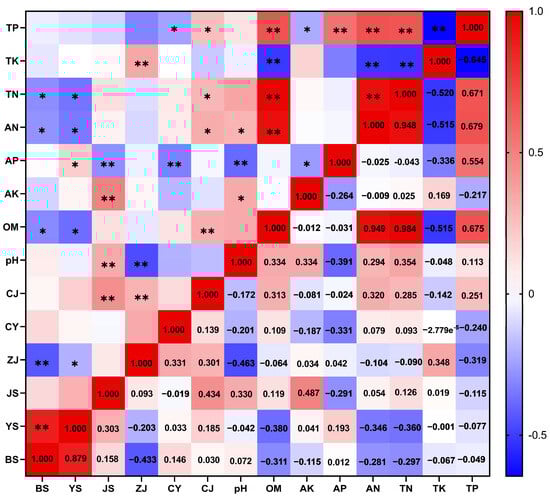
Figure 1.
Spearman correlation analysis of soil physical and chemical indicators and lignans (Spearman’s ρ). TP: total phosphorus; TK: total potassium; TN: total nitrogen; AN: available nitrogen; AP: available phosphorus; AK: available potassium; OM: soil organic matter; pH: soil pH; CJ: Schisandrol A; CY: Schisandrol B; ZJ: Schisantherin A; JS: Schisandrin A; YS: Schisandrin B; BS: Schisandrin C. TL: total lignans. The lower right triangle displays Spearman’s correlation coefficients (ρ), while the upper left triangle indicates statistical significance: * denotes p < 0.05, ** denotes p < 0.01.
Correlation analysis revealed distinct relationships between lignan content and soil physicochemical parameters. Samples with higher levels of schisandrol A (CJ) tended to exhibit elevated concentrations of organic matter (OM), total phosphorus (TP), and total nitrogen (TN). In contrast, higher schisandrol B (CY) content was associated with lower levels of available phosphorus (AP). Schisantherin A (ZJ) showed a positive correlation with total potassium (TK), but a negative correlation with both pH and TP. Schisandrin A (JS) content increased with higher levels of available potassium (AK) and pH, while it decreased with increasing AP. Notably, schisandrin B (YS) and schisandrin C (BS) contents were negatively correlated with TN, alkali-hydrolyzable nitrogen (AN), and OM (Figure 1).
3.4. Analysis of Microbial Diversity in the Rhizosphere of S. chinensis
To investigate the microbial diversity in the rhizosphere of S. chinensis, 16S rRNA high-throughput sequencing was performed on 20 root-associated soil samples. A total of 1,738,740 high-quality sequences were obtained. After clustering at a 97% sequence similarity threshold, 13,442 operational taxonomic units (OTUs) were identified, encompassing 45 phyla, 622 families, and 1224 genera. At the phylum level, 16 bacterial phyla exhibited relative abundances exceeding 1%. The dominant phyla included Actinobacteriota (26.1%), Proteobacteria (20.3%), Acidobacteriota (19.8%), and Chloroflexi (12.8%) (Figure 2A). At the generic level, 59 bacterial genera had relative abundances greater than 1%. The most prevalent genera included RB41, Gaiella, Bradyrhizobium, Rhodanobacter, Pseudolabrys, Mycobacterium, and Arthrobacter. Notably, samples Sc4, Sc5, and Sc14 exhibited similar microbial profiles, with Rhodanobacter showing a relative abundance ranging from 6.0% to 12.2% (Figure 2B), indicating potential regional or environmental consistency in microbial community structure.
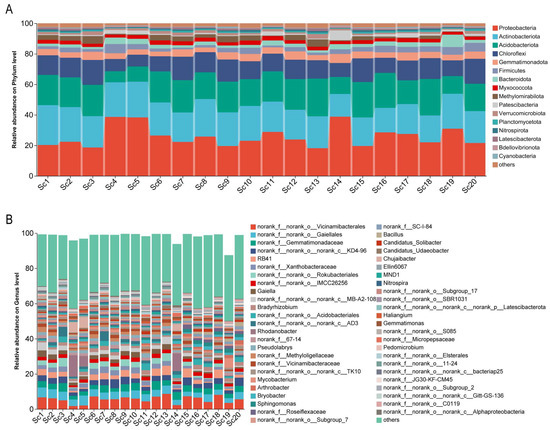
Figure 2.
Community barplot analysis of rhizosphere bacterial composition associated with different S. chinensis resources. (A) Relative abundance of rhizosphere bacterial communities at the phylum level. (B) Relative abundance of rhizosphere bacterial communities at the generic level. Sc1-Sc20: S. chinensis at different cultivation sites.
To further assess compositional differences among samples, principal coordinates analysis (PCoA) was conducted. The results, as shown in Figure 3, indicate that samples collected from the same geographic region clustered closely, suggesting spatial homogeneity in rhizosphere microbial communities. Specifically, samples Sc4, Sc5, and Sc14 displayed high similarity in microbial composition, whereas sample Sc19 exhibited a distinct microbial profile, diverging significantly from the other samples. This observation aligns with the taxonomic composition analysis, reinforcing the influence of local environmental factors on rhizosphere microbial diversity.
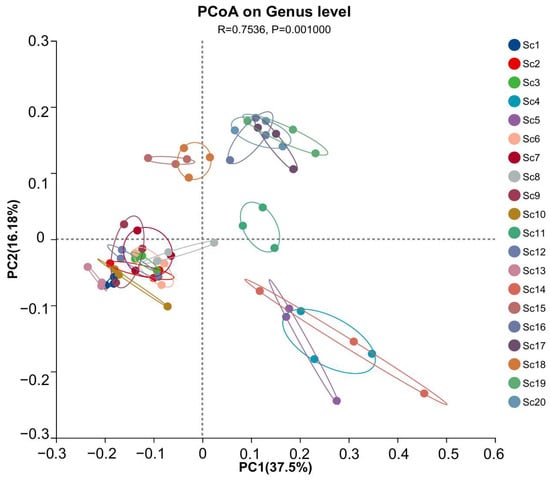
Figure 3.
Principal coordinates analysis (PCoA) of rhizosphere microbial communities associated with different S. chinensis resources. Sc1–Sc20: S. chinensis resources. Clustering patterns reflect differences in microbial composition. The analysis was performed at the genus level. PC1 and PC2 explain 37.5% and 16.18% of the total variation, respectively. Statistical significance was assessed using PERMANOVA (R = 0.7536, p = 0.001).
3.5. Correlation Analysis Between Dominant Bacterial Genera, Soil Properties, and Lignan Components
At the genus level, taxonomic identification was performed on the top 50 most abundant operational taxonomic units (OTUs), resulting in the clear classification of 20 dominant bacterial genera (Figure 4). These genera were affiliated with eight phyla: Actinobacteriota, Myxococcota, Firmicutes, Proteobacteria, Gemmatimonadota, Acidobacteriota, Nitrospirota, and Verrucomicrobiota. Correlation correlation analysis revealed that Mycobacterium, Arthrobacter, Haliangium, Bacillus, Sphingomonas, Rhodanobacter, Ellin6067, Bradyrhizobium, Pseudolabrys, Chujaibacter, Gemmatimonas, Bryobacter, MND1, Candidatus Sollbacter, and Nitrospira were significantly or highly significantly positively correlated with lignan components. In contrast, Gaiella, Paenibacillus, RB41, and Candidatus_Udaeobacter showed significant or highly significant negative correlations with lignan accumulation.
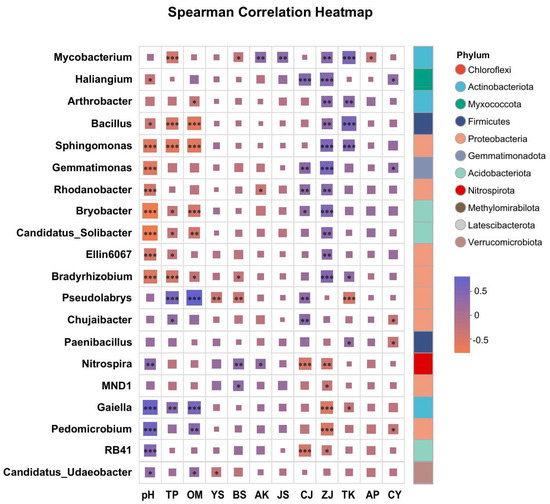
Figure 4.
Spearman correlation analysis of lignan-associated rhizosphere microorganisms with soil physicochemical properties and lignan components in S. chinensis. TP: total phosphorus; TK: total potassium; TN: total nitrogen; AN: available nitrogen; AP: available phosphorus; AK: available potassium; OM: soil organic matter; pH: soil pH; CJ: schisandrol A; CY: schisandrol B; ZJ: schisantherin A; JS: schisandrin A; YS: schisandrin B; BS: schisandrin C. TL: total lignans. Significant correlations are indicated by asterisks: * p < 0.05, ** p ≤ 0.01, *** p ≤ 0.001.
Moreover, the relative abundance of these genera was significantly influenced by soil pH, total phosphorus (TP), and organic matter (OM), suggesting that soil nutrient conditions play a key role in shaping microbial community structure and may indirectly affect lignan biosynthesis in S. chinensis.
4. Discussion
This study provides a comprehensive analysis of rhizosphere soil physicochemical properties, fruit lignan content, and microbial community structure of S. chinensis across multiple cultivation sites. The findings reveal intricate and dynamic relationships among soil nutrient status, microbial diversity, and the biosynthesis of medicinal compounds, particularly lignans. Key soil physicochemical parameters, including pH, OM, TP, and TK, exert significant influence on lignan accumulation. Variations in these soil factors were closely associated with differences in the concentration of major lignan compounds such as schisandrol A, schisantherin A, and schisandrin B. These observations are consistent with previous studies indicating that soil fertility and nutrient availability play critical roles in secondary metabolite production in medicinal plants [1,26,27].
Importantly, this study advances current understanding by integrating soil nutrient profiles with rhizosphere microbial community data to explore their combined influence on lignan biosynthesis. While earlier research has separately examined soil conditions or microbial effects, the integrated soil–microbe–metabolite framework presented here offers a novel perspective [36,37]. As core indicators of soil fertility, physicochemical properties not only support plant growth but also shape microbial communities and regulate metabolic pathways [38,39,40]. Numerous studies have demonstrated strong correlations between soil nutrients and secondary metabolites in medicinal plants, such as anthraquinones in Rheum officinale [41], polysaccharides and saponins in Polygonatum kingianum [42], and ginsenosides in Panax ginseng [43]. In alignment with these findings, our results show that lignan content in S. chinensis is significantly correlated with OM, pH, available phosphorus (AP), and total nitrogen (TN), reinforcing the hypothesis that soil conditions indirectly regulate metabolite accumulation via microbial mediation [44].
The microbial analysis identified 45 phyla and 1224 genera, with dominant taxa including Proteobacteria, Actinobacteriota, Acidobacteriota, and Chloroflexi—consistent with rhizosphere profiles of other economically important crops [45,46]. Among the 59 genera with relative abundance exceeding 1%, Bacillus and Stenotrophomonas were notably enriched in samples from the Zhashui region, echoing previous reports [36]. These genera, along with others such as Arthrobacter and Paenibacillus, have been shown to enhance biomass and active compound accumulation in medicinal plants [47,48,49,50,51,52]. Their presence and abundance patterns suggest potential functional roles in regulating lignan biosynthesis, aligning with our hypothesis that site-specific microbial communities contribute to metabolite variation.
5. Conclusions
This study systematically investigated the rhizosphere soil physicochemical properties, fruit lignan content, and microbial community structure of Schisandra chinensis across different cultivation sites. The results demonstrated that potassium fertilization significantly promoted lignan accumulation, whereas nitrogen fertilization had a pronounced inhibitory effect. Soil pH, organic matter (OM), total phosphorus (TP), and total potassium (TK) were found to strongly influence the distribution of rhizosphere microbial communities. Moreover, dominant bacterial genera—including Mycobacterium, Arthrobacter, Bradyrhizobium, and Rhodanobacter—exhibited strong correlations with lignan content and were notably affected by soil nutrient conditions.
These findings underscore the indispensable roles of both soil fertility and rhizosphere microbial composition in shaping the medicinal quality of S. chinensis. Future research should focus on functional validation of key microbial taxa and elucidation of their mechanistic contributions to lignan biosynthesis. Such insights will provide a scientific foundation for targeted soil management and microbial interventions aimed at enhancing fruit quality and supporting sustainable cultivation practices.
Author Contributions
Conceptualization, P.X.; W.L. and S.Y.; Methodology, Y.W. and J.L.; Software, C.L.; Validation, H.Q. and N.S.; Formal Analysis, Y.Y. and C.L.; Investigation, S.F. and Y.W. (Yue Wang); Data curation, J.Z. and B.Z.; Writing—Original Draft Preparation, Y.W. (Yanli Wang); Writing—Review and Editing, Y.W. (Yanli Wang) and P.X.; Visualization, N.S. and J.W.; Supervision, S.Y.; Project Administration, P.X.; Funding Acquisition, P.X. All authors have read and agreed to the published version of the manuscript.
Funding
This work was funded by the Scientific and Technological Achievement Transformation Program of Jilin Province: 20250301036YY, and the Jilin Provincial Key Laboratory of Traditional Chinese Medicinal Materials Cultivation and Propagation.
Institutional Review Board Statement
Not applicable.
Informed Consent Statement
Not applicable.
Data Availability Statement
16S rRNA sequencing raw data can be downloaded at the National Genomics Data Center (NGDC), (https://ngdc.cncb.ac.cn/gsub/submit/bioproject/PRJCA045516) (accessed on 1 September 2025) when the article is published. The data presented in this study are available on request from the corresponding author.
Acknowledgments
We are grateful to the National Forest Germplasm Resource Bank of Actinidia arguta and Schisandra chinensis for providing the samples.
Conflicts of Interest
The authors declare no conflicts of interest.
References
- Wang, Y.; Yang, Y.; Li, C.; Liu, Y.; Fan, S.; Yan, Y.; Tian, T.; Li, J.; Wang, Y.; Qin, H.; et al. Analysis of Lignan Content and Rhizosphere Microbial Diversity of Schisandra chinensis (Turcz.) Baill. Resources. Life 2024, 14, 946. [Google Scholar] [CrossRef]
- Chinese Pharmacopoeia Commission. Pharmacopoeia of the People’s Republic of China, 11th ed.; Volume I: Schisandra chinensis; National Pharmacopoeia Commission, Medical Science Press: Beijing, China, 2020. [Google Scholar]
- Jia, M.; Zhou, L.; Lou, Y.; Yang, X.; Zhao, H.; Ouyang, X.; Huang, Y. An analysis of the nutritional effects of Schisandra chinensis components based on mass spectrometry technology. Frontiers 2023, 10, 1227027. [Google Scholar] [CrossRef]
- Rybnikář, M.; Šmejkal, K.; Žemlička, M. Schisandra chinensis and its phytotherapeutical applications. Czech Slov. Farm. 2019, 68, 95–118. [Google Scholar] [CrossRef]
- Panossian, A.; Wikman, G. Pharmacology of Schisandra chinensis Bail: An overview of Russian research and uses in medicine. J. Ethnopharmacol. 2008, 118, 183. [Google Scholar] [CrossRef] [PubMed]
- Szopa, A.; Ekiert, R.; Ekiert, H. Current knowledge of Schisandra chinensis (Turcz.) Baill. (Chinese magnolia vine) as a medicinal plant species: A review on the bioactive components, pharmacological properties, analytical and biotechnological studies. Phytochem. Rev. 2017, 16, 195–218. [Google Scholar] [CrossRef] [PubMed]
- Kopustinskiene, D.M.; Bernatoniene, J. Antioxidant effects of Schisandra chinensis fruits and their active constituents. Antioxidants 2021, 10, 620. [Google Scholar] [CrossRef] [PubMed]
- Yang, S.; Yuan, C. Schisandra chinensis: A comprehensive review on its phytochemicals and biological activities. Arab. J. Chem. 2021, 14, 103310. [Google Scholar] [CrossRef]
- Ehambarampillai, D.; Wan, M.L. A comprehensive review of Schisandra chinensis lignans: Pharmacokinetics, pharmacological mechanisms, and future prospects in disease prevention and treatment. Chin. Med. 2025, 20, 47. [Google Scholar] [CrossRef]
- Wu, Z.; Jia, M.; Zhao, W.; Huang, X.; Yang, X.; Chen, D.; Qiaolongbatu, X.; Li, X.; Wu, J.; Qian, F.; et al. Schisandrol A, the main active ingredient of Schisandrae Chinensis Fructus, inhibits pulmonary fibrosis through suppression of the TGF-β signaling pathway as revealed by UPLC-Q-TOF/MS, network pharmacology and experimental verification. J. Ethnopharmacol. 2022, 289, 115031. [Google Scholar] [CrossRef]
- Chun, J.N.; Cho, M.; So, I.; Jeon, J. The protective effects of Schisandra chinensis fruit extract and its lignans against cardio-vascular disease: A review of the molecular mechanisms. Fitoterapia 2014, 97, 224–233. [Google Scholar] [CrossRef]
- Li, J.; Zuo, Z. Science of Prescriptions; China Press of Traditional Chinese Medicine: Beijing, China, 2021. (In Chinese) [Google Scholar]
- Jia, E.; Dong, J.; Ma, P. A new industrial model: The utilization of the traditional Chinese herb Schisandra chinensis (Turcz.) Baill. from soil to plate. Ind. Crops Prod. 2023, 191, 115900. [Google Scholar] [CrossRef]
- Chen, S.; Shi, J.; Zou, L.; Liu, X.; Tang, R.; Ma, J.; Wang, C.; Tan, M.; Chen, J. Quality evaluation of wild and cultivated Schisandrae chinensis fructus based on simultaneous determination of multiple bioactive constituents combined with multivariate statistical analysis. Molecules 2019, 24, 1335. [Google Scholar] [CrossRef] [PubMed]
- Du, C. Schisandra chinensis on the northern slopes of the Qinling mountains -current status of resource utilization and prospective directions for exploitation. China Homes 2013, 9, 88–89. (In Chinese) [Google Scholar]
- Wu, Y.; Ding, C.; Liu, C.; Dan, L.; Xu, H.; Li, X.; Li, Y.; Song, X.; Zhang, D. Schisandrol A, the Major Active Constitute in Schisandra chinensis: A Review of Its Preparation, Biological Activities, and Pharmacokinetics Analysis. Am. J. Chin. Med. 2024, 52, 717–752. [Google Scholar] [CrossRef]
- Jiang, Y.; Wang, Y.; Tan, H.; Yu, T.; Fan, X.; Chen, P.; Zeng, H.; Huang, M.; Bi, H. Schisandrol B protects against acetaminophen-induced acute hepatotoxicity in mice via activation of the NRF2/ARE signaling pathway. Acta Pharmacol. Sin. 2016, 37, 382–399. [Google Scholar] [CrossRef]
- Chun, J.N.; Park, S.; Lee, S.; Kim, J.; Park, E.; Kang, M.; Kim, H.K.; Park, J.K.; So, I.; Jeon, J. Schisandrol B and schisandrin B inhibit TGFβ1-mediated NF-κB activation via a Smad-independent mechanism. Oncotarget 2017, 9, 3121–3130. [Google Scholar] [CrossRef]
- Xiao, Z.; Xiao, W.; Li, G. Research Progress on the Pharmacological Action of Schisantherin A. Evid. Based Complement. Alternat. Med. 2022, 2022, 6420865. [Google Scholar] [CrossRef]
- Fu, K.; Zhou, H.; Wang, C.; Gong, L.; Ma, C.; Zhang, Y.; Li, Y. A review: Pharmacology and pharmacokinetics of Schisandrin A. Phytother. Res. 2022, 36, 2375–2393. [Google Scholar] [CrossRef]
- Nasser, M.I.; Zhu, S.; Chen, C.; Zhao, M.; Huang, H.; Zhu, P. A comprehensive review on Schisandrin B and its biological properties. Oxidative Med. Cell. Longev. 2020, 14, 2172740. [Google Scholar] [CrossRef]
- Yan, L.; Zhang, S.; Luo, G.; Cheng, B.C.; Zhang, C.; Wang, Y.; Qiu, X.; Zhou, X.; Wang, Q.; Song, X. Schisandrin B mitigates hepatic steatosis and promotes fatty acid oxidation by inducing autophagy through AMPK/mTOR signaling pathway. Metabolism 2022, 131, 155200. [Google Scholar] [CrossRef]
- Kim, T.W.; Hwang, S.; Park, M.S.; Kim, H.K.; Park, M.H. Schisandrin C: An active compound from the fruit of Schisandra chinensis in anti-infammation and anti-oxidation. Cell. Mol. Biolog. 2023, 69, 167–173. [Google Scholar]
- Zhang, X.; Ran, Q.; Han, Y.; Gan, L.; Zou, X.; Dong, C. The rhizosphere microecological mechanisms of stress-induced quality enhancement in medicinal plants. Plant Stress 2025, 17, 100965. [Google Scholar] [CrossRef]
- Liu, J.; Qian, Y.; Yang, W.; Yang, M.; Zhang, Y.; Duan, B.; Yang, Y.; Tao, A.; Xia, C. Elucidating the interaction of rhizosphere microorganisms and environmental factors influencing the quality of Polygonatum kingianum Coll. et Hemsl. Sci. Rep. 2024, 14, 19092. [Google Scholar] [CrossRef] [PubMed]
- Xie, W.; Yang, J.; Gao, S.; Yao, R.; Wang, X. The Effect and Influence Mechanism of Soil Salinity on Phosphorus Availability in Coastal Salt-Affected Soils. Water 2022, 14, 2804. [Google Scholar] [CrossRef]
- Liu, W.; Chen, X.; Zhao, Y.; Shi, H. Effects of green manuring on chemical characteristics and microecology of tobacco-growing soil in central henan. BMC Microbiol. 2025, 25, 42. [Google Scholar] [CrossRef]
- Liu, C.; Zhao, D.; Ma, W.; Guo, Y.; Wang, A.; Wang, Q.; Lee, D. Denitrifying sulfide removal process on high-salinity wastewaters in the presence of Halomonas sp. Appl. Microbiol. Biotechnol. 2016, 100, 1421–1426. [Google Scholar] [CrossRef]
- Chen, S.; Zhou, Y.; Chen, Y.; Gu, J. fastp: An ultra-fast all-in-one FASTQ preprocessor. Bioinformatics 2018, 34, i884–i890. [Google Scholar] [CrossRef]
- Magoč, T.; Salzberg, S.L. FLASH: Fast length adjustment of short reads to improve genome assemblies. Bioinformatics 2011, 27, 2957–2963. [Google Scholar] [CrossRef]
- Edgar, R.C. UPARSE: Highly accurate OTU sequences from microbial amplicon reads. Nat. Methods 2013, 10, 996–998. [Google Scholar] [CrossRef]
- Stackebrandt, E.; Goebel, B.M. Taxonomic note: A place for DNA-DNA reassociation and 16S rRNA sequence analysis in the present species definition in bacteriology. Int. J. Syst. Bacteriol. 1994, 44, 846–849. [Google Scholar] [CrossRef]
- Wang, Q.; Garrity, G.M.; Tiedje, J.M.; Cole, J.R. Naive bayesian classifier for rapid assignment of rRNA sequences into the new bacterial taxonomy. Appl. Environ. Microbiol. 2007, 73, 5261–5267. [Google Scholar] [CrossRef]
- Schloss, P.D.; Westcott, S.L.; Ryabin, T.; Hall, J.R.; Hartmann, M.; Hollister, E.B.; Lesniewski, R.A.; Oakley, B.B.; Parks, D.H.; Robinson, C.J.; et al. Introducing mothur: Open-source, platform-independent, community-supported software for describing and comparing microbial communities. Appl. Environ. Microbiol. 2009, 75, 7537. [Google Scholar] [CrossRef] [PubMed]
- Jackson, K.; Meetei, T.T. Influence of soil pH on nutrient availability: A Review. J. Emerg. Technol. Innov. Res. 2018, 5, 707–713. [Google Scholar]
- Li, Y. Screening of Rhizosphere Growth-Promotingbacteria from Schisandra chinensis and Theirgrowth-Promoting Effects. Master’s thesis, Northwest A&F University, Yangling, China, 2023. (In Chinese). [Google Scholar]
- Hao, R. Effects of Environmental Factors on Growth and Secondary Metabolism of Schisandra chinensis. Master’s thesis, Northwest A&F University, Yangling, China, 2024. (In Chinese). [Google Scholar]
- Bertin, C.; Yang, X.; Weston, L.A. The role of root exudates and allelochemicals in the rhizosphere. Plant Soil 2003, 256, 67–83. [Google Scholar] [CrossRef]
- Dar, T.A.; Uddin, M.; A.Khan, M.M.; Ali, A.; Varshney, L. Modulation of alkaloid content, growth and productivity of Trigonella foenum-graecum L. using irradiated sodium alginate in combination with soil applied phosphorus. J. Appl. Res. Med. Aromat. Plants 2016, 3, 200–210. [Google Scholar] [CrossRef]
- Ullrich, S.F.; Rothauer, A.; Hagels, H.; Kayser, O. Influence of light, temperature, and macronutrients on growth and scopolamine biosynthesis in duboisia species. Planta Med. 2017, 83, 937–945. [Google Scholar] [CrossRef]
- Chen, Q. Effects of Phenotypic Diversdity and Microtopography on Growth and Intrinsic Quality of Rheum Officinale. Master’s thesis, Nanjing Agricultural University, Nanjing, China, 2020. [Google Scholar]
- Liu, J. Study of the Relationship Between the Quality of Polygonatum kingianum Coll. et Hemsl. and Ecological Factors or Rhizosphere Microbial Communities of in Different Production Areas. Master’s thesis, Dali University, Dali, China, 2023. (In Chinese). [Google Scholar]
- Zhang, T.; Xu, Z.X.; Wang, Y.; Gao, Q. Effects of soil properties and microbial community composition on ginsenosides accumulation in farmland ginseng. Frontiers 2024, 12, 1462342. [Google Scholar] [CrossRef]
- Li, X.; Sun, W.; Liu, Y.; Yang, S. Relations between active ingredient content and soil factors of Schisandra chinensis. Hortic. Seed 2024, 44, 68–71. (In Chinese) [Google Scholar] [CrossRef]
- Xu, J.; Zhang, Y.; Zhang, P.; Trivedi, P.; Riera, N.; Wang, Y.; Liu, X.; Fan, G.; Tang, J.; D.Coletta-Filho, H.; et al. The structure and function of the global citrus rhizosphere microbiome. Nat. Commun. 2018, 9, 4894. [Google Scholar] [CrossRef]
- Yan, Z.; Jin, H.; Yang, X.; Min, D.; Xu, X.; Hua, C.; Qin, B. Effect of Rhizosphere soil microbial communities and environmental factors on growth and the active ingredients of Angelica sinensis in Gansu Province, China. Folia Microbiol. 2025, 70, 673–687. [Google Scholar] [CrossRef]
- Shi, Z.; Guo, X.; Lei, Z.; Wang, Y.; Yang, Z.; Niu, J.; Liang, J. Screening of high-efficiency nitrogen-fixing bacteria from the traditional Chinese medicine plant Astragalus mongolicus and its effect on plant growth promotion and bacterial communities in the rhizosphere. BMC Microbiol. 2023, 23, 292. [Google Scholar] [CrossRef]
- Zhang, J.; Li, X.; Pei, P.; Wang, P.; Guo, Q.; Yang, H.; Xue, X. Multistrain Microbial Inoculant Enhances Yield and Medicinal Quality of Glycyrrhiza uralensis in Arid Saline–Alkali Soil and Modulate Root Nutrients and Microbial Diversity. Agronomy 2025, 15, 1879. [Google Scholar] [CrossRef]
- Niu, S.; Li, T.; Liu, L.; Bao, X.; Yang, X.; Song, H.; Li, Y.; Bai, J.; He, L.; Wang, Q.; et al. Mechanistic study on the mitigation of cadmium accumulation in Ligusticum sinense cv. Chuanxiong through plant growth-promoting rhizobacteria Arthrobacter sp. CX-2. Plant Stress 2025, 15, 100748. [Google Scholar] [CrossRef]
- Platamone, G.; Procacci, S.; Maccioni, O.; Borromeo, I.; Rossi, M.; Bacchetta, L.; Forni, C. Arthrobacter sp. Inoculation Improves Cactus Pear Growth, Quality of Fruits, and Nutraceutical Properties of Cladodes. Curr. Microbiol. 2023, 80, 266. [Google Scholar] [CrossRef]
- Awasthi, A.; Bharti, N.; Nair, P.; Singh, R.; Shukla, A.K.; Gupta, M.M.; Darokar, M.P.; Kalra, A. Synergistic effect of Glomus mosseae and nitrogen fixing Bacillus subtilis strain Daz26 on artemisinin content in Artemisia annua L. Appl. Soil Ecol. 2011, 49, 125–130. [Google Scholar] [CrossRef]
- Liu, X.; Li, Q.; Li, Y.; Guan, G.; Chen, S. Paenibacillus strains with nitrogen fixation and multiple beneficial properties for promoting plant growth. PeerJ 2019, 7, e7445. [Google Scholar] [CrossRef]
Disclaimer/Publisher’s Note: The statements, opinions and data contained in all publications are solely those of the individual author(s) and contributor(s) and not of MDPI and/or the editor(s). MDPI and/or the editor(s) disclaim responsibility for any injury to people or property resulting from any ideas, methods, instructions or products referred to in the content. |
© 2025 by the authors. Licensee MDPI, Basel, Switzerland. This article is an open access article distributed under the terms and conditions of the Creative Commons Attribution (CC BY) license (https://creativecommons.org/licenses/by/4.0/).