

Line-Field Confocal Optical Coherence Tomography (LC-OCT) for Skin Imaging in Dermatology
 , , and
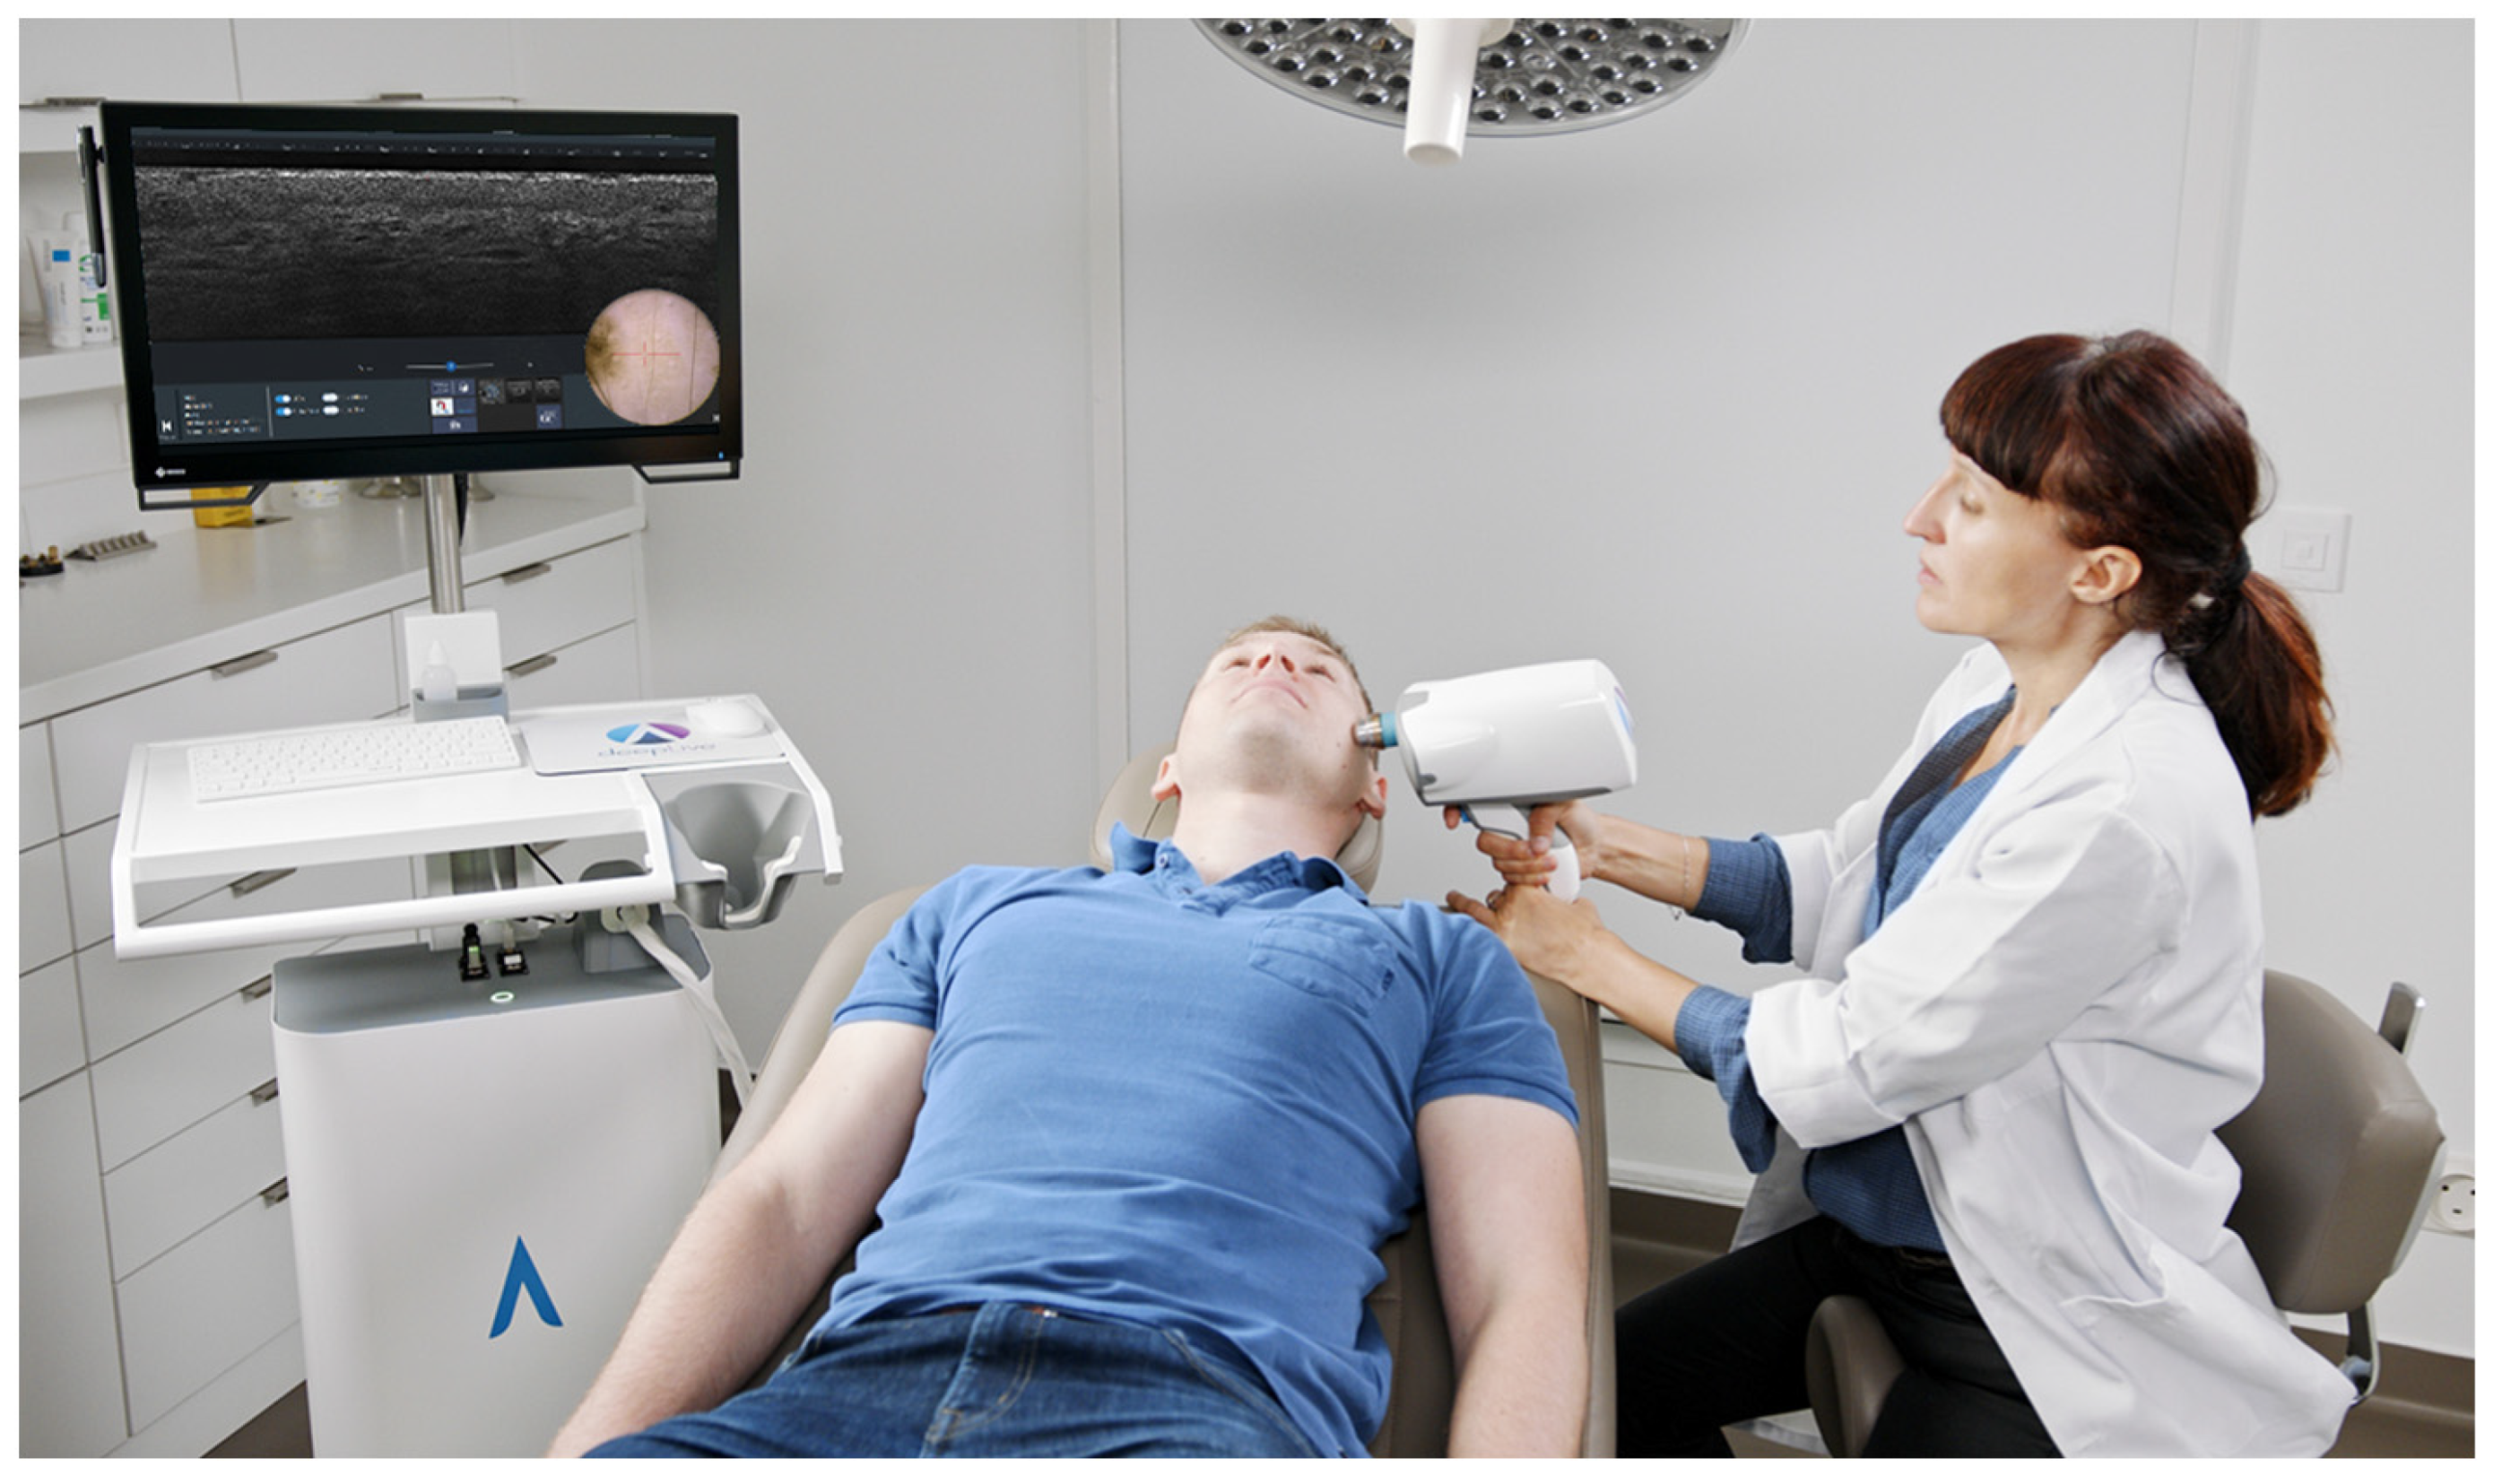
Abstract
:1. Introduction
2. Materials and Methods
2.1. The LC-OCT Imaging Device
2.1.1. deepLive™
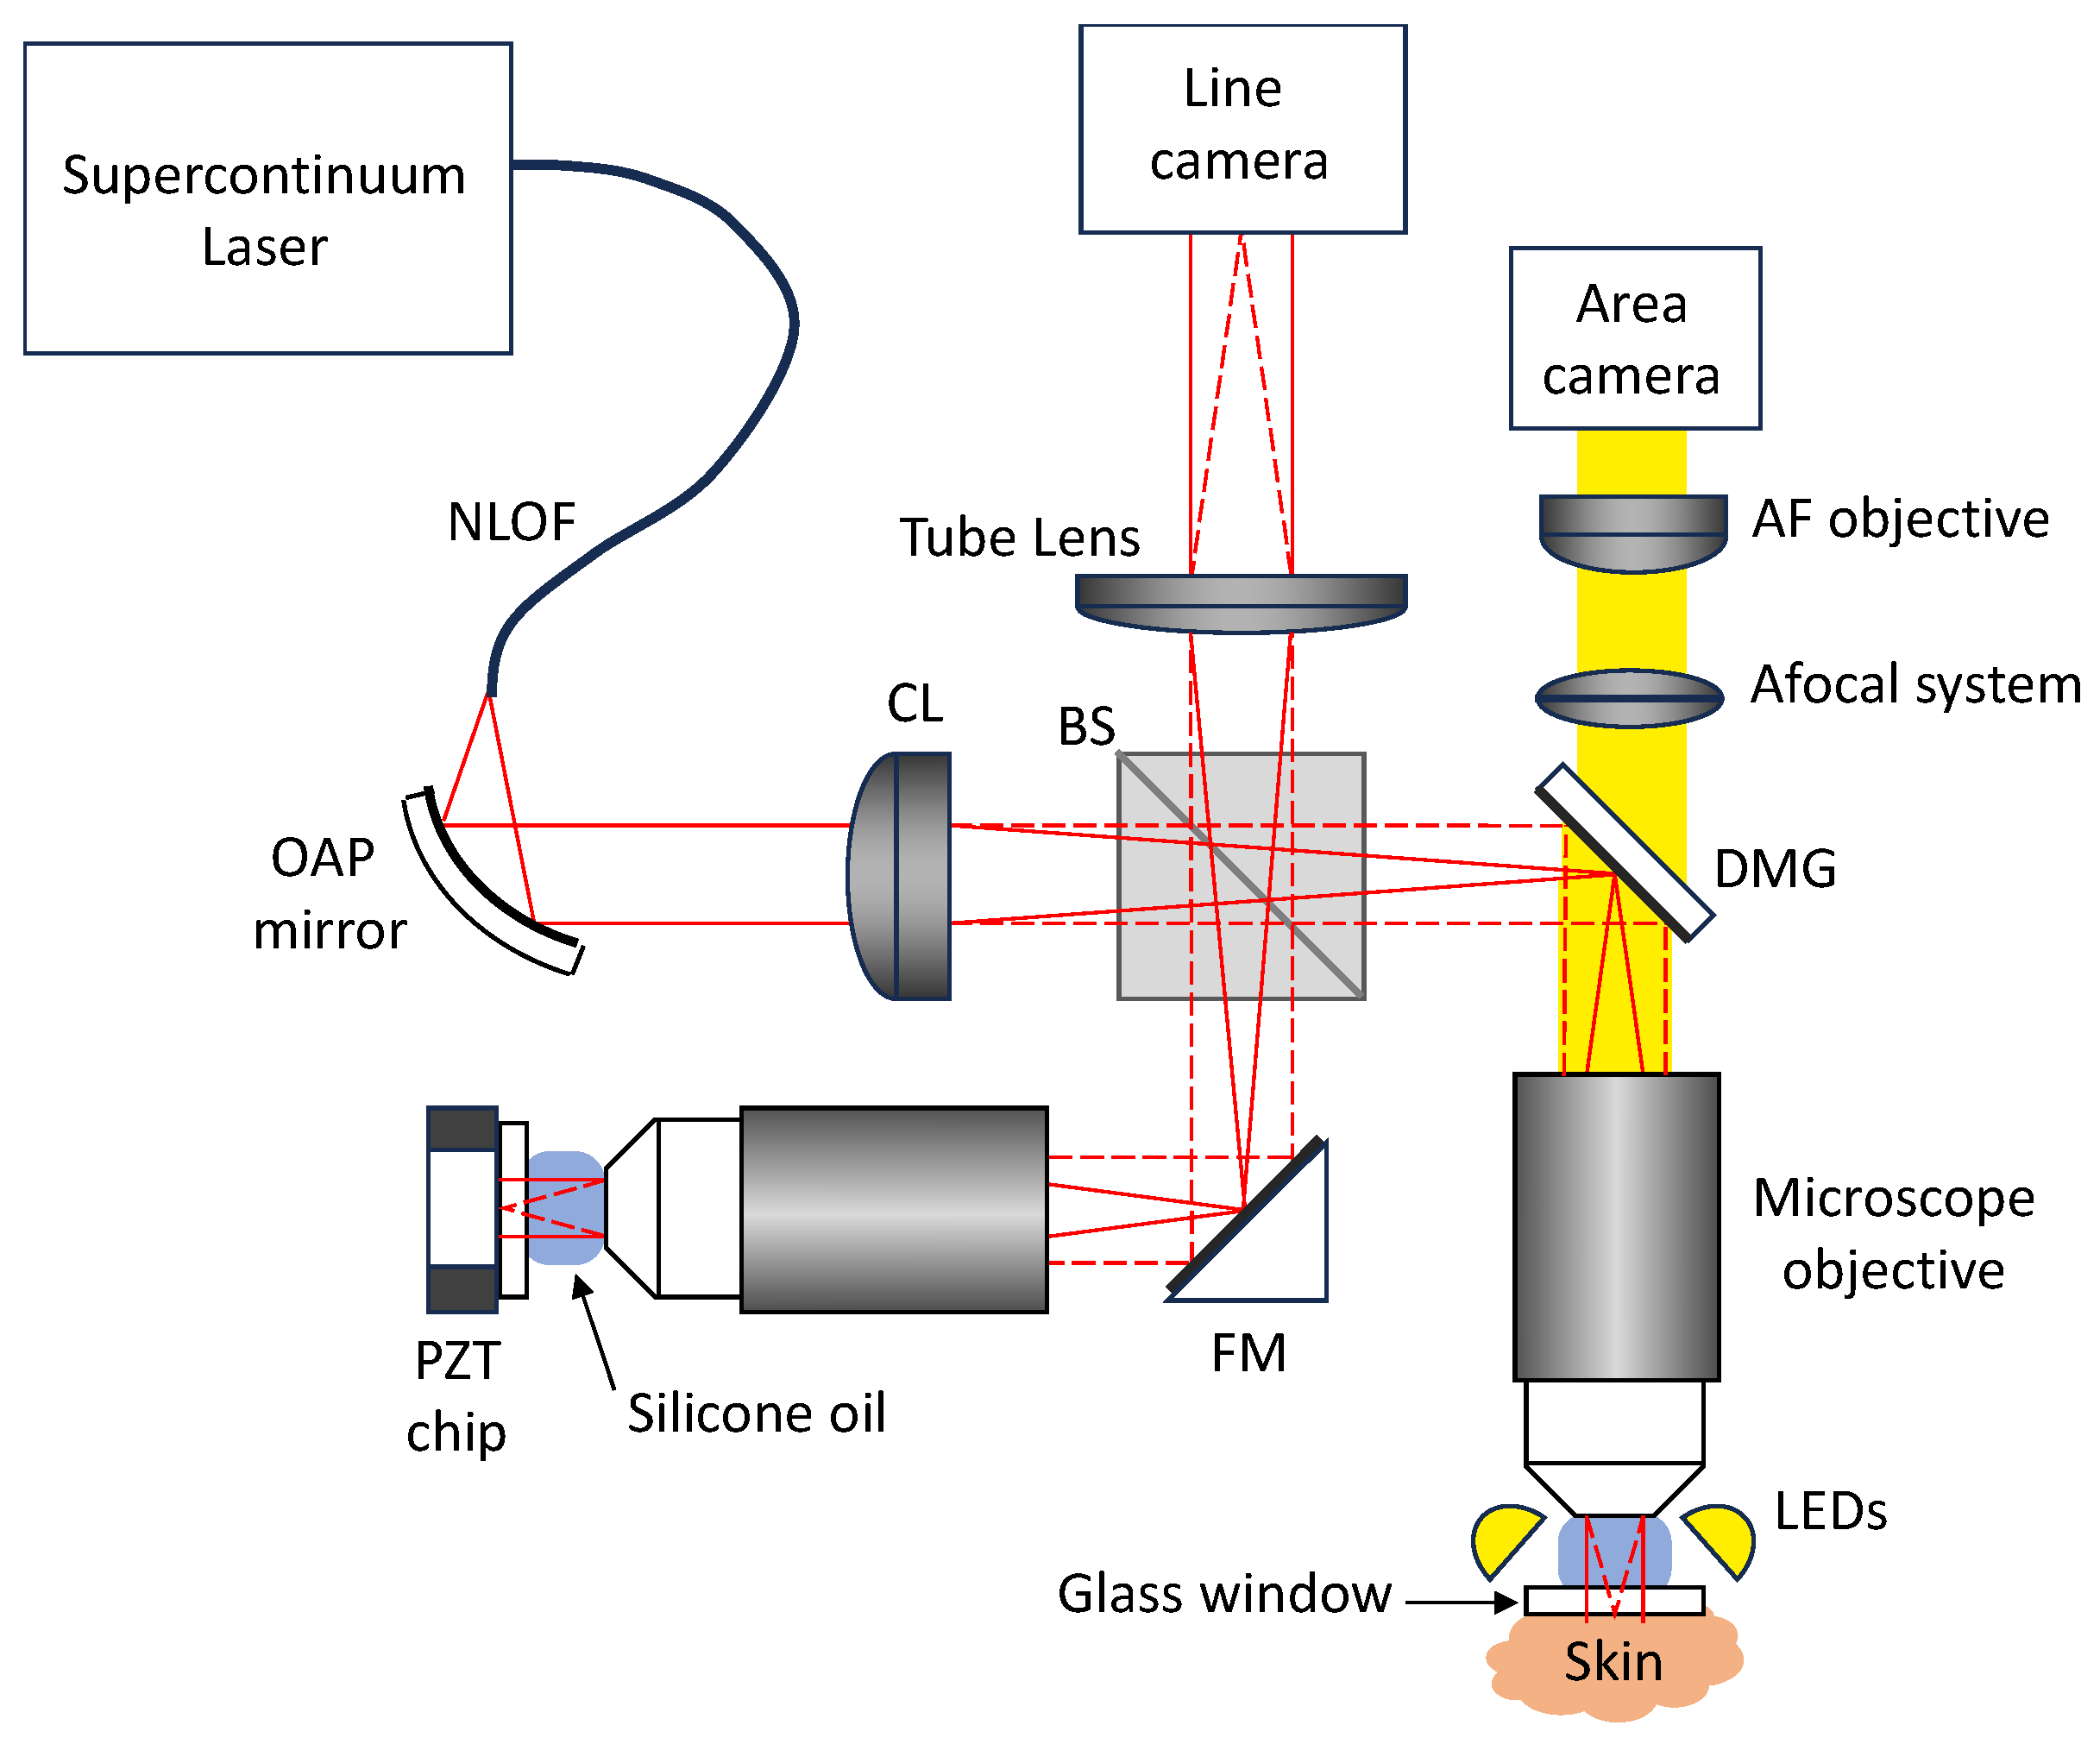
2.1.2. Technical Description
2.2. The LC-OCT Imaging Modes
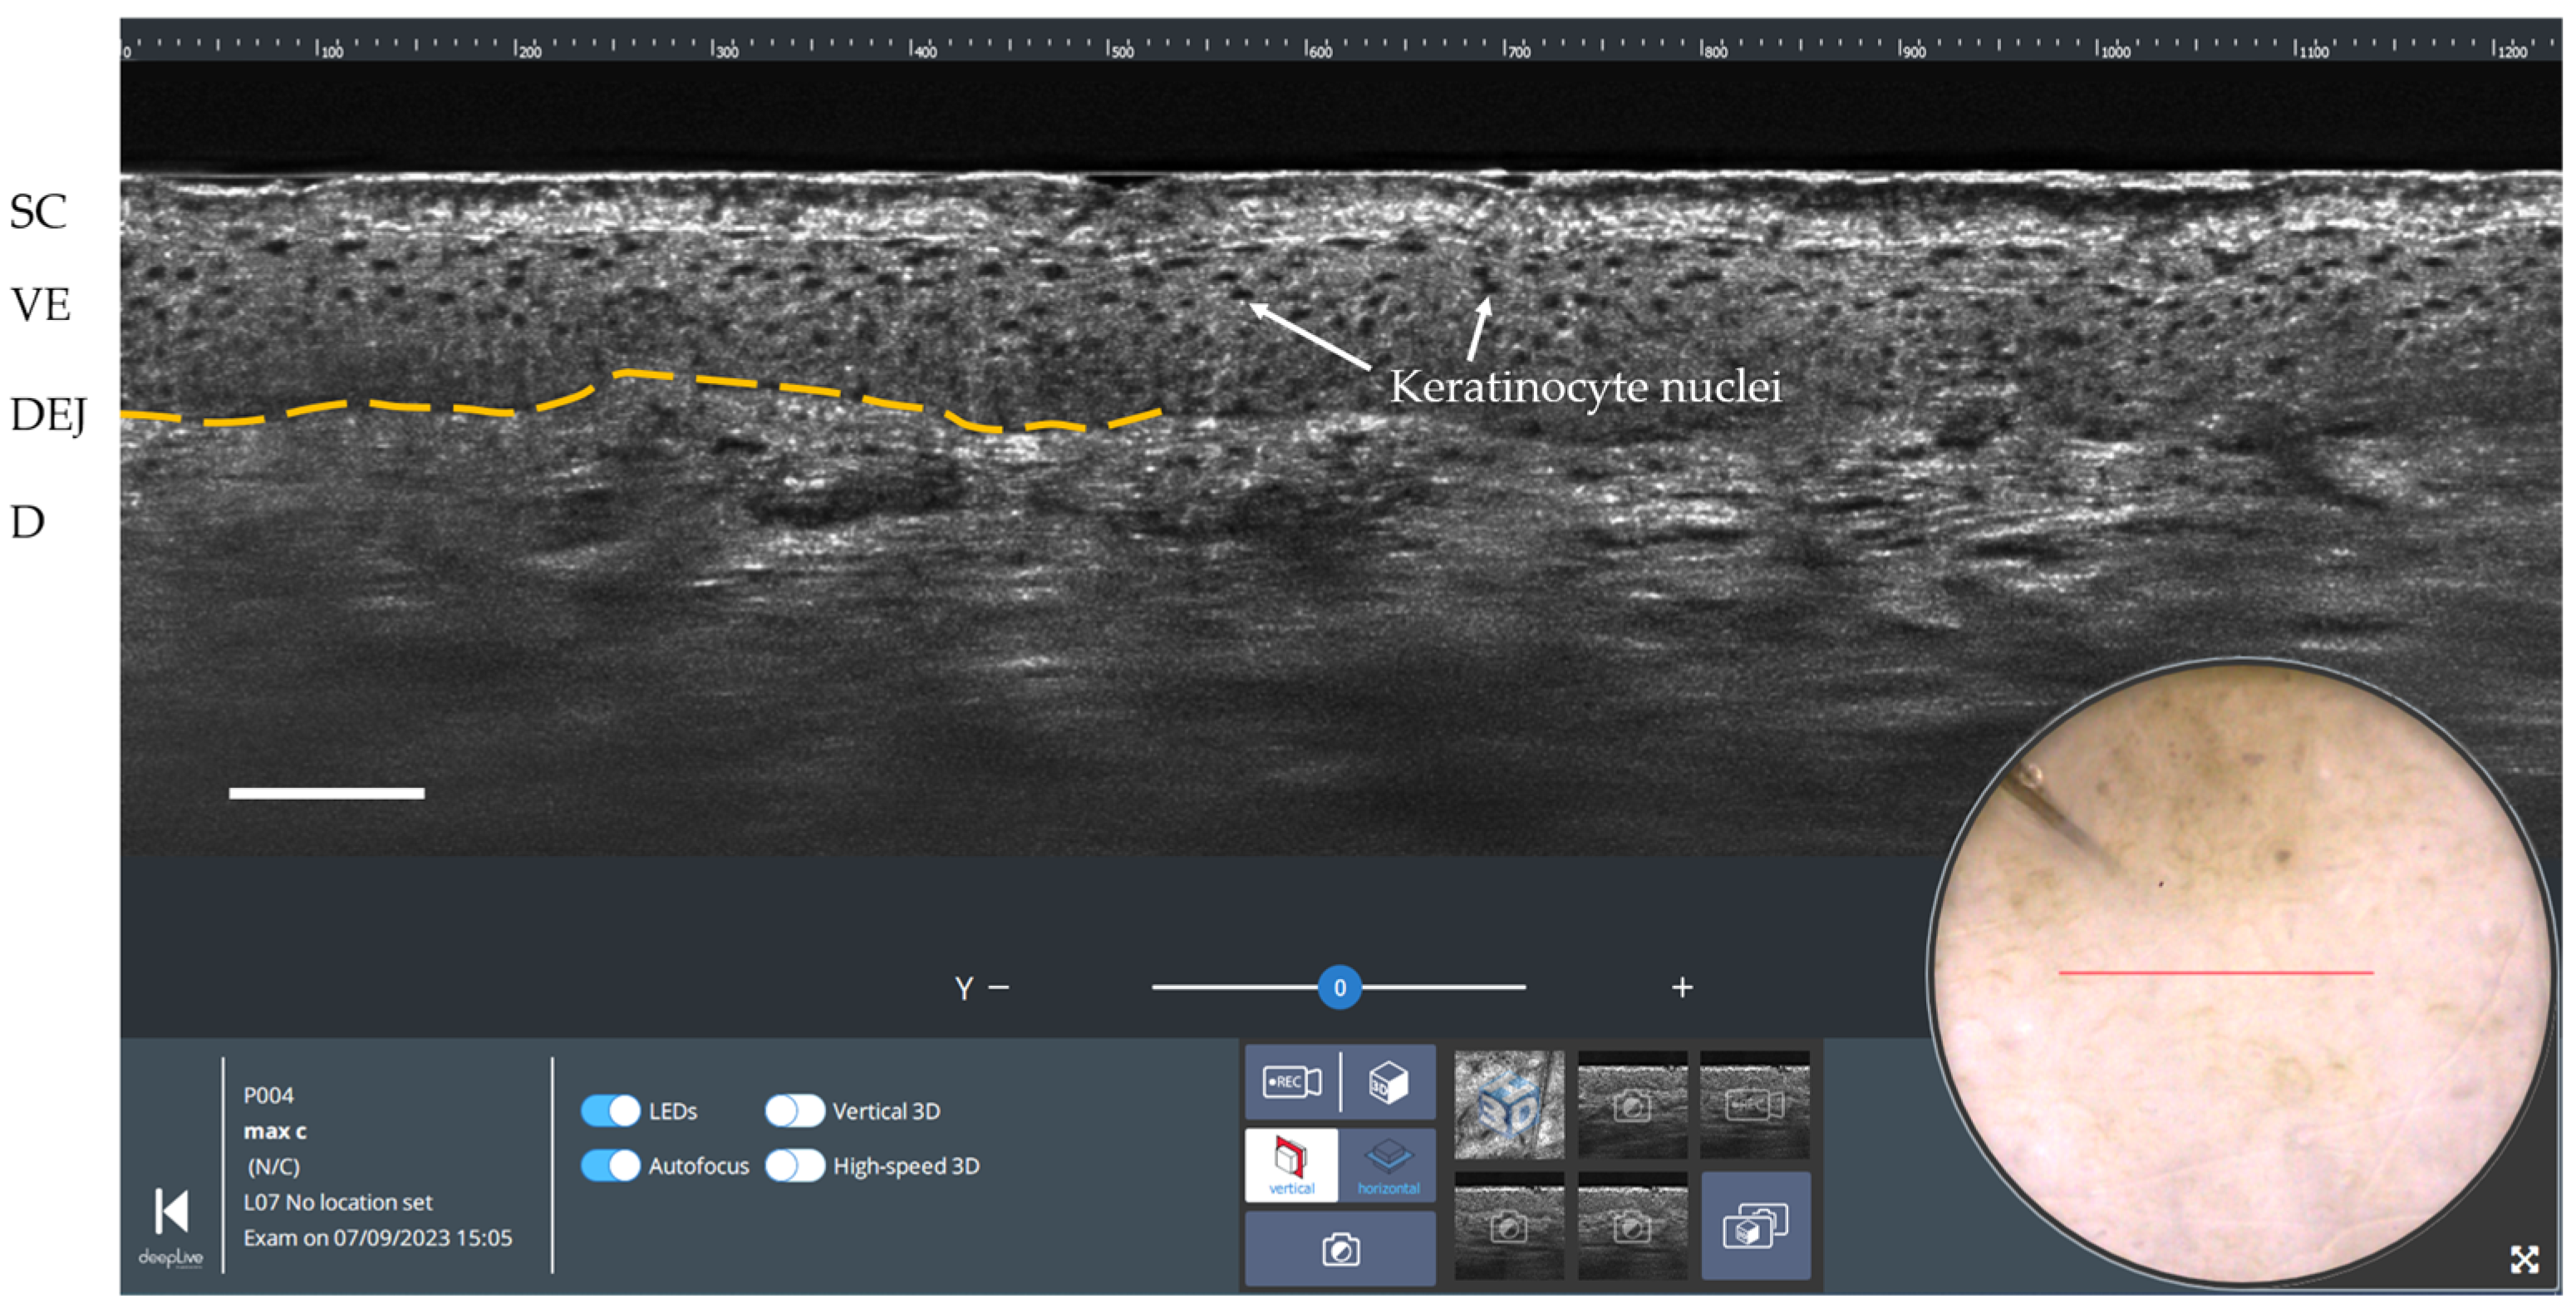
2.2.1. Vertical Imaging
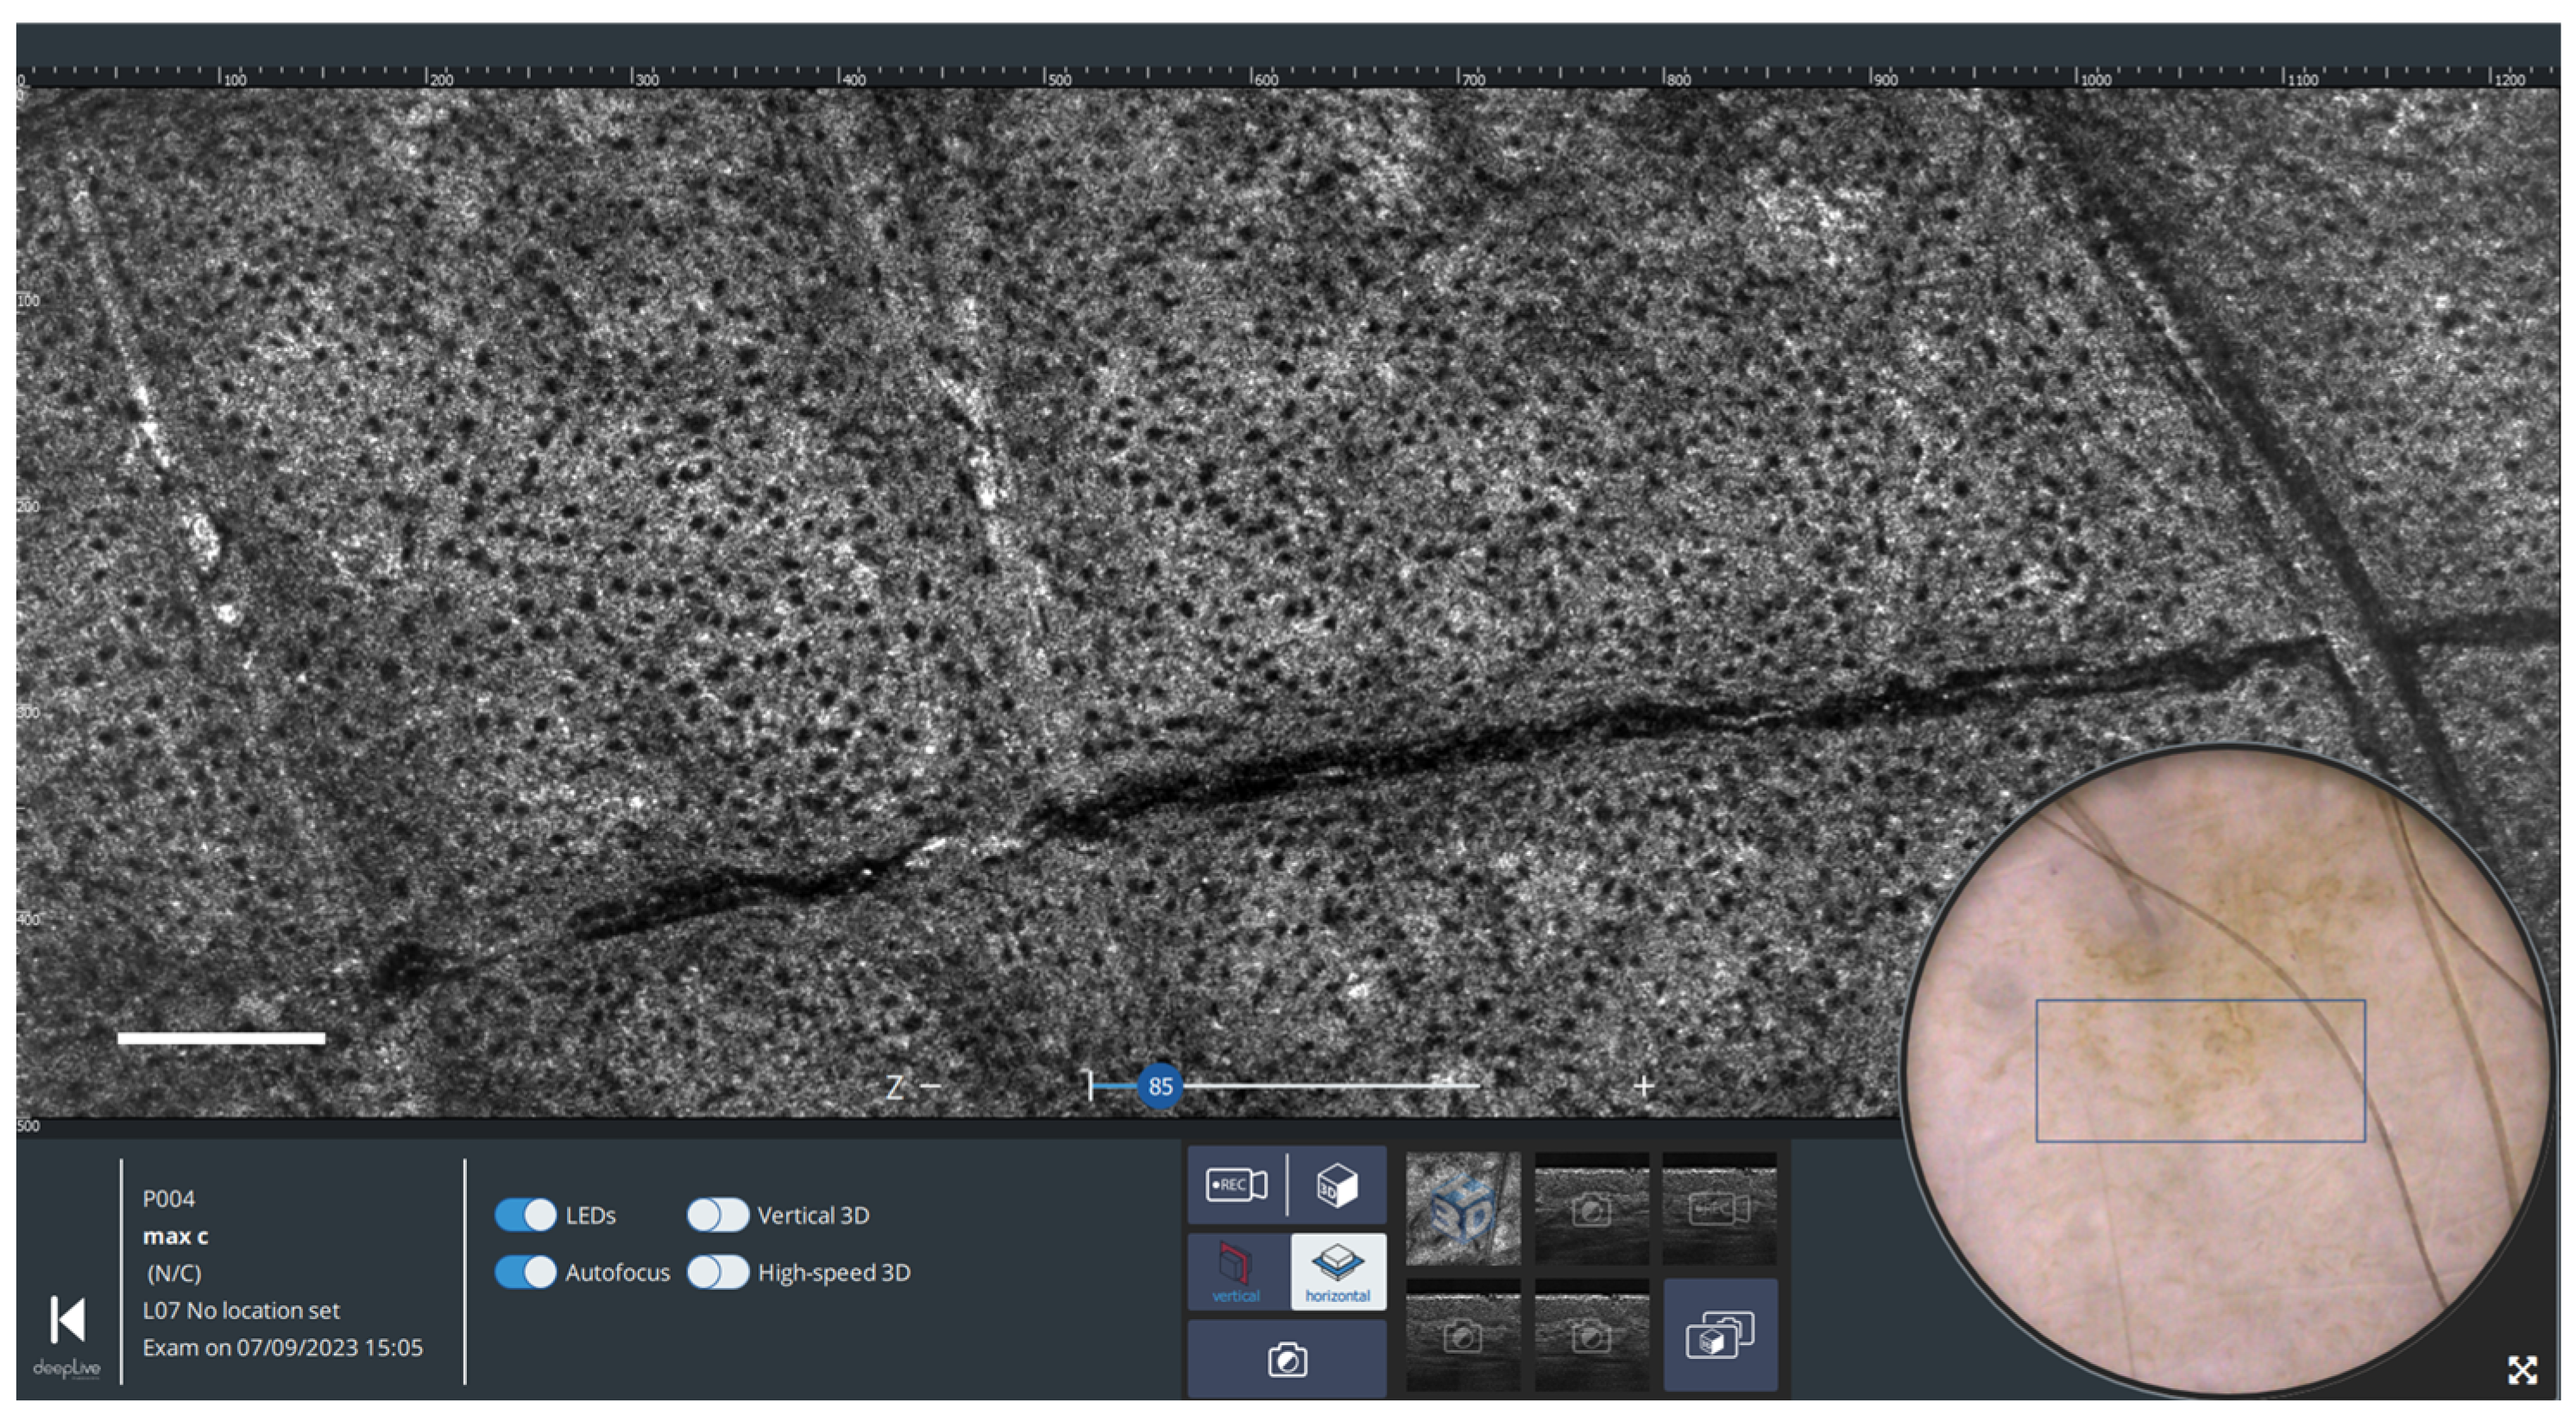
2.2.2. Horizontal Imaging
2.2.3. Three-Dimensional Imaging
3. Results and Discussion
3.1. Melanocytic Skin Tumors
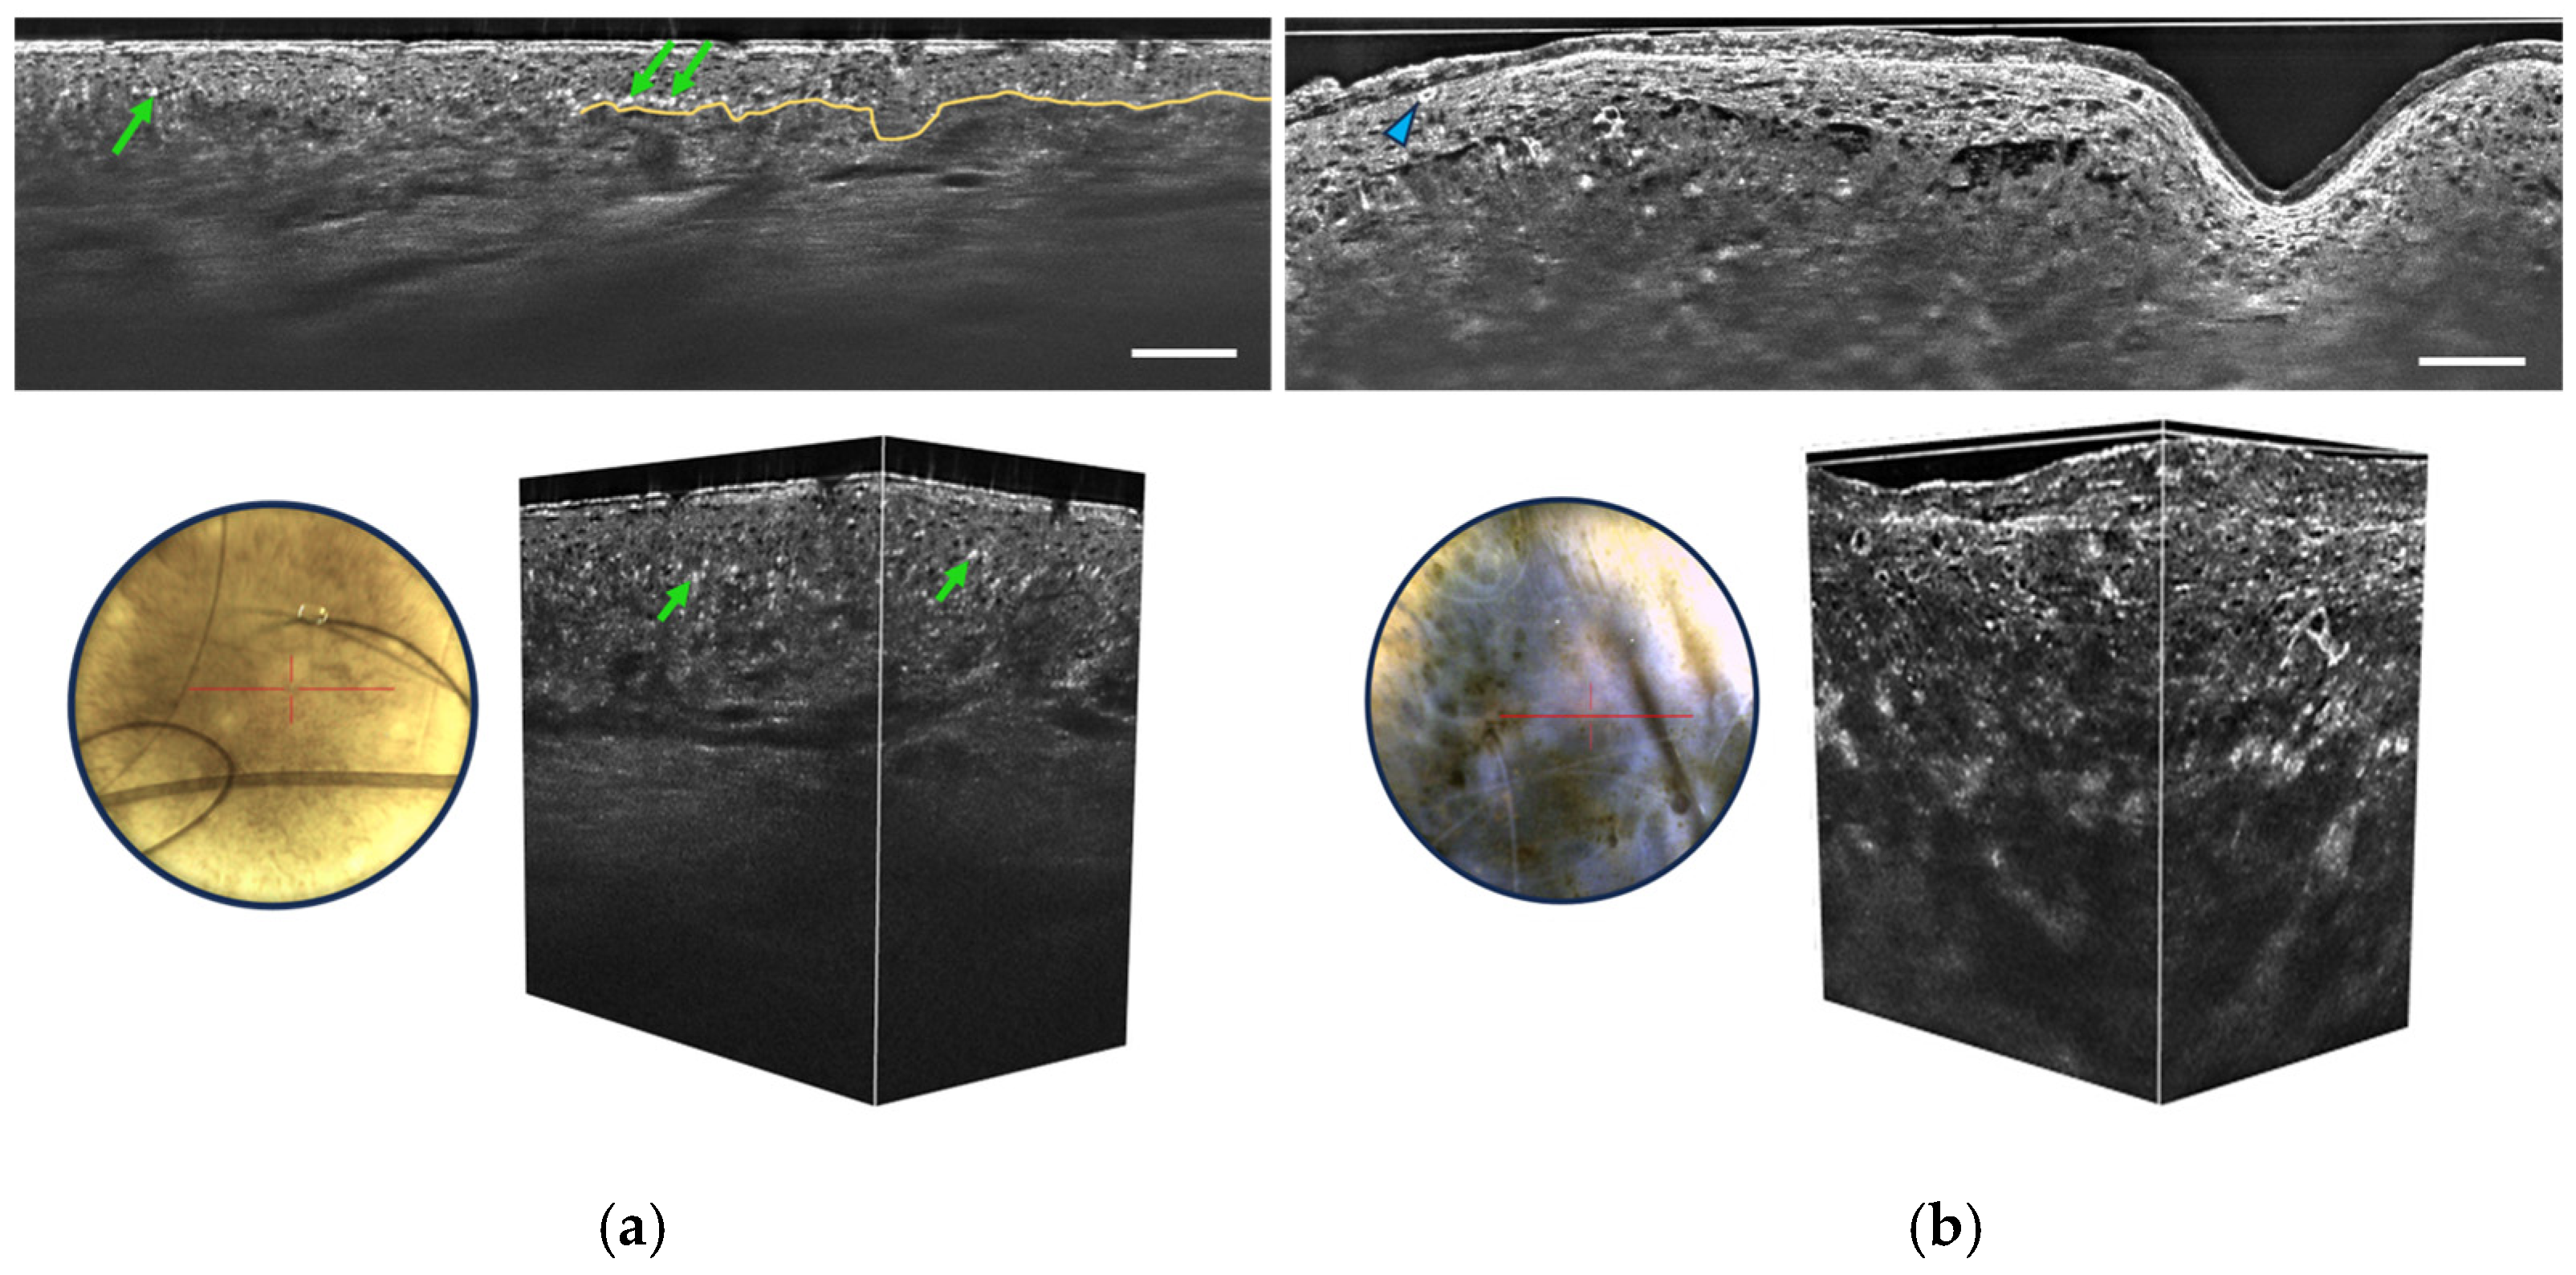
- Irregular honeycombed pattern: Melanomas often exhibit irregular honeycombed structures in LC-OCT, characterized by disorganized, unevenly spaced, and variably sized cells nuclei, characterized by a network of roundish hyporeflective structures on LC-OCT images.
- Pagetoid spread: LC-OCT allows for the visualization of pagetoid spread, which refers to the presence of melanocytes invading the upper layers of the epidermis in a solitary or nested pattern (Figure 6b). This epidermal invasion is a hallmark feature of melanomas and is not typically observed in benign nevi.
3.2. Non-Melanocytic Skin Tumors
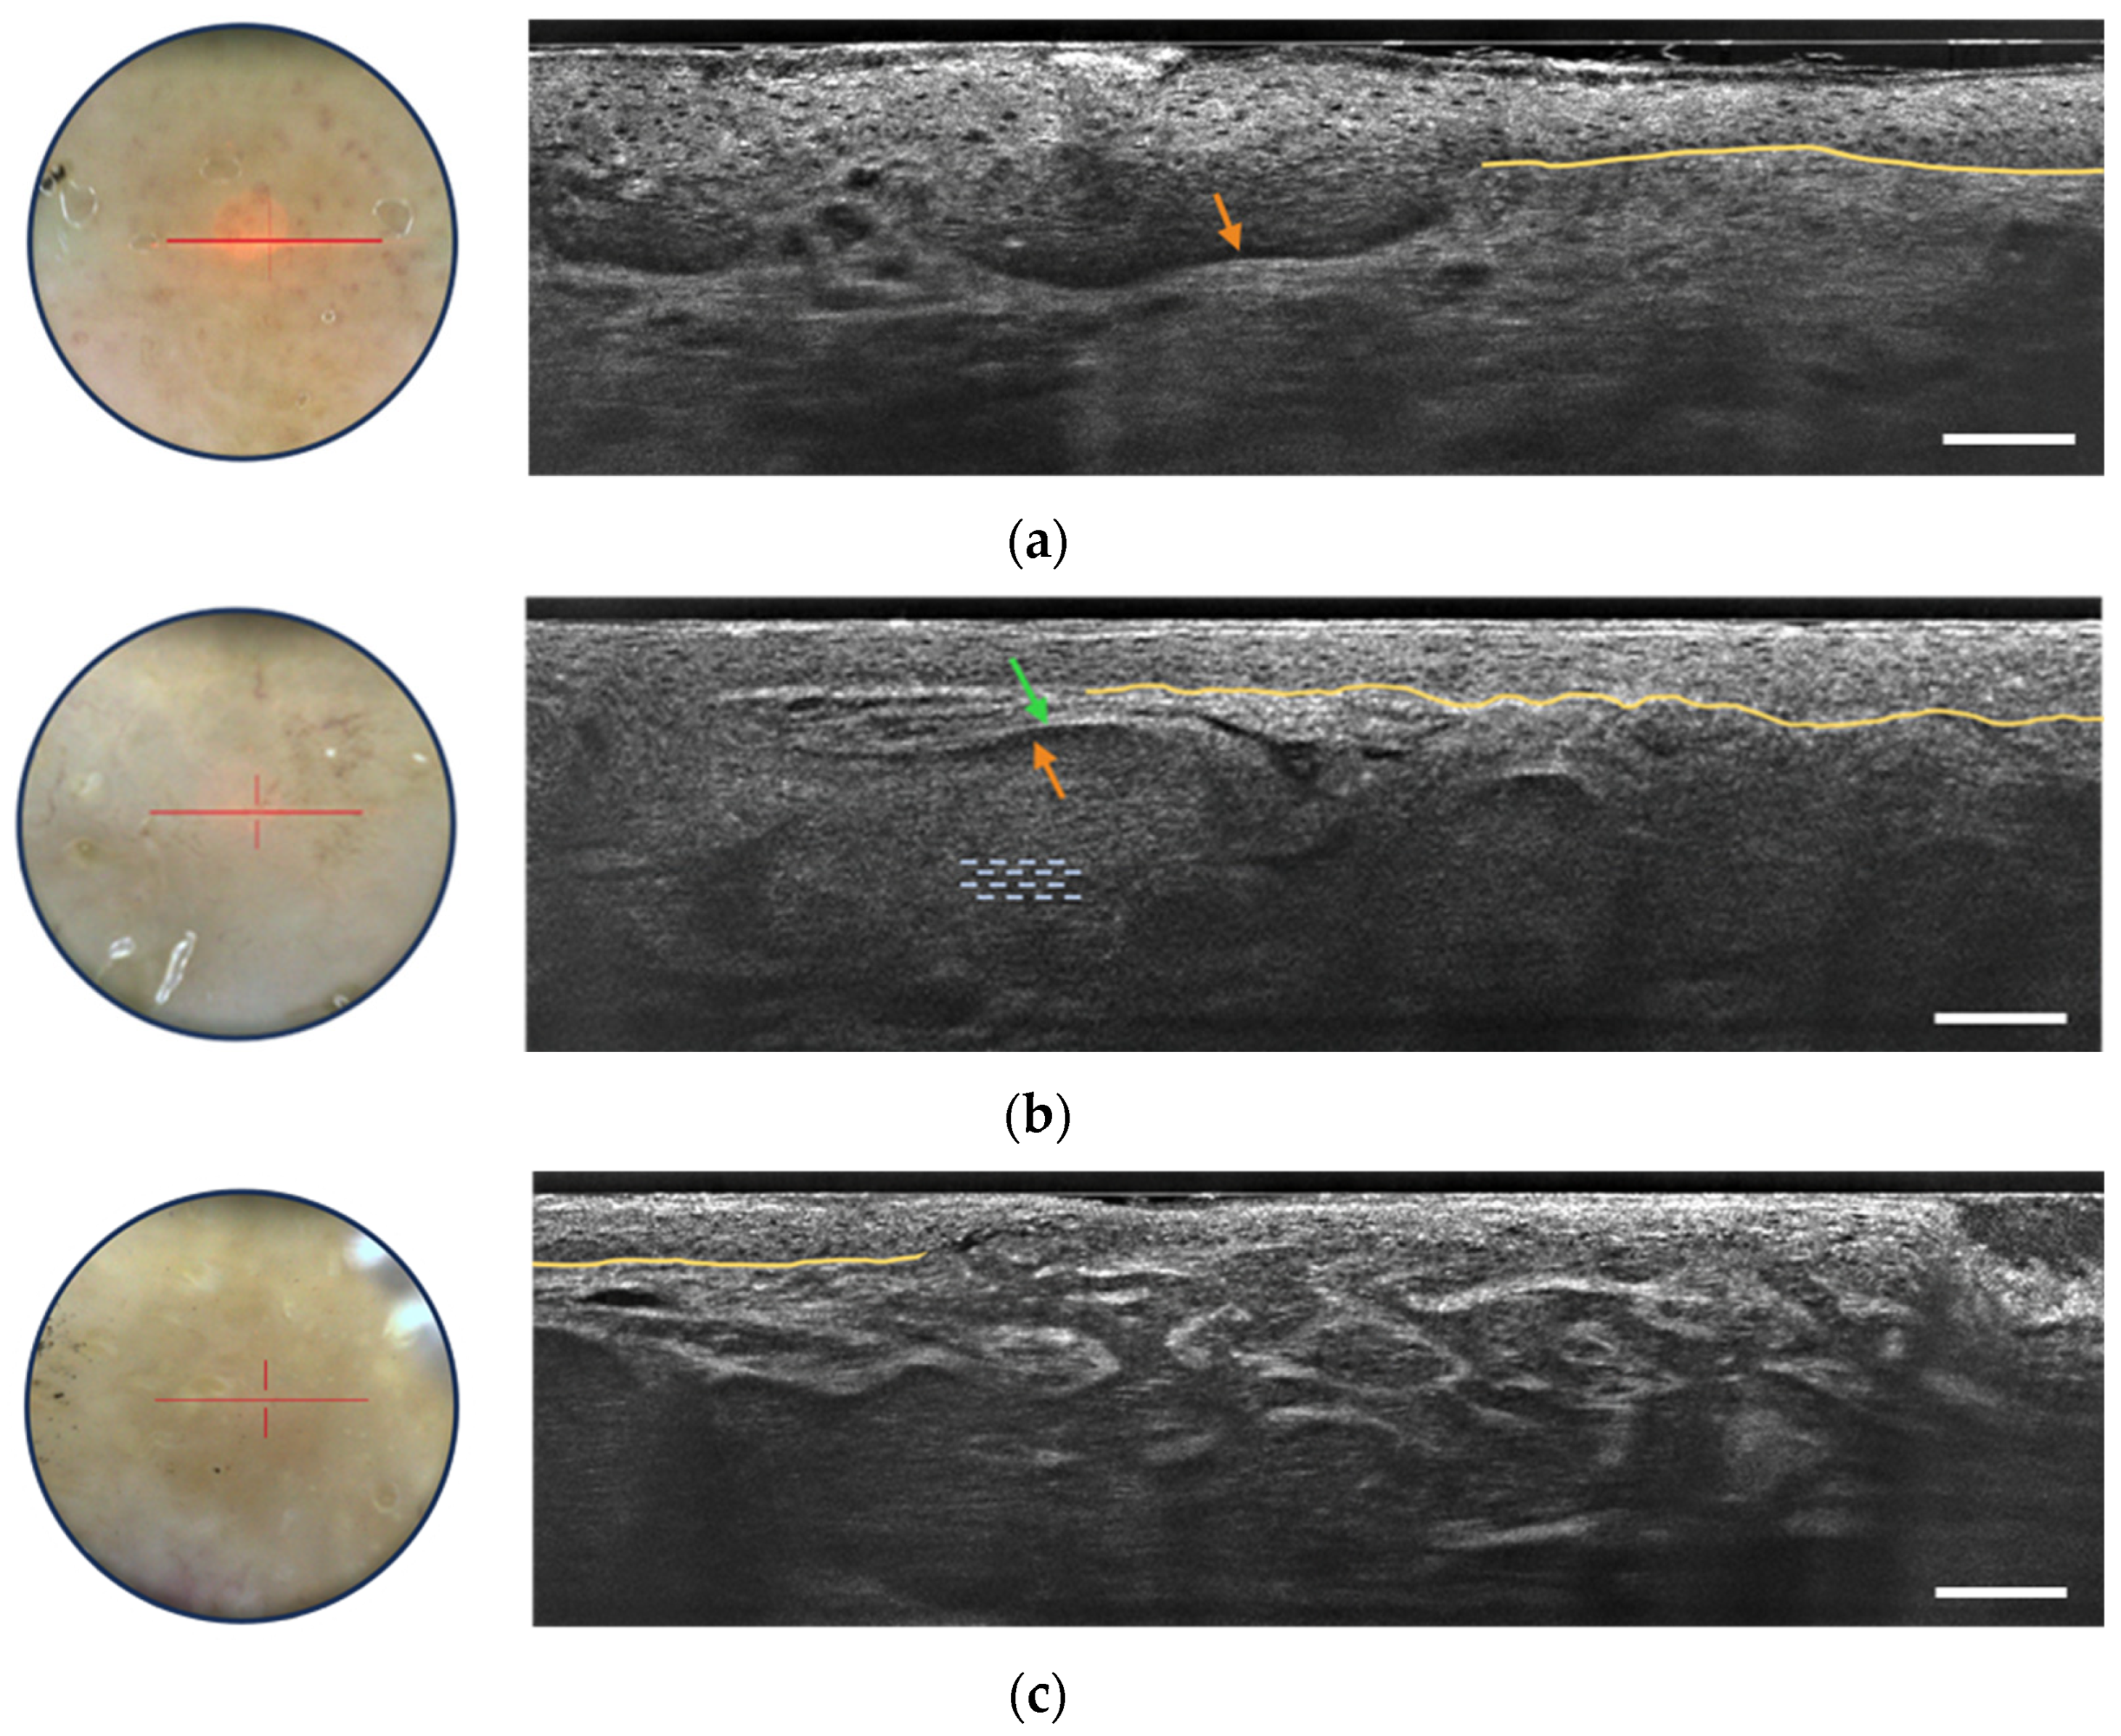
3.2.1. Basal Cell Carcinoma
- Grey core with millefeuille pattern: This component appears as a laminated structure oriented along the horizontal plane, resembling the layers of the French pastry “millefeuille”. It represents the dense cellularity within the basaloid tumor island and includes basaloid and immune cells.
- Middle dark rim (clefting): Immediately surrounding the grey core of the lobule, the middle dark rim is referred to as “clefting” and likely corresponds to the peritumoral mucin deposition [33].
- Outer bright rim: This rim results from the compression and alteration of collagen fibers in the stroma due to the presence and interaction of the tumor island, creating a mass effect.
3.2.2. Actinic Keratosis and Squamous Cell Carcinoma
3.2.3. Inflammatory and Infectious Skin Diseases
4. Conclusions
Author Contributions
Funding
Institutional Review Board Statement
Informed Consent Statement
Data Availability Statement
Acknowledgments
Conflicts of Interest
References
- Apalla, Z.; Lallas, A.; Sotiriou, E.; Lazaridou, E.; Ioannides, D. Epidemiological trends in skin cancer. Dermatol. Pract. Concept. 2017, 7, 1–6. [Google Scholar] [CrossRef]
- Glazer, A.M.; Rigel, D.S.; Winkelmann, R.R.; Farberg, A.S. Clinical Diagnosis of Skin Cancer: Enhancing Inspection and Early Recognition. Dermatol. Clin. 2017, 35, 409–416. [Google Scholar] [CrossRef]
- Woltsche, N.; Schwab, C.; Deinlein, T.; Hofmann-Wellenhof, R.; Zalaudek, I. Dermoscopy in the era of dermato-oncology: From bed to bench side and retour. Expert Rev. Anticancer Ther. 2016, 16, 531–541. [Google Scholar] [CrossRef] [PubMed]
- Kittler, H.; Pehamberger, H.; Wolff, K.; Binder, M. Diagnostic accuracy of dermoscopy. Lancet Oncol. 2002, 3, 159–165. [Google Scholar] [CrossRef] [PubMed]
- Fuller, S.R.; Bowen, G.M.; Tanner, B.; Florell, S.R.; Grossman, D. Digital dermoscopic monitoring of atypical nevi in patients at risk for melanoma. Dermatol. Surg. Off. Publ. Am. Soc. Dermatol. Surg. 2007, 33, 1198–1206. [Google Scholar] [CrossRef]
- Kollias, N.; Stamatas, G.N. Optical non-invasive approaches to diagnosis of skin diseases. J. Investig. Dermatol. Symp. Proc. 2002, 7, 64–75. [Google Scholar] [CrossRef]
- Deán-Ben, X.L.; Razansky, D. Optoacoustic imaging of the skin. Exp. Dermatol. 2021, 30, 1598–1609. [Google Scholar] [CrossRef] [PubMed]
- Almuhanna, N.; Wortsman, X.; Wohlmuth-Wieser, I.; Kinoshita-Ise, M.; Alhusayen, R. Overview of ultrasound imaging applications in dermatology. J. Cutan. Med. Surg. 2021, 25, 521–529. [Google Scholar] [CrossRef] [PubMed]
- Pellacani, G.; Guitera, P.; Longo, C.; Avramidis, M.; Seidenari, S.; Menzies, S. The impact of in vivo reflectance confocal microscopy for the diagnostic accuracy of melanoma and equivocal melanocytic lesions. J. Investig. Dermatol. 2007, 127, 2759–2765. [Google Scholar] [CrossRef]
- Guitera, P.; Pellacani, G.; Crotty, K.A.; Scolyer, R.A.; Li, L.X.; Bassoli, S.; Vinceti, M.; Rabinovitz, H.; Longo, C.; Menzies, S.W. The impact of in vivo reflectance confocal microscopy on the diagnostic accuracy of lentigo maligna and equivocal pigmented and nonpigmented macules of the face. J. Investig. Dermatol. 2010, 130, 2080–2091. [Google Scholar] [CrossRef]
- Alarcon, I.; Carrera, C.; Palou, J.; Alos, L.; Malvehy, J.; Puig, S. Impact of in vivo reflectance confocal microscopy on the number needed to treat melanoma in doubtful lesions. Br. J. Dermatol. 2014, 130, 2080–2091. [Google Scholar] [CrossRef]
- Champin, J.; Perrot, J.-L.; Cinotti, E.; Labeille, B.; Douchet, C.; Parrau, G.; Cambazard, F.; Seguin, P.; Alix, T. In vivo reflectance confocal microscopy to optimize the spaghetti technique for defining surgical margins of lentigo maligna. Dermatol. Surg. Off. Publ. Am. Soc. Dermatol. Surg. 2014, 40, 247–256. [Google Scholar] [CrossRef] [PubMed]
- Pellacani, G.; Farnetani, F.; Ciardo, S.; Chester, J.; Kaleci, S.; Mazzoni, L.; Bassoli, S.; Casari, A.; Pampena, R.; Mirra, M.; et al. Effect of Reflectance Confocal Microscopy for Suspect Lesions on Diagnostic Accuracy in Melanoma: A Randomized Clinical Trial. JAMA Dermatol. 2022, 158, 754–761. [Google Scholar] [CrossRef] [PubMed]
- Huang, D.; Swanson, E.A.; Lin, C.P.; Schuman, J.S.; Stinson, W.G.; Chang, W.; Hee, M.R.; Flotte, T.; Gregory, K.; Puliafito, C.A.; et al. Optical coherence tomography. Science 1991, 254, 1178–1181. [Google Scholar] [CrossRef]
- Anderson, H. Applications of Optical Coherence Tomography in Ophthalmology; Murphy & Moore Publishing: New York, NY, USA, 2022; ISBN 13 978-1639870530. [Google Scholar]
- Welzel, J.; Lankenau, E.; Birngruber, R.; Engelhardt, R. Optical coherence tomography of the human skin. J. Am. Acad. Dermatol. 1997, 37, 958–963. [Google Scholar] [CrossRef] [PubMed]
- Welzel, J. Optical coherence tomography in dermatology: A review. Ski. Res. Technol. Rev. Artic. 2001, 7, 1–9. [Google Scholar] [CrossRef]
- Boone, M.A.; Norrenberg, S.; Jemec, G.B.; Del Marmol, V. Imaging of basal cell carcinoma by high-definition optical coherence tomography: Histomorphological correlation. A pilot study. Br. J. Dermatol. 2012, 167, 856–864. [Google Scholar] [CrossRef]
- Coleman, A.J.; Richardson, T.J.; Orchard, G.; Uddin, A.; Choi, M.J.; Lacy, K.E. Histological correlates of optical coherence tomography in non-melanoma skin cancer. Ski. Res. Technol. 2013, 19, e10–e19. [Google Scholar] [CrossRef]
- Ulrich, M.; Braunmuehl, T.; Kurzen, H.; Dirschka, T.; Kellner, C.; Sattler, E.; Berking, C.; Welzel, J.; Reinhold, U. The sensitivity and specificity of optical coherence tomography for the assisted diagnosis of nonpigmented basal cell carcinoma: An observational study. Br. J. Dermatol. 2015, 173, 428–435. [Google Scholar] [CrossRef]
- Levine, A.; Wang, K.; Markowitz, O. Optical Coherence Tomography in the Diagnosis of Skin Cancer. Dermatol. Clin. 2017, 35, 465–488. [Google Scholar] [CrossRef]
- Koenig, K. High-resolution multiphoton tomography of human skin with subcellular spatial resolution and picosecond time resolution. J. Biomed. Opt. 2003, 8, 432–439. [Google Scholar] [CrossRef]
- Dubois, A.; Levecq, O.; Azimani, H.; Siret, D.; Barut, A.; Suppa, M.; del Marmol, V.; Malvehy, J.; Cinotti, E.; Rubegni, P.; et al. Line-field confocal optical coherence tomography for high-resolution noninvasive imaging of skin tumors. J. Biomed. Opt. 2018, 23, 106007–106009. [Google Scholar] [CrossRef]
- Ogien, J.; Daures, A.; Cazalas, M.; Perrot, J.L.; Dubois, A. Line-field confocal optical coherence tomography for three-dimensional skin imaging. Front. Optoelectron. 2020, 13, 381–392. [Google Scholar] [CrossRef] [PubMed]
- Ogien, J.; Tavernier, C.; Fischman, S.; Dubois, A. Line-field confocal optical coherence tomography (LC-OCT): Principles and practical use. Ital. J. Dermatol. Venereol. 2023, 158, 171–179. [Google Scholar] [CrossRef] [PubMed]
- Larkin, K.G. Efficient nonlinear algorithm for envelope detection in white light interferometry. J. Opt. Soc. Am. 1996, 13, 832–843. [Google Scholar] [CrossRef]
- Dubois, A. A simplified algorithm for digital fringe analysis in two-wave interferometry with sinusoidal phase modulation. Opt. Commun. 2017, 391, 128–134. [Google Scholar] [CrossRef]
- Schuh, S.; Ruini, C.; Perwein, M.K.E.; Daxenberger, F.; Gust, C.; Sattler, E.C.; Welzel, J. Line-Field Confocal Optical Coherence Tomography: A New Tool for the Differentiation between Nevi and Melanomas? Cancers 2022, 14, 1140. [Google Scholar] [CrossRef] [PubMed]
- Perez-Anker, J.; Puig, S.; Alos, L.; García, A.; Alejo, B.; Cinotti, E.; Cano, C.O.; Tognetti, L.; Lenoir, C.; Monnier, J.; et al. Morphological evaluation of melanocytic lesions with three-dimensional line-field confocal optical coherence tomography: Correlation with histopathology and reflectance confocal microscopy. A pilot study. Clin. Exp. Dermatol. 2022, 47, 2222–2233. [Google Scholar] [CrossRef]
- Lenoir, C.; Perez-Anker, J.; Diet, G.; Tognetti, L.; Cinotti, E.; Trépant, A.; Rubegni, P.; Puig, S.; Perrot, J.; Malvehy, J.; et al. Line-field confocal optical coherence tomography of benign dermal melanocytic proliferations: A case series. J. Eur. Acad. Dermatol. Venereol. 2021, 35, E399–E401. [Google Scholar] [CrossRef]
- Verzì, A.E.; Broggi, G.; Caltabiano, R.; Micali, G.; Lacarrubba, F. Line-field confocal optical coherence tomography of lentigo maligna with horizontal and vertical histopathologic correlations. J. Cutan. Pathol. 2023, 50, 118–122. [Google Scholar] [CrossRef]
- Peris, K.; Fargnoli, M.C.; Kaufmann, R.; Arenberger, P.; Bastholt, L.; Seguin, N.B.; Bataille, V.; Brochez, L.; del Marmol, V.; Dummer, R.; et al. European consensus-based interdisciplinary guideline for diagnosis and treatment of basal cell carcinoma—Update 2023. Eur. J. Cancer 2023, 192, 113254. [Google Scholar] [CrossRef] [PubMed]
- Ulrich, M.; Roewert-Huber, F.; González, S.; Rius-Diaz, F.; Stockfleth, E.; Kanitakis, J. Peritumoral clefting in basal cell carcinoma: Correlation of in vivo reflectance confocal microscopy and routine histology. J. Cutan. Pathol. 2010, 38, 190–195. [Google Scholar] [CrossRef] [PubMed]
- Ruini, C.; Schuh, S.; Gust, C.; Kendziora, B.; Frommherz, L.; French, L.E.; Hartmann, D.; Welzel, J.; Sattler, E. Line-field optical coherence tomography: In vivo diagnosis of basal cell carcinoma subtypes compared with histopathology. Clin. Exp. Dermatol. 2021, 46, 1471–1481. [Google Scholar] [CrossRef] [PubMed]
- Gust, C.; Schuh, S.; Welzel, J.; Daxenberger, F.; Hartmann, D.; French, L.E.; Ruini, C.; Sattler, E.C. Line-Field Confocal Optical Coherence Tomography Increases the Diagnostic Accuracy and Confidence for Basal Cell Carcinoma in Equivocal Lesions: A Prospective Study. Cancers 2022, 14, 1082. [Google Scholar] [CrossRef] [PubMed]
- Donelli, C.; Suppa, M.; Tognetti, L.; Perrot, J.L.; Calabrese, L.; Pérez-Anker, J.; Malvehy, J.; Rubegni, P.; Cinotti, E. Line-Field Confocal Optical Coherence Tomography for the Diagnosis of Skin Carcinomas: Real-Life Data over Three Years. Curr. Oncol. 2023, 30, 8853–8864. [Google Scholar] [CrossRef] [PubMed]
- Lenoir, C.; Cinotti, E.; Tognetti, L.; Cano, C.O.; Diet, G.; Miyamoto, M.; Rocq, L.; Trépant, A.; Perez-Anker, J.; Puig, S.; et al. Line-field confocal optical coherence tomography of actinic keratosis: A case series. J. Eur. Acad. Dermatol. Venereol. 2021, 35, E900–E902. [Google Scholar] [CrossRef]
- Ruini, C.; Schuh, S.; Gust, C.; Hartmann, D.; French, L.E.; Sattler, E.C.; Welzel, J. In-Vivo LC-OCT Evaluation of the Downward Proliferation Pattern of Keratinocytes in Actinic Keratosis in Comparison with Histology: First Impressions from a Pilot Study. Cancers 2021, 13, 2856. [Google Scholar] [CrossRef]
- Cinotti, E.; Tognetti, L.; Cartocci, A.; Lamberti, A.; Gherbassi, S.; Cano, C.O.; Lenoir, C.; Dejonckheere, G.; Diet, G.; Fontaine, M.; et al. Line-field confocal optical coherence tomography for actinic keratosis and squamous cell carcinoma: A descriptive study. Clin. Exp. Dermatol. 2021, 46, 1530–1541. [Google Scholar] [CrossRef]
- Ruini, C.; Schuh, S.; Gust, C.; Kendziora, B.; Frommherz, L.; French, L.E.; Hartmann, D.; Welzel, J.; Sattler, E.C. Line-field confocal optical coherence tomography for the in vivo real-time diagnosis of different stages of keratinocyte skin cancer: A preliminary study. J. Eur. Acad. Dermatol. Venereol. 2021, 35, 2388–2397. [Google Scholar] [CrossRef]
- Cinotti, E.; Bertello, M.; Cartocci, A.; Fiorani, D.; Tognetti, L.; Solmi, V.; Cappilli, S.; Peris, K.; Perrot, J.L.; Suppa, M.; et al. Comparison of reflectance confocal microscopy and line-field optical coherence tomography for the identification of keratinocyte skin tumours. Ski. Res. Technol. 2023, 29, e13215. [Google Scholar] [CrossRef]
- Thamm, J.R.; Daxenberger, F.; Viel, T.; Gust, C.; Eijkenboom, Q.; French, L.E.; Welzel, J.; Sattler, E.C.; Schuh, S. Artificial intelligence-based PRO score assessment in actinic keratoses from LC-OCT imaging using Convolutional Neural Networks. J. Ger. Soc. Dermatol. 2023, 21, 1359–1366. [Google Scholar] [CrossRef] [PubMed]
- Schmitz, L.; Gambichler, T.; Kost, C.; Gupta, G.; Stücker, M.; Stockfleth, E.; Dirschka, T. Cutaneous squamous cell carcinomas are associated with basal proliferating actinic keratoses. Br. J. Dermatol. 2019, 180, 916–921. [Google Scholar] [CrossRef] [PubMed]
- Schmitz, L.; Gambichler, T.; Gupta, G.; Stücker, M.; Stockfleth, E.; Szeimies, R.; Dirschka, T. Actinic keratoses show variable histological basal growth patterns—A proposed classification adjustment. J. Eur. Acad. Dermatol. Venereol. 2018, 32, 745–751. [Google Scholar] [CrossRef] [PubMed]
- Daxenberger, F.; Deußing, M.; Eijkenboom, Q.; Gust, C.; Thamm, J.; Hartmann, D.; French, L.E.; Welzel, J.; Schuh, S.; Sattler, E.C. Innovation in Actinic Keratosis Assessment: Artificial Intelligence-Based Approach to LC-OCT PRO Score Evaluation. Cancers 2023, 15, 4457. [Google Scholar] [CrossRef] [PubMed]
- Fischman, S.; Perez-Anker, J.; Tognetti, L.; Di Naro, A.; Suppa, M.; Cinotti, E.; Viel, T.; Monnier, J.; Rubegni, P.; del Marmol, V.; et al. Non-invasive scoring of cellular atypia in keratinocyte cancers in 3D LC-OCT images using Deep Learning. Sci. Rep. 2022, 12, 481. [Google Scholar] [CrossRef] [PubMed]
- Chen, T.; Guestrin, C. XGBoost: A Scalable Tree Boosting System. In Proceedings of the 22nd ACM SIGKDD International Conference on Knowledge Discovery and Data Mining, San Francisco, CA, USA, 13–17 August 2016; pp. 785–794. [Google Scholar] [CrossRef]
- Lacarrubba, F.; Verzì, A.E.; Polita, M.; Aleo, A.; Micali, G. Line-field confocal optical coherence tomography in the treatment monitoring of actinic keratosis with tirbanibulin: A pilot study. J. Eur. Acad. Dermatol. Venereol. JEADV 2023, 37, e1131–e1133. [Google Scholar] [CrossRef] [PubMed]
- Verzì, A.E.; Broggi, G.; Micali, G.; Sorci, F.; Caltabiano, R.; Lacarrubba, F. Line-field confocal optical coherence tomography of psoriasis, eczema and lichen planus: A case series with histopathological correlation. J. Eur. Acad. Dermatol. Venereol. 2022, 36, 1884–1889. [Google Scholar] [CrossRef]
- Donelli, C.; Rubegni, P.; Tognetti, L.; Lacarrubba, F.; Di Stefani, A.; Cappilli, S.; Suppa, M.; Perrot, J.-L.; Cinotti, E. Inflammatory and infectious skin diseases in line-field confocal optical coherence tomography: State of the art. Ital. J. Dermatol. Venereol. 2023, 158, 190–196. [Google Scholar] [CrossRef]
- Hobelsberger, S.; Steininger, J.; Bauer, A.; Beissert, S.; Gellrich, F.F. Line-field confocal optical coherence tomography for the diagnosis of onychomycosis in comparison with healthy nails: A case series. J. Eur. Acad. Dermatol. Venereol. JEADV 2023, 37, E1234–E1236. [Google Scholar] [CrossRef]
- Truong, T.M.; Pathak, G.N.; Rao, B.K. Line-field confocal optical coherence tomography imaging findings of scalp psoriasis. JAAD Case Rep. 2023, 39, 106–108. [Google Scholar] [CrossRef]
- Pathak, G.N.; Truong, T.M.; Rao, B.K. Line-field confocal optical coherence tomography assessment of pityriasis rosea. JAAD Case Rep. 2023, 39, 135–138. [Google Scholar] [CrossRef]
- Orsini, C.; Trovato, E.; Cortonesi, G.; Pedrazzani, M.; Suppa, M.; Rubegni, P.; Tognetti, L.; Cinotti, E. Line-field confocal optical coherence tomography: New insights for psoriasis treatment monitoring. J. Eur. Acad. Dermatol. Venereol. JEADV 2023. [Google Scholar] [CrossRef]
- Waszczuk, L.; Ogien, J.; Perrot, J.-L.; Dubois, A. Co-localized line-field confocal optical coherence tomography and confocal Raman microspectroscopy for three-dimensional high-resolution morphological and molecular characterization of skin tissues ex vivo. Biomed. Opt. Express 2022, 13, 2467–2487. [Google Scholar] [CrossRef]


Disclaimer/Publisher’s Note: The statements, opinions and data contained in all publications are solely those of the individual author(s) and contributor(s) and not of MDPI and/or the editor(s). MDPI and/or the editor(s) disclaim responsibility for any injury to people or property resulting from any ideas, methods, instructions or products referred to in the content. |
© 2023 by the authors. Licensee MDPI, Basel, Switzerland. This article is an open access article distributed under the terms and conditions of the Creative Commons Attribution (CC BY) license (https://creativecommons.org/licenses/by/4.0/).
Share and Cite
Latriglia, F.; Ogien, J.; Tavernier, C.; Fischman, S.; Suppa, M.; Perrot, J.-L.; Dubois, A. Line-Field Confocal Optical Coherence Tomography (LC-OCT) for Skin Imaging in Dermatology. Life 2023, 13, 2268. https://doi.org/10.3390/life13122268
Latriglia F, Ogien J, Tavernier C, Fischman S, Suppa M, Perrot J-L, Dubois A. Line-Field Confocal Optical Coherence Tomography (LC-OCT) for Skin Imaging in Dermatology. Life. 2023; 13(12):2268. https://doi.org/10.3390/life13122268
Chicago/Turabian StyleLatriglia, Flora, Jonas Ogien, Clara Tavernier, Sébastien Fischman, Mariano Suppa, Jean-Luc Perrot, and Arnaud Dubois. 2023. "Line-Field Confocal Optical Coherence Tomography (LC-OCT) for Skin Imaging in Dermatology" Life 13, no. 12: 2268. https://doi.org/10.3390/life13122268
APA StyleLatriglia, F., Ogien, J., Tavernier, C., Fischman, S., Suppa, M., Perrot, J.-L., & Dubois, A. (2023). Line-Field Confocal Optical Coherence Tomography (LC-OCT) for Skin Imaging in Dermatology. Life, 13(12), 2268. https://doi.org/10.3390/life13122268