Abstract
The purpose of this study is to correlate quantitative T1, T2, and proton density (PD) values with breast cancer subtypes. Twenty-eight breast cancer patients underwent MRI of the breast including synthetic MRI. T1, T2, and PD values were correlated with Ki-67 and were compared between ER-positive and ER-negative cancers, and between Luminal A and Luminal B cancers. The effectiveness of T1, T2, and PD in differentiating the ER-negative from the ER-positive group and Luminal A from Luminal B cancers was evaluated using receiver operating characteristic analysis. Mean T2 relaxation of ER-negative cancers was significantly higher than that of ER-positive cancers (p < 0.05). The T1, T2, and PD values exhibited a strong positive correlation with Ki-67 (Pearson’s r = 0.75, 0.69, and 0.60 respectively; p < 0.001). Among ER-positive cancers, T1, T2, and PD values of Luminal A cancers were significantly lower than those of Luminal B cancers (p < 0.05). The area under the curve (AUC) of T2 for discriminating ER-negative from ER-positive cancers was 0.87 (95% CI: 0.69–0.97). The AUC of T1 for discriminating Luminal A from Luminal B cancers was 0.83 (95% CI: 0.61–0.95). In conclusion, quantitative values derived from synthetic MRI show potential for subtyping of invasive breast cancers.
1. Introduction
Breast cancer is the most frequently diagnosed malignancy and the leading cause of cancer-related death among women [1]. Breast cancer is a heterogeneous disease with a high degree of diversity with regards to the risk of therapeutic resistance and disease progression [2]. Therefore, the need for individualized management is widely accepted [2,3]. In addition to the traditional parameters, such as tumor size, grade, and lymph node status, the immunohistochemical-based classification is widely used [2,3]. Immunohistochemical assessments for tumor subtyping concern estrogen receptor (ER) and human epidermal growth factor receptor 2 (HER2) expressions, and proliferation according to the Ki-67 labeling index (Ki-67) [2,3].
The presence of ER or progesterone receptor (PgR) is a predictive marker of the long-term outcome and response to hormonal therapy [2,3]. Luminal-type (hormone receptor–positive) breast cancer is the most frequent subtype and is itself divided into two subtypes, namely Luminal A and Luminal B. Luminal A is defined as a low-proliferation subtype (Ki-67 < 14), whereas Luminal B is defined as a high-proliferation subtype (Ki-67 ≥ 14) [2,3,4]. Luminal A is not responsive to chemotherapy. Luminal B may be amenable to chemotherapy as well as endocrine therapy [2,3]. For hormone receptor-negative breast cancer, chemotherapy, frequently combined with molecular-targeted drugs, may be useful [2,3]. Since these receptor expressions can change during treatment [5,6], noninvasive assessment of receptor status, especially in recurrent lesions, may improve personalized treatment. As such, non-invasive assessment of Ki-67 may help in selecting appropriate adjuvant therapy.
Many researchers have explored the relationship between breast cancer subtypes and imaging findings. Breast magnetic resonance imaging (MRI) plays an important role in the detection, diagnosis, and staging of breast cancers [7]. Quantitative MRI methods, such as diffusion-weighted imaging (DWI) with apparent diffusion coefficient (ADC) measurements, have been used to discriminate breast cancer subtypes. However, recent meta-analyses reported that there is no significant correlation between the apparent diffusion coefficient (ADC) and Ki-67, and that there is a significant overlap in ADCs between breast cancer subtypes [8,9].
The recently developed technique of synthetic MRI allows for quantitative analysis of T1 relaxation, T2 relaxation, and proton density (PD), as well as generating various image contrasts using the information from one single scan [10,11,12]. Several investigators have reported that aggressive breast cancers tend to have high signal intensity on T2-weighted images [13,14,15,16,17,18,19,20,21]. We hypothesized that quantitative MRI parameters, such as T2 relaxation and proton density, correlate to the tumor grade of breast cancers.
The purpose of this study was twofold: to correlate quantitative T1, T2, and PD values obtained using synthetic MRI with tumor grade of breast cancers, and to determine if these quantitative values obtained using synthetic MRI can differentiate subtypes of breast cancers.
2. Materials and Methods
2.1. Subjects
The prospective study protocol was approved by the Institutional Review Board for Clinical Research, Tokai University (ref. 19R-182). Between November 2020 and February 2021, patients with histologically proven invasive breast carcinoma, a tumor size larger than 15 mm on ultrasound, and who were referred for pretreatment evaluation, underwent breast MRI. Thirty consecutive patients were invited in this study and written informed consent was obtained from all participants.
2.2. MR Image Acquisition
Studies were performed on a 1.5 T scanner (Ingenia, Philips Healthcare, Best, The Netherlands) using a 16-channel breast-phased array coil. Images were acquired in the prone position and in axial orientation to cover the whole breasts. Participating patients underwent synthetic MRI in addition to routine clinical MRI sequences. In synthetic MRI, quantification of T1 and T2 relaxation rates, as well as PD, was performed using the QRAPMASTER pulse method sequence, which is a multi-slice, multi-echo, and multi-saturation delay acquisition sequence [11]. Two sets of echo times (TEs) and 4 sets of delay times were used to generate 8 complex images in each section in order to quantify T1, T2, and PD. The TEs were 12.5 and 100 msec, the delay times were 151, 604, 2115, and 4382 msec, and the repetition time (TR) was 4462 msec. Thirty slices were acquired, voxel size was 1.42 × 1.92 × 4.00 mm3, and total acquisition time was 3:40 min. Synthetic images were created using SyMRI StandAlone software (SyntheticMR AB). Following synthetic MRI, routine T1-weighted images (TR/TE, 600/12 msec), STIR (TR/TE/TI, 3500/90/160 msec), DWI using single-shot echo planar imaging (b values of 0 and 1500 s/mm2; number of excitations, 1 and 14; TR/TE/TI, 6407/86/180 msec; field of view (FOV), 340 mm; matrix, 112 × 112; section thickness, 4 mm), and three-dimensional (3D) fat-suppressed dynamic contrast-enhanced MRI (TR/TE, 4.0/2.1 msec; flip angle, 15°; FOV, 340 mm; matrix, 352 × 352; slice thickness, 1 mm; intersection gap, 0 mm) were obtained. Dynamic scans were performed before and 4 times after the rapid injection of a bolus of 0.1 mmol/L of gadolinium-based contrast medium per kilogram of body weight.
2.3. Image Analysis
MR images were evaluated by a board-certified radiologist with 20 years of experience in breast MRI. Dedicated analysis software for synthetic MRI automatically calculated a value of R1 (i.e., 1/T1), R2 (i.e., 1/T2), and PD, for all pixels in the ROI. The PD level of pure water was set at 100%. Synthetic T1-weighted images (TR/TE, 600/10 msec) were made for measurement purposes. For measurement of T1, T2, and PD, the radiologist selected the slice that showed the largest surface of the tumor on contrast-enhanced images. Subsequently, the corresponding slice was selected on synthetic T1-weighted images. A freehand region of interest (ROI) was placed on the synthetic T1-weighted image while being cross-referenced to the contrast-enhanced images, and with the radiologist being blinded to clinical and pathological information. A freehand ROI was placed just within the inner border of the tumor, in order to avoid the inclusion of surrounding fat. Mean R1, mean R2, and mean PD shown on the viewers were recorded. Mean T1 and mean T2 were calculated based on the following equation: T1 = 1/R1, T2 = 1/R2. Dedicated analysis software automatically calculated apparent diffusion coefficient maps. The same radiologist measured the mean ADC of breast cancers in a similar manner with freehand ROIs set on DWI. The ROIs were copied to the ADC maps to obtain the ADC value.
2.4. Pathological Examination
All pathological specimens were evaluated by our institution’s pathology department using their standard clinical protocol. Pathologists evaluated the specimens on the basis of the World Health Organization histological classification of breast tumors [22]. The expressions of ER and PgR were assessed by immunohistochemical staining. Per our institutional protocol, any expression of ER or PgR greater than 1% was considered positive [23,24]. Ki-67 immunoreactivity was evaluated by using the percentage of immunoreactive tumor cells [25]. Based on Ki-67, cancers were divided into a low-proliferation group (Luminal A) (Ki-67 < 14) and a high-proliferation group (Luminal B) (Ki-67 ≥ 14) [3,4].
2.5. Statistical Analysis
Data were analyzed using MedCalc 19.8 (MedCalc). All data are expressed as means ± standard deviation, unless otherwise specified. Normal distribution of the T1, T2, PD, and ADC values was tested using the Shapiro–Wilk test. Age, tumor diameter, Ki-67, and the quantitative MRI parameters regarding ER status (positive vs. negative) and Luminal types (A vs. B) were compared using the unpaired t test (for normally distributed data) or the Mann-Whitney U Test (for not normally distributed data). Quantitative MR parameters including ADC, were correlated with Ki-67 using a Pearson’s correlation analysis (for normally distributed data) or a Spearman correlation analysis (for not normally distributed data). Among resected tumors, the correlation of quantitative MR values with Ki-67 of both biopsy specimen and surgical specimens was assessed.
The effectiveness of quantitative MR parameters, including ADC, in differentiating the ER-negative group from the ER-positive group and Luminal B from the Luminal A was evaluated using receiver operating characteristic (ROC) analysis. For sensitivity and specificity, the optimal cut-off point was determined using the Youden index. The area under the ROC curve (AUC) was expressed as a mean and had a 95% confidence interval. All statistical tests were two-tailed and significance was set at a p < 0.05.
3. Results
3.1. Patients
Thirty patients were invited, however, two of them refused to participate in this study. Finally, 28 female patients participated in the study (mean age 63.3 ± 12.2 years, range 32–80 years). In one of these 28 patients, bilateral breast cancers were found. Therefore, a total of 29 breast cancers were analyzed. Eighteen patients underwent surgery and their surgical specimens were used for pathological analysis. The other 10 patients underwent preoperative chemotherapy and their biopsy specimens were used for pathological analysis, while tumor size was measured on contrast-enhanced MRI. The mean tumor size was 28 mm (range 12–70 mm). The histological classification of the tumors was as follows; 26 invasive carcinomas of no special type, 2 invasive lobular carcinomas, and 1 invasive micropapillary carcinoma. Most of the tumors were ER-positive (88%) and all of the PgR-positive tumors also showed ER positivity. By combining immunohistochemical marker analysis, 10 (34%) Luminal A tumors, 13 (45%) Luminal B tumors, and 6 (21%) ER-negative tumors were identified.
3.2. Relationship with ER Status
Clinical and pathological characteristics, and quantitative MRI values for the 29 lesions are shown in Table 1. No statistical significance was found between the ER-positive cancers and the ER-negative cancers regarding age and tumor diameter. The Ki-67 of ER-negative cancers was significantly higher than that of ER-positive cancers (p < 0.05). Mean T2 relaxation of ER-negative cancers (92.1 ± 13.0 msec) was significantly higher than that of ER-positive cancers (72.7 ± 15.7 msec, p = 0.01) (Figure 1, Figure 2 and Figure 3). Mean T1 relaxation and PD of ER-negative cancers were higher than those of ER-positive cancers, but no significant difference was observed between them. The AUCs of T1, T2, and PD for the differentiation of ER-negative cancers from ER-positive cancers were 0.74 (95% confidence interval (CI): 0.54–0.88), 0.87 (95% CI: 0.69–0.97), and 0.62 (95% CI: 0.42–0.79), respectively. The T2 value had the highest AUC, followed by T1 and PD. The optimal sensitivity and specificity of the T2 value were 100% and 78%.

Table 1.
Characteristics of cancers according to ER status.
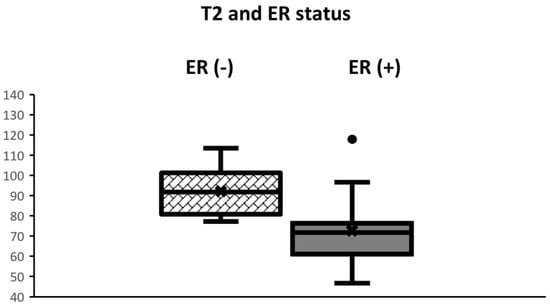
Figure 1.
Boxplots displaying the distribution of T2 values according to ER status. The box extends from the 25th to the 75th percentile. The middle horizontal line represents the median value. T2 of ER-negative cancers was significantly higher than that of ER-positive cancers (p < 0.01).
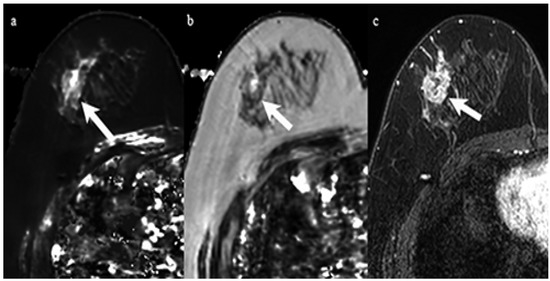
Figure 2.
A 59-year-old woman with invasive ductal carcinoma in the right breast. Immunohistochemical staining showed negativity for estrogen receptor and Ki-67 of 60%. (a) T1 map shows a high signal mass. Mean T1 of the mass was 1477 msec. (b) T2 map shows a high signal mass. Mean T2 of the mass was 96 msec. (c) Corresponding contrast enhanced MR image shows a mass with heterogeneous enhancement.
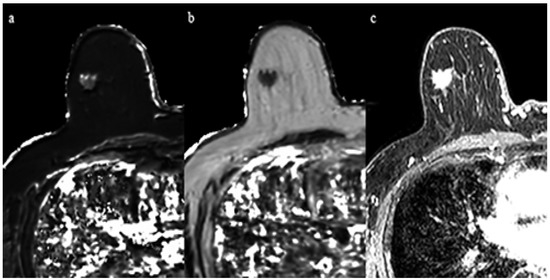
Figure 3.
A 69-year-old woman with invasive ductal carcinoma in the right breast. Immunohistochemical staining showed positivity for estrogen receptor and Ki-67 of 10%. (a) T1 map shows an intermediate signal mass. Mean T1 of the mass was 986 msec. (b) T2 map shows a low signal mass. Mean T2 of the mass was 61 msec. (c) Corresponding contrast enhanced MR image.
3.3. Relationship with Ki-67
The Shapiro–Wilk test showed that the T1, T2, PD, and ADC values followed a normal distribution. The T1, T2, and PD derived from synthetic MRI demonstrated a strong positive correlation with Ki-67 (Pearson’s r = 0.75, 0.69, and 0.60 respectively; p < 0.001) (Figure 4 and Table 2). Among 19 resected cancers, the correlation of biopsy specimen Ki-67 and resected specimen Ki-67 are demonstrated in Table 2. No significant difference was observed between them. No significant correlation was observed either between ADC and Ki-67 (Pearson’s r = 0.11; p = 0.57).
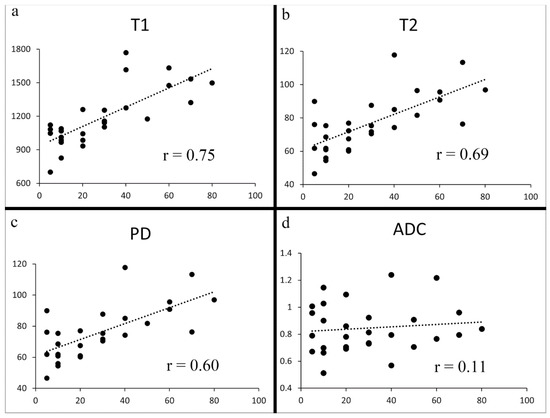
Figure 4.
Scatter plots of Ki-67 vs. T1 (a), T2 (b), PD (c), and ADC (d). Significant correlations were observed between Ki-67 and T1, between Ki-67 and T2, and between Ki-67 and PD (a–c) (p < 0.001). No significant correlation was seen between Ki-67 and ADC (p = 0.57) (d).
Table 2.
Correlation of quantitative MR values with Ki-67.
The clinical and pathological characteristics and quantitative MRI values of ER-positive cancers (n = 23) are shown in Table 3. No statistical significance was found between Luminal A and Luminal B cancers regarding tumor diameter. All T1 (991 ± 132 msec vs. 1259 ± 265 msec), T2 (65.2 ± 12.6 msec vs. 78.5 ± 15.8 msec), and PD values (63.4 ± 11.4% vs. 73.9 ± 12.0%) of Luminal A cancers were significantly lower than those of Luminal B cancers (p < 0.05). The AUCs of T1, T2, and PD for the differentiation of Luminal B cancers from Luminal A cancers were 0.83 (95% CI: 0.61–0.95), 0.75 (95% CI: 0.52–0.90), and 0.75 (95% CI: 0.53–0.91), respectively (Figure 5). The T1 value had the highest AUC, followed by T2 and PD. The optimal sensitivity and specificity of the T1 value were 69% and 100%.
Table 3.
Characteristics of Luminal A and Luminal B cancers.
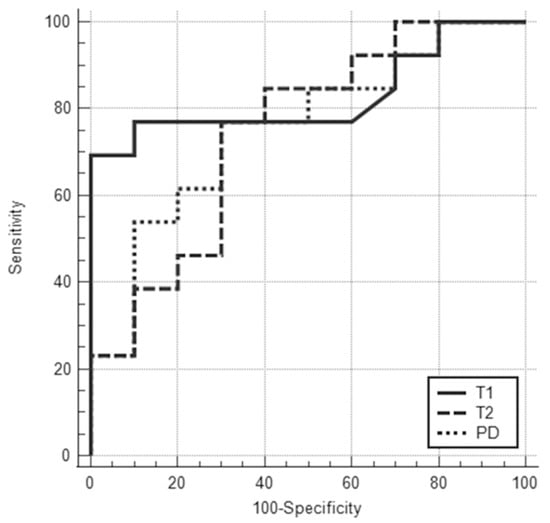
Figure 5.
ROC curves for T1, T2, and PD values for differentiating Luminal A from Luminal B cancers showed that the areas under the ROC curve were 0.83 (95% CI: 0.61–0.95), 0.75 (95% CI: 0.52–0.90), and 0.75 (95% CI: 0.53–0.91), respectively.
4. Discussion
Recent advances in MRI have enabled the acquisition of both MR images and quantitative MRI data within a single scan [11,26,27,28,29,30]. In this study, mean T2 relaxation time of ER-negative cancers was significantly higher than that of ER-positive cancers. This result is in good agreement with prior studies [26,27,28,30].
Three previous studies have evaluated the relationship between Ki-67 and quantitative MRI data; however, their results are discordant [26,27,28,29]. T1 and T2 values of Luminal A cancers were significantly lower than those of Luminal B cancers in the present study, which is hypothesized to be due to less neovascularization in luminal A cancers. This result is consistent with three prior studies [26,27,28], but not consistent with Matsuda et al. [29]. Due to the risk of partial volume effects, only patients with lesions larger than 15 mm were analyzed in the present study, while the mean size of breast cancers in Matsuda et al.’s study was 17 mm in Luminal A type and 20 mm in Luminal B type [29]. We speculate that partial volume effects of surrounding tissue, such as fat, might have affected Matsuda et al.’s results [29].
This study showed T1, T2, and PD values, as derived from synthetic MRI, to be significantly and strongly correlated with Ki-67. Ki-67 is considered to represent tumor proliferation status, with a higher Ki-67 being associated with an adverse clinical outcome [2]. This finding has not been previously reported. We believe that minimization of partial volume effects by selecting tumors larger than 15 mm might have allowed us to obtain this result. Rakow-Penner et al. reported that the T1 value of glandular tissue differed approximately 12% between the normal scan and the fat suppressed image due to partial volume effect [31], which could obscure the above-mentioned correlation.
In previous studies, triple negative breast cancers (a subgroup of ER-negative breast cancers) were reported to have a high signal intensity on T2-weighted images due to necrosis [13,14,15,16,20]. A correlation between high signal intensity on T2-weighted images and tumor grade in other subtypes of breast cancers has also been reported. In those studies, it was postulated that edema with corresponding high signal intensity on T2-weighted images was possibly induced by angiogenesis [17,18,19,21,32,33]. Increased water content related to necrosis or edema may cause T1, T2, and PD elongation [34]. Our finding of higher T1 values, higher T2 values, and higher PD values in highly proliferative cancers are consistent with these prior qualitative studies [13,14,15,16,17,18,19,20].
The relationship between Ki-67 and tumor grade with the ADC value has been reported by some previous studies [8,9,14,17,29,35,36]. In the present study, however, there was no significant correlation between ADC and Ki-67. This finding is similar to prior studies [8,9,17]. Kim et al. reported that highly aggressive tumors may outgrow the oxygen supply of their vascular system, resulting in necrosis and decreased cellularity [17,37]. In high grade tumors, a higher tumor grade often goes hand in hand with a higher ADC value [14,17,36]. In contrast, in relatively well-differentiated tumors, moderately proliferative cancers tend to have a higher cellularity than low proliferative tumors and generally have a lower ADC [35]. This paradoxical phenomenon can cause confusion in subtype prediction based on DWI. Furthermore, both high cell density areas, hematoma, and fat show low ADC values, and discriminating them can be challenging. Contrary to the ADC, all T1, T2, and PD values of high proliferative tumors were higher than those of low proliferative tumors. Since the T1, T2, and PD value assessments did not experience this paradoxical phenomenon, we believe they are more useful than ADC measurements in this setting.
There are several limitations in this study. First, the number of patients in this study was relatively small. Second, 10 out of 28 patients underwent neoadjuvant chemotherapy and only their biopsy specimens could be used for analysis. A significant difference in Ki-67 has been reported between specimens obtained at preoperative biopsy and surgery [38]. However, breast cancer patients with very high Ki-67 values very often undergo preoperative chemotherapy, and surgical specimens without previous chemotherapy are hardly ever obtained [39]. In addition, in the 19 cancers for which both surgical and biopsy specimens were available, the correlation coefficients of quantitative MRI values versus Ki-67 were similar between surgical and biopsy specimens. Third, because of the risk of partial volume effects on quantitative MRI measurements, only large mass lesions were included in this study. Our finding may not be applicable to non-mass lesions or smaller lesions, such as ductal carcinoma in situ [29]. Fourth, all patients underwent biopsy before MRI. Hemorrhage induced by biopsy might have affected the measured quantitative values.
5. Conclusions
In conclusion, quantitative values derived from synthetic MRI show potential for subtyping of invasive breast cancers.
Author Contributions
Conceptualization, T.K.; data curation, T.K.; formal analysis, T.K. and T.T.; funding acquisition, T.T.; investigation, T.K., N.N. (Noriko Nakamura), N.K. and N.N. (Naoki Niikura); methodology, T.K.; project administration, T.T., N.N. (Naoki Niikura), T.N. and J.H.; software, T.T.; supervision, T.T., T.N. and J.H.; validation, T.K.; visualization, T.K. and T.T.; writing—original draft preparation, T.K., T.T. and T.C.K.; writing—review and editing, all authors. All authors have read and agreed to the published version of the manuscript.
Funding
This research was partly supported by the Japan Society for the Promotion of Science KAKENHI (Grant Number JP19K08131).
Institutional Review Board Statement
The study was conducted in accordance with the Declaration of Helsinki and was approved by Institutional Review Board for Clinical Research, Tokai University (protocol code 19R-182 and 11/8/2019).
Informed Consent Statement
Informed consent was obtained from all subjects involved in the study.
Data Availability Statement
Datasets used and/or analyzed during the current study are available from the corresponding author upon reasonable request.
Conflicts of Interest
The authors declare no conflict of interest. The funders had no role in the design of the study; collection, analyses, or interpretation of data; writing of the manuscript; or the decision to publish the results.
References
- Siegel, R.L.; Miller, K.D.; Fuchs, H.E.; Jemal, A. Cancer Statistics, 2021. CA Cancer J. Clin. 2021, 71, 7–33. [Google Scholar] [CrossRef] [PubMed]
- Coates, A.S.; Winer, E.P.; Goldhirsch, A.; Gelber, R.D.; Gnant, M.; Piccart-Gebhart, M.; Thürlimann, B.; Senn, H.-J. Tailoring therapies—Improving the management of early breast cancer: St Gallen International Expert Consensus on the Primary Therapy of Early Breast Cancer 2015. Ann. Oncol. 2015, 26, 1533–1546. [Google Scholar] [CrossRef] [PubMed]
- Goldhirsch, A.; Winer, E.P.; Coates, A.S.; Gelber, R.D.; Piccart-Gebhart, M.; Thürlimann, B.; Senn, H.-J. Personalizing the treatment of women with early breast cancer: Highlights of the St Gallen International Expert Consensus on the Primary Therapy of Early Breast Cancer 2013. Ann. Oncol. 2013, 24, 2206–2223. [Google Scholar] [CrossRef] [PubMed]
- Niikura, N.; Masuda, S.; Kumaki, N.; Xiaoyan, T.; Terada, M.; Terao, M.; Iwamoto, T.; Oshitanai, R.; Morioka, T.; Tuda, B.; et al. Prognostic significance of the Ki67 scoring categories in breast cancer subgroups. Clin. Breast Cancer 2014, 14, 323–329.e3. [Google Scholar] [CrossRef] [PubMed]
- Niikura, N.; Liu, J.; Hayashi, N.; Mittendorf, E.A.; Gong, Y.; Palla, S.L.; Tokuda, Y.; Gonzalez-Angulo, A.M.; Hortobagyi, G.N.; Ueno, N.T. Loss of human epidermal growth factor receptor 2 (HER2) expression in metastatic sites of HER2-overexpressing primary breast tumors. J. Clin. Oncol. 2012, 30, 593–599. [Google Scholar] [CrossRef] [PubMed]
- Niikura, N.; Tomotaki, A.; Miyata, H.; Iwamoto, T.; Kawai, M.; Anan, K.; Hayashi, N.; Aogi, K.; Ishida, T.; Masuoka, H.; et al. Changes in tumor expression of HER2 and hormone receptors status after neoadjuvant chemotherapy in 21,755 patients from the Japanese breast cancer registry. Ann. Oncol. 2016, 27, 480–487. [Google Scholar] [CrossRef] [PubMed]
- Kuhl, C. The current status of breast MR imaging Part I. Choice of technique, image interpretation, diagnostic accuracy, and transfer to clinical practice. Radiology 2007, 244, 356–378. [Google Scholar] [CrossRef]
- Meyer, H.J.; Wienke, A.; Surov, A. Diffusion-Weighted Imaging of Different Breast Cancer Molecular Subtypes: A Systematic Review and Meta-Analysis. Breast Care 2022, 17, 47–54. [Google Scholar] [CrossRef]
- Surov, A.; Meyer, H.J.; Wienke, A. Associations between apparent diffusion coefficient (ADC) and KI 67 in different tumors: A meta-analysis. Part 1: ADCmean. Oncotarget 2017, 8, 75434–75444. [Google Scholar] [CrossRef]
- Arita, Y.; Takahara, T.; Yoshida, S.; Kwee, T.C.; Yajima, S.; Ishii, C.; Okuda, S.; Jinzaki, M.; Fujii, Y. Quantitative Assessment of Bone Metastasis in Prostate Cancer Using Synthetic Magnetic Resonance Imaging. Investig. Radiol. 2019, 54, 638–644. [Google Scholar] [CrossRef]
- Warntjes, J.B.; Leinhard, O.D.; West, J.; Lundberg, P. Rapid magnetic resonance quantification on the brain: Optimization for clinical usage. Magn. Reson. Med. 2008, 60, 320–329. [Google Scholar] [CrossRef]
- Jung, Y.; Gho, S.M.; Back, S.N.; Ha, T.; Kang, D.K.; Kim, T.H. The feasibility of synthetic MRI in breast cancer patients: Comparison of T2 relaxation time with multiecho spin echo T2 mapping method. Br. J. Radiol. 2018, 92, 20180479. [Google Scholar] [CrossRef]
- Uematsu, T.; Kasami, M.; Yuen, S. Triple-negative breast cancer: Correlation between MR imaging and pathologic findings. Radiology 2009, 250, 638–647. [Google Scholar] [CrossRef]
- Youk, J.H.; Son, E.J.; Chung, J.; Kim, J.A.; Kim, E.K. Triple-negative invasive breast cancer on dynamic contrast-enhanced and diffusion-weighted MR imaging: Comparison with other breast cancer subtypes. Eur. Radiol. 2012, 22, 1724–1734. [Google Scholar] [CrossRef]
- Sung, J.S.; Jochelson, M.S.; Brennan, S.; Joo, S.; Wen, Y.H.; Moskowitz, C.; Zheng, J.; Dershaw, D.D.; Morris, E.A. MR imaging features of triple-negative breast cancers. Breast J. 2013, 19, 643–649. [Google Scholar] [CrossRef]
- Dogan, B.E.; Gonzalez-Angulo, A.M.; Gilcrease, M.; Dryden, M.J.; Yang, W.T. Multimodality imaging of triple receptor-negative tumors with mammography, ultrasound, and MRI. AJR Am. J. Roentgenol. 2010, 194, 1160–1166. [Google Scholar] [CrossRef]
- Kim, S.Y.; Kim, E.K.; Moon, H.J.; Yoon, J.H.; Koo, J.S.; Kim, S.G.; Kim, M.J. Association among T2 signal intensity, necrosis, ADC and Ki-67 in estrogen receptor-positive and HER2-negative invasive ductal carcinoma. Magn. Reson. Imaging 2018, 54, 176–182. [Google Scholar] [CrossRef]
- Yuen, S.; Uematsu, T.; Kasami, M.; Tanaka, K.; Kimura, K.; Sanuki, J.; Uchida, Y.; Furukawa, H. Breast carcinomas with strong high-signal intensity on T2-weighted MR images: Pathological characteristics and differential diagnosis. J. Magn. Reson. Imaging 2007, 25, 502–510. [Google Scholar] [CrossRef]
- Seo, M.; Ryu, J.K.; Jahng, G.H.; Sohn, Y.M.; Rhee, S.J.; Oh, J.H.; Won, K.-Y. Estimation of T2* Relaxation Time of Breast Cancer: Correlation with Clinical, Imaging and Pathological Features. Korean J. Radiol. 2017, 18, 238–248. [Google Scholar] [CrossRef]
- Yuen, S.; Monzawa, S.; Yanai, S.; Matsumoto, H.; Yata, Y.; Ichinose, Y.; Deai, T.; Hashimoto, T.; Tashiro, T.; Yamagami, K. The association between MRI findings and breast cancer subtypes: Focused on the combination patterns on diffusion-weighted and T2-weighted images. Breast Cancer 2020, 27, 1029–1037. [Google Scholar] [CrossRef]
- Kazama, T.; Takahara, T.; Hashimoto, J. Breast Cancer Subtypes and Quantitative Magnetic Resonance Imaging: A Systemic Review. Life 2022, 12, 490. [Google Scholar] [CrossRef]
- Board, W.C.o.T.E. World Health Organization Classification of Tumours. Breast Tumours; International Agency for Research on Cancer: Lyon, France, 2019. [Google Scholar]
- Hammond, M.E.; Hayes, D.F.; Dowsett, M.; Allred, D.C.; Hagerty, K.L.; Badve, S.; Fitzgibbons, P.L.; Francis, G.; Goldstein, N.S.; Hayes, M.; et al. American Society of Clinical Oncology/College of American Pathologists guideline recommendations for immunohistochemical testing of estrogen and progesterone receptors in breast cancer. Arch. Pathol. Lab. Med. 2010, 134, 907–922. [Google Scholar] [CrossRef]
- Curigliano, G.; Burstein, H.J.; Winer, E.P.; Gnant, M.; Dubsky, P.; Loibl, S.; Colleoni, M.; Regan, M.M.; Piccart-Gebhart, M.; Senn, H.-J.; et al. De-escalating and escalating treatments for early-stage breast cancer: The St. Gallen International Expert Consensus Conference on the Primary Therapy of Early Breast Cancer 2017. Ann. Oncol. 2017, 28, 1700–1712. [Google Scholar] [CrossRef]
- Dowsett, M.; Nielsen, T.O.; A’Hern, R.; Bartlett, J.; Coombes, R.C.; Cuzick, J.; Ellis, M.; Henry, N.L.; Hugh, J.C.; Lively, T.; et al. Assessment of Ki67 in breast cancer: Recommendations from the International Ki67 in Breast Cancer working group. J. Natl. Cancer Inst. 2011, 103, 1656–1664. [Google Scholar] [CrossRef]
- Du, S.; Gao, S.; Zhang, L.; Yang, X.; Qi, X.; Li, S. Improved discrimination of molecular subtypes in invasive breast cancer: Comparison of multiple quantitative parameters from breast MRI. Magn. Reson. Imaging 2021, 77, 148–158. [Google Scholar] [CrossRef]
- Li, Q.; Xiao, Q.; Yang, M.; Chai, Q.; Huang, Y.; Wu, P.Y.; Niu, Q.; Gu, Y. Histogram analysis of quantitative parameters from synthetic MRI: Correlations with prognostic factors and molecular subtypes in invasive ductal breast cancer. Eur. J. Radiol. 2021, 139, 109697. [Google Scholar] [CrossRef]
- Gao, W.; Yang, Q.; Li, X.; Chen, X.; Wei, X.; Diao, Y.; Zhang, Y.; Chen, C.; Guo, B.; Wang, Y.; et al. Synthetic MRI with quantitative mappings for identifying receptor status, proliferation rate, and molecular subtypes of breast cancer. Eur. J. Radiol. 2022, 148, 110168. [Google Scholar] [CrossRef] [PubMed]
- Matsuda, M.; Kido, T.; Tsuda, T.; Okada, K.; Shiraishi, Y.; Suekuni, H.; Kamei, Y.; Kitazawa, R.; Mochizuki, T. Utility of synthetic MRI in predicting the Ki-67 status of oestrogen receptor-positive breast cancer: A feasibility study. Clin. Radiol. 2020, 75, e391–e398. [Google Scholar] [CrossRef] [PubMed]
- Matsuda, M.; Tsuda, T.; Ebihara, R.; Toshimori, W.; Okada, K.; Takeda, S.; Okumura, A.; Shiraishi, Y.; Suekuni, H.; Kamei, Y.; et al. Triple-negative breast cancer on contrast-enhanced MRI and synthetic MRI: A comparison with non-triple-negative breast carcinoma. Eur. J. Radiol. 2021, 142, 109838. [Google Scholar] [CrossRef] [PubMed]
- Rakow-Penner, R.; Daniel, B.; Yu, H.; Sawyer-Glover, A.; Glover, G.H. Relaxation times of breast tissue at 1.5T and 3T measured using IDEAL. J. Magn. Reson. Imaging 2006, 23, 87–91. [Google Scholar] [CrossRef] [PubMed]
- Baltzer, P.A.; Yang, F.; Dietzel, M.; Herzog, A.; Simon, A.; Vag, T.; Gajda, M.; Camara, O.; Kaiser, W.A. Sensitivity and specificity of unilateral edema on T2w-TSE sequences in MR-Mammography considering 974 histologically verified lesions. Breast J. 2010, 16, 233–239. [Google Scholar] [CrossRef]
- Renz, D.M.; Baltzer, P.A.; Bottcher, J.; Thaher, F.; Gajda, M.; Camara, O.; Runnebaum, I.B.; Kaiser, W.A. Magnetic resonance imaging of inflammatory breast carcinoma and acute mastitis. A comparative study. Eur. Radiol. 2008, 18, 2370–2380. [Google Scholar] [CrossRef]
- Crooks, L.E.; Hylton, N.M.; Ortendahl, D.A.; Posin, J.P.; Kaufman, L. The value of relaxation times and density measurements in clinical MRI. Investig. Radiol. 1987, 22, 158–169. [Google Scholar] [CrossRef]
- Mori, N.; Ota, H.; Mugikura, S.; Takasawa, C.; Ishida, T.; Watanabe, G.; Tada, H.; Watanabe, M.; Takase, K.; Takahashi, S. Luminal-type breast cancer: Correlation of apparent diffusion coefficients with the Ki-67 labeling index. Radiology 2015, 274, 66–73. [Google Scholar] [CrossRef]
- Martincich, L.; Deantoni, V.; Bertotto, I.; Redana, S.; Kubatzki, F.; Sarotto, I.; Rossi, V.; Liotti, M.; Ponzone, R.; Aglietta, M.; et al. Correlations between diffusion-weighted imaging and breast cancer biomarkers. Eur. Radiol. 2012, 22, 1519–1528. [Google Scholar] [CrossRef]
- Leek, R.D.; Landers, R.J.; Harris, A.L.; Lewis, C.E. Necrosis correlates with high vascular density and focal macrophage infiltration in invasive carcinoma of the breast. Br. J. Cancer 1999, 79, 991–995. [Google Scholar] [CrossRef]
- Romero, Q.; Bendahl, P.O.; Klintman, M.; Loman, N.; Ingvar, C.; Ryden, L.; Rose, C.; Grabau, D.; Borgquist, S. Ki67 proliferation in core biopsies versus surgical samples—A model for neo-adjuvant breast cancer studies. BMC Cancer 2011, 11, 341. [Google Scholar] [CrossRef]
- Mauri, D.; Pavlidis, N.; Ioannidis, J.P. Neoadjuvant versus adjuvant systemic treatment in breast cancer: A meta-analysis. J. Natl. Cancer Inst. 2005, 97, 188–194. [Google Scholar] [CrossRef] [Green Version]
Publisher’s Note: MDPI stays neutral with regard to jurisdictional claims in published maps and institutional affiliations. |
© 2022 by the authors. Licensee MDPI, Basel, Switzerland. This article is an open access article distributed under the terms and conditions of the Creative Commons Attribution (CC BY) license (https://creativecommons.org/licenses/by/4.0/).