
Quality of Multicenter Studies Using MRI Radiomics for Diagnosing Clinically Significant Prostate Cancer: A Systematic Review


Abstract
:1. Introduction
2. Materials and Methods
2.1. Eligibility Criteria
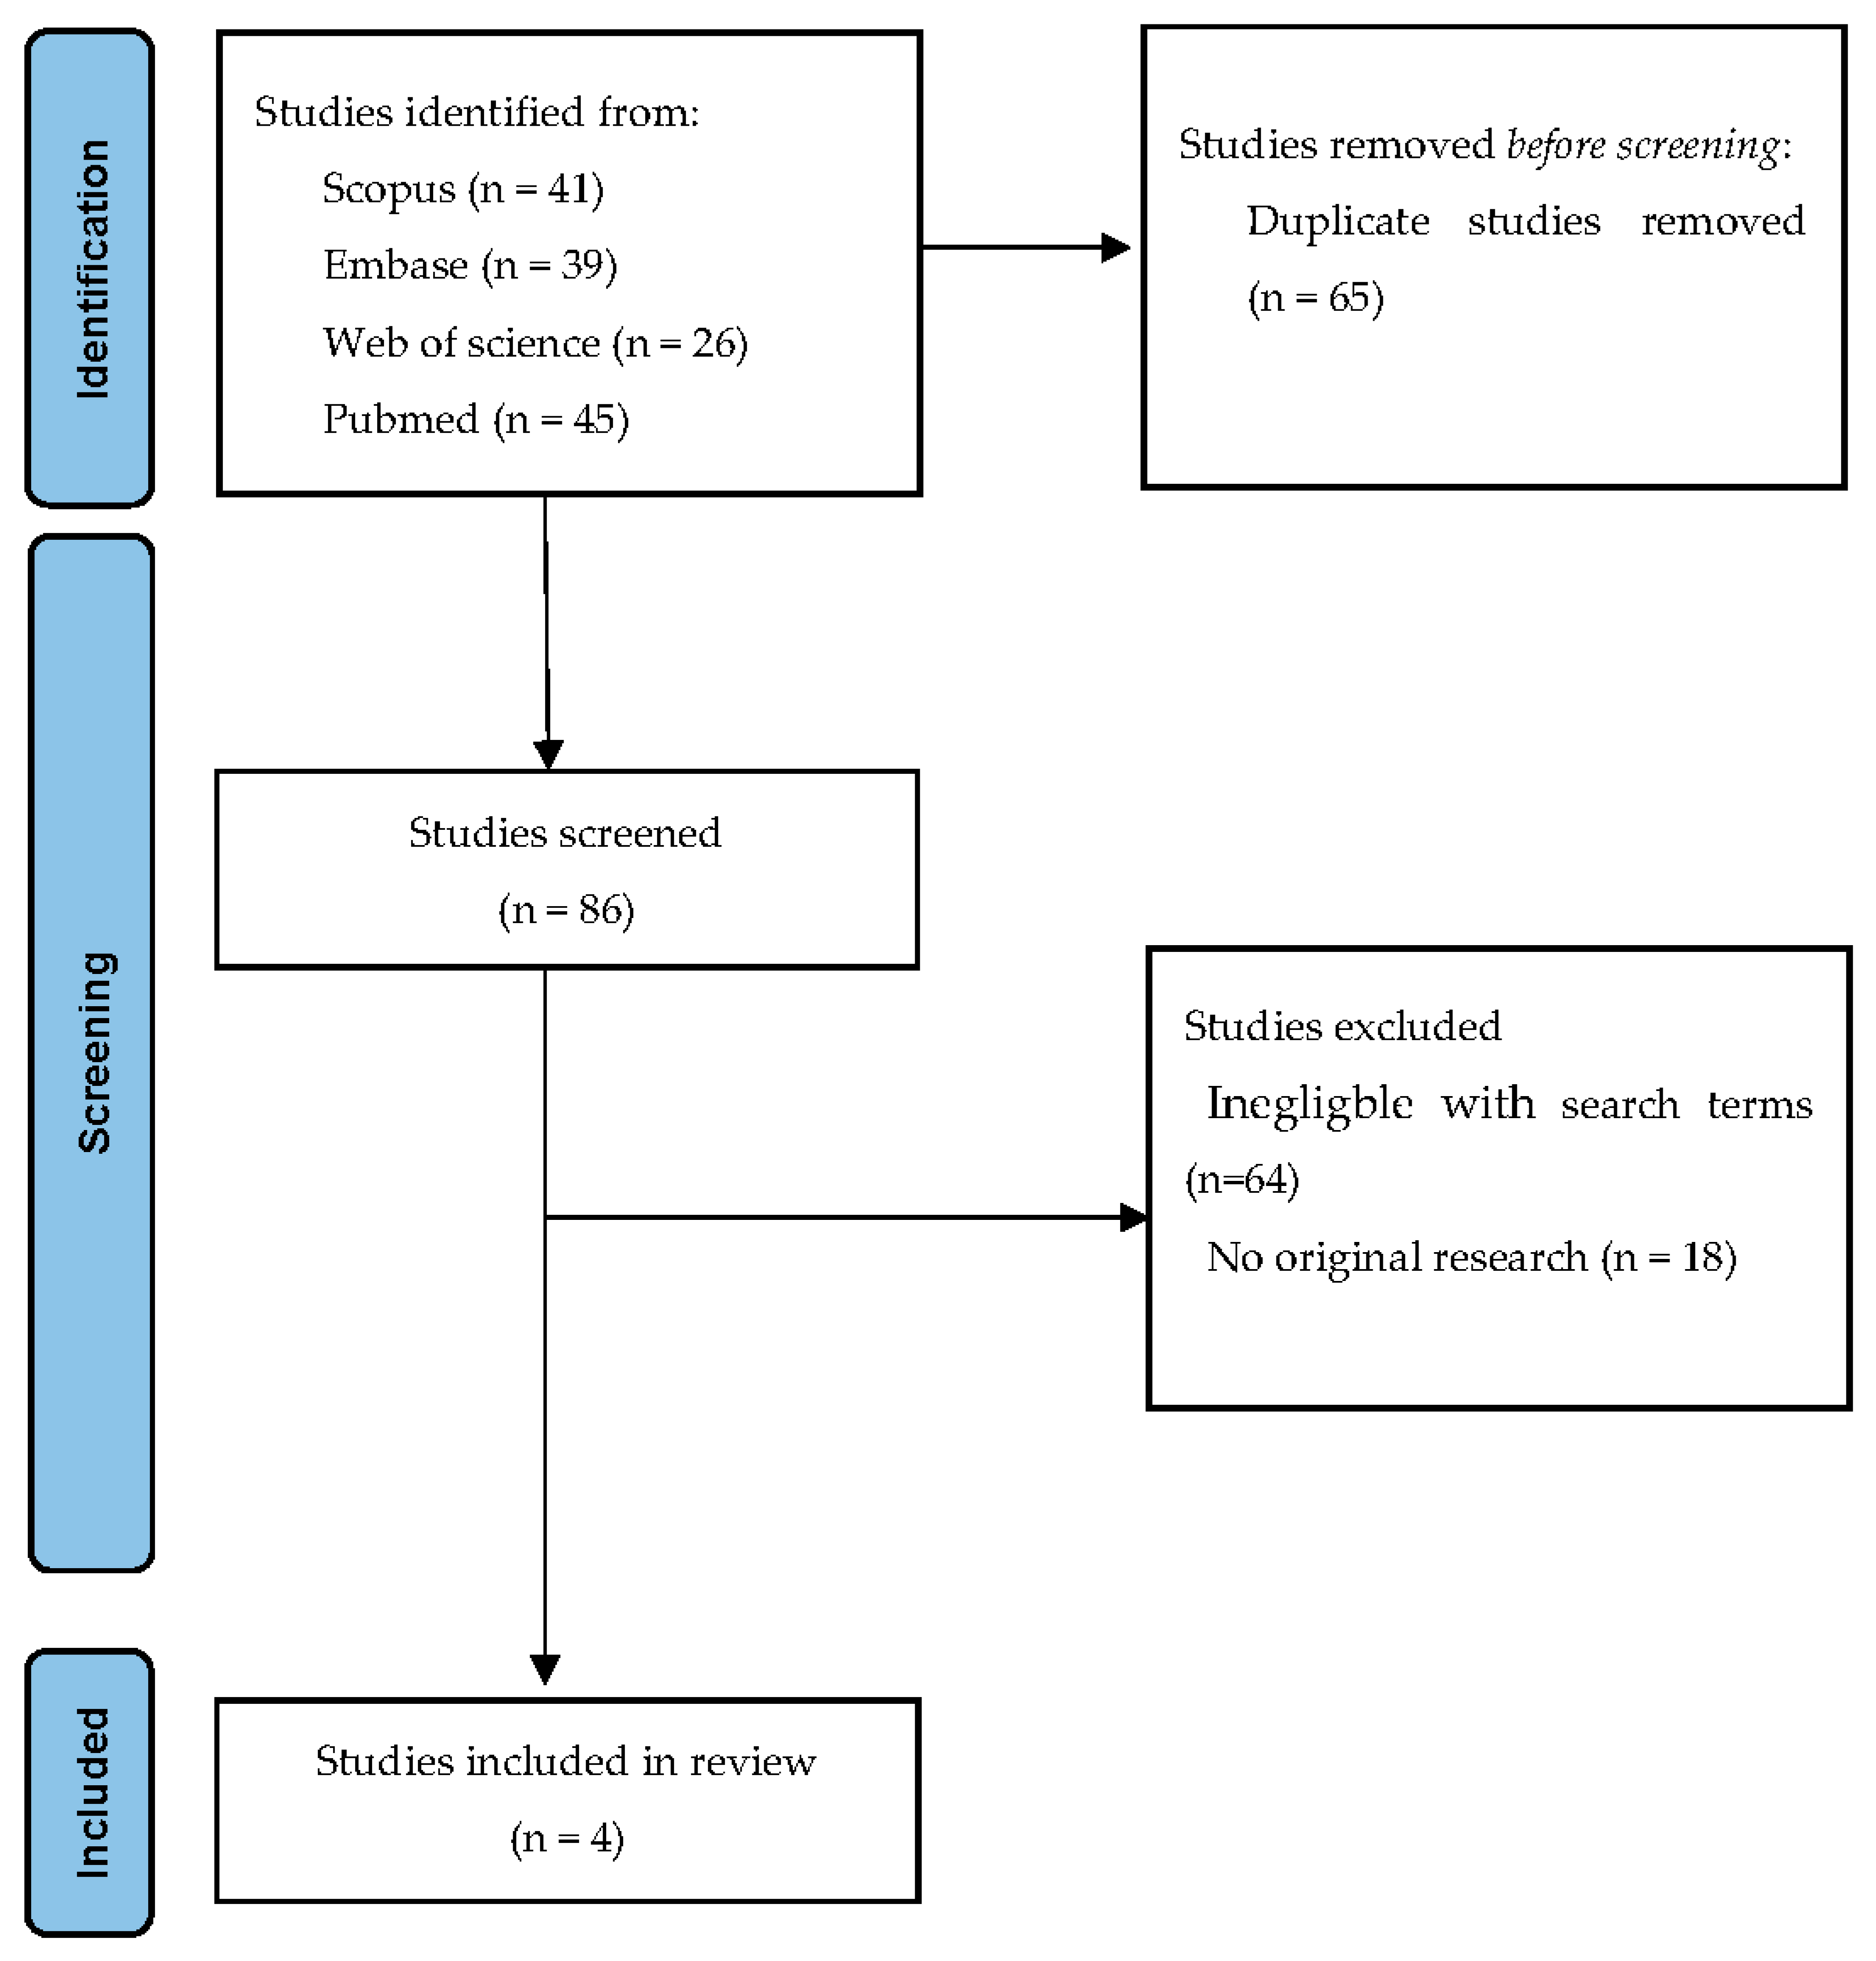
2.2. Search Strategy and Sources
2.3. Study Selection and Data Extraction
2.4. CLAIM
2.5. RQS
2.6. Data Analysis
3. Results
3.1. Description of Included Studies
3.2. Quality of Included Studies
4. Discussion
Author Contributions
Funding
Institutional Review Board Statement
Informed Consent Statement
Data Availability Statement
Conflicts of Interest
Appendix A

| Criteria | Points | |
|---|---|---|
| 1 | Image protocol quality—well-documented image protocols (for example, contrast, slice-thickness, energy, etc.) and/or usage of public image protocols allow reproducibility/replicability | +1 (if protocols are well-documented) +1 (if public protocol is used) |
| 2 | Multiple segmentations—possible actions are: segmentation by different physicians/algorithms/software, perturbing segmentations by (random) noise, segmentation at different breathing cycles. Analyze feature robustness to segmentation variabilities | +1 |
| 3 | Phantom study on all scanners—detect inter-scanner differences and vendor -dependent features. Analyze feature robustness to these sources of variability | +1 |
| 4 | Imaging at multiple time points—collect images of individuals at additional time points. Analyze feature robustness to temporal variabilities (for example, organ movement, organ expansion/shrinkage) | +1 |
| 5 | Feature reduction or adjustment for multiple testing—decreases the risk of overfitting. Overfitting is inevitable if the number of features exceeds the number of samples. Consider feature robustness when selecting features | −3 (if neither measure is implemented) +3 (if either measure is implemented) |
| 6 | Multivariable analysis with non radiomics features (for example, EGFR mutation)—is expected to provide a more holistic model. Permits correlating/inferencing between radiomics and non radiomics features | +1 |
| 7 | Detect and discuss biological correlates—demonstration of phenotypic differences (possibly associated with underlying gene-protein expression patterns) deepens understanding of radiomics and biology | +1 |
| 8 | Cut-off analyses—determine risk groups by either the median, a previously published cut-off or report a continuous risk variable. Reduces the risk of reporting overly optimistic results. | +1 |
| 9 | Discrimination statistics—report discrimination statistics (for example, C-statistic, ROC curve, AUC) and their statistical significance (for example, p-values, confidence intervals). One can also apply resampling methods (for example, bootstrapping, cross validation) | +1 (is a discrimination statistic and its statistical significance are reported) +1 (if a resampling method technique is also applied) |
| 10 | Calibration statistics—report calibration statistics (for example, Calibration-in-the-large/slope, calibration plots) and their statistical significance (for example, p-values, confidence intervals). One can also apply resampling methods (for example, bootstrapping, cross validation) | +1 (is a calibration statistic and its statistical significance are reported) +1 (if a resampling method technique is also applied) |
| 11 | Prospective study registered in a trial database— provides the highest level of evidence supporting the clinical validity and usefulness of the radiomics biomarker | +7 (for prospective validation of a radiomics signature in an appropriate trial) |
| 12 | Validation—the validation is performed without retraining and without adaption of the cut-off value, provides crucial information with regard to credible clinical performance | −5 (if validation is missing) + 2 (if validation is based on a dataset from the same institute) +3 (if validation if based on a dataset from another institute) +4 (if validation is based on two datasets from two distinct institutes) +4 (if the study validates a previously published signature) +5 (if validation is based on three or more datasets from distinct institutes) Datasets should be of comparable size and should have at least 10 events per model feature |
| 13 | Comparison to ’gold standard’—assess the extent to which the model agrees with/is superior to the current ’gold standard’ method (for example, TNM-staging for survival prediction). This comparison shows the added value of radiomics | +2 |
| 14 | Potential clinical utility—report on the current and potential application of the model in a clinical setting (for example decision curve analysis) | +2 |
| 15 | Cost-effectiveness analysis—report on the cost-effectiveness of the clinical application (for example, QALYs generated) | +1 |
| 16 | Open science and data—make code and data publicly available. Open science facilitates knowledge transfer and reproducibility of the study | +1 (if scans are open source) +1 (if region of interest segmentations are open source) +1 (if code is open source) +1 (if radiomics features are calculated on a set of representative ROIs and the calculated features and representative ROIs are open source) |
| Total points (36 = 100%) | ||
References
- Siegel, R.L.; Miller, K.D.; Fuchs, H.E.; Jemal, A. Cancer Statistics, 2021. CA Cancer J. Clin. 2021, 71, 7–33. [Google Scholar] [CrossRef] [PubMed]
- Weinreb, J.C.; Barentsz, J.O.; Choyke, P.L.; Cornud, F.; Haider, M.A.; Macura, K.J.; Margolis, D.; Schnall, M.D.; Shtern, F.; Tempany, C.M.; et al. PI-RADS Prostate Imaging-Reporting and Data System: 2015, Version 2. Eur. Urol. 2016, 69, 16–40. [Google Scholar] [CrossRef] [PubMed]
- Greer, M.D.; Brown, A.M.; Shih, J.H.; Summers, R.M.; Marko, J.; Law, Y.M.; Sankineni, S.; George, A.K.; Merino, M.J.; Pinto, P.A.; et al. Accuracy and agreement of PIRADSv2 for prostate cancer mpMRI: A multireader study. J. Magn. Reson. Imaging 2017, 45, 579–585. [Google Scholar] [CrossRef] [PubMed]
- Turkbey, B.; Rosenkrantz, A.B.; Haider, M.A.; Padhani, A.R.; Margolis, D.J.; Thoeny, H.C.; Verma, S.; Barentsz, J.; Weinreb, J.C. Prostate Imaging Reporting and Data System Version 2.1: 2019 Update of Prostate Imaging Reporting and Data System Version 2. Eur. Urol. 2019, 232, 340–351. [Google Scholar] [CrossRef]
- Litjens, G.J.S.; Barentsz, J.O.; Karssemeijer, N.; Huisman, H.J. Clinical evaluation of a computer-aided diagnosis system for determining cancer aggressiveness in prostate MRI. Eur. Radiol. 2015, 25, 3187–3199. [Google Scholar] [CrossRef] [Green Version]
- Bi, W.L.; Hosny, A.; Schabath, M.B.; Giger, M.L.; Birkbak, N.J.; Mehrtash, A.; Allison, T.; Arnaout, O.; Abbosh, C.; Dunn, I.F.; et al. Artificial intelligence in cancer imaging: Clinical challenges and applications. CA Cancer J. Clin. 2019, 69, 127–157. [Google Scholar] [CrossRef] [Green Version]
- Cochetti, G.; Rossi de Vermandois, J.A.; Maulà, V.; Giulietti, M.; Cecati, M.; Del Zingaro, M.; Cagnani, R.; Suvieri, C.; Paladini, A.; Mearini, E. Role of miRNAs in prostate cancer: Do we really know everything? Urol. Oncol. Semin. Orig. Investig. 2020, 38, 623–635. [Google Scholar] [CrossRef]
- Aerts, H.J.W.L.; Velazquez, E.R.; Leijenaar, R.T.H.; Parmar, C.; Grossmann, P.; Cavalho, S.; Bussink, J.; Monshouwer, R.; Haibe-Kains, B.; Rietveld, D.; et al. Decoding tumour phenotype by noninvasive imaging using a quantitative radiomics approach. Nat. Commun. 2014, 5, 4006. [Google Scholar] [CrossRef]
- Sugano, D.; Sanford, D.; Abreu, A.; Duddalwar, V.; Gill, I.; Cacciamani, G.E. Impact of radiomics on prostate cancer detection: A systematic review of clinical applications. Curr. Opin. Urol. 2020, 30, 754–781. [Google Scholar] [CrossRef]
- Bleker, J.; Yakar, D.; van Noort, B.; Rouw, D.; de Jong, I.J.; Dierckx, R.A.J.O.; Kwee, T.C.; Huisman, H. Single-center versus multi-center biparametric MRI radiomics approach for clinically significant peripheral zone prostate cancer. Insights Imaging 2021, 12, 150. [Google Scholar] [CrossRef]
- Ibrahim, A.; Primakov, S.; Beuque, M.; Woodruff, H.C.; Halilaj, I.; Wu, G.; Refaee, T.; Granzier, R.; Widaatalla, Y.; Hustinx, R.; et al. Radiomics for precision medicine: Current challenges, future prospects, and the proposal of a new framework. Methods 2021, 188, 20–29. [Google Scholar] [CrossRef] [PubMed]
- Schwier, M.; van Griethuysen, J.; Vangel, M.G.; Pieper, S.; Peled, S.; Tempany, C.; Aerts, H.J.W.L.; Kikinis, R.; Fennessy, F.M.; Fedorov, A. Repeatability of Multiparametric Prostate MRI Radiomics Features. Sci. Rep. 2019, 9, 9441. [Google Scholar] [CrossRef] [PubMed]
- Zwanenburg, A. The Image Biomarker Standardization Initiative: Standardized Quantitative Radiomics for High-Throughput. Radiology 2020, 295, 1–11. [Google Scholar] [CrossRef] [PubMed] [Green Version]
- Mongan, J.; Moy, L.; Kahn, C.E. Checklist for Artificial Intelligence in Medical Imaging (CLAIM): A Guide for Authors and Reviewers. Radiol. Artif. Intell. 2020, 2, e200029. [Google Scholar] [CrossRef] [Green Version]
- Lambin, P.; Leijenaar, R.T.H.; Deist, T.M.; Peerlings, J.; De Jong, E.E.C.; Van Timmeren, J.; Sanduleanu, S.; Larue, R.T.H.M.; Even, A.J.G.; Jochems, A.; et al. Radiomics: The bridge between medical imaging and personalized medicine. Nat. Rev. Clin. Oncol. 2017, 14, 749–762. [Google Scholar] [CrossRef]
- Castillo, J.M.T.; Starmans, M.P.A.; Arif, M.; Niessen, W.J.; Klein, S.; Bangma, C.H.; Schoots, I.G.; Veenland, J.F. A multi-center, multi-vendor study to evaluate the generalizability of a radiomics model for classifying prostate cancer: High grade vs. low grade. Diagnostics 2021, 11, 369. [Google Scholar] [CrossRef]
- Chaddad, A.; Kucharczyk, M.J.; Cheddad, A.; Clarke, S.E.; Hassan, L.; Ding, S.; Rathore, S.; Zhang, M.; Katib, Y.; Bahoric, B.; et al. Magnetic resonance imaging based radiomic models of prostate cancer: A narrative review. Cancers 2021, 13, 552. [Google Scholar] [CrossRef]
- Stanzione, A.; Gambardella, M.; Cuocolo, R.; Ponsiglione, A.; Romeo, V.; Imbriaco, M. Prostate MRI radiomics: A systematic review and radiomic quality score assessment. Eur. J. Radiol. 2020, 129, 109095. [Google Scholar] [CrossRef]
- Parmar, C.; Barry, J.D.; Hosny, A.; Quackenbush, J.; Aerts, H.J.W.L. Data Analysis Strategies in Medical Imaging. Clin. Cancer Res. 2018, 24, 3492–3499. [Google Scholar] [CrossRef] [Green Version]
- Castillo, T.J.M.; Arif, M.; Starmans, M.P.A.; Niessen, W.J.; Bangma, C.H.; Schoots, I.G.; Veenland, J.F. Classification of clinically significant prostate cancer on multi-parametric MRI: A validation study comparing deep learning and radiomics. Cancers 2022, 14, 12. [Google Scholar] [CrossRef]
- Lim, C.S.; Abreu-Gomez, J.; Thornhill, R.; James, N.; Al Kindi, A.; Lim, A.S.; Schieda, N. Utility of machine learning of apparent diffusion coefficient (ADC) and T2-weighted (T2W) radiomic features in PI-RADS version 2.1 category 3 lesions to predict prostate cancer diagnosis. Abdom. Radiol. 2021, 46, 5647–5658. [Google Scholar] [CrossRef] [PubMed]
- Montoya Perez, I.; Merisaari, H.; Jambor, I.; Ettala, O.; Taimen, P.; Knaapila, J.; Kekki, H.; Khan, F.L.; Syrjälä, E.; Steiner, A.; et al. Detection of Prostate Cancer Using Biparametric Prostate MRI, Radiomics, and Kallikreins: A Retrospective Multicenter Study of Men With a Clinical Suspicion of Prostate Cancer. J. Magn. Reson. Imaging 2022, 55, 465–477. [Google Scholar] [CrossRef] [PubMed]
- Ligero, M.; Jordi-Ollero, O.; Bernatowicz, K.; Garcia-Ruiz, A.; Delgado-Muñoz, E.; Leiva, D.; Mast, R.; Suarez, C.; Sala-Llonch, R.; Calvo, N.; et al. Minimizing acquisition-related radiomics variability by image resampling and batch effect correction to allow for large-scale data analysis. Eur. Radiol. 2021, 31, 1460–1470. [Google Scholar] [CrossRef] [PubMed]
- Da-Ano, R.; Visvikis, D.; Hatt, M. Harmonization strategies for multicenter radiomics investigations. Phys. Med. Biol. 2020, 65, 24TR02. [Google Scholar] [CrossRef] [PubMed]
- Abouelmehdi, K.; Beni-Hessane, A.; Khaloufi, H. Big healthcare data: Preserving security and privacy. J. Big Data 2018, 5, 1. [Google Scholar] [CrossRef] [Green Version]
- Wachter, R.M.; Cassel, C.K. Sharing Health Care Data With Digital Giants-Overcoming Obstacles and Reaping Benefits While Protecting Patients. JAMA-J. Am. Med. Assoc. 2020, 323, 507–508. [Google Scholar] [CrossRef] [PubMed]
- Hulsen, T. Sharing is caring—Data sharing initiatives in healthcare. Int. J. Environ. Res. Public Health 2020, 17, 3046. [Google Scholar] [CrossRef]
- Hulsen, T. An overview of publicly available patient-centered prostate cancer datasets. Transl. Androl. Urol. 2019, 8, S64–S77. [Google Scholar] [CrossRef]
- Orlhac, F.; Lecler, A.; Savatovski, J.; Goya-Outi, J.; Nioche, C.; Charbonneau, F.; Ayache, N.; Frouin, F.; Duron, L.; Buvat, I. How can we combat multicenter variability in MR radiomics? Validation of a correction procedure. Eur. Radiol. 2021, 31, 2272–2280. [Google Scholar] [CrossRef]
- Starmans, M.P.A.; van der Voort, S.R.; Phil, T.; Klein, S. Workflow for Optimal Radiomics Classification (WORC). 2022. Available online: https://github.com/MStarmans91/WORC (accessed on 1 February 2021).
- Litjens, G.; Debats, O.; Barentsz, J.; Karssemeijer, N.; Huisman, H. SPIE-AAPM PROSTATEx Challenge Data. In Cancer Imaging Archive. Available online: https://wiki.cancerimagingarchive.net/display/Public/SPIE-AAPM-NCI+PROSTATEx+Challenges (accessed on 1 January 2018).
- Wang, Y.; Tadimalla, S.; Rai, R.; Goodwin, J.; Foster, S.; Liney, G.; Holloway, L.; Haworth, A. Quantitative MRI: Defining repeatability, reproducibility and accuracy for prostate cancer imaging biomarker development. Magn. Reson. Imaging 2021, 77, 169–179. [Google Scholar] [CrossRef]
- Midiri, F.; Vernuccio, F.; Purpura, P.; Alongi, P.; Bartolotta, T.V. Multiparametric mri and radiomics in prostate cancer: A review of the current literature. Diagnostics 2021, 11, 1829. [Google Scholar] [CrossRef] [PubMed]
| Title/Abstract | ||
|---|---|---|
| 1 | Identification as a study of AI methodology, specifying the category of technology used (e.g., deep learning) | |
| 2 | Structured summary of study design, methods, results, and conclusions | |
| Introduction | ||
| 3 | Scientific and clinical background, including the intended use and clinical role of the AI approach | |
| 4 | Study objectives and hypotheses | |
| Methods | ||
| Study Design | 5 | Prospective or retrospective study |
| 6 | Study goal, such as model creation, exploratory study, feasibility study, non-inferiority trial | |
| Data | 7 | Data sources |
| 8 | Eligibility criteria: how, where, and when potentially eligible participants or studies were identified (e.g., symptoms, results from previous tests, inclusion in registry, patient-care setting, location, dates) | |
| 9 | Data pre-processing steps | |
| 10 | Selection of data subsets, if applicable | |
| 11 | Definitions of data elements, with references to Common Data Elements | |
| 12 | De-identification methods | |
| 13 | How missing data were handled | |
| Ground Truth | 14 | Definition of ground truth reference standard, in sufficient detail to allow replication |
| 15 | Rationale for choosing the reference standard (if alternatives exist) | |
| 16 | Source of ground-truth annotations; qualifications and preparation of annotators | |
| 17 | Annotation tools | |
| 18 | Measurement of inter- and intrarater variability; methods to mitigate variability and/or resolve discrepancies | |
| Data Partitions | 19 | Intended sample size and how it was determined |
| 20 | How data were assigned to partitions; specify proportions | |
| 21 | Level at which partitions are disjoint (e.g., image, study, patient, institution) | |
| Model | 22 | Detailed description of model, including inputs, outputs, all intermediate layers and connections |
| 23 | Software libraries, frameworks, and packages | |
| 24 | Initialization of model parameters (e.g., randomization, transfer learning) | |
| Training | 25 | Details of training approach, including data augmentation, hyperparameters, number of models trained |
| 26 | Method of selecting the final model | |
| 27 | Ensembling techniques, if applicable | |
| Evaluation | 28 | Metrics of model performance |
| 29 | Statistical measures of significance and uncertainty (e.g., confidence intervals) | |
| 30 | Robustness or sensitivity analysis | |
| 31 | Methods for explainability or interpretability (e.g., saliency maps), and how they were validated | |
| 32 | Validation or testing on external data | |
| Results | ||
| Data | 33 | Flow of participants or cases, using a diagram to indicate inclusion and exclusion |
| 34 | Demographic and clinical characteristics of cases in each partition | |
| Model performance | 35 | Performance metrics for optimal model(s) on all data partitions |
| 36 | Estimates of diagnostic accuracy and their precision (such as 95% confidence intervals) | |
| 37 | Failure analysis of incorrectly classified cases | |
| Discussion | ||
| 38 | Study limitations, including potential bias, statistical uncertainty, and generalizability | |
| 39 | Implications for practice, including the intended use and/or clinical role | |
| Other information | ||
| 40 | Registration number and name of registry | |
| 41 | Where the full study protocol can be accessed | |
| 42 | Sources of funding and other support; role of funders |
| Domain | Item | Bleker et al. [10] | Castillo et al. [20] | Lim et al. [21] | Montoya Perez et al. [22] |
|---|---|---|---|---|---|
| Title/Abstract | |||||
| 1 | 0 | 0 | 1 | 0 | |
| 2 | 1 | 1 | 1 | 1 | |
| Introduction | |||||
| 3 | 1 | 1 | 1 | 1 | |
| 4 | 1 | 0 | 0 | 0 | |
| Methods | |||||
| Study Design | 5 | 1 | 1 | 1 | 1 |
| 6 | 1 | 1 | 1 | 1 | |
| Data | 7 | 1 | 1 | 1 | 1 |
| 8 | 1 | 1 | 1 | 0 | |
| 9 | 0 | 0 | 0 | 0 | |
| 10 | N/A | N/A | N/A | N/A | |
| 11 | 1 | 1 | 1 | 1 | |
| 12 | 0 | 0 | 0 | 0 | |
| 13 | 0 | 1 | 0 | 1 | |
| Ground Truth | 14 | 1 | 1 | 1 | 1 |
| 15 | 1 | 1 | 1 | 1 | |
| 16 | 1 | 0 | 1 | 1 | |
| 17 | N/A | 0 | 1 | 1 | |
| 18 | N/A | N/A | 0 | N/A | |
| Data Partitions | 19 | 1 | 1 | 1 | 1 |
| 20 | 1 | 1 | 0 | 1 | |
| 21 | 1 | 1 | 1 | 1 | |
| Model | 22 | 1 | 1 | 1 | 1 |
| 23 | 0 | 1 | 1 | 0 | |
| 24 | 1 | 1 | 1 | 1 | |
| Training | 25 | 1 | 1 | 1 | 1 |
| 26 | 1 | 1 | 1 | 1 | |
| 27 | N/A | 1 | N/A | N/A | |
| Evaluation | 28 | 1 | 1 | 1 | 1 |
| 29 | 1 | 0 | 1 | 1 | |
| 30 | 1 | 1 | 1 | 0 | |
| 31 | 1 | 1 | 0 | 1 | |
| 32 | 1 | 1 | 1 | 1 | |
| Results | |||||
| Data | 33 | 1 | 1 | 1 | 1 |
| 34 | 0 | 0 | 1 | 1 | |
| Model performance | 35 | 1 | 1 | 0 | 1 |
| 36 | 1 | 1 | 1 | 1 | |
| 37 | 1 | 0 | 0 | 0 | |
| Discussion | |||||
| 38 | 1 | 1 | 1 | 1 | |
| 39 | 0 | 0 | 0 | 0 | |
| Other information | |||||
| 40 | N/A | N/A | N/A | N/A | |
| 41 | N/A | N/A | N/A | N/A | |
| 42 | 1 | 0 | 1 | 1 | |
| Total score percentage | 80.6 (29/36) | 71.1 (27/38) | 71.1 (27/38) | 75.7(28/37) |
| RQS | Bleker et al. [10] | Castillo et al. [20] | Lim et al. [21] | Montoya Perez et al. [22] |
|---|---|---|---|---|
| Image Protocol Quality | 2 | 2 | 2 | 1 |
| Multiple segmentations | 1 | 1 | 1 | 0 |
| Phantom Study on all scanners | 0 | 0 | 0 | 0 |
| Imaging at multiple time points | 0 | 0 | 0 | 0 |
| Feature reduction or adjustment feature reduction or adjustment for multiple testing | 3 | 3 | 3 | 3 |
| Multivariable analysis with non radiomics features | 0 | 0 | 0 | 1 |
| Detect and discuss biological correlates | 0 | 0 | 0 | 1 |
| Cut-off analyses | 0 | 0 | 0 | 0 |
| Discrimination statistics | 2 | 2 | 2 | 2 |
| Calibration statistics | 1 | 1 | 1 | 1 |
| Prospective study registered in a trial database | 0 | 0 | 0 | 0 |
| Validation | 5 | 5 | 3 | 3 |
| Comparison to ‘gold standard’ | 2 | 2 | 2 | 2 |
| Potential clinical utility | 2 | 2 | 2 | 2 |
| Cost-effectiveness analysis | 0 | 0 | 0 | 0 |
| Open science and data | 2 | 3 | 0 | 3 |
| Total score percentage | 55.6 (20/36) | 58.3 (21/36) | 44.4 (16/36) | 52.8 (19/36) |
Publisher’s Note: MDPI stays neutral with regard to jurisdictional claims in published maps and institutional affiliations. |
© 2022 by the authors. Licensee MDPI, Basel, Switzerland. This article is an open access article distributed under the terms and conditions of the Creative Commons Attribution (CC BY) license (https://creativecommons.org/licenses/by/4.0/).
Share and Cite
Bleker, J.; Kwee, T.C.; Yakar, D. Quality of Multicenter Studies Using MRI Radiomics for Diagnosing Clinically Significant Prostate Cancer: A Systematic Review. Life 2022, 12, 946. https://doi.org/10.3390/life12070946
Bleker J, Kwee TC, Yakar D. Quality of Multicenter Studies Using MRI Radiomics for Diagnosing Clinically Significant Prostate Cancer: A Systematic Review. Life. 2022; 12(7):946. https://doi.org/10.3390/life12070946
Chicago/Turabian StyleBleker, Jeroen, Thomas C. Kwee, and Derya Yakar. 2022. "Quality of Multicenter Studies Using MRI Radiomics for Diagnosing Clinically Significant Prostate Cancer: A Systematic Review" Life 12, no. 7: 946. https://doi.org/10.3390/life12070946
APA StyleBleker, J., Kwee, T. C., & Yakar, D. (2022). Quality of Multicenter Studies Using MRI Radiomics for Diagnosing Clinically Significant Prostate Cancer: A Systematic Review. Life, 12(7), 946. https://doi.org/10.3390/life12070946