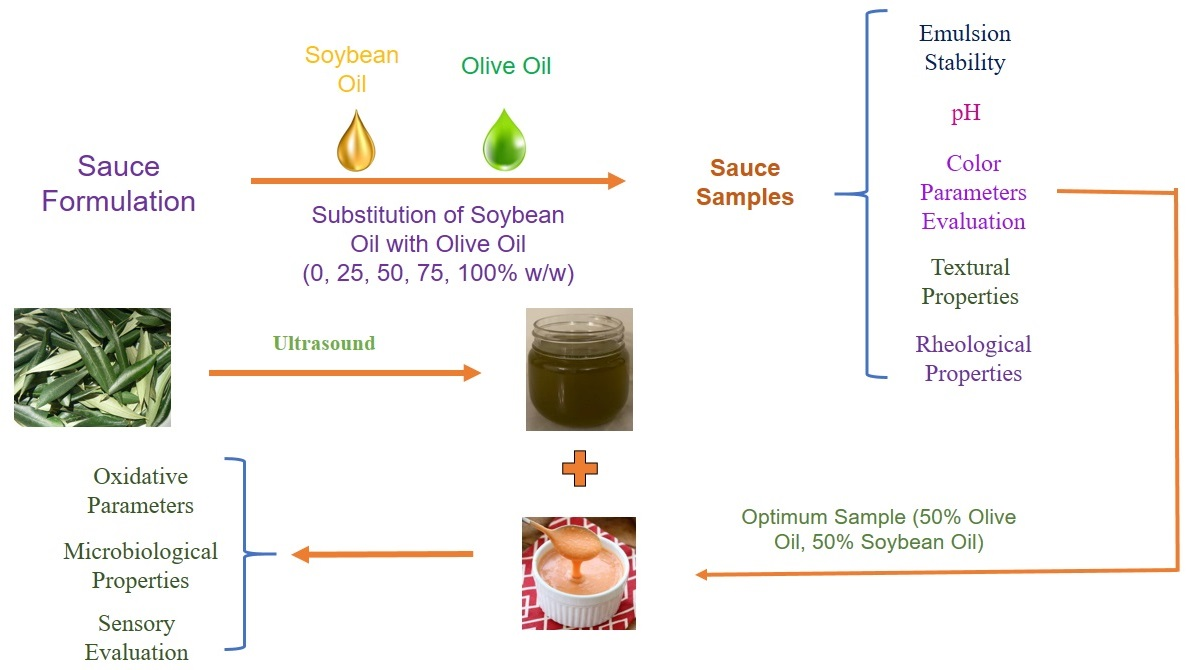
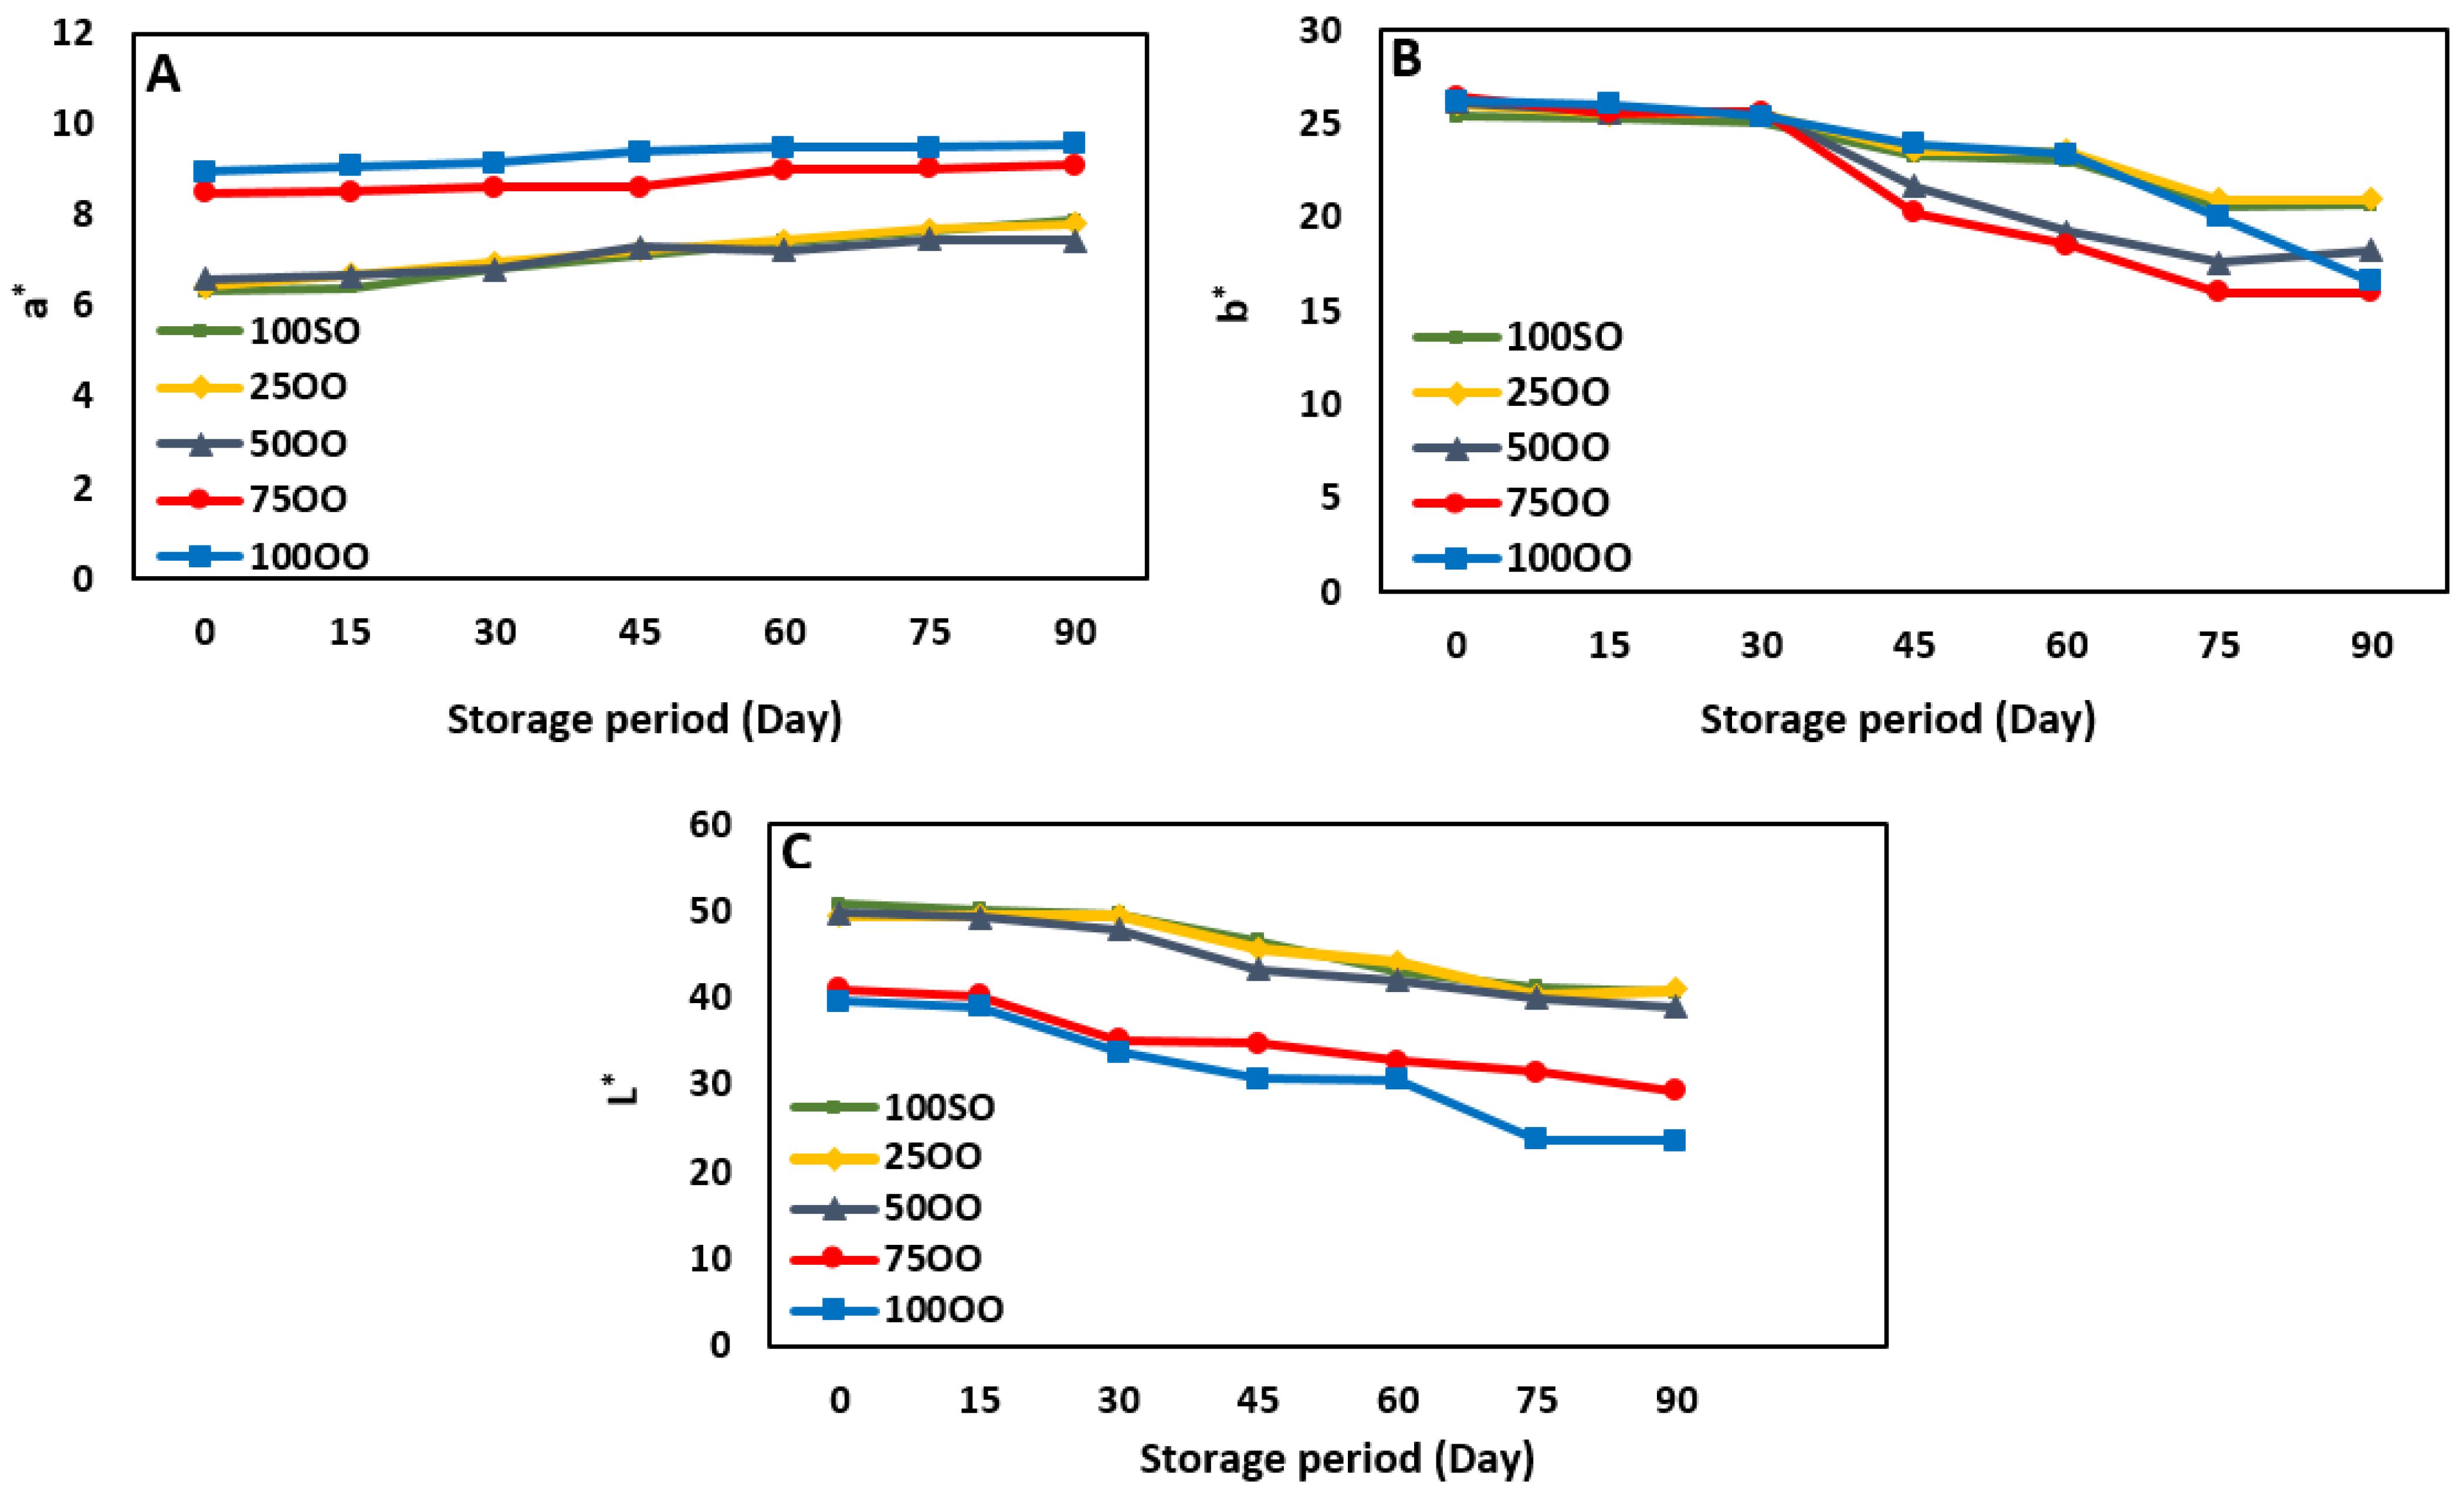
Figure 1.
Color parameter ((A): a*: redness, (B): b*: yellowness, and (C): L*: lightness) changes in French sauce samples prepared with different blends of olive and soybean oil (100SO: samples with 100% soybean oil, 25OO: samples with 75% soybean oil and 25% olive oil, 50OO: samples with 50% soybean oil and 50% olive oil, 75OO: samples with 24% soybean oil and 75% olive oil, and 100OO: samples with 100% olive oil).
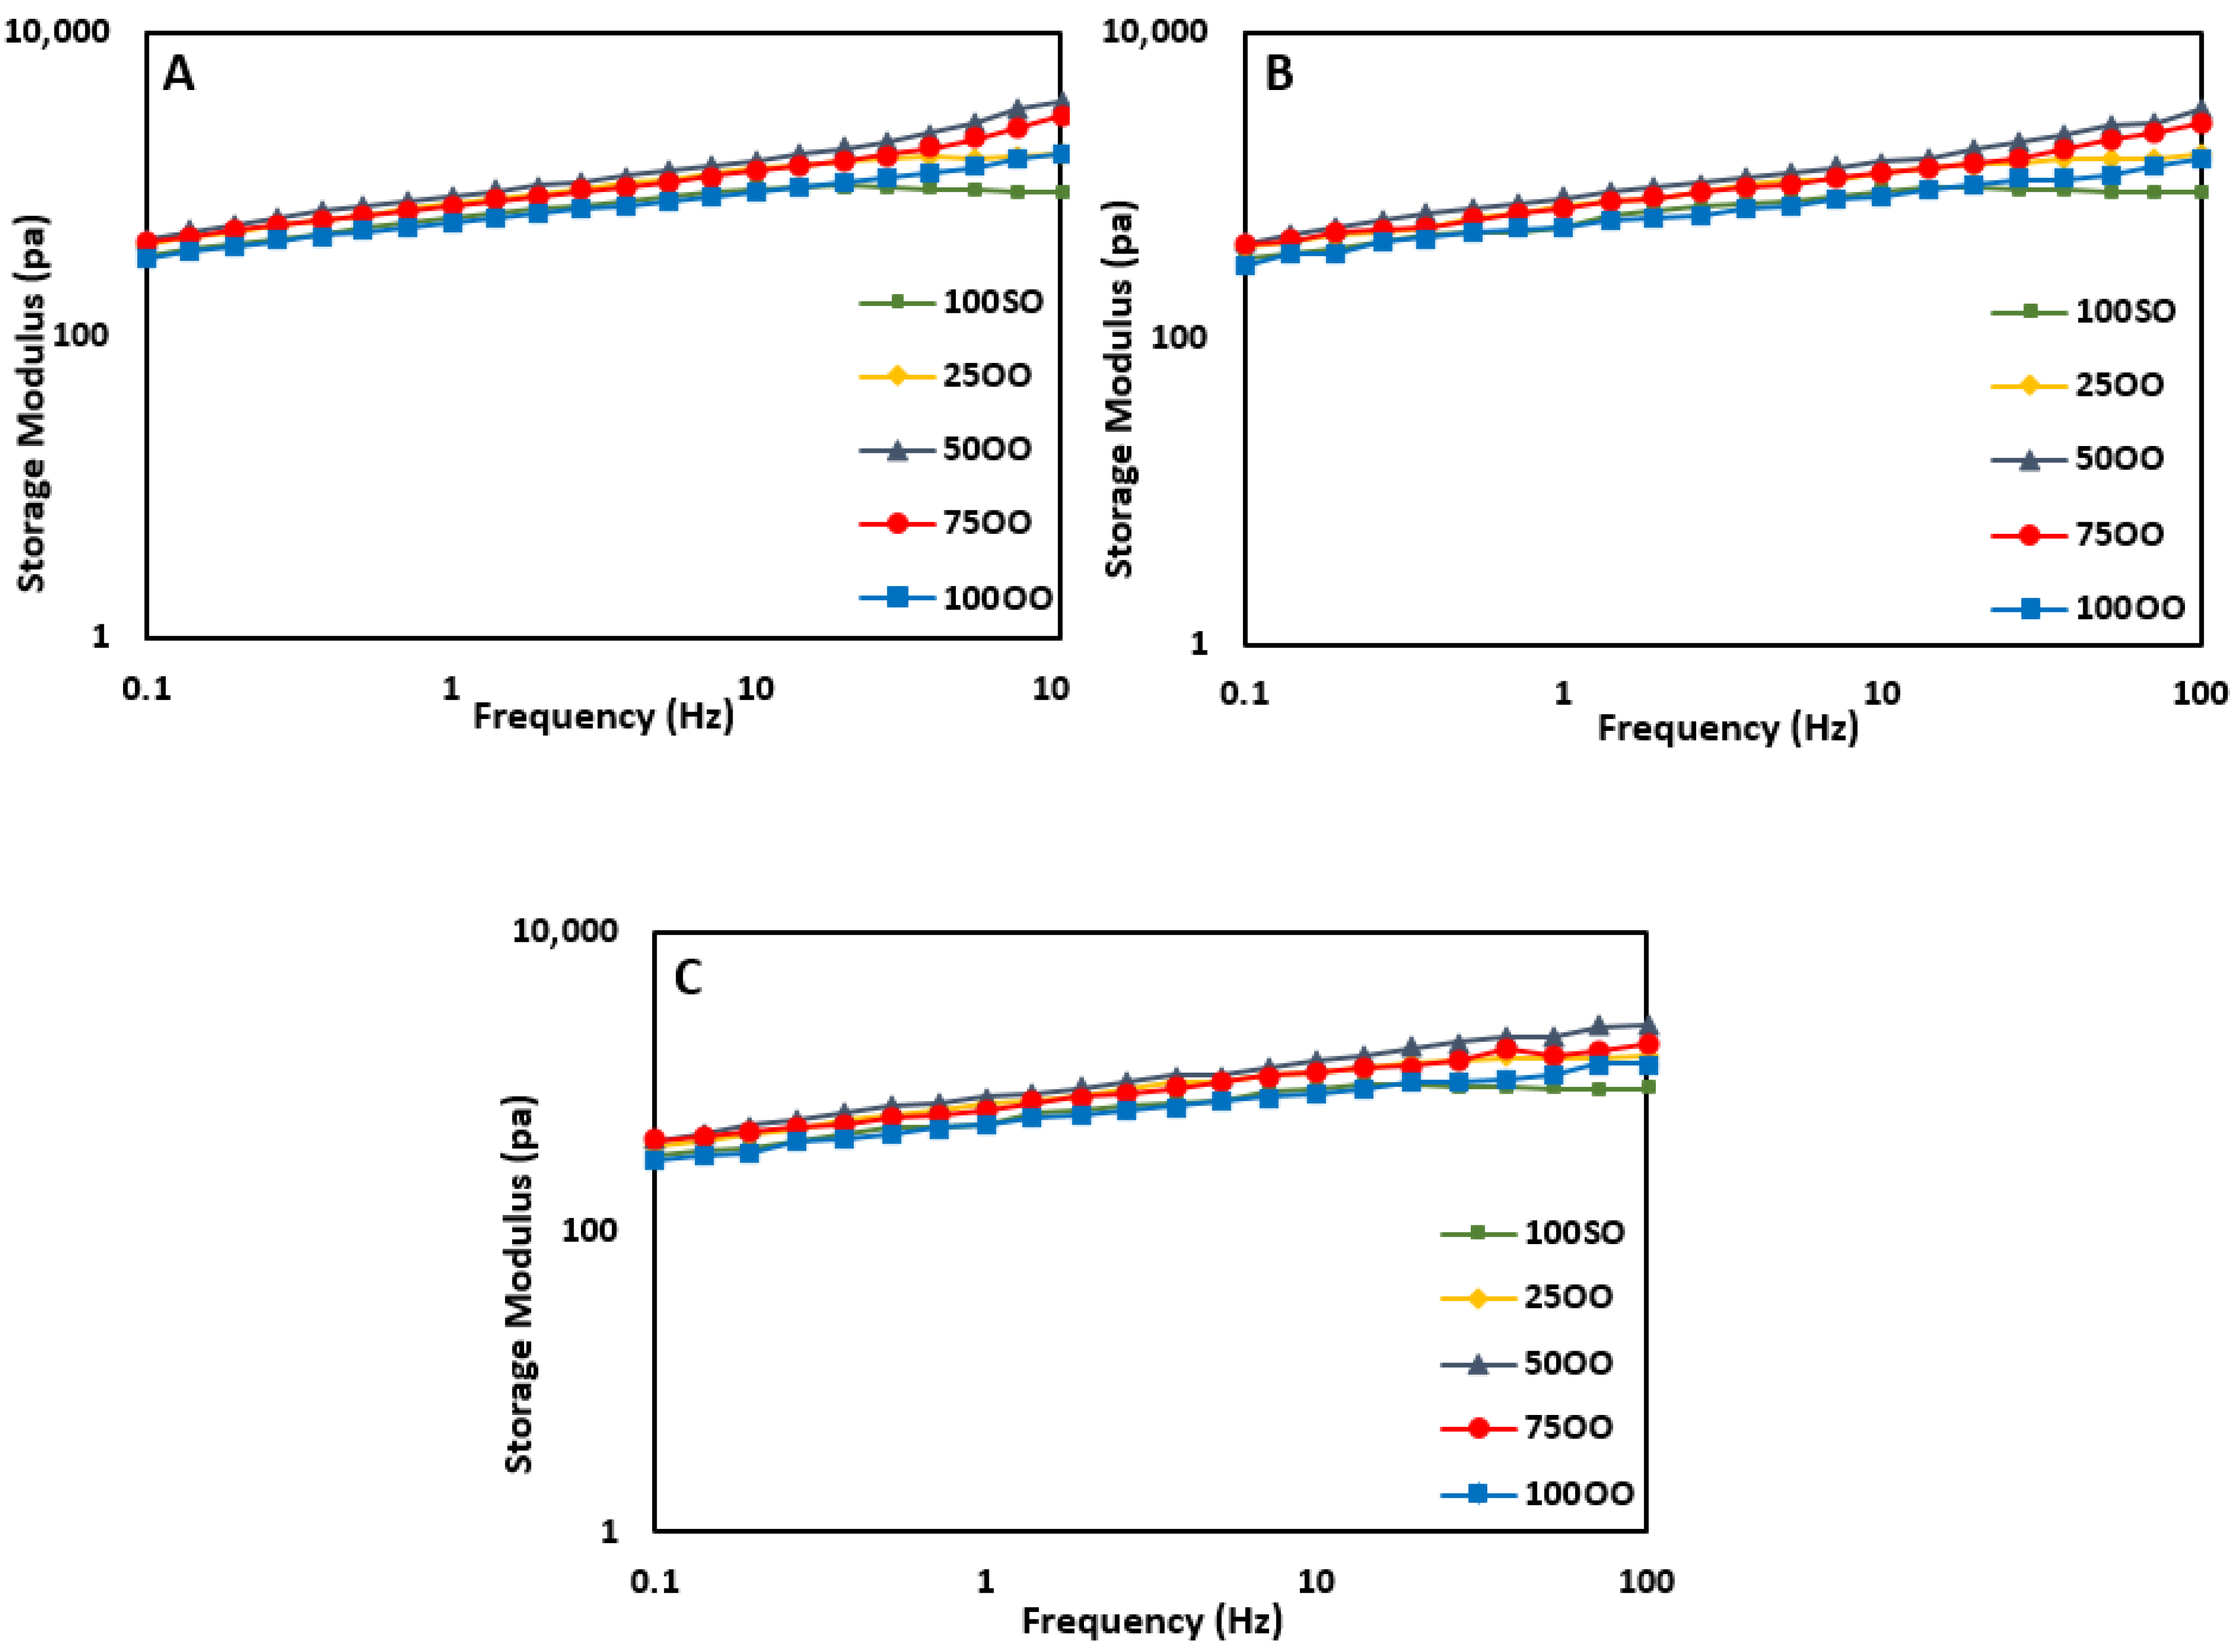
Figure 2.
Storage modulus (G’) of French sauce samples prepared with different blends of olive/soybean oil ((A): Day 0, (B): Day 45, and (C): Day 90 of storage). 100SO: samples with 100% soybean oil, 25OO: samples with 75% soybean oil and 25% olive oil, 50OO: samples with 50% soybean oil and 50% olive oil, 75OO: samples with 25% soybean oil and 75% olive oil, and 100OO: samples with 100% olive oil.
Figure 3.
Loss modulus (G’’) of French sauce samples prepared with different blends of olive/soybean oil ((A): Day 0, (B): Day 45, and (C): day 90 of storage) (100SO: samples with 100% soybean oil, 25OO: samples with 75% soybean oil and 25% olive oil, 50OO: samples with 50% soybean oil and 50% olive oil, 75OO: samples with 25% soybean oil and 75% olive oil, and 100OO: samples with 100% olive oil).
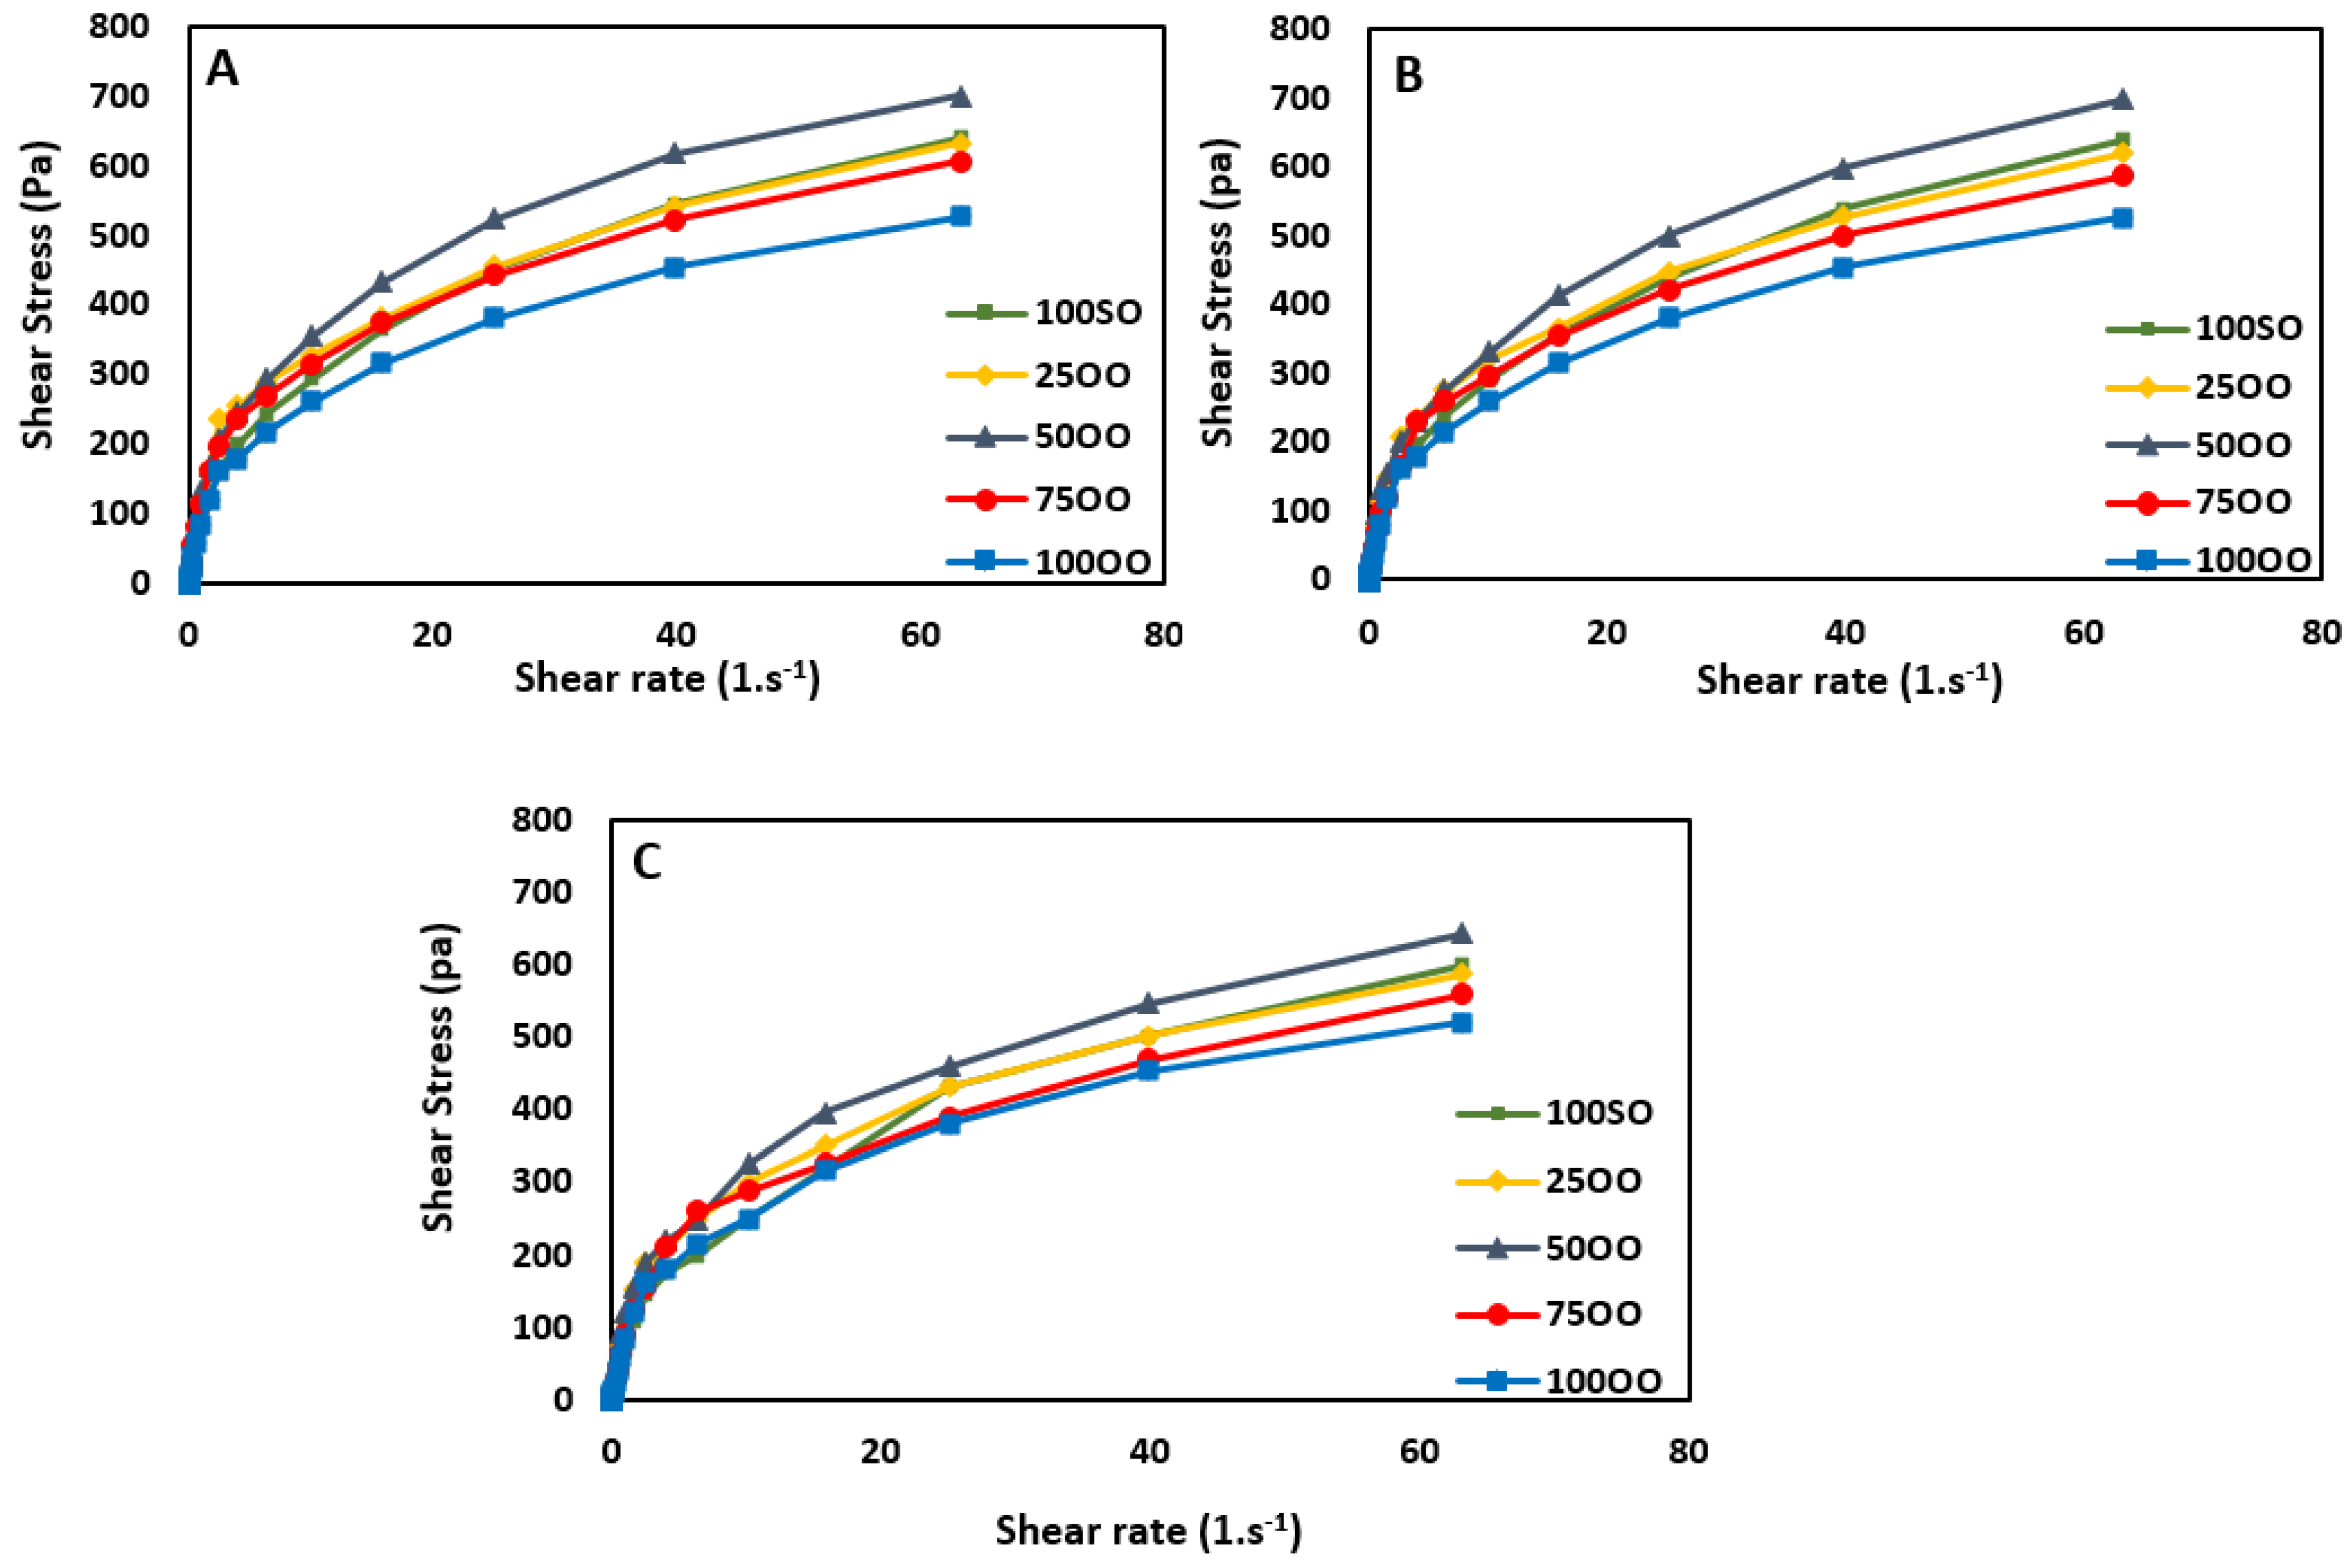
Figure 4.
Flow curves of French sauce samples prepared with different blends of olive/soybean oil (A): Day 0, (B): Day 45, and (C): Day 90 of storage (100SO: samples with 100% soybean oil, 25OO: samples with 75% soybean oil and 25% olive oil, 50OO: samples with 50% soybean oil and 50% olive oil, 75OO: samples with 25% soybean oil and 75% olive oil, and 100OO: samples with 100% olive oil).
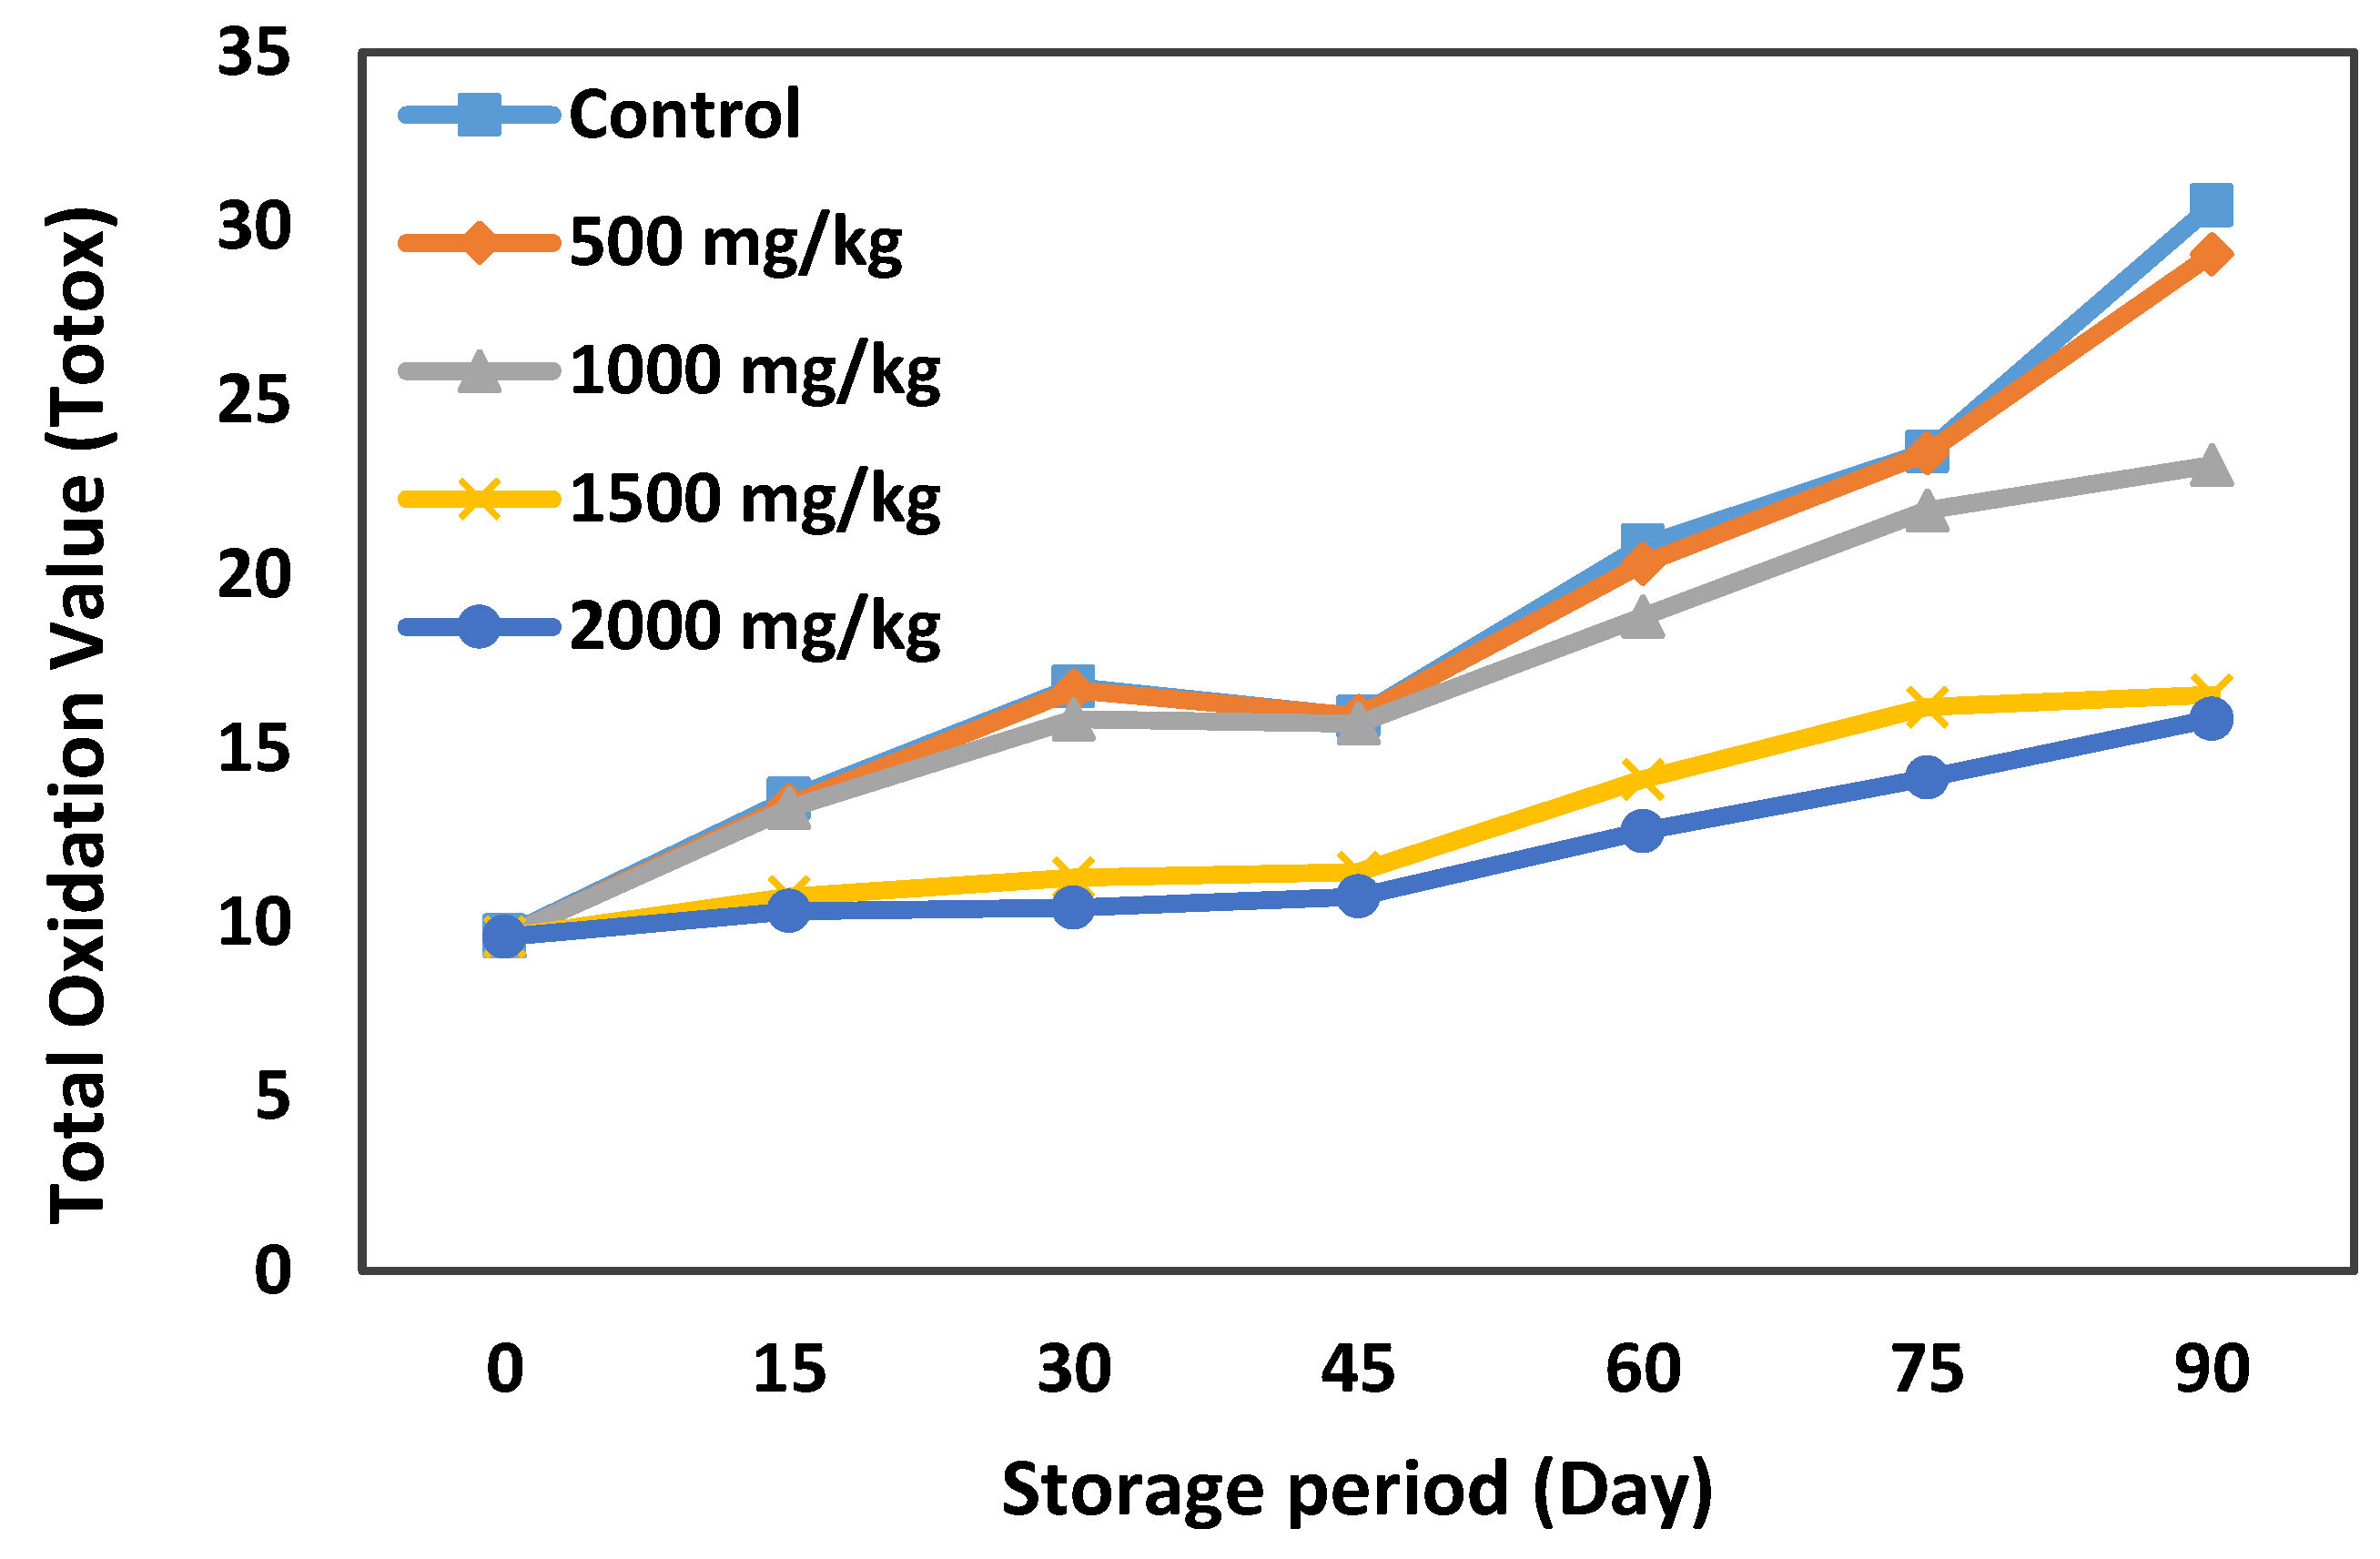
Figure 5.
Changes in the totox value of French sauce samples enriched by different levels of olive leaf extract (OLE) (up to 2000 mg/kg) during 90 days of storage.
Figure 5.
Changes in the totox value of French sauce samples enriched by different levels of olive leaf extract (OLE) (up to 2000 mg/kg) during 90 days of storage.
Figure 6.
Total plate counts of mesophilic aerobic bacteria of sauce samples (FS-OLE: samples with 2000 mg/kg OLE and no commercial preservatives; FS: Samples with commercial preservatives, sodium benzoate, 0.063% (w/w), and potassium sorbate, 0.012% (w/w), without the addition of OLE).
Figure 6.
Total plate counts of mesophilic aerobic bacteria of sauce samples (FS-OLE: samples with 2000 mg/kg OLE and no commercial preservatives; FS: Samples with commercial preservatives, sodium benzoate, 0.063% (w/w), and potassium sorbate, 0.012% (w/w), without the addition of OLE).
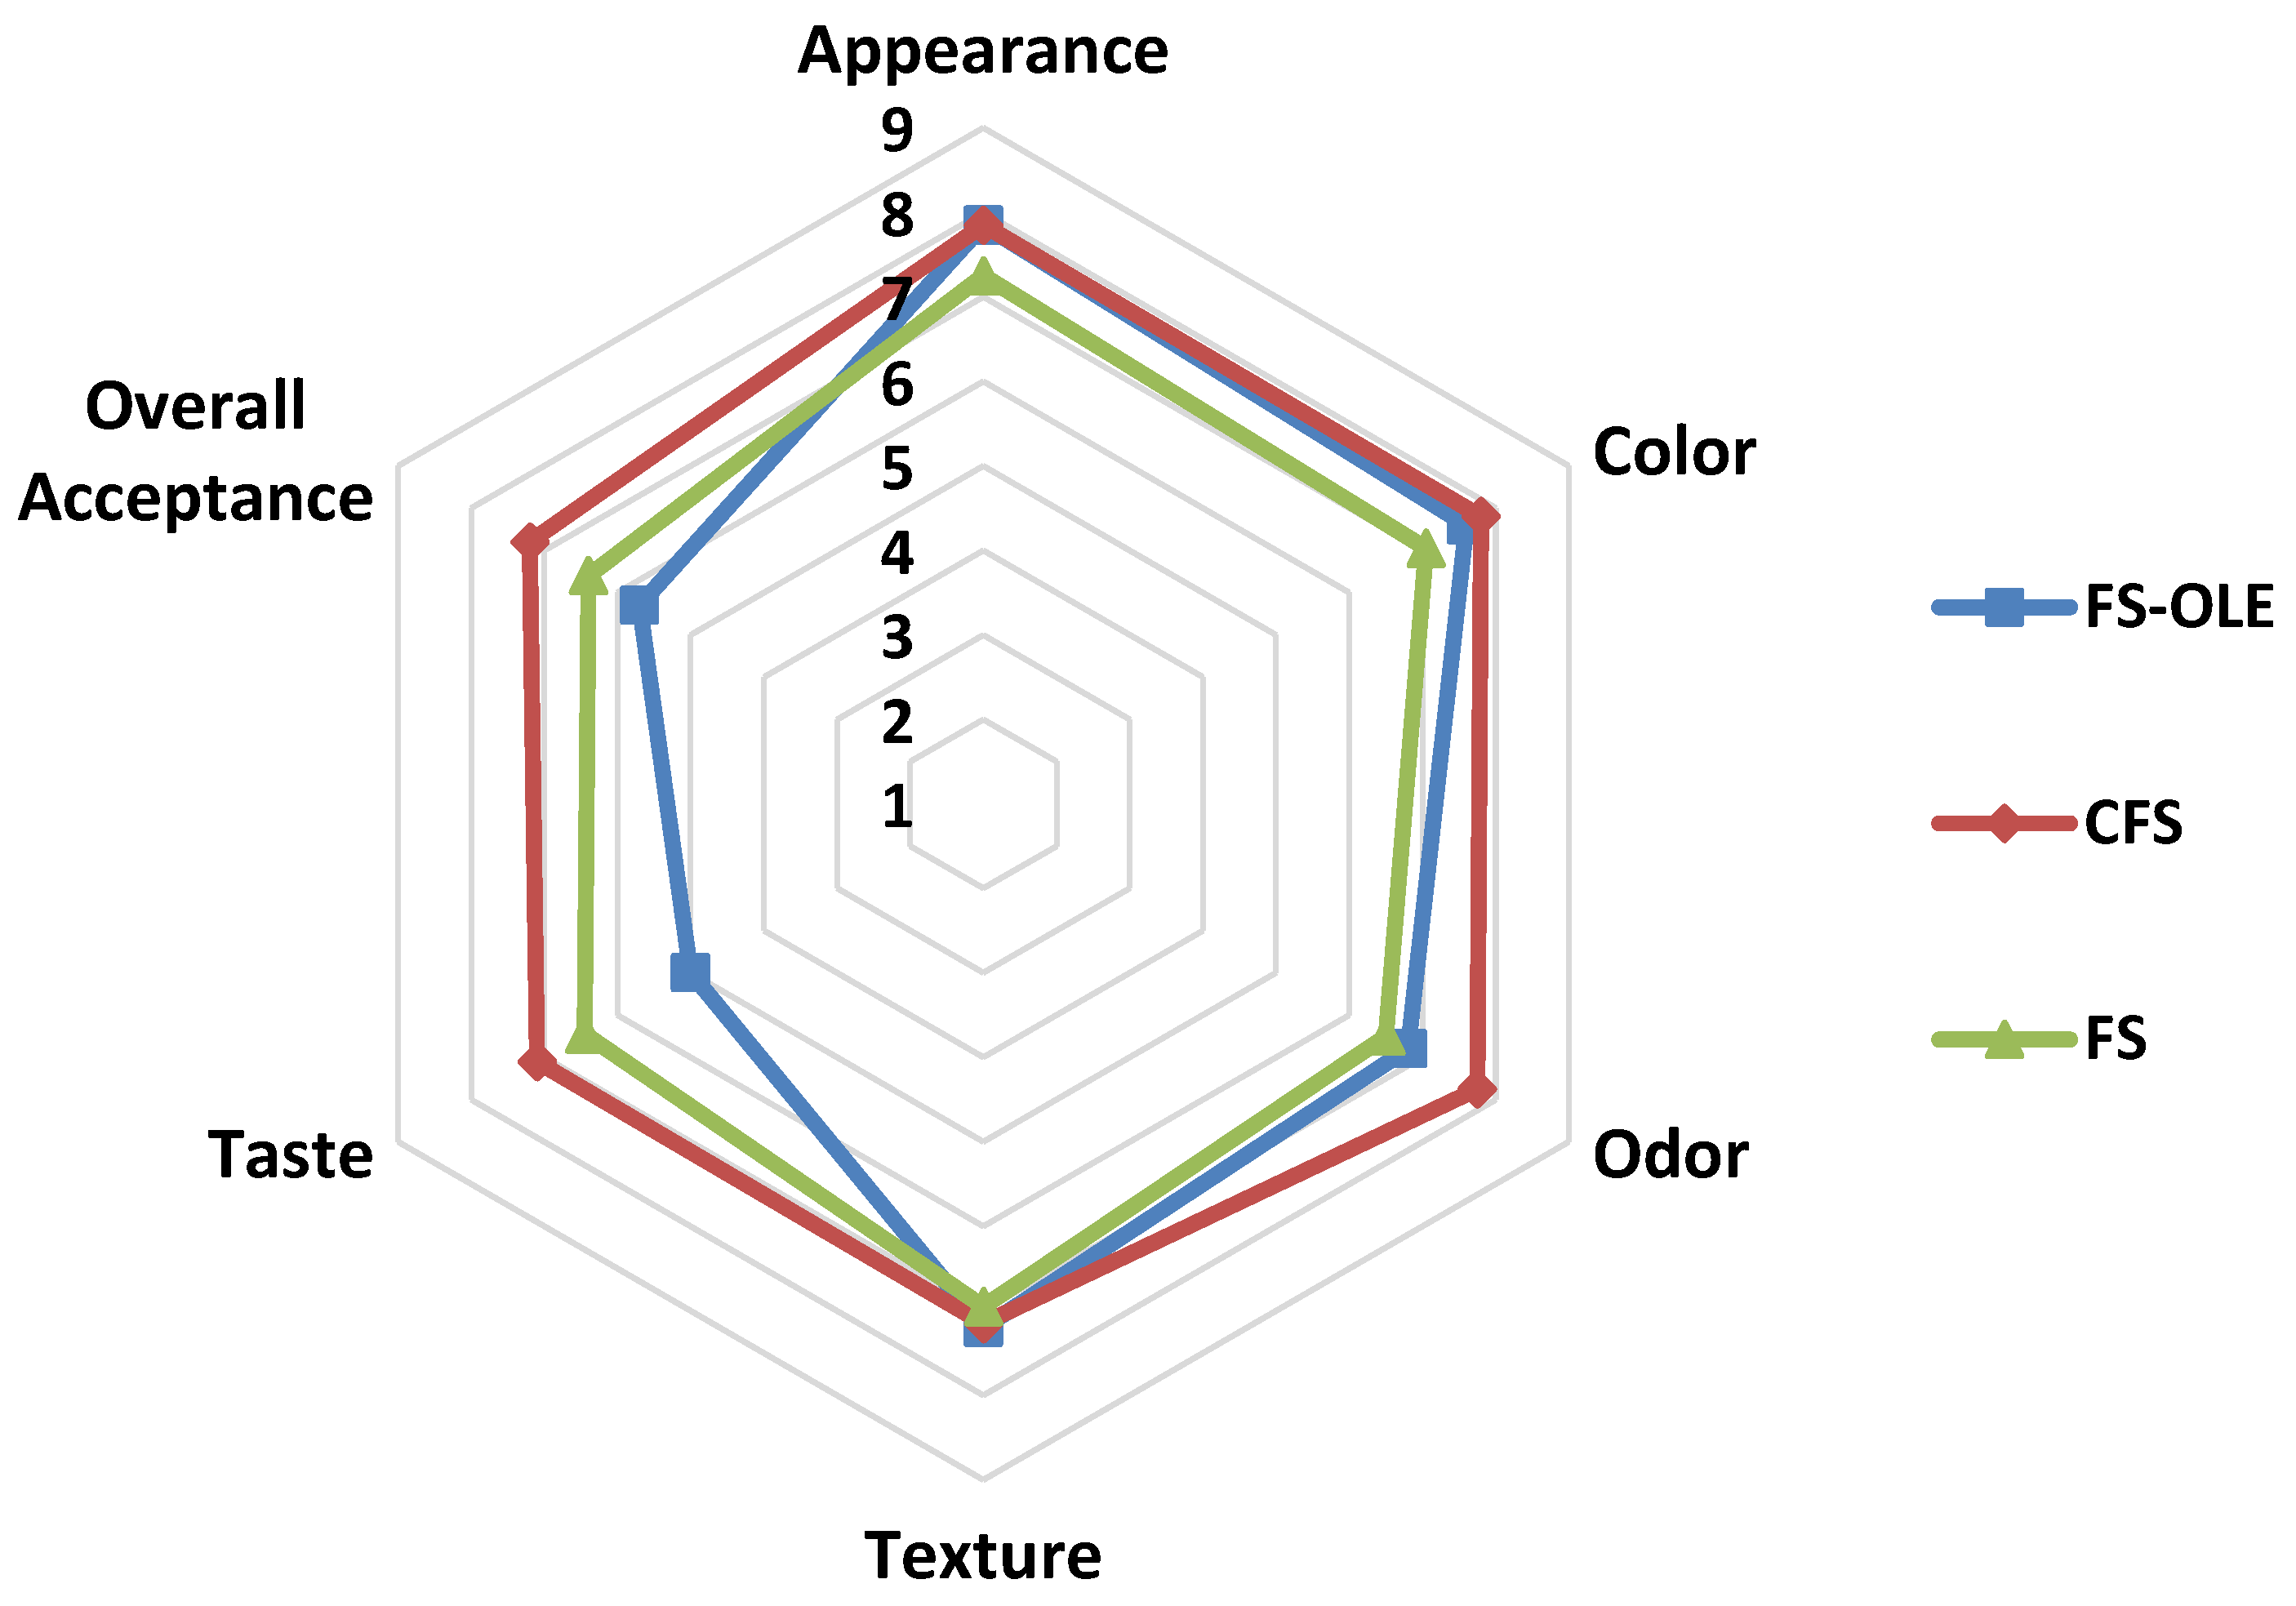
Figure 7.
Sensory evaluation of French sauce samples (FS-OLE: samples with OLE, CFS: commercial French sauce, and FS: samples without OLE). Results are illustrated on a 9-point hedonic scale.
Figure 7.
Sensory evaluation of French sauce samples (FS-OLE: samples with OLE, CFS: commercial French sauce, and FS: samples without OLE). Results are illustrated on a 9-point hedonic scale.
Table 1.
Chemical analysis of soybean and olive oils (shown as SBO and OO, respectively) used in the experiments.
Table 1.
Chemical analysis of soybean and olive oils (shown as SBO and OO, respectively) used in the experiments.
| | AV | PV | SV | IV | TPC | ChC | CaC |
|---|
| SBO | 0.1 ± 0.0 | 2.8 ± 0.6 | 195 ± 2 | 134 ± 1 | 4 ± 0.3 | 0.001 ± 0.000 | 0.025 ± 0.000 |
| OO | 1.5 ± 0.3 | 18.7 ± 0.2 | 191 ± 3 | 79 ± 2 | 178 ± 8 | 7.41 ± 0.00 | 2.16 ± 0.00 |
Table 2.
Emulsion Stability (%) of Sauce samples prepared at different ratios of olive and soybean oils (100SO: samples with 100% soybean oil, 25OO: samples with 75% soybean oil and 25% olive oil, 50OO: samples with 50% soybean oil and 50% olive oil, 75OO: samples with 25% soybean oil and 75% olive oil, and 100OO: samples with 100% olive oil).
| Storage Period (Day) | Sample |
|---|
| 100SO | 25OO | 50OO | 75OO | 100OO |
|---|
| 0 | 99.9 ± 0.1 Aa | 99.9 ± 0.1 Aa | 99.9 ± 0.1 Aa | 99.6 ± 0.1 Ab | 99.4 ± 0.0 Ac |
| 15 | 99.9 ± 0.0 Aa | 99.7 ± 0.2 ABa | 99.8 ± 0.1 Aa | 99.1 ± 0.1 Ab | 98.9 ± 0.1 Ab |
| 30 | 99.8 ± 0.0 Aa | 99.5 ± 0.1 Bab | 99.5 ± 0.1 ABab | 98.1 ± 0.8 Bb | 98.8 ± 0.1 Ac |
| 45 | 99.7 ± 0.1 ABa | 99.5 ± 0.0 Ba | 99.2 ± 0.2 Ba | 96.9 ± 0.1 Cb | 97.81 ± 0.7 Bc |
| 60 | 99.6 ± 0.2 Ba | 98.8 ± 0.0 Cb | 98.4 ± 0.1 Cb | 96.7 ± 0.7 Cc | 95.8 ± 0.1 Cd |
| 75 | 98.4 ± 0.1 Ca | 98.5 ± 0.1 CDb | 98.1 ± 0.1 Cc | 96.7 ± 0.1 Cd | 95.5 ± 0.5 Ce |
| 90 | 98.4 ± 0.3 Ca | 98.3 ± 0.3 Da | 98.1 ± 0.8 Ca | 96.6 ± 0.7 Cb | 95.4 ± 0.5 Cc |
Table 3.
pH values of French sauce samples prepared at different ratios of olive and soybean oils (100SO: samples with 100% soybean oil, 25OO: samples with 75% soybean oil and 25% olive oil, 50OO: samples with 50% soybean oil and 50% olive oil, 75OO: samples with 25% soybean oil and 75% olive oil, and 100OO: samples with 100% olive oil).
Storage Period
(Day) | Sample |
|---|
| 100SO | 25OO | 50OO | 75OO | 100OO |
|---|
| 0 | 4.10 ± 0.10 Aa | 4.08 ± 0.08 Aa | 4.10 ± 0.05 Aa | 4.10 ± 0.10 Aa | 4.13 ± 0.02 Aa |
| 15 | 4.08 ± 0.08 Aa | 4.03 ± 0.05 Aa | 4.09 ± 0.01 Aa | 4.06 ± 0.05 ABa | 4.12 ± 0.00 Aa |
| 30 | 4.05 ± 0.05 ABa | 4.04 ± 0.05 Aa | 4.09 ± 0.00 Aa | 4.06 ± 0.05 ABa | 4.11 ± 0.00 Aa |
| 45 | 3.89 ± 0.09 Bb | 3.70 ± 0.00 Ba | 3.90 ± 0.10 ABb | 4.03 ± 0.05 ABc | 4.11 ± 0.01 Ac |
| 60 | 3.60 ± 0.10 Cab | 3.50 ± 0.10 Ca | 3.83 ± 0.28 BCbc | 4.01 ± 0.00 Ac | 4.00 ± 0.00 Bc |
| 75 | 3.50 ± 0.10 CDa | 3.46 ± 0.05 Ca | 3.63 ± 0.15 Ca | 3.97 ± 0.06 Bb | 3.90 ± 0.10 Cb |
| 90 | 3.36 ± 0.06 Da | 3.45 ± 0.05 Ca | 3.86 ± 0.05 ABCb | 3.97 ± 0.06 Bb | 3.90 ± 0.10 Cb |
Table 4.
Textural properties of French sauce samples prepared with different blends of olive and soybean oil (100SO: samples with 100% soybean oil, 25OO: samples with 75% soybean oil and 25% olive oil, 50OO: samples with 50% soybean oil and 50% olive oil, 75OO: samples with 25% soybean oil and 75% olive oil, and 100OO: samples with 100% olive oil).
| Sample | Firmness (g) | Consistency (g.s) |
|---|
| Day 0 | Day 45 | Day 90 | Day 0 | Day 45 | Day 90 |
|---|
| 100SO | 163 ± 9 Aa | 154 ± 3 Aa | 128 ± 3 ABb | 2507 ± 22 Aa | 2303 ± 16 Ab | 1938 ± 16 Ac |
| 25OO | 154 ± 5 ABa | 146 ± 7 Aa | 127 ± 3 ABb | 2474 ± 15 Aa | 2284 ± 18 Ab | 1921 ± 22 Ac |
| 50OO | 161 ± 5 Aa | 152 ± 2 Aa | 131 ± 8 Ab | 2407 ± 12 Ba | 2180 ± 21 Bb | 1952 ± 28 Ac |
| 75OO | 145 ± 4 BCa | 130 ± 2 Bb | 121 ± 9 ABb | 2034 ± 27 Ca | 1952 ± 17 Cb | 1509 ± 11 Bc |
| 100OO | 134 ± 7 Ca | 121 ± 4 Cb | 116 ± 3 Bb | 1829 ± 14 Da | 1522 ± 11 Db | 1488 ± 17 Bc |
Table 5.
Acid values (mg NaOH/g) obtained for the samples of French sauce (50OO) enriched by different amounts of olive leaf extract (OLE).
Table 5.
Acid values (mg NaOH/g) obtained for the samples of French sauce (50OO) enriched by different amounts of olive leaf extract (OLE).
| Storage Period (Day) | OLE Concentration (mg/kg) |
|---|
| 0 | 500 | 1000 | 1500 | 2000 |
|---|
| 0 | 1.1 ± 0.0 Aa | 1.1 ± 0.0 Aa | 1.1 ± 0.0 Aa | 1.1 ± 0.0 Aa | 1.1 ± 0.0 Aa |
| 15 | 1.2 ± 0.0 Bab | 1.2 ± 0.0 Ab | 1.2 ± 0.01 Aab | 1.1 ± 0.1 Aa | 1.1 ± 0.0 Aa |
| 30 | 1.4 ± 0.0 Ca | 1.4 ± 0.0 Ba | 1.3 ± 0.0 Aa | 1.3 ± 0.0 Ba | 1.3 ± 0.0 Ba |
| 45 | 2.3 ± 0.0 Db | 2.3 ± 0.1 Cab | 2.3 ± 0.0 Bab | 2.3 ± 0.0 Cb | 2.2 ± 0.0 Ca |
| 60 | 3.1 ± 0.0 Ec | 3.1 ± 0.1 Dc | 3.1 ± 0.0 Cc | 2.9 ± 0.0 Db | 2.6 ± 0.1 Da |
| 75 | 3.7 ± 0.1 Fb | 3.6 ± 0.1 Eb | 3.6 ± 0.4 Db | 3.0 ± 0.0 Da | 2.9 ± 0.0 Ea |
| 90 | 4.9 ± 0.0 Gd | 5.0 ± 0.0 Fd | 4.7 ± 0.1 Ec | 3.7 ± 0.2 Eb | 3.1 ± 0.1 Fa |
Table 6.
Peroxide values (meq O2/kg) of French sauce (50OO) samples enriched by olive leaf extract (OLE).
Table 6.
Peroxide values (meq O2/kg) of French sauce (50OO) samples enriched by olive leaf extract (OLE).
| Storage Period (Day) | OLE Concentration (mg/kg) |
|---|
| 0 | 500 | 1000 | 1500 | 2000 |
|---|
| 0 | 3.1 ± 0.0 Aa | 3.1 ± 0.0 Aa | 3.1 ± 0.0 Aa | 3.1 ± 0.0 Aa | 3.1 ± 0.0 Aa |
| 15 | 3.8 ± 0.0 Ba | 3.8 ± 0.0 Ba | 3.7 ± 0.0 BCb | 3.4 ± 0.0 Bc | 3.2 ± 0.1 Bd |
| 30 | 4.4 ± 0.0 Ca | 4.3 ± 0.1 Ca | 3.9 ± 0.0 Cb | 3.6 ± 0.1 Dc | 3.3 ± 0.0 Bd |
| 45 | 3.9 ± 0.1 Bab | 3.9 ± 0.1 Ba | 3.8 ± 0.0 Bb | 3.5 ± 0.1 Cc | 3.3 ± 0.0 Bd |
| 60 | 4.9 ± 0.1 Da | 4.7 ± 0.1 Db | 4.5 ± 0.1 Dc | 4.2 ± 0.1 Ed | 3.8 ± 0.0 Ce |
| 75 | 6.1 ± 0.1 Ea | 6.1 ± 0.0 Ea | 5.9 ± 0.1 Eb | 5.1 ± 0.1 Fc | 4.5 ± 0.1 Dd |
| 90 | 8.9 ± 0.0 Fa | 8.3 ± 0.2 Fb | 6.1 ± 0.1 Fc | 4.9 ± 0.0 Gd | 5.0 ± 0.1 Ed |
Table 7.
p-Anisidine values (mmol/kg) of French sauce samples (50OO) enriched by different amounts of olive leaf extract (OLE).
Table 7.
p-Anisidine values (mmol/kg) of French sauce samples (50OO) enriched by different amounts of olive leaf extract (OLE).
| Storage Period (Day) | OLE Concentration (mg/kg) |
|---|
| 0 | 500 | 1000 | 1500 | 2000 |
|---|
| 0 | 3.3 ± 0.0 Aa | 3.3 ± 0.01 Aa | 3.3 ± 0.0 Aa | 3.3 ± 0.0 Aa | 3.3 ± 0.0 Aa |
| 15 | 5.9 ± 0.1 Bc | 5.8 ± 0.0 Bc | 5.84 ± 0.1 Bc | 4.0 ± 0.1 ABb | 3.8 ± 0.1 Ba |
| 30 | 8.0 ± 0.0 Cb | 7.9 ± 0.1 Cb | 7.9 ± 0.8 Cb | 3.9 ± 0.9 ABa | 3.84 ± 0.1 Ba |
| 45 | 8.1 ± 0.0 Cb | 8.0 ± 0.0 Cb | 8.0 ± 0.0 Cb | 4.4 ± 0.1 Ba | 4.2 ± 0.3 Ca |
| 60 | 10.9 ± 0.0 Dd | 10.8 ± 0.0 Dd | 9.8 ± 0.6 Db | 5.6 ± 0.6 Ca | 5.0 ± 0.0 Da |
| 75 | 11.3 ± 0.0 Ed | 11.2 ± 0.0 Ed | 10.0 ± 0.0 Dc | 6.0 ± 0.0 CDb | 5.1 ± 0.1 Da |
| 90 | 12.6 ± 0.0 Fd | 12.6 ± 0.0 Fd | 10.9 ± 0.5 Ec | 6.6 ± 0.7 Db | 5.7 ± 0.2 Ea |
Table 8.
Total plate counts (cfu/g) of sauce samples during 90 days of storage.
Table 8.
Total plate counts (cfu/g) of sauce samples during 90 days of storage.
| | FS-OLE | FS |
|---|
| Yeast and Molds | E. coli | Lactic Acid Bacteria | Yeast and Molds | E. coli | Lactic Acid Bacteria |
|---|
| 0 | <100 | ND | ND | <100 | ND | ND |
| 15 | <100 | ND | ND | <100 | ND | ND |
| 30 | <100 | ND | ND | <100 | ND | ND |
| 45 | <100 | ND | ND | <100 | ND | ND |
| 60 | <100 | ND | ND | <100 | ND | 4.0 × 10² |
| 75 | <100 | ND | ND | <100 | ND | 4.2 × 10² |
| 90 | <100 | ND | ND | <100 | ND | 4.2 × 10² |


