1. Introduction
The impeller is the only rotational unit of the self-priming pump, which plays an essential part in the power capability of the pump. More and more scholars pay attention to the performance improvement of the centrifugal pump by optimizing the geometric parameters of the impeller [
1,
2,
3,
4,
5,
6,
7,
8,
9]. Jaiswal et al. [
10] optimized the input power of a centrifugal pump based on the multi-objective genetic algorithm; by modifying the impeller blade exit angle, the flow separation at the blade trailing edge is improved effectively, and the efficiency improvement of the optimal model is greater than 10%. Qian et al. [
11] selected blade exit angle, outlet diameter, and blade wrap angle of the secondary impeller as optimization parameters, as well as axial force and hydraulic performance, as the response objectives to improve the performance of the multistage pump. Meanwhile, the multiple regression model is established, which can effectively reflect the relationship between the performance parameters with geometric dimensioning. Chen et al. [
12] designed six impellers with different blade inlet angles based on ANSYS Bladegen and NX software, and the calculations are carried out to analyze the influence of blade inlet angle on the performance of the single blade pump. Lin et al. [
13] found that obvious pressure pulsation will be generated by the high-speed rotational impeller. However, the intensity of the rotor-stator can be eliminated by employing the impeller with a bionic sinusoidal tubercle trailing edge, and the vortex generated at the trailing edge can be effectively suppressed.
Posa et al. [
14] adopted the Large Eddy Simulations to investigate the effect of the diffuser inlet angle on the pressure fluctuation; the results found that the decrease in the diffuser inlet angle will lead to separation on the pressure side under the design flow rate. Thakkar et al. [
15] used the response surface methodology to study the influence of blade outlet angle, blade wrap angle, and blade outlet width on the head and efficiency of a sanitary centrifugal pump. Twenty-five optimized schemes are generated based on the Latin hypercube sampling method, and the head and efficiency are increased 9.154% and 10.15%, respectively. Shigemitsu et al. [
16] analyzed the effect of blade number on the performance of a centrifugal pump for low viscous fluid by experiment and calculation; the results present that the head and shaft power can be improved by increasing the blade number. Shi et al. [
17] analyzed the energy conversion ability of the multiphase pump impeller by adjusting the blade wrap angle; with the increase in wrap angle, the energy conversion presents a trend of decreasing first and then increasing. Wang et al. [
18] proposed 50 sets of impellers based on the Latin Hypercube Sampling method, and the Pareto-based genetic algorithm was employed to optimize the impeller geometry parameters of pump-as-turbines. Zhang et al. [
19] investigated the energy loss of the side channel pump with different wrap angles based on the entropy loss production method; the results present that the highest entropy losses are generated in the impeller and the side channel passages with the smaller wrap angle. Peng et al. [
20] selected the blade outlet angles with 16 degrees, 20 degrees, 24 degrees, 28 degrees, and 32 degrees to analyze the internal flow characteristic of the centrifugal pump, and the relationship between the blade outlet angle and the cavitation performance is obtained. However, most investigations focus on the impeller optimization by adjusting the blade wrap angle, blade number, inlet angle, and outlet angle; a few analyses about hub radius optimization are carried out.
Therefore, in this paper, a self-priming pump with different hub radii is systematically investigated by numerical simulations and experiments, while the internal flow characteristics, blade surface load, pressure pulsation characteristics, and radial force distribution are analyzed. Finally, the relevant hydraulic experiment is conducted, and the difference between the experiment and calculation is below 3%, which ensures the accuracy of the calculation results.
2. Numerical Model and Grids
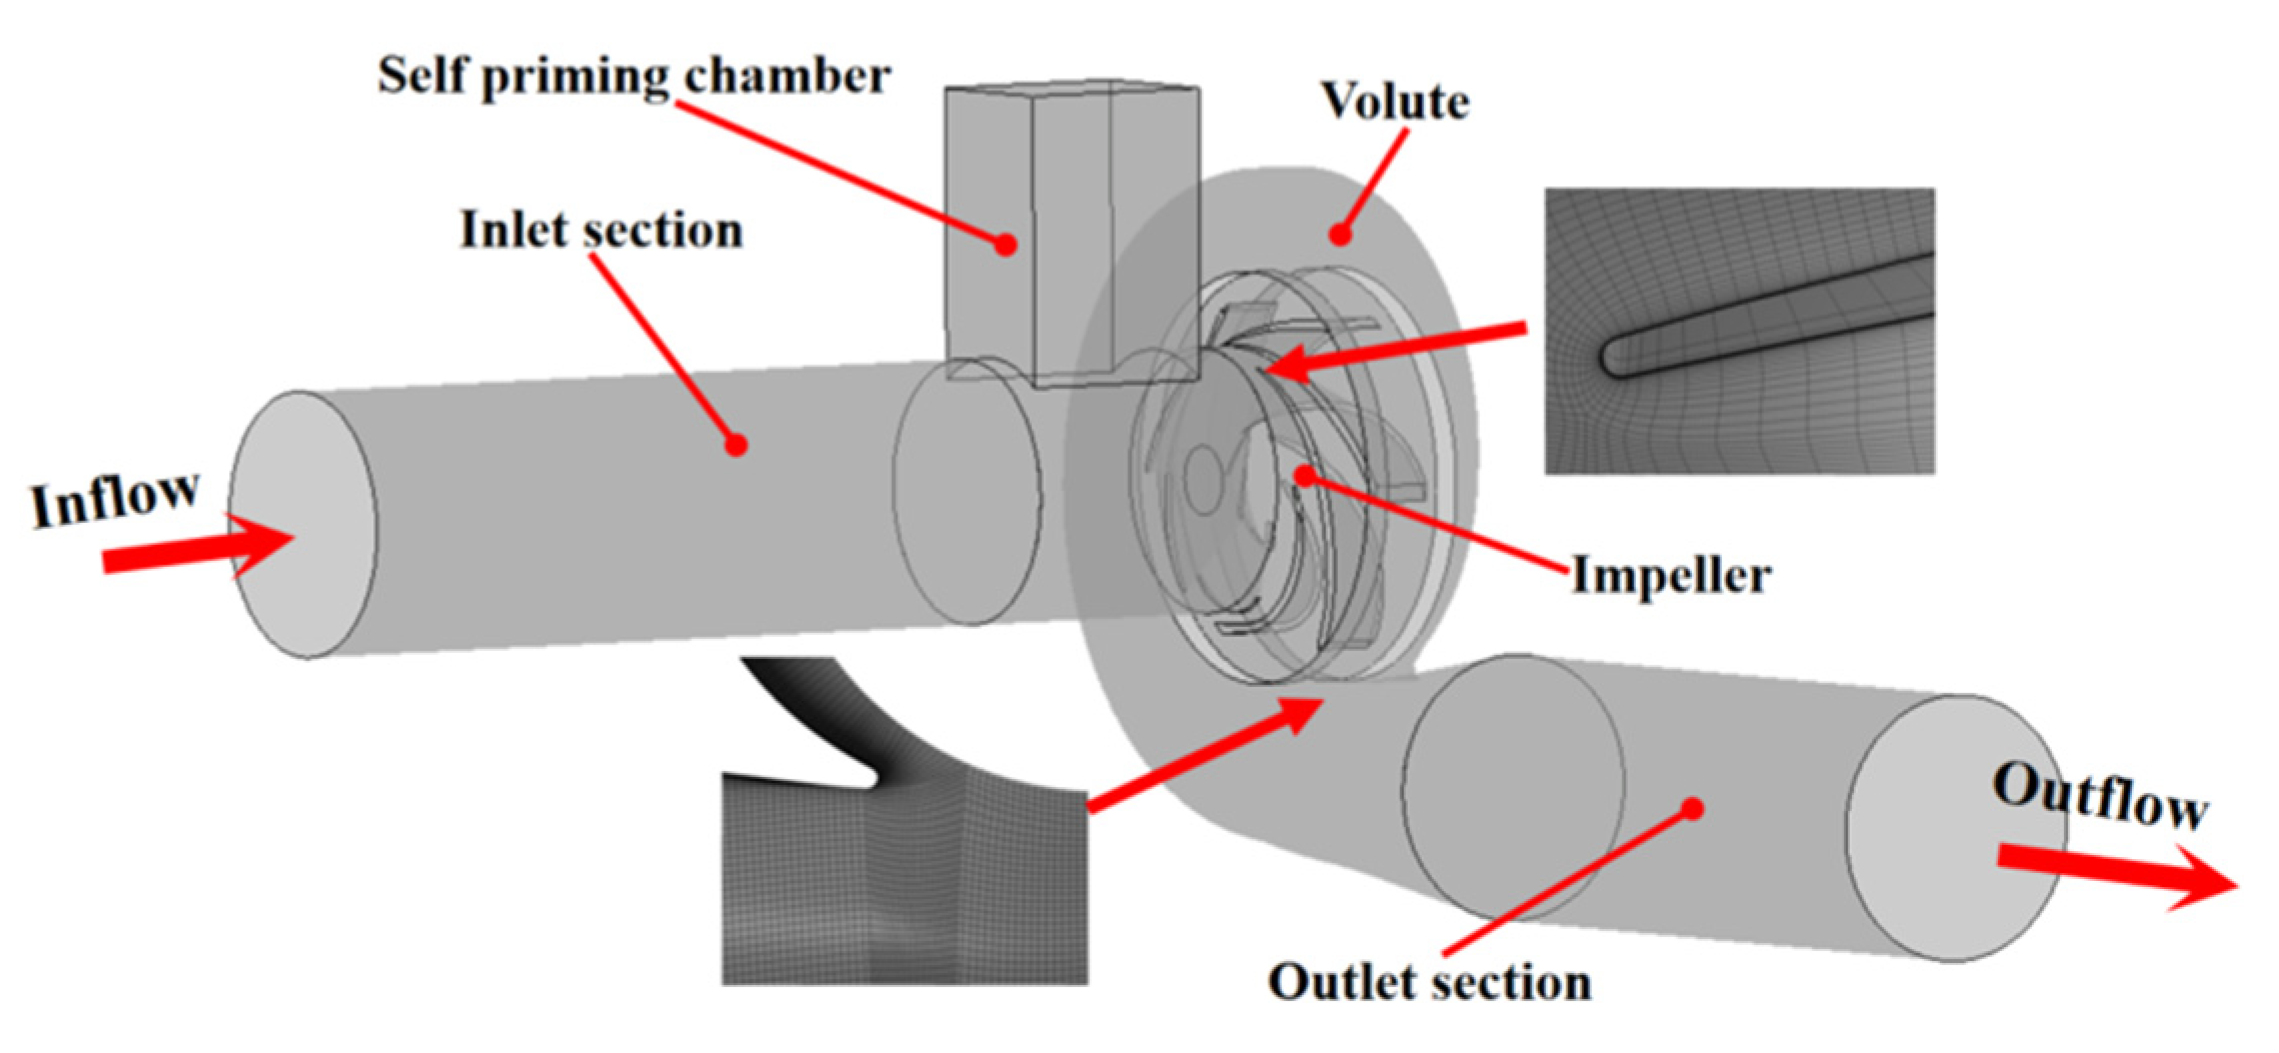
In this paper, a self-priming centrifugal pump is selected as the analysis object; the design flow rate is 500 m
3/h, the rotation speed is 2200 r/m, and the design head is 45 m. Meanwhile, the calculation model consists of the inlet section, outlet section, impeller, volute, and self-priming chamber, as shown in
Figure 1. Considering the sufficient evolution of inflow and outflow, the length of the inlet and outlet section extends to five times the diameter of the impeller inlet and the volute outlet, respectively. At the same time, the calculation domain is modeled by UG software, and structured grids are employed on all models by ANSYS ICEM, while local encryption is employed on the leading edge of the blade and tongue of the volute.
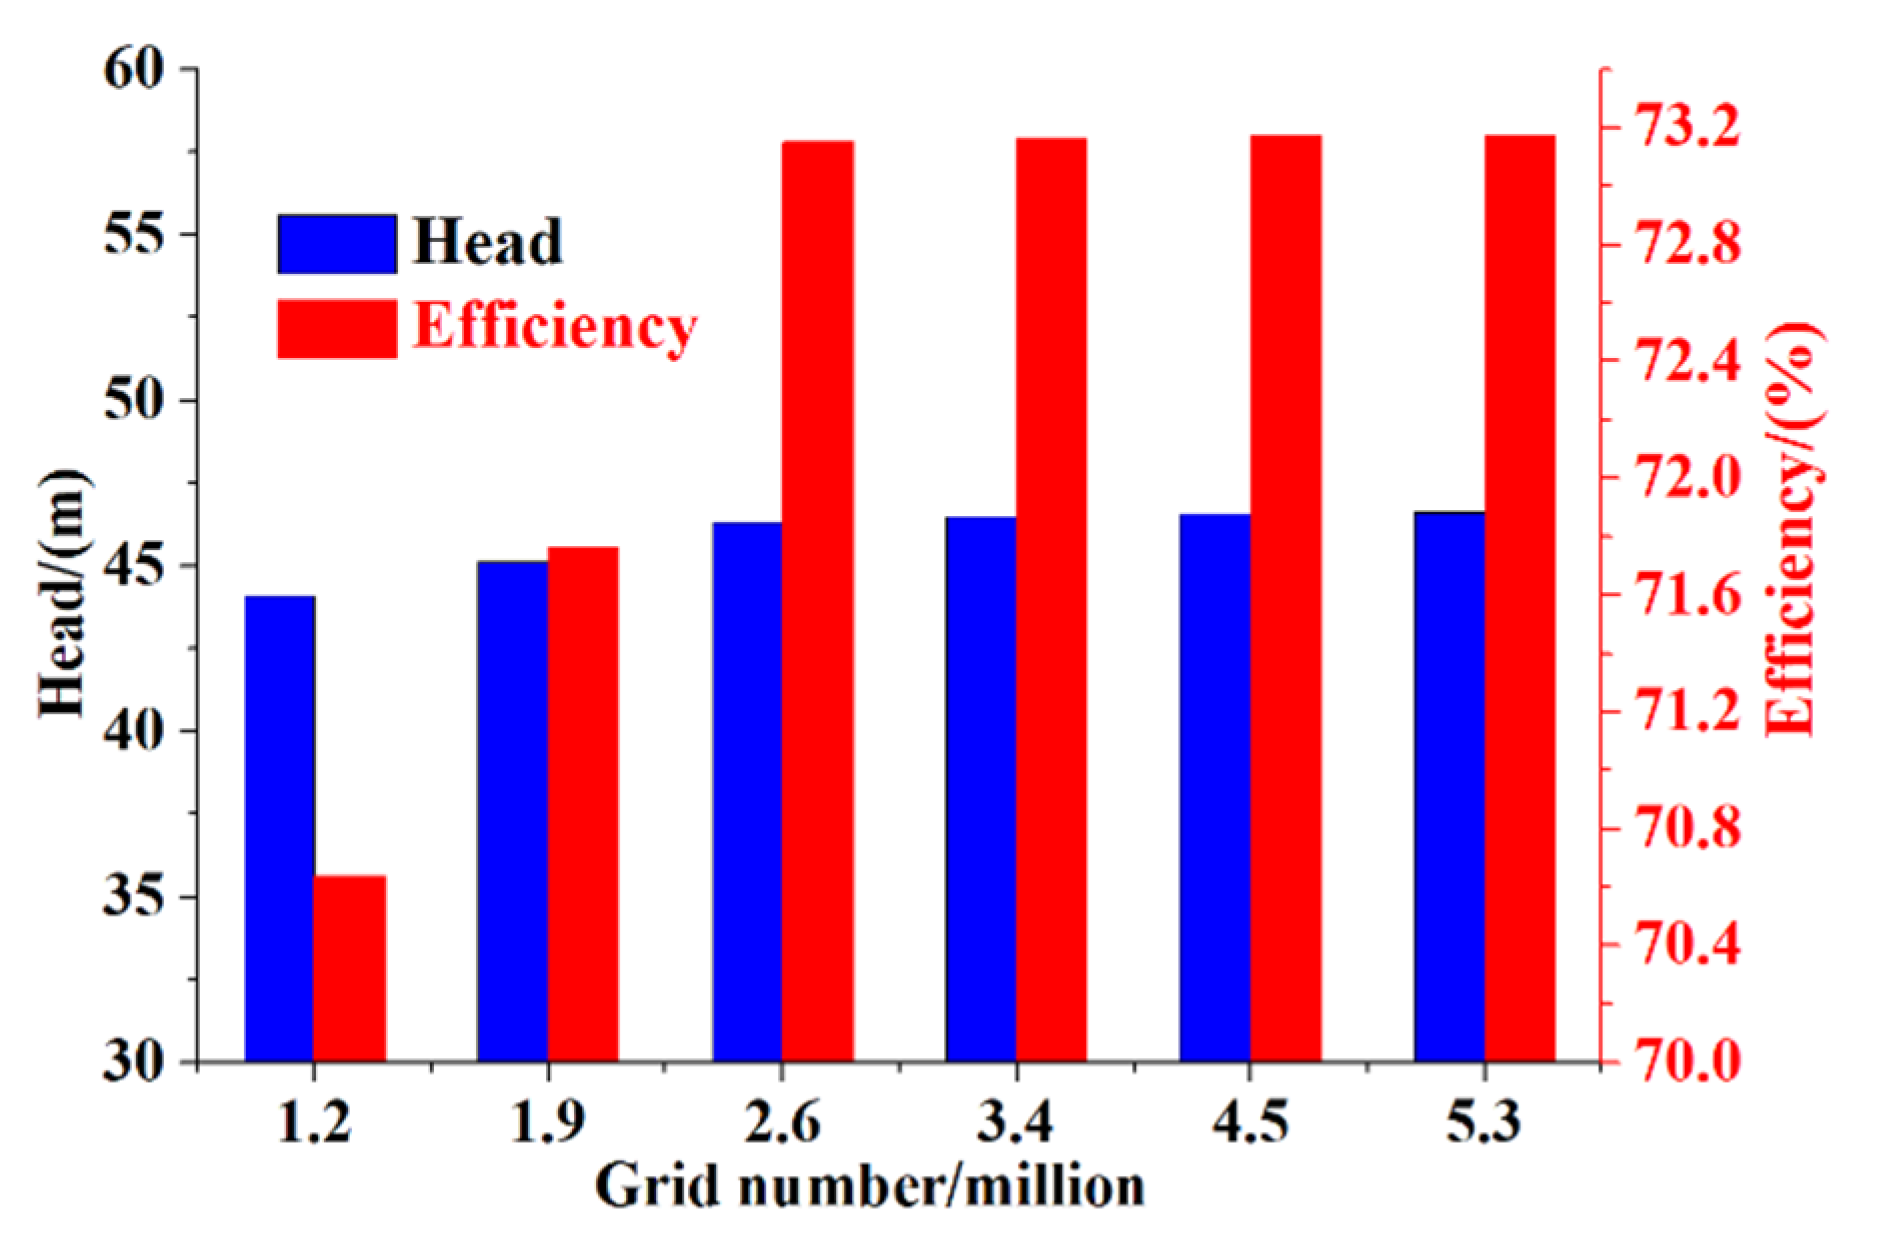
Moreover, grid sensitive analysis is carried out to improve the investigation accuracy; by comparing the head and efficiency of the grid number at 5 × 10
6, 4 × 10
6, 3 × 10
6, 2 × 10
6, and 1 × 10
6, it can be concluded that the head and efficiency gradually increase with the rise of the grid number. However, when the grid number is more than 2 × 10
6, the deviation of the head and efficiency of the different grid schemes is less than 1%, as shown in
Figure 2. Therefore, considering the consumption of calculation resources and time, the grid number of 2 × 10
6 is selected for further investigation.
3. Analysis Scheme
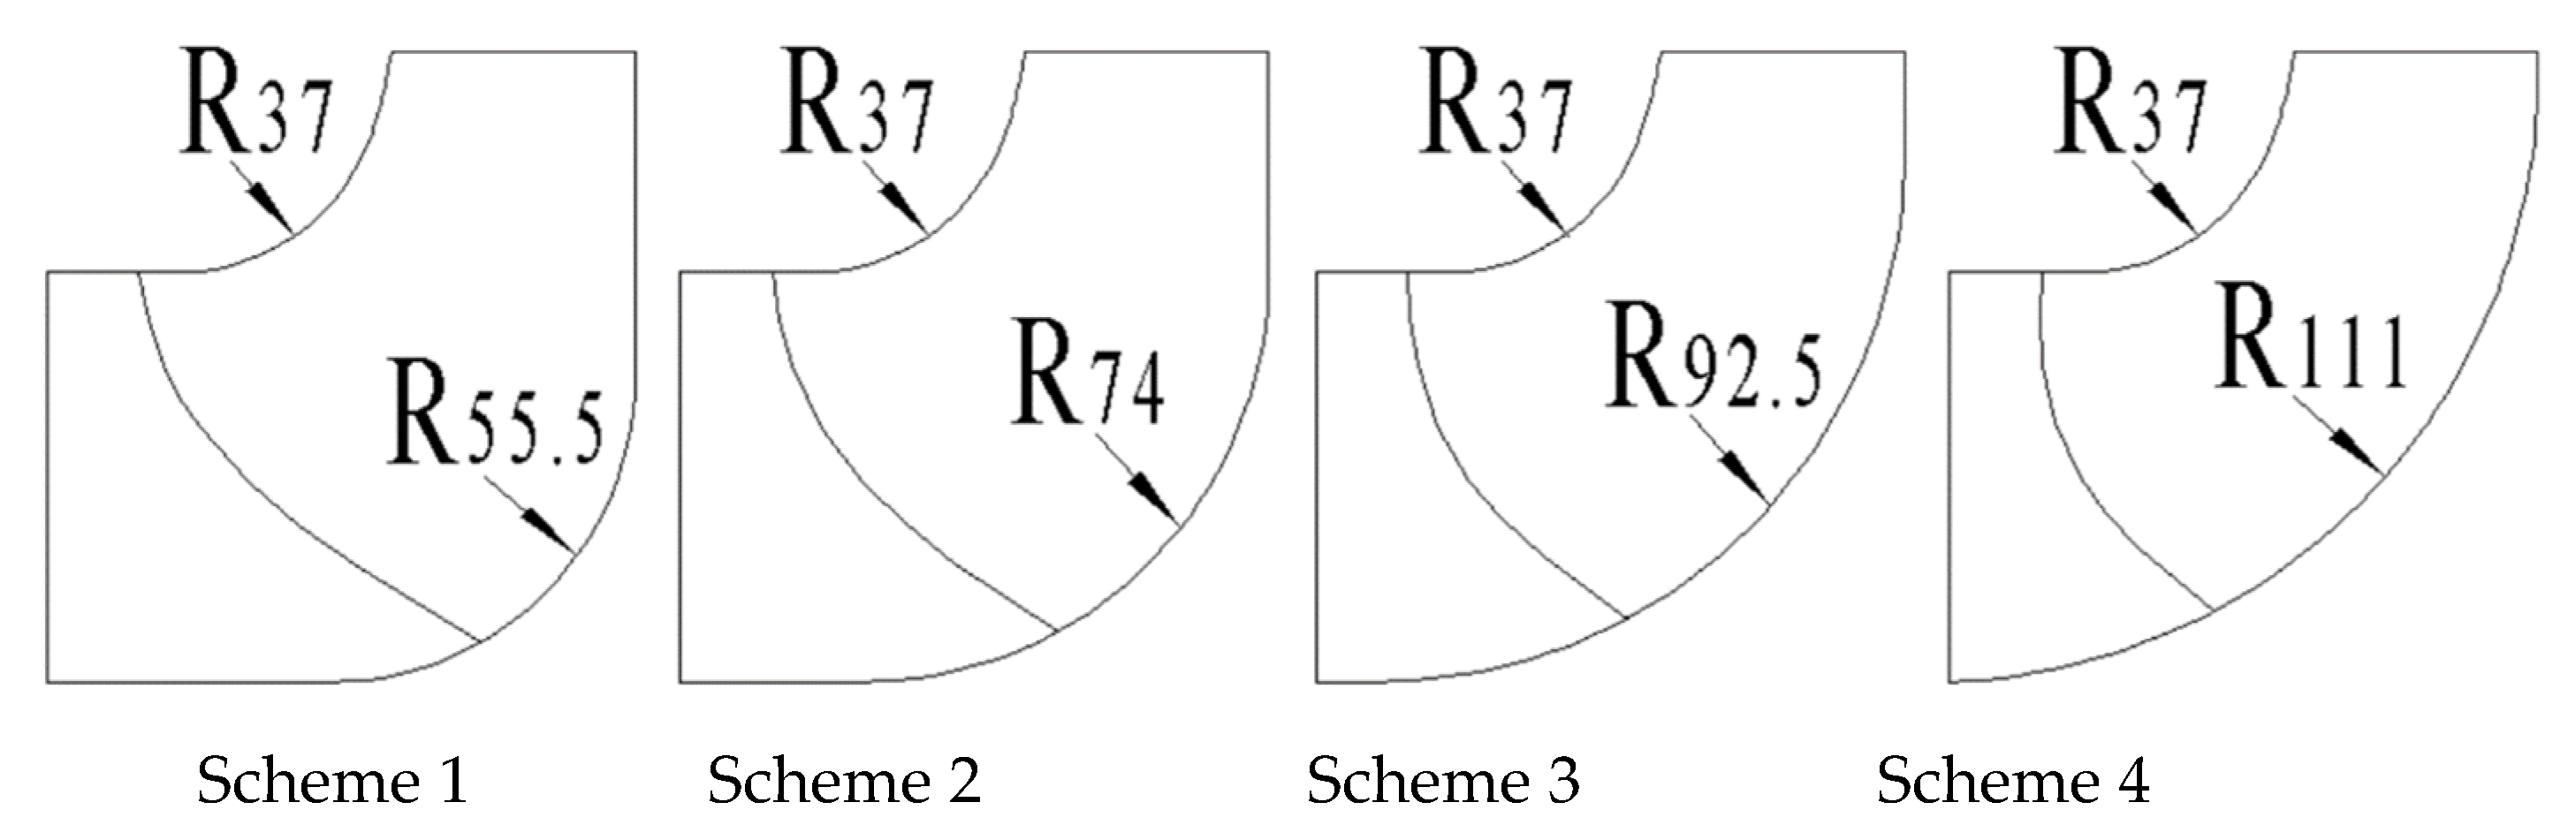
In this paper, the geometric parameters, such as impeller inlet diameter, outlet diameter, outlet width, inlet angle, outlet angle, and shroud radius, remain the same, while the hub radius is 1.5, 2, 2.5, and 3 times the shroud radius, and the corresponding schemes is 1, 2, 3, and 4, respectively. Furthermore, the SST k–ω turbulence and water (at normal temperature) are employed, while the calculation model of the impeller is set as a rotational part; the calculation model of the inlet, outlet, impeller, volute, and the self-priming chamber is set as the stationary part; and the interface between the rotational and stationary part is set as a frozen rotor interface. Meanwhile, the boundary condition is set as pressure inlet and mass flow outlet. According to the previous investigation [
21], the time step is set as 4.54 × 10
−4 s; RMS residual is set as 0.00001. The transient simulation is carried out to analyze the influence of the hub radius on the performance of the self-priming centrifugal pump. Schemes of impellers with different meridians are shown in
Figure 3.
4. Analysis of Internal Flow Characteristics
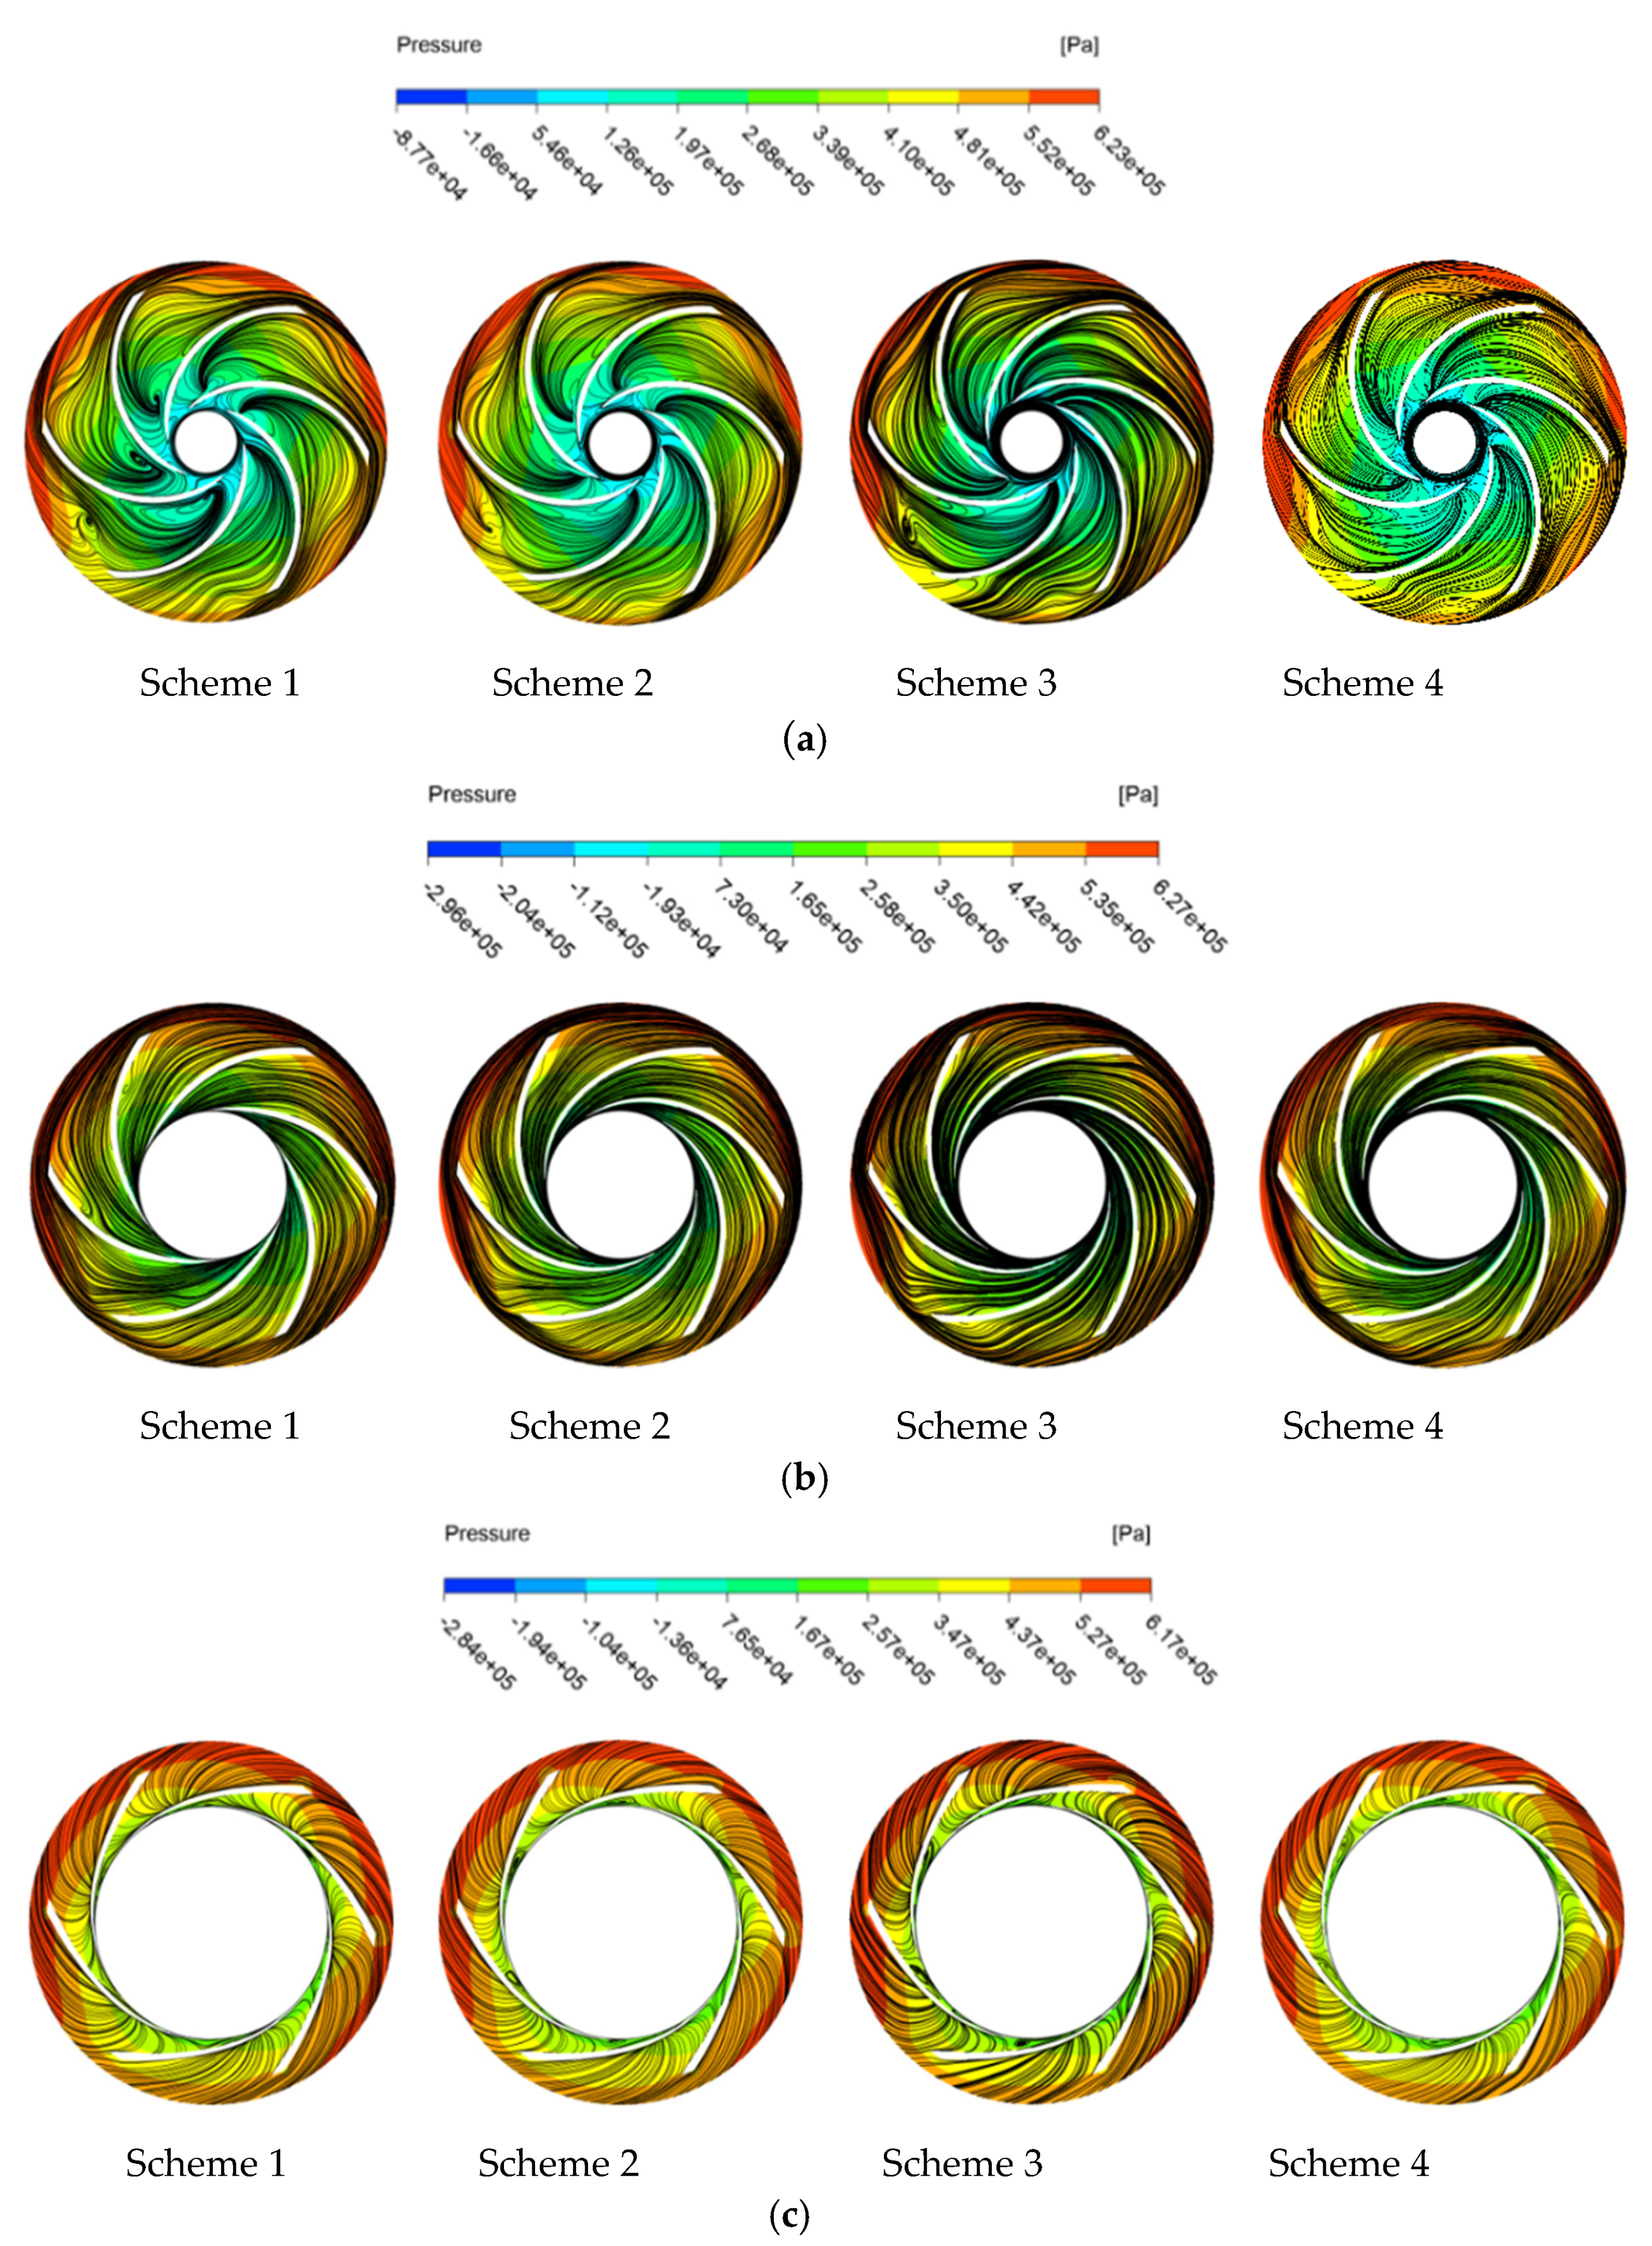
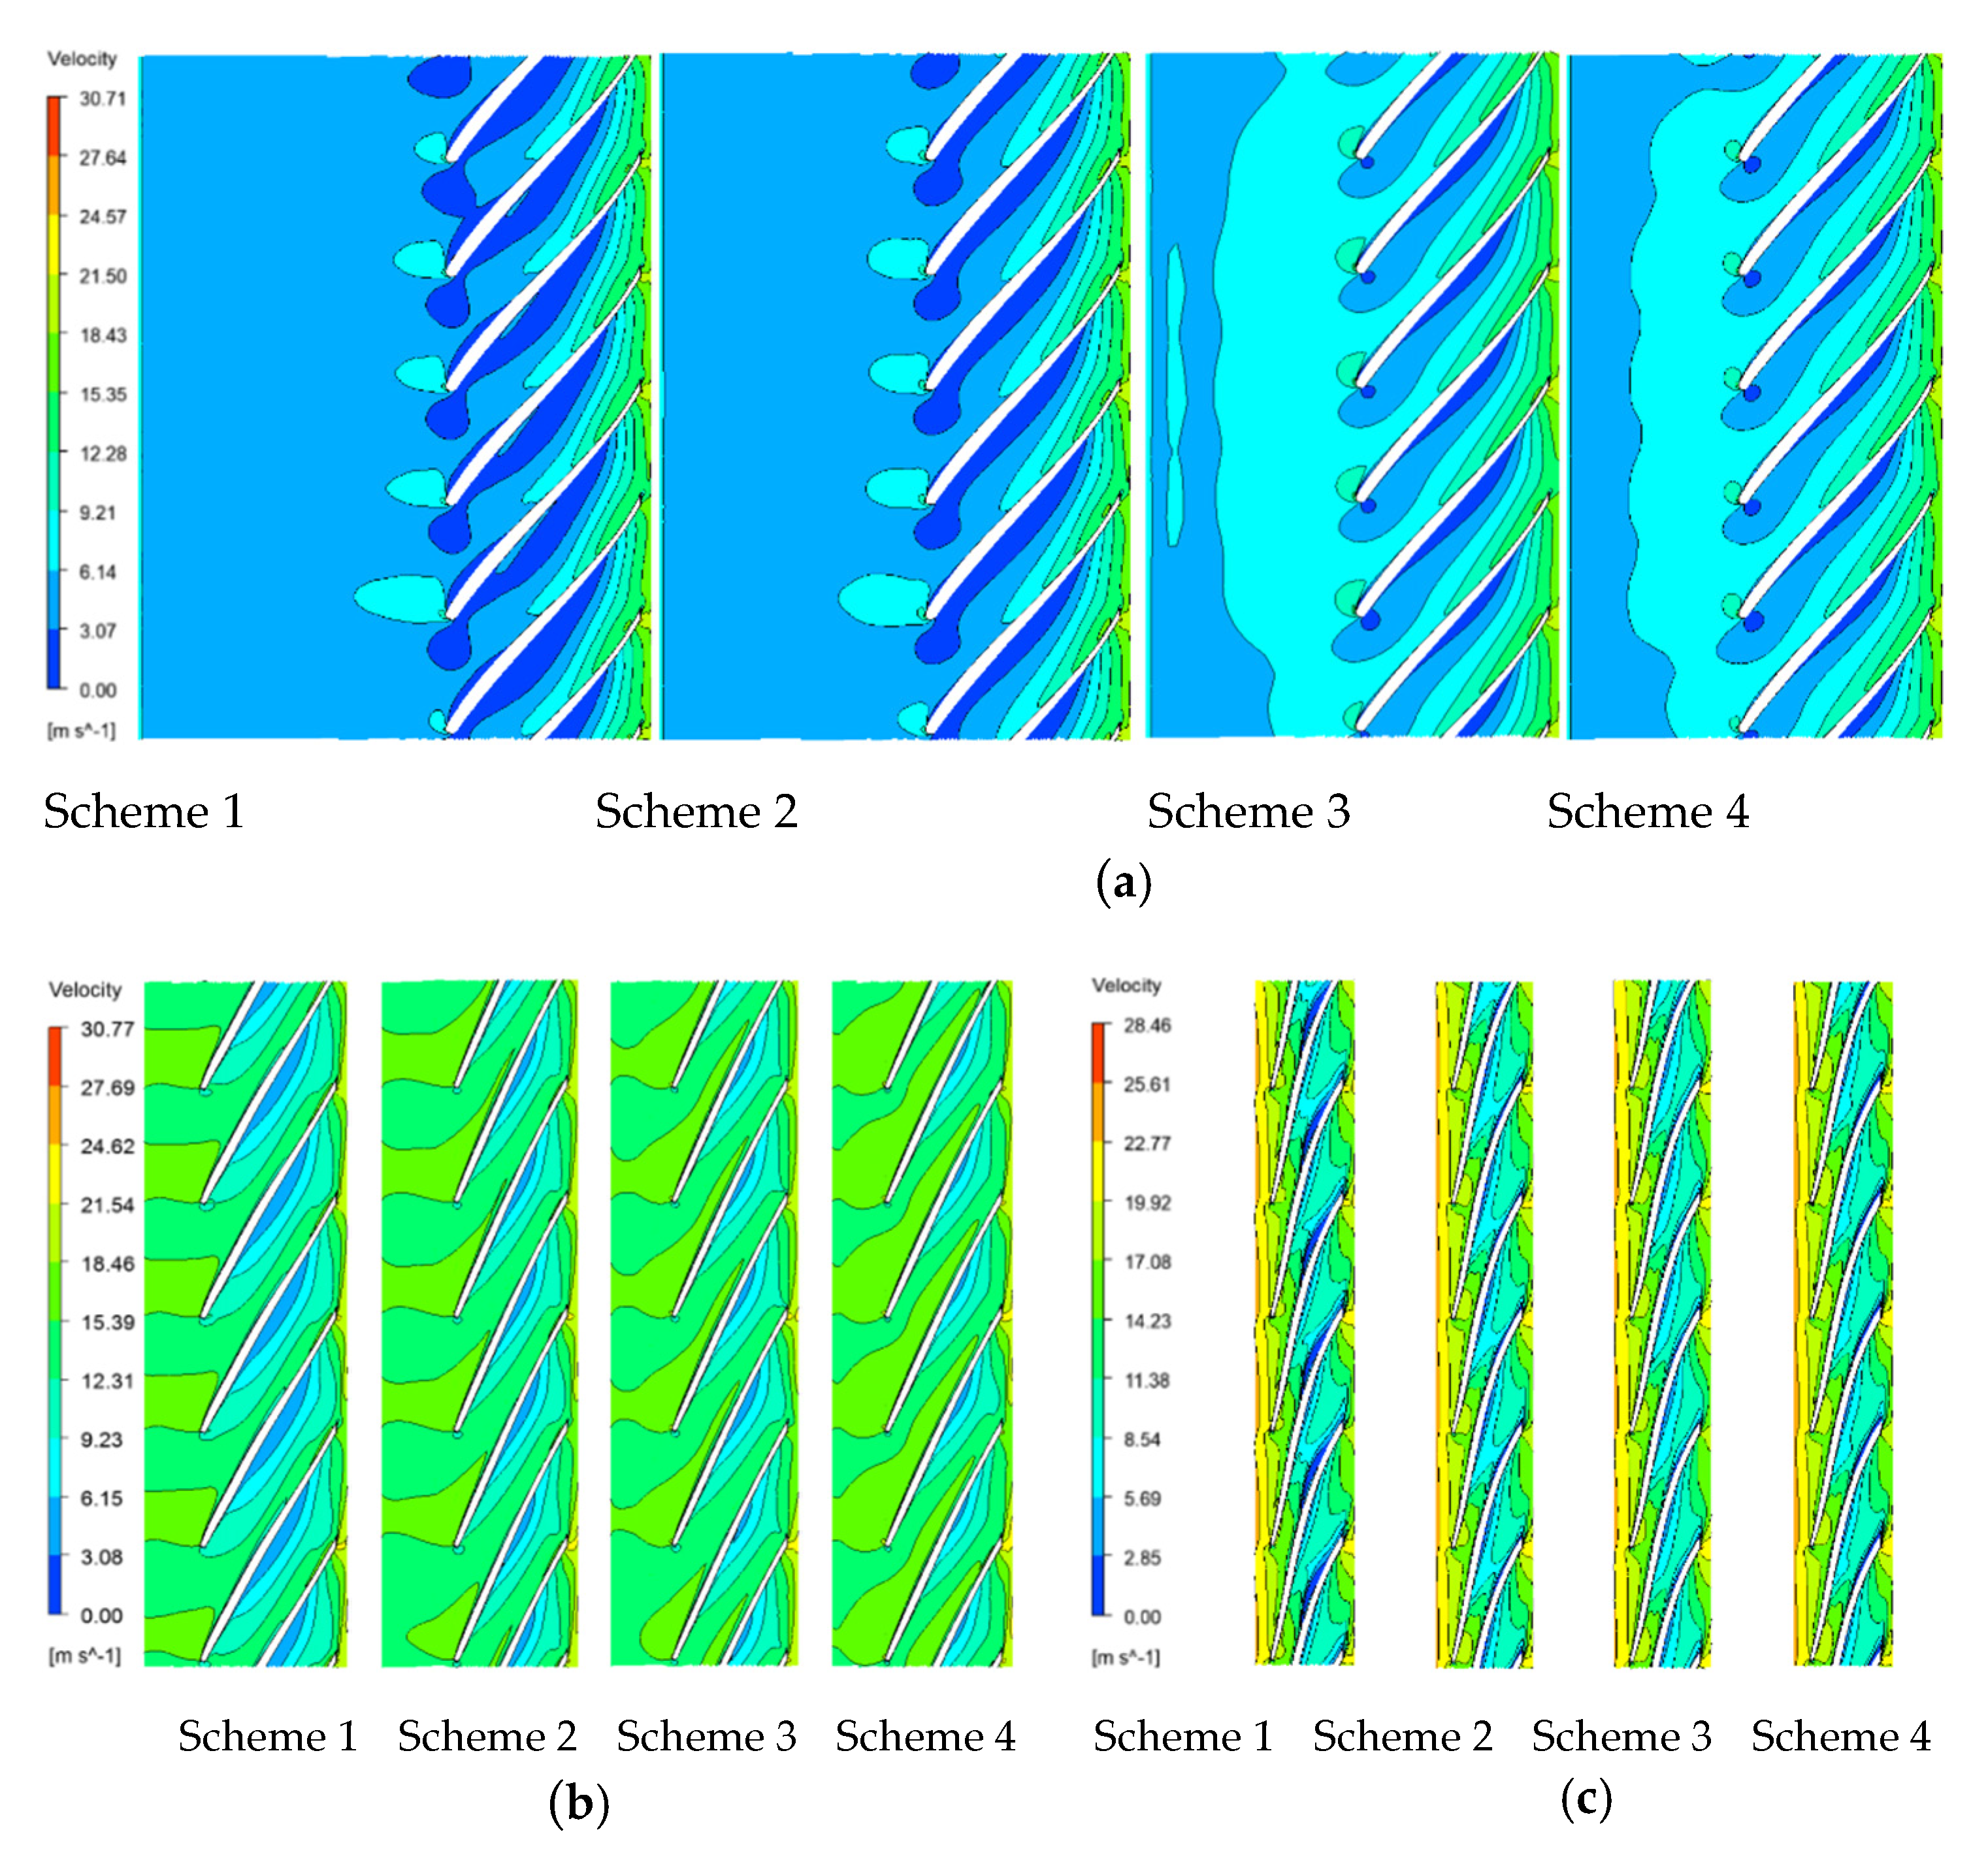
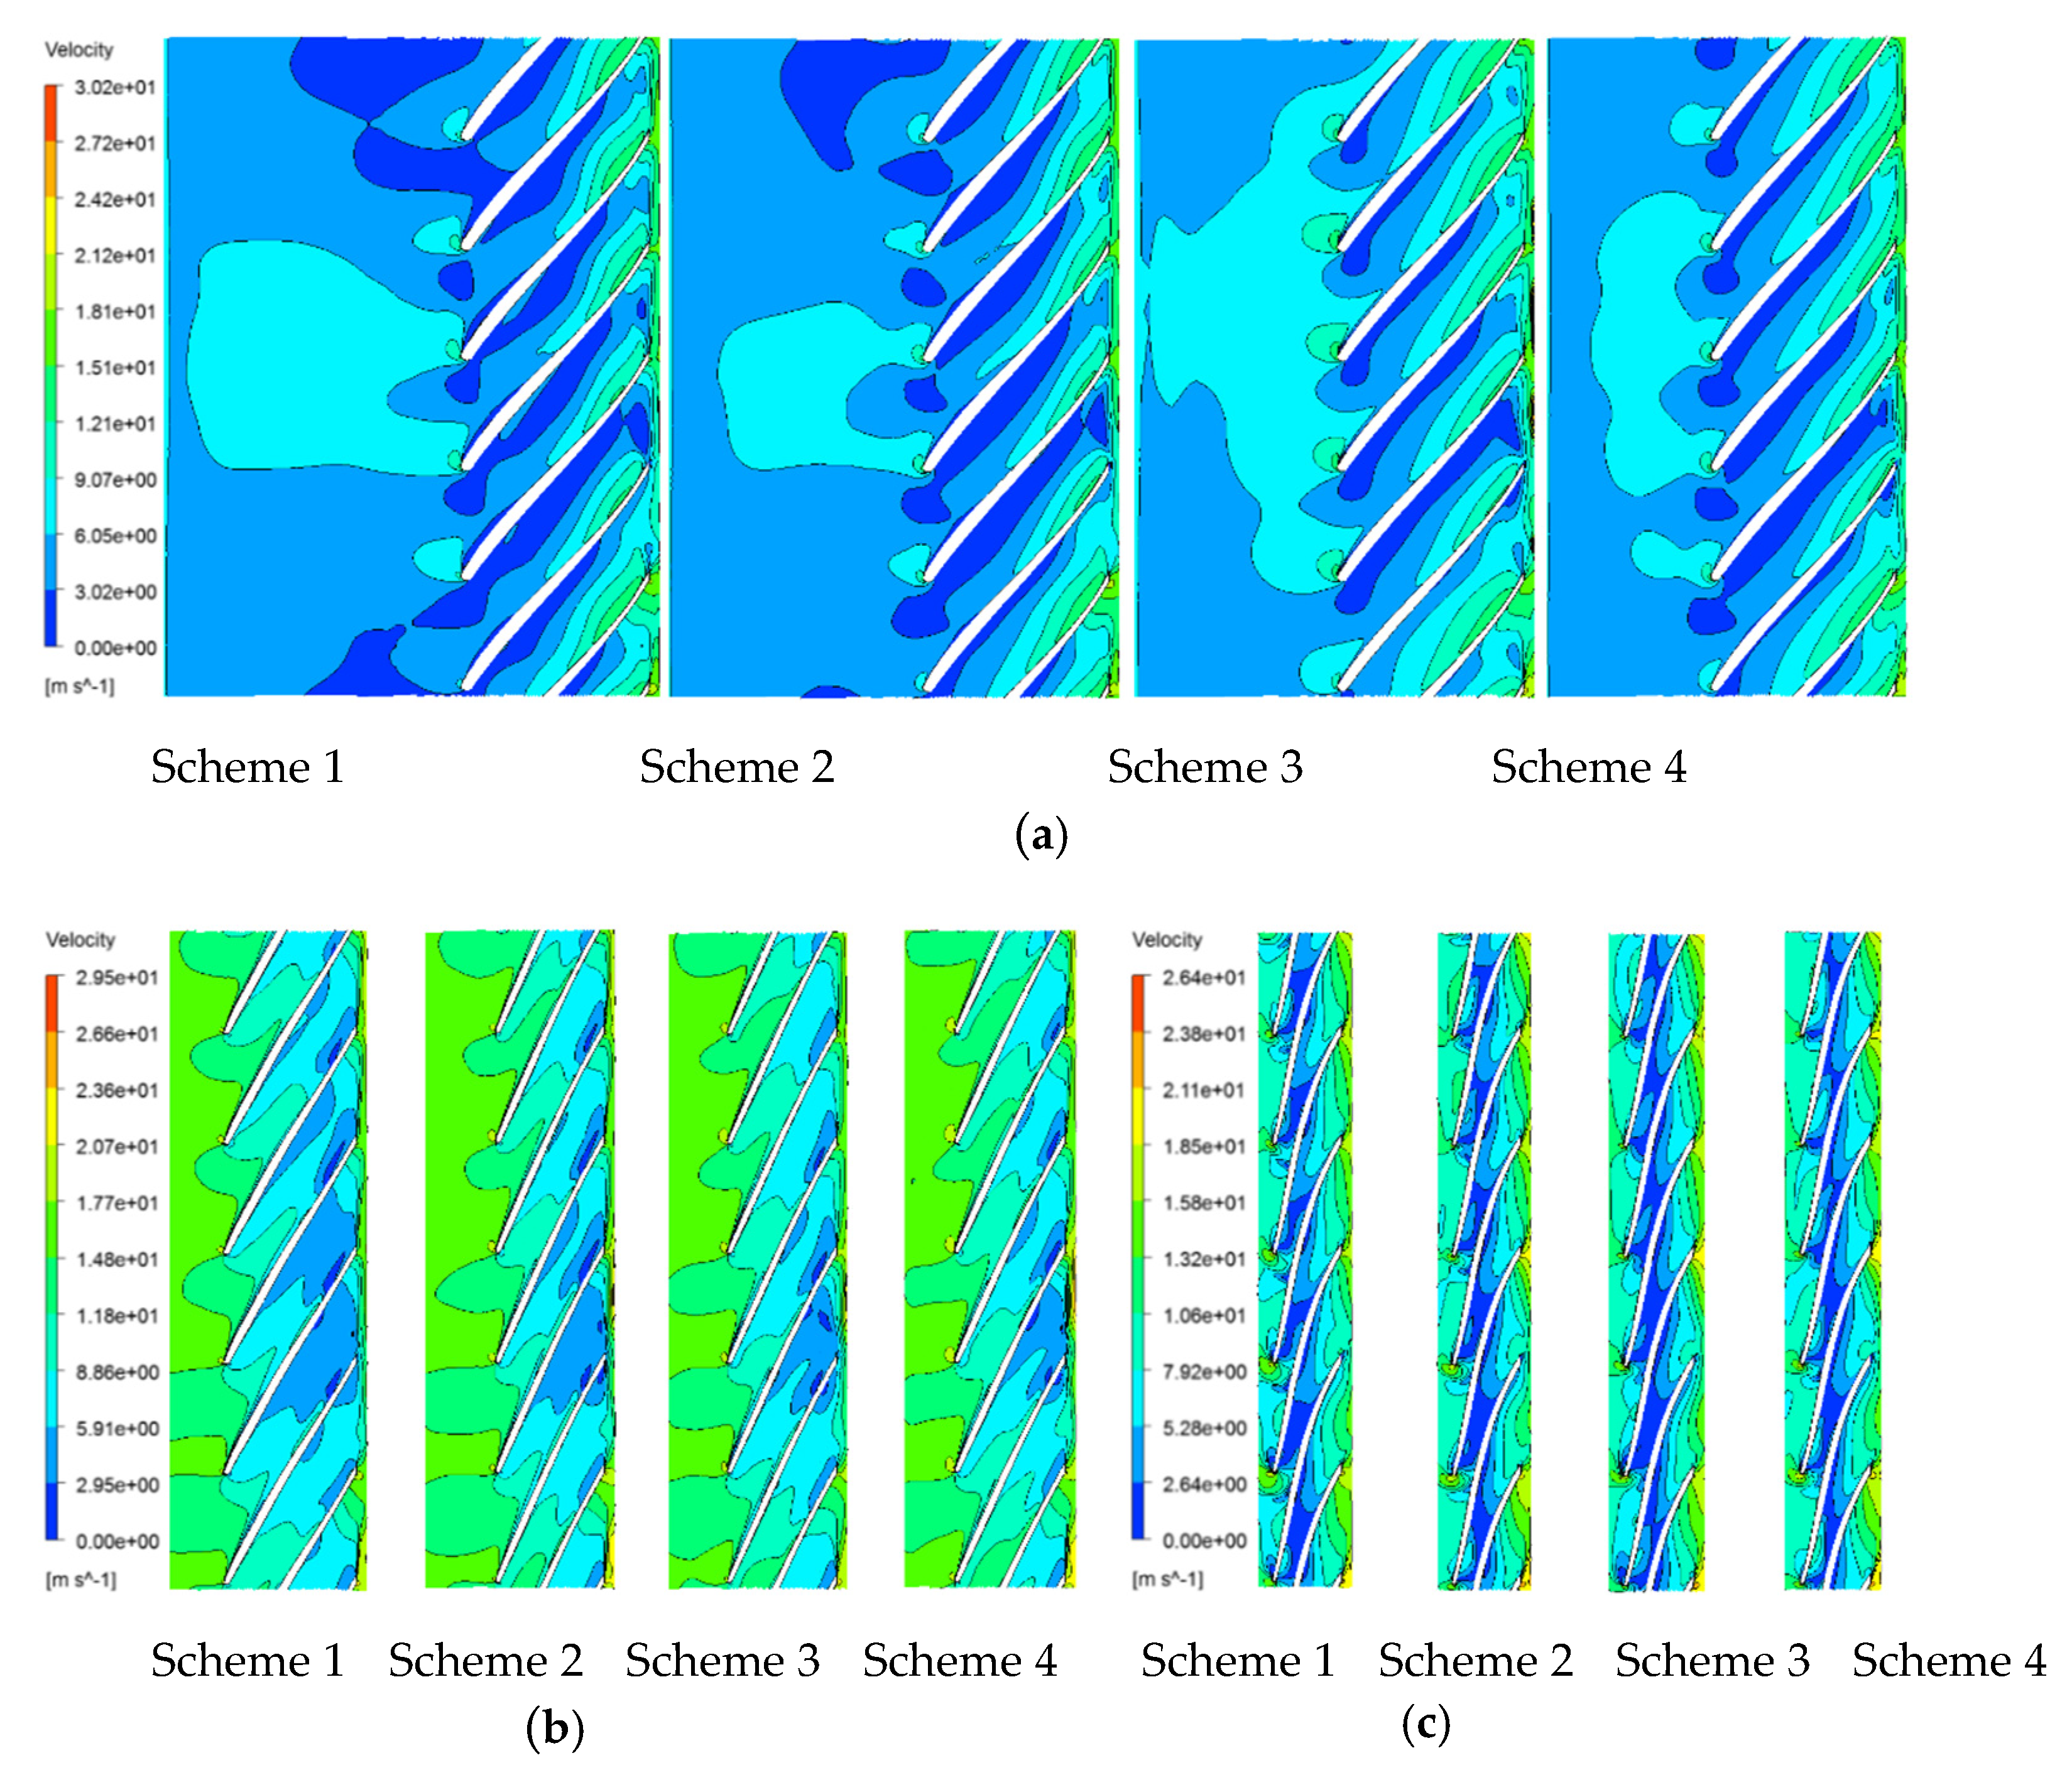
Figure 4 presents the velocity distribution of the inner circumference of the four schemes under part-load flow conditions. It found that the velocity distribution of the impeller inlet on the hub (Span 0) is relatively disordered, and the different degrees of low-speed clusters are generated on the pressure surface. Meanwhile, with an increase in the hub radius, the area of the low-speed zone gradually decreases. As the circumferential surface moves towards the shroud, the area of the low-speed clusters decreases further, and the formation location shifts from the leading edge of the pressure surface to the trailing edge. However, the low-speed clusters are transferred from the pressure surface to the suction surface on Span 0.5, and the area of the low-speed clusters with a smaller hub radius was still significantly large. When the circumferential surface moves from Span 0.5 to Span 1, the low-speed clusters gradually shift from the trailing edge to the leading edge, and the area continuously increases. What is more, the streamline contour is pushed onto the pressure distribution diagrams to further investigate the flow characteristics with different meridian profiles, as shown in
Figure 5. The four schemes have similar pressure distribution on the same circumferential surface, but there are large differences in the streamline contour.
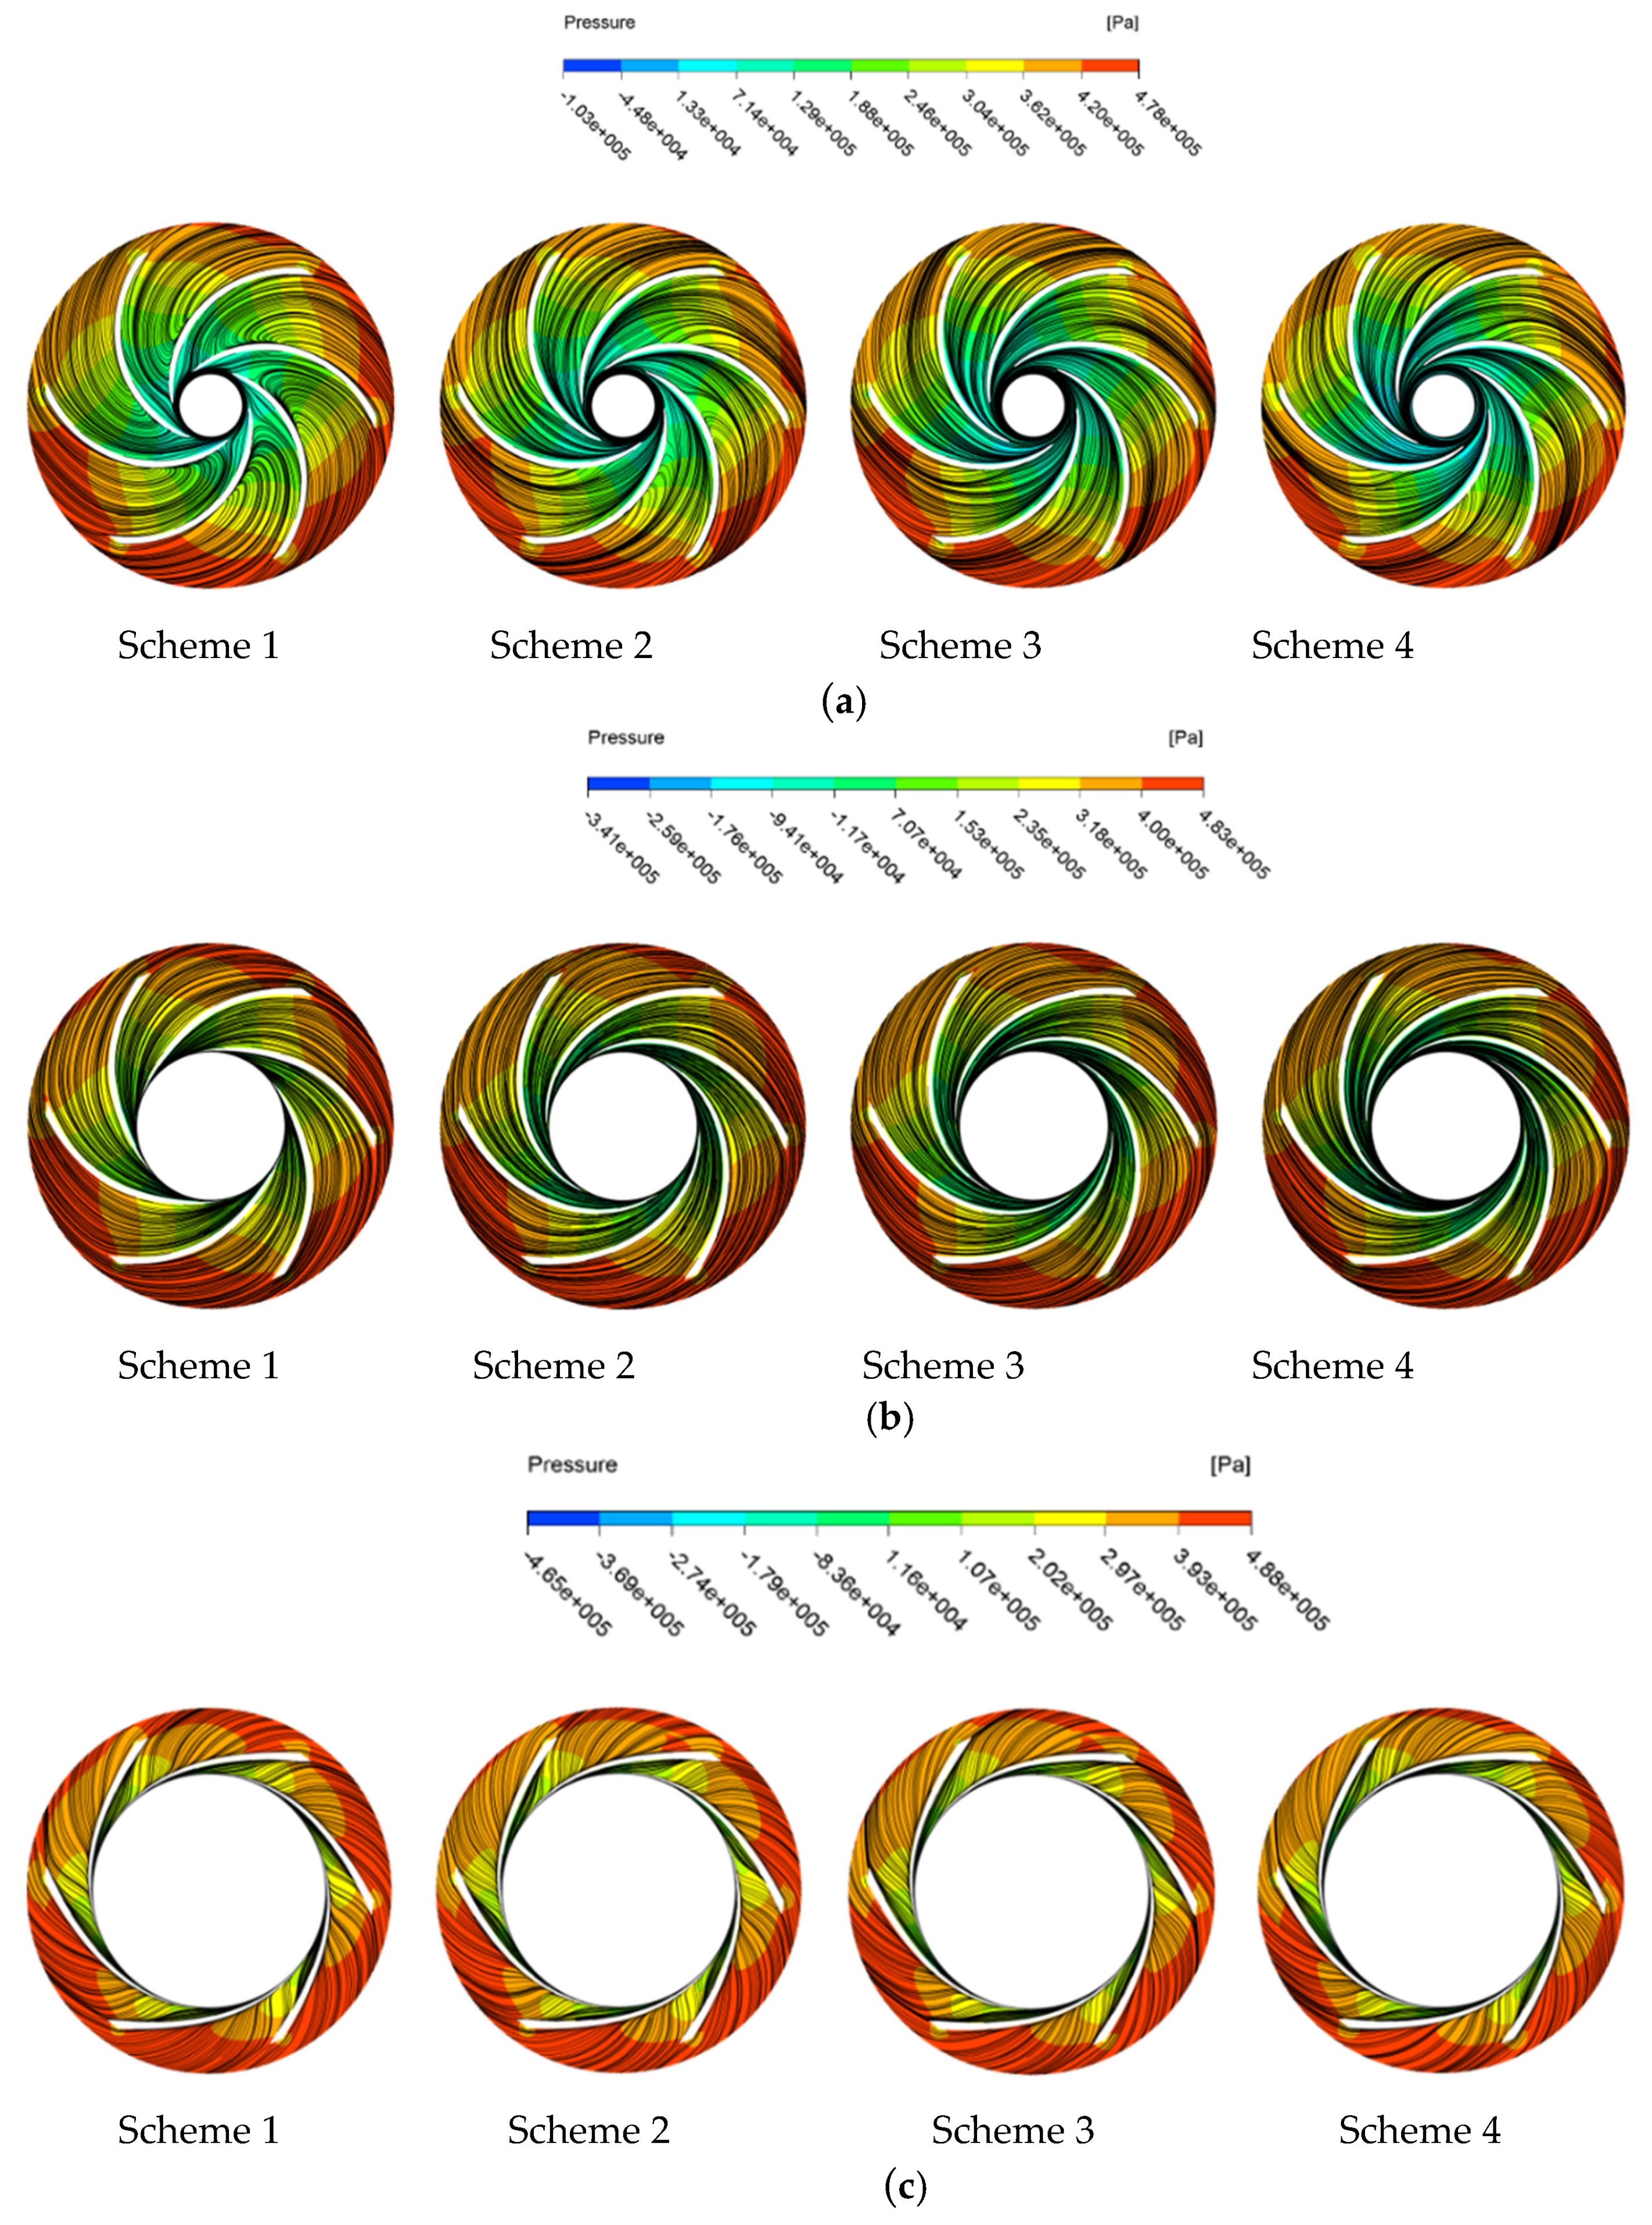
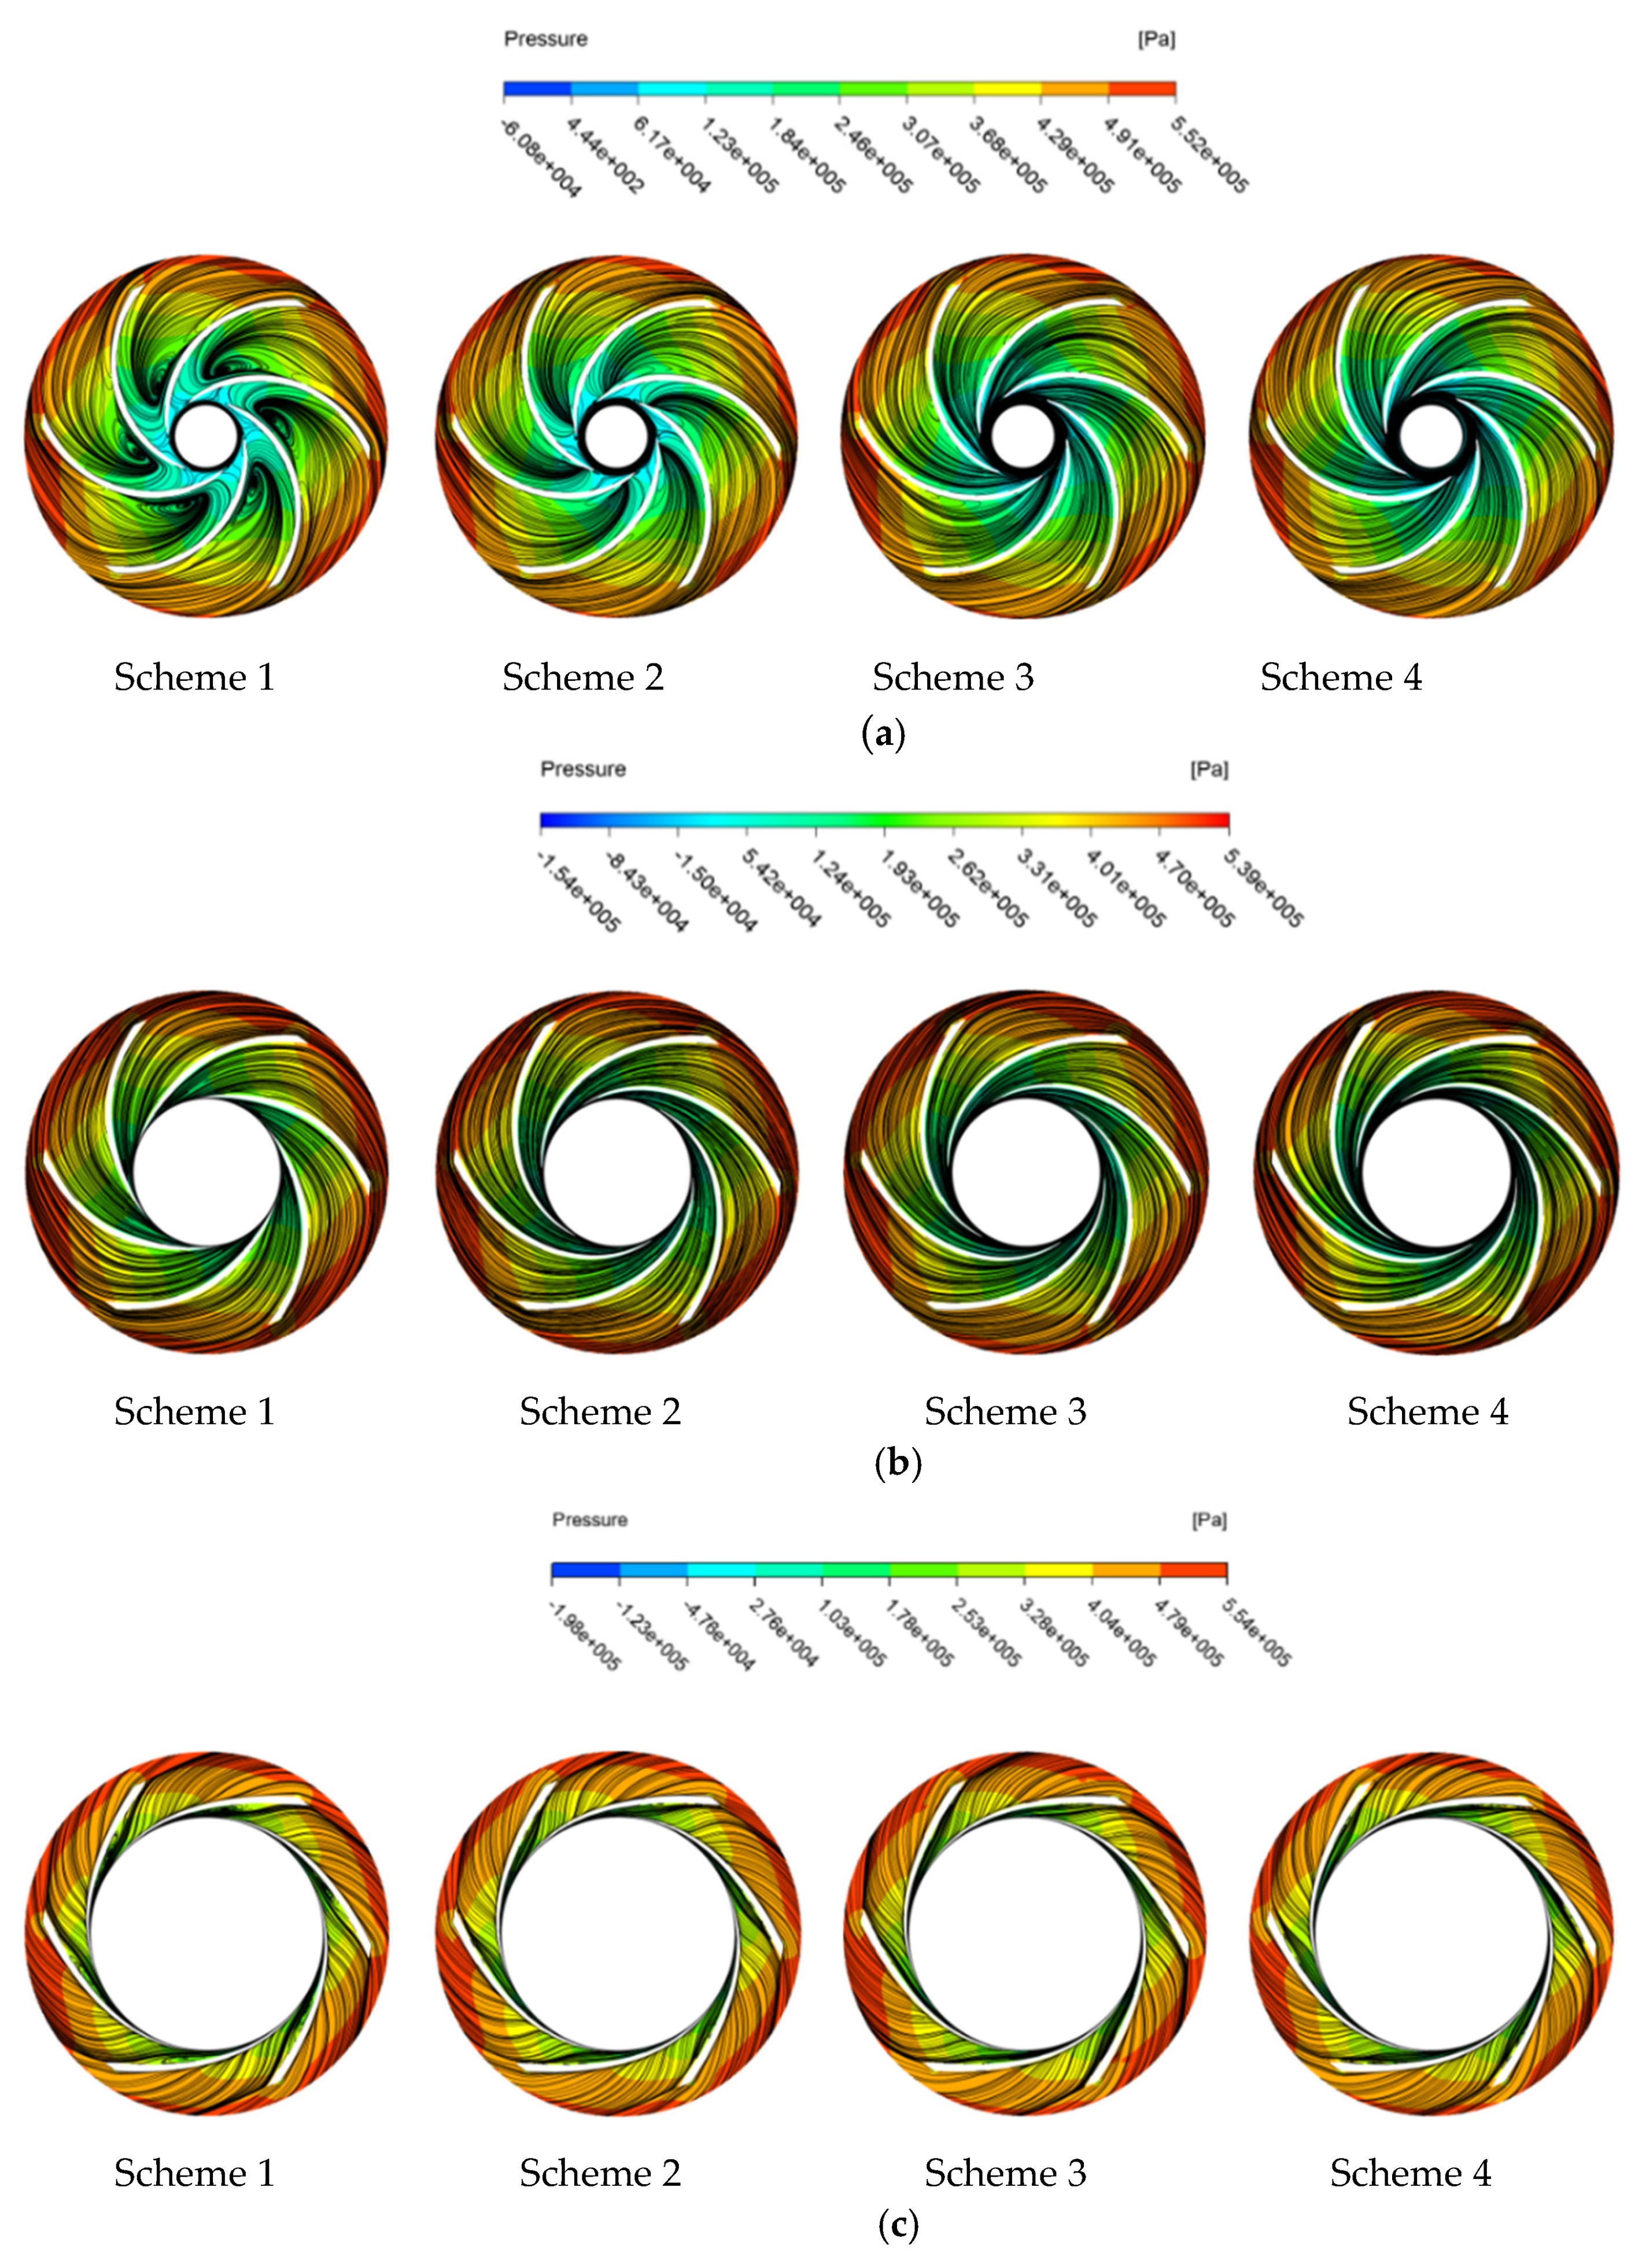
As shown in
Figure 5a, an obvious vortex is generated at the trailing edge of the pressure surface in Scheme 1; by comparing the velocity distribution, it can be found that the vortex is mainly generated in the low-speed clusters. At the same time, under the effect of rotor-stator interaction between the impeller and volute tongue, obvious vortices are formed at the trailing edge of the blade close to the volute tongue. However, with the increase in hub radius, the strength of the vortex decreases continuously. As the circumferential surface moves forward to the shroud, the vortex of each scheme is reduced, and the flow channels affected by the vortices in Scheme 1 are also significantly declined. Furthermore, the backflow at the trailing edge of the suction surface gradually shifts to the leading edge. At the same time, the intensity of the vortex gradually weakens with the increase in the curvature of the hub.
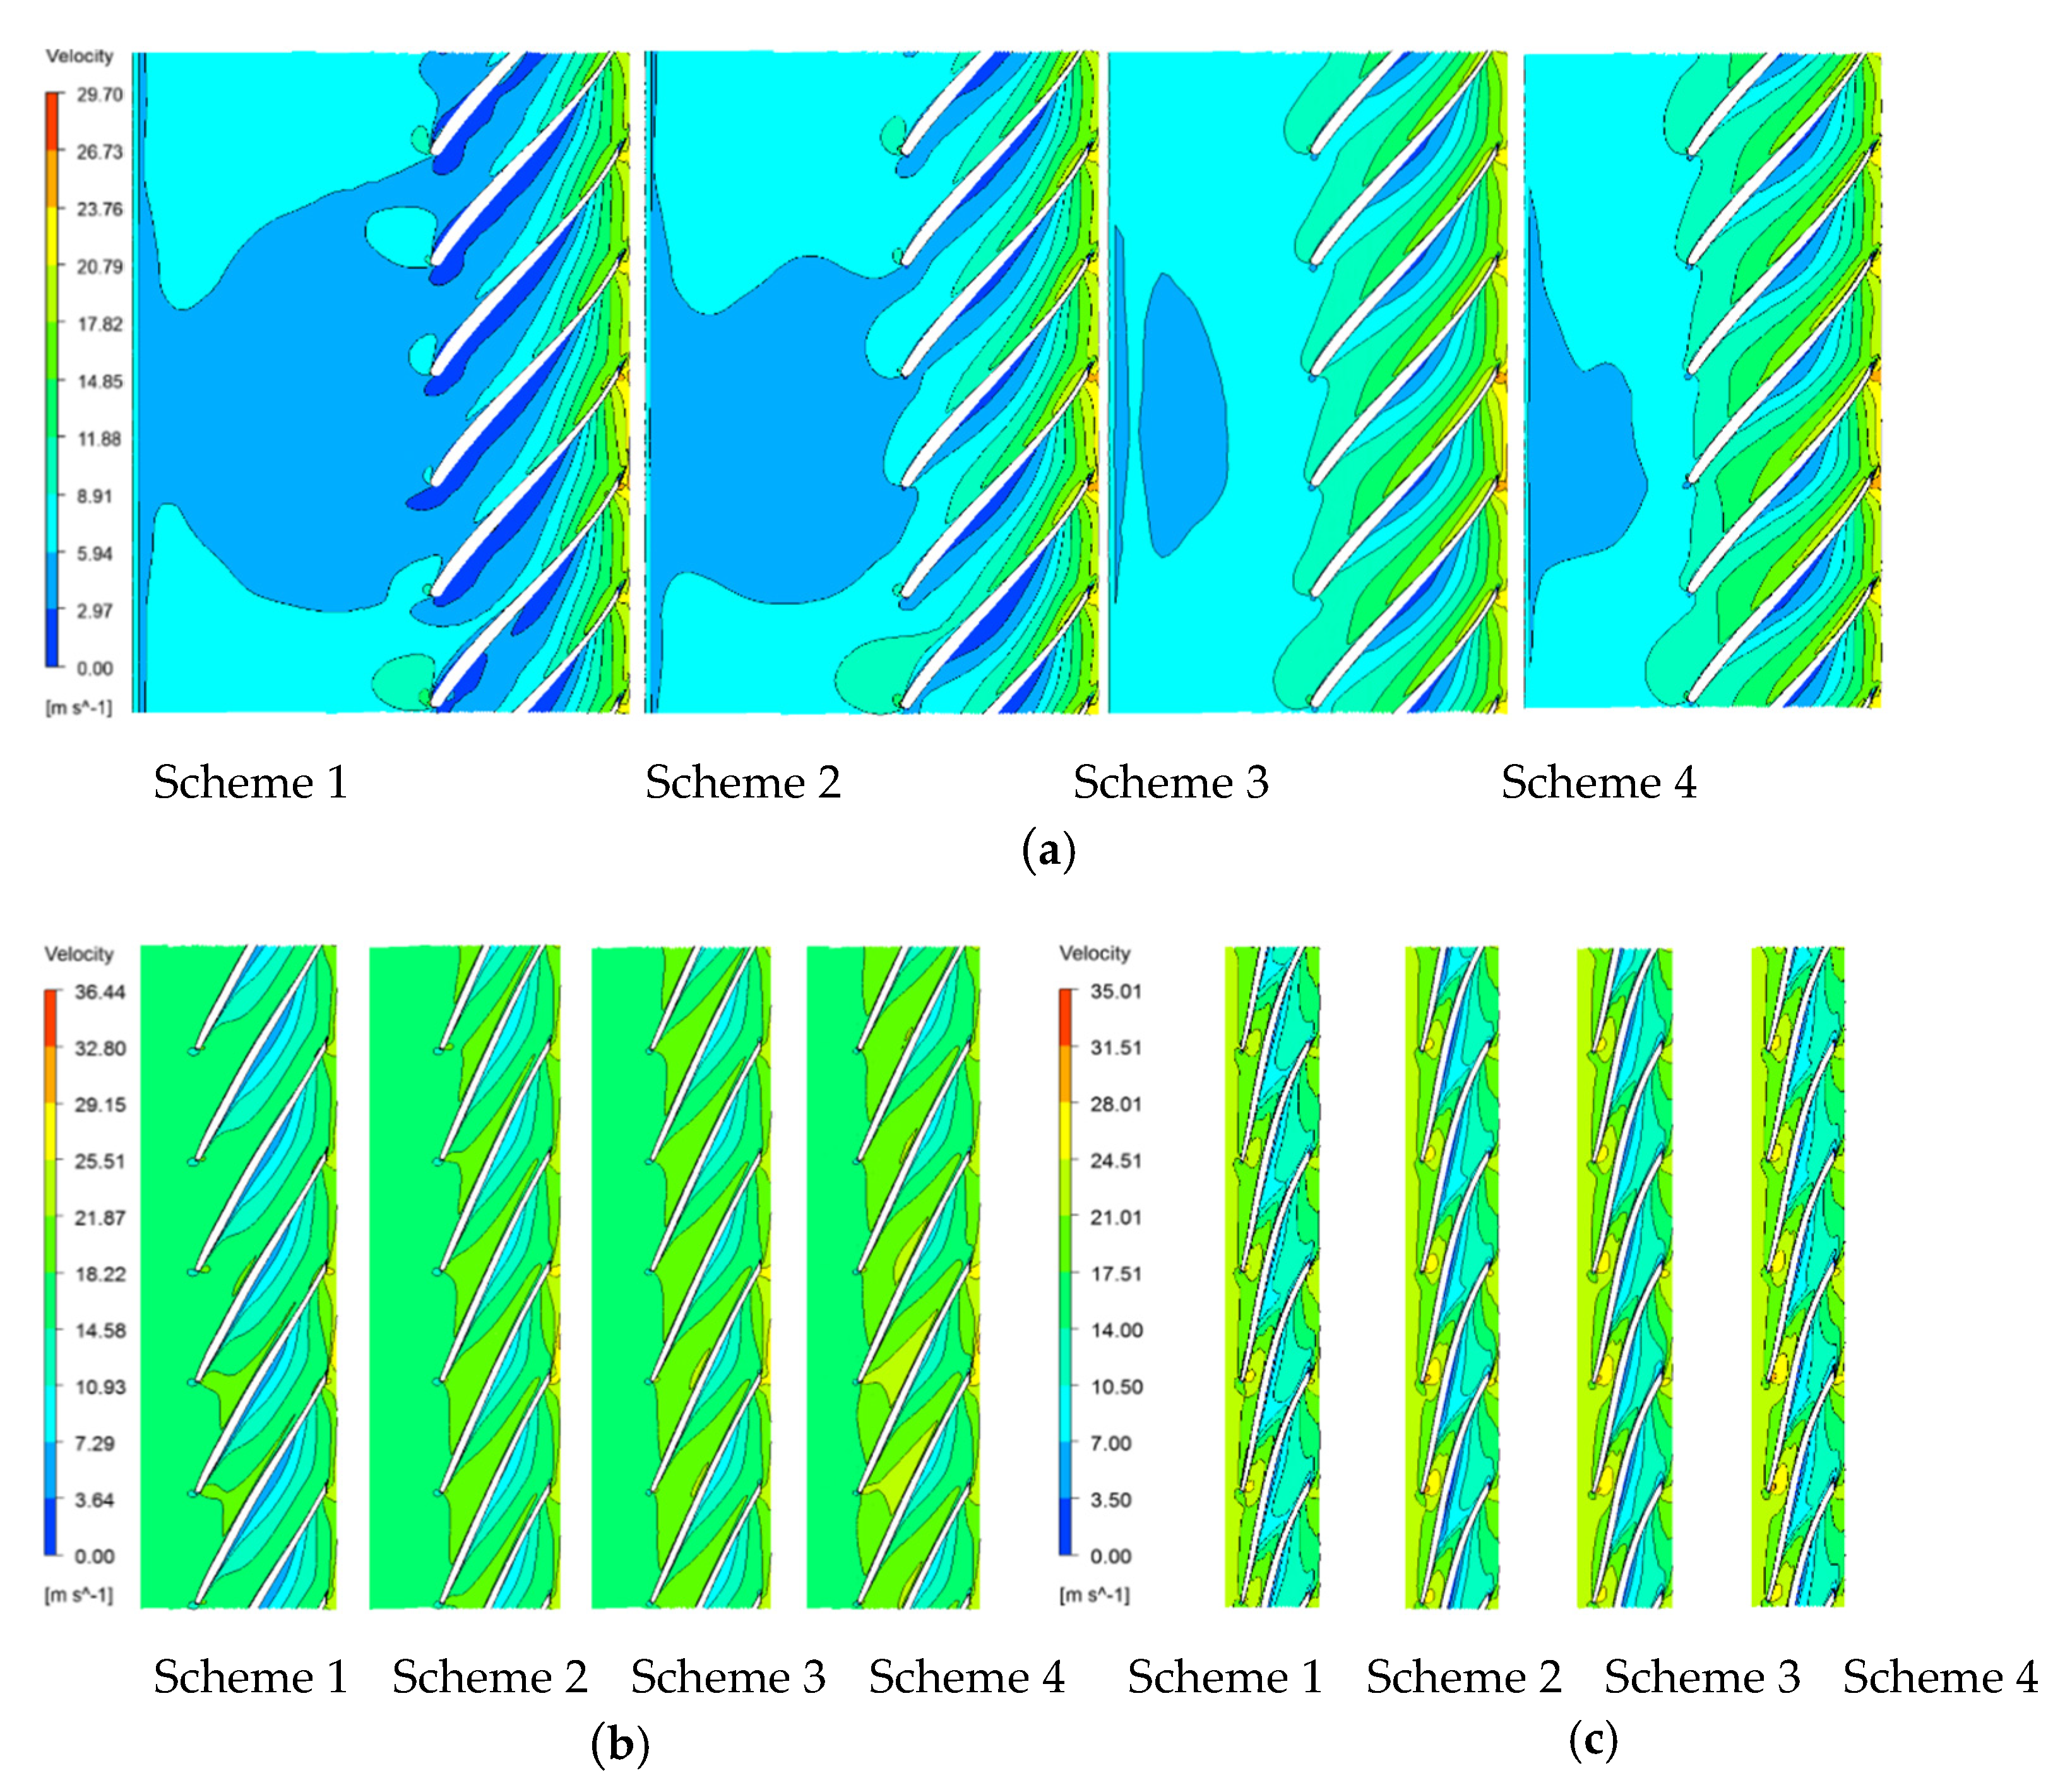
Figure 6 presents the velocity distribution of the impellers under optimal flow conditions; the area of low-speed clusters significantly decreases compared with part-load flow conditions. Furthermore, low-speed clusters can be found on the pressure and suction surface of Scheme 1, and the area on the pressure surface is significantly larger than the suction surface. When the radius of the hub continues to increase, the area of the low-speed clusters on the pressure surface of Schemes 3 and 4 continuously reduces, which is mainly concentrated in the middle of the blade. When the circumferential surface moves from the hub to the shroud, the low-speed area is gradually declined and transferred to the middle of the suction surface. Furthermore, the low-speed area of the scheme with a large hub radius is still larger than the small one.
Figure 7 shows the pressure and streamline distribution under optimal flow conditions. It can be found that the pressure distribution of each scheme is uniform on different circumferential surfaces, which has a similar variation rule. However, with the increase in hub radius, the area of high pressure at the trailing edge gradually decreases. By comparing the streamline diagrams of the internal flow field, obvious vortices are formed at the leading edge of the pressure surface under Span 0. The vortex is constantly weakened and eliminated with the rising of the hub radius. Furthermore, as the circumferential surfaces moves towards the shroud, only a few vortices are generated at the leading edge, and the intensity of the vortices is significantly weakened. What is more, no vortices are found in the impeller flow channels; the streamlines are smooth under Span 0.5, but only a small amount of vortices are formed on the leading edge of the suction surface under Span 1.
As shown in
Figure 8, according to the velocity distribution of each scheme under overload flow conditions, it can be seen that the variation trend of the internal flow field under optimal flow conditions is similar to the part-load condition; also, under optimal flow conditions, a large area of the low-speed zone is generated at the leading edge with a smaller hub radius scheme, while the area of the low-speed zone continues to decrease as the hub radius increases. At the same time, the low-speed zone in Scheme 1 extends from the leading edge to the trailing edge. However, as the hub radius continues to rise, the area of the low-speed zone continues to shrink and concentrates in the middle of the blade pressure surface. As the circumference moved from the hub to the shroud, the low-speed zone on the blade pressure surface decreased continuously until it completely disappeared. What is more, the low-speed region does not appear on the suction surface, which is different from the velocity distribution under part-load conditions and design-flow conditions.
Figure 9 presents the pressure and streamline distribution of different schemes under overload conditions. Compared with part-load conditions and overload conditions, except for the slight vortices found on Span 0 in Schemes 1 and 2, the internal streamlines of the other schemes are all smooth. When the circumferential surface moved from the shroud to the hub, no obvious vortices were observed. At the same time, the area of the high-pressure area gradually decreases with the rising of the hub radius. The main reason for this phenomenon is that the curvature of the hub is small, which causes a large flow area in the impeller. When the water flows axially into the impeller along the inlet pipe, the radial flow area increases, which results in serious diffusion, and the velocity distribution is very disorderly. The backflow is formed at the hub, and the vortex appears in the impeller. When the radius of the hub increases continuously, the bending degree of the whole meridian channel increases and flow conditions in the impeller improve significantly, which makes it more in line with the optimal flow rule. Therefore, the reasonable design of the back cover of the impeller is of great significance to restrain the backflow and improve internal flow conditions.
5. Analysis of Blade Surface Load Characteristics
The blade surface load can not only effectively explain the stress condition of the blade in operation, but also reflect the energy conversion ability of the blade. Therefore, the analysis of blade surface load is beneficial to improve the safe and stable operation of the blade.
Figure 10 compares the blade surface load distributions at the different flow conditions (300 m
3/h, 500 m
3/h, and 700 m
3/h) on Span 0.5, where the abscissa represents the relative position along the blade streamline direction. When the relative streamline position is 0, it represents the blade leading edge; when the relative streamline position is 1, it represents the blade trailing edge. The vertical coordinate is the blade surface pressure value, monitored at the corresponding streamline position. What is more, it can be seen from the figure that blade surface load is mainly composed of two curves, which represent the pressure on the pressure surface and the suction surface, respectively, and the difference between the two curves is the blade surface load. By comparing the blade surface load distribution under part-load conditions, optimal flow conditions, and overload conditions, it can be found that the blade load distribution has a similar variation trend. The pressure on the pressure surface and the suction surface shows an upward trend as a whole. However, the curve of the pressure surface first drops sharply near the leading edge of the blade and then rises at a constant speed. Meanwhile, there is a position where the pressure on the pressure surface is equal to the suction surface, so the blade surface load is zero, namely, the first zero load point. This phenomenon is attributed to the collision between the incoming flow and the leading edge of the blade, since the velocity direction of the liquid changes suddenly under the effect of the blade, which causes dramatic variation in the pressure. At the same time, by comparing the different meridian schemes, it is found that the first zero load point gradually moves away from the leading edge when the hub radius continues to increase.
After the relative streamline position passes the first zero load point, the pressure on both the pressure surface and the suction surface increases continuously, but the growth rate on the pressure surface is significantly higher than the suction surface, which results in the load on the blade surface gradually increasing. Then, the growth rate on the pressure surface gradually decreases, while the pressure on the suction surface still keeps an upward trend, making the load on the blade surface decline gradually. Therefore, when the pressure on the pressure face reaches the maximum, the blade load reaches the maximum; namely, the energy conversion capacity of the blade is the strongest. By comparing the maximum load points under the different flow conditions, it can be found that, with the continuous increase in flow, the position of the maximum load point is further away from the trailing edge. Then, the pressure on the pressure surface continued to drop, and the descending rate gradually accelerated. The pressure on the suction surface rises uniformly, which intersects with the pressure curve of the pressure surface near the trailing edge; that is, the pressures on the pressure surface and on the suction surface are equal for the second time. The formation of the second zero load point is attributed to the influence of the stator-rotor interaction between tongue and blade. By comparing the relative positions of the second zero load point under the different flow conditions, it can be seen that with the increase in flow rate, the second zero load point is constantly away from the trailing edge of the blade.
Therefore, by comparing the blade surface loads under the different flow conditions, it can be found that the blade load increases first and then decreases along with the streamline position, while the blade surface load continues to enhance as the flow increases. At the same time, as the hub radius increases, the blade surface load continuously increases, which effectively improves the ability of the blade to work on the internal flow field.
6. Analysis of Pressure Pulsation Characteristics
6.1. Distribution of Pressure Fluctuation Monitoring Points
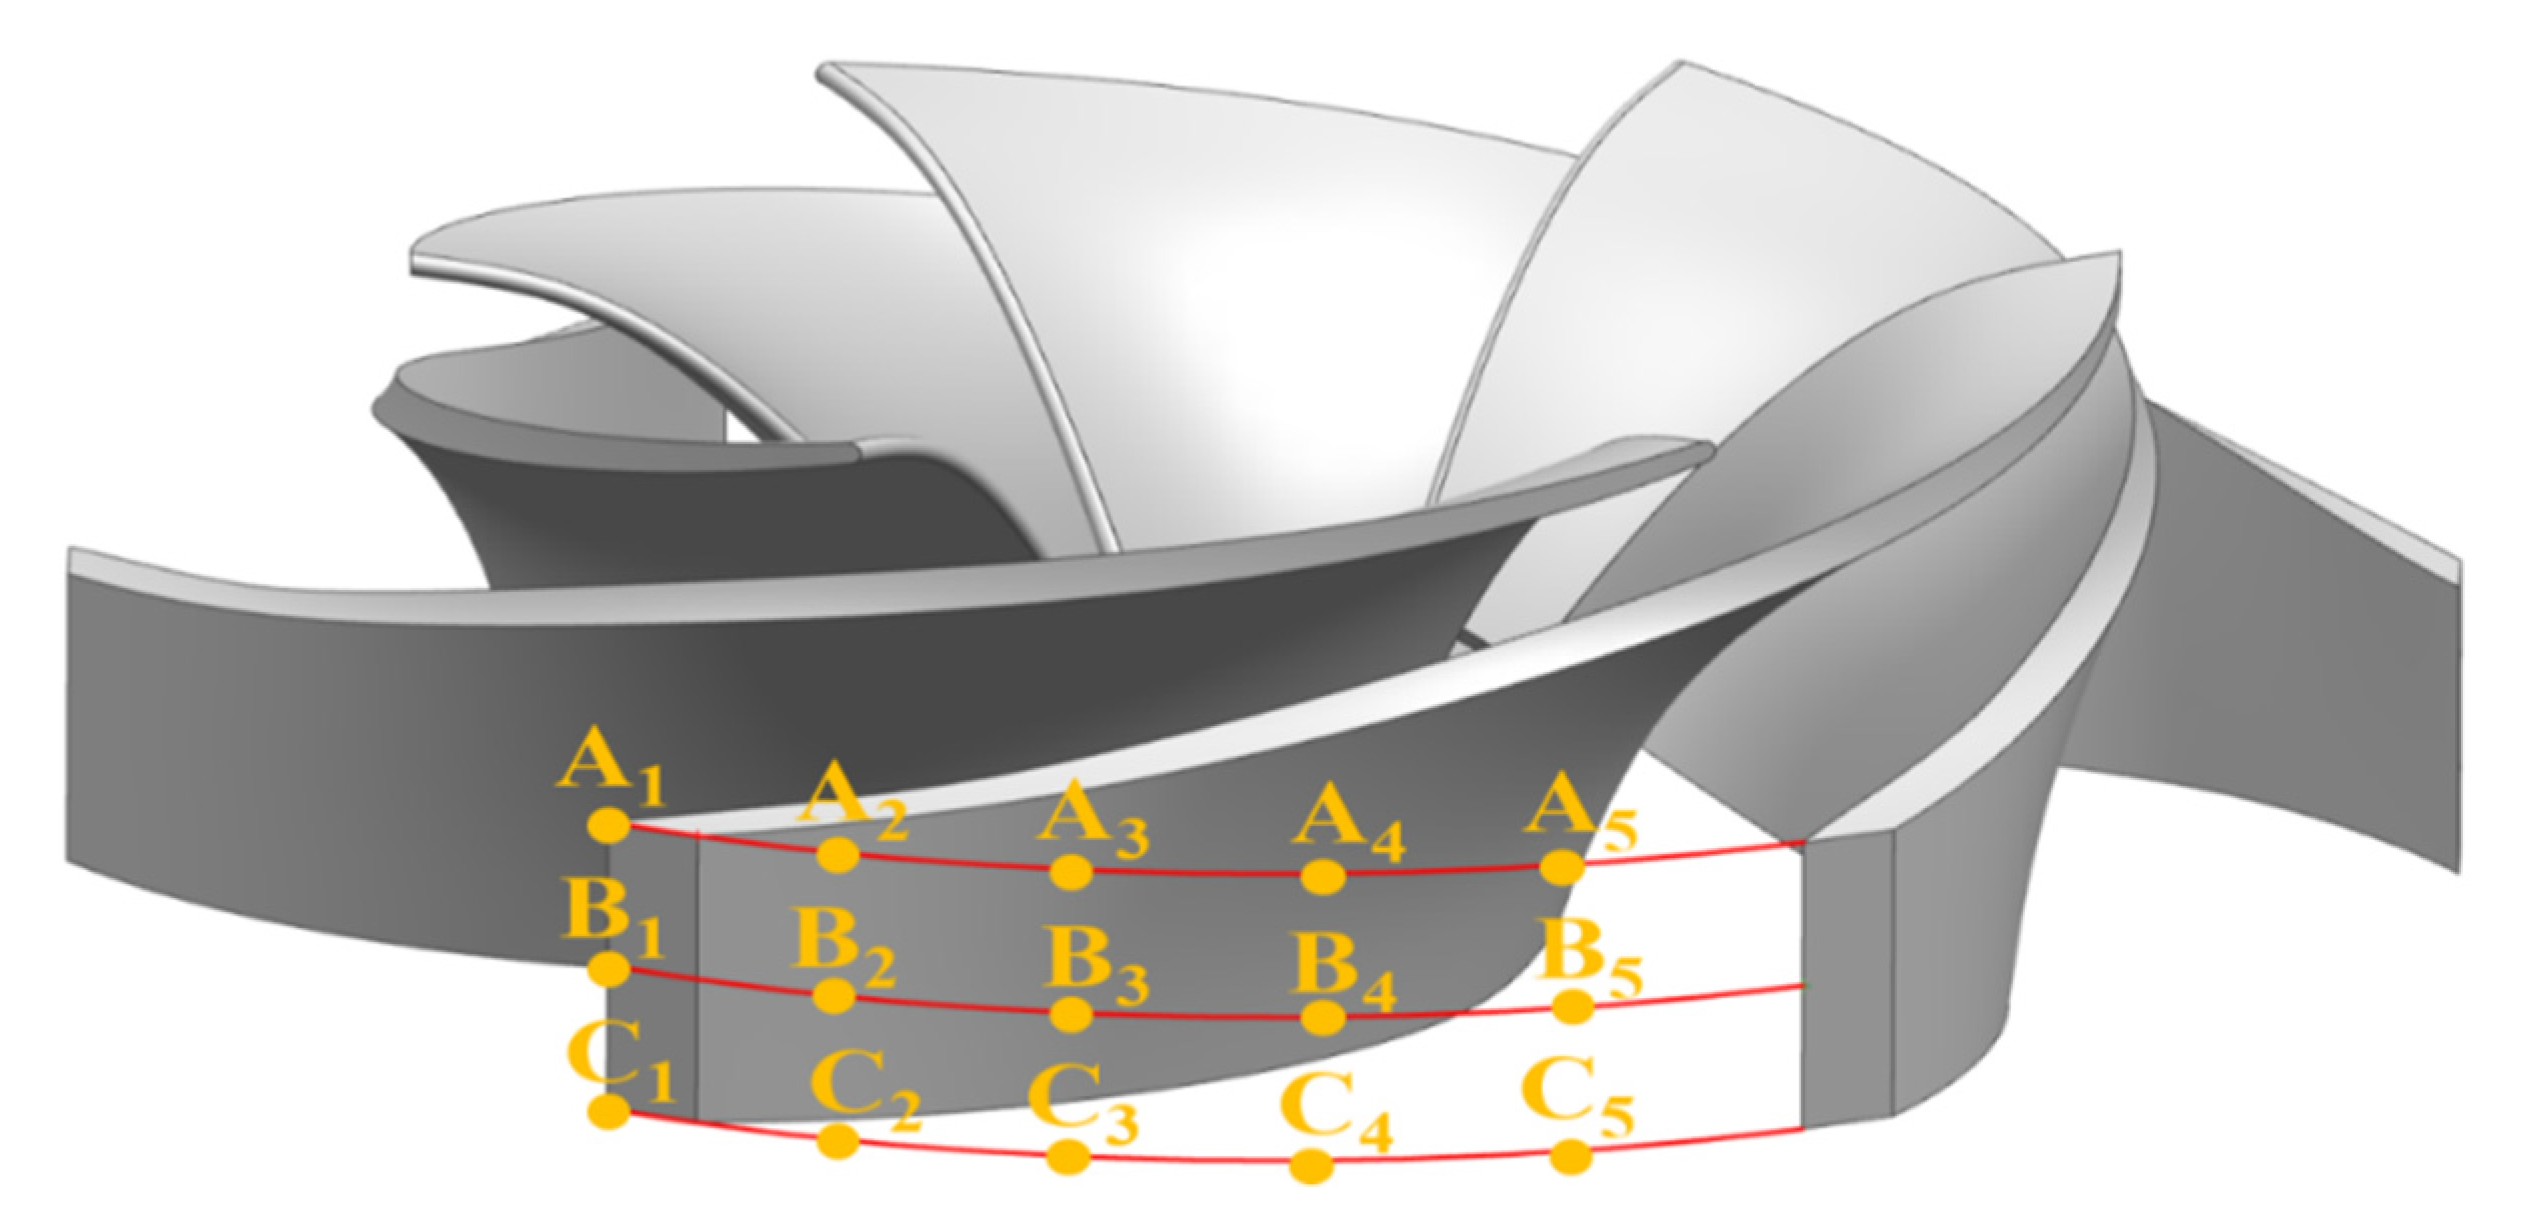
In order to ensure the stable and efficient operation of the self-priming centrifugal pump, the pressure fluctuation characteristics caused by pressure fluctuation and mechanical vibration must be fully considered. The pressure pulsation can not only destroy sealing parts and fixed support parts, but also induce noise. In particular, vibration will aggravate the fatigue and failure of the self-priming centrifugal pump, shortening the service life of the whole unit significantly. Therefore, the pressure pulsation can not only directly describe the relationship between the pressure in the flow channel with time, but also indirectly reflect the instability of the self-priming centrifugal pump. Therefore, in this section, by setting up pressure pulsation monitoring points at the trailing edge of the impeller flow channel, the variation of pressure pulsation with time by numerical simulation can be analyzed. Since the swept angle by a single impeller is 60°, the trailing edge of the blade is taken as the starting edge, and the trailing edge of the secondary blade is taken as the ending edge. When the blade rotates 10°, pressure pulsation monitoring points are set on the circumferential surfaces of Span 0, Span 0.5, and Span 1, respectively. Among them, the pressure pulsation monitoring points on the circumference of Span 0 are C1, C2, C3, C4, and C5; the pressure pulsation monitoring points on the circumference of Span 0.5 are B1, B2, B3, B4, and B5; and the pressure pulsation monitoring points on the circumference of Span 1 are A1, A2, A3, A4, and A5, respectively. The pressure pulsation monitoring points are all distributed on the calculation domain of the rotating impeller, as shown in
Figure 11.
6.2. Analysis of Pressure Pulsation
In order to improve the accuracy of the analysis, the calculated pressure pulsation data are processed into a dimensionless format, and the pressure pulsation distribution at the trailing edge of the different schemes under the three flow conditions are obtained, respectively, as shown in
Figure 12,
Figure 13,
Figure 14 and
Figure 15. Among them, the dimensionless pressure pulsation data can be calculated by the following formula [
22]:
where
and
represent the time-averaged and periodic pressure, respectively,
N and Δ
t are the total time step and time step, respectively,
u2 represents the peripheral velocity of the impeller outlet,
Cp is the dimensionless pressure pulsation coefficient, and
ρ represents the liquid density.
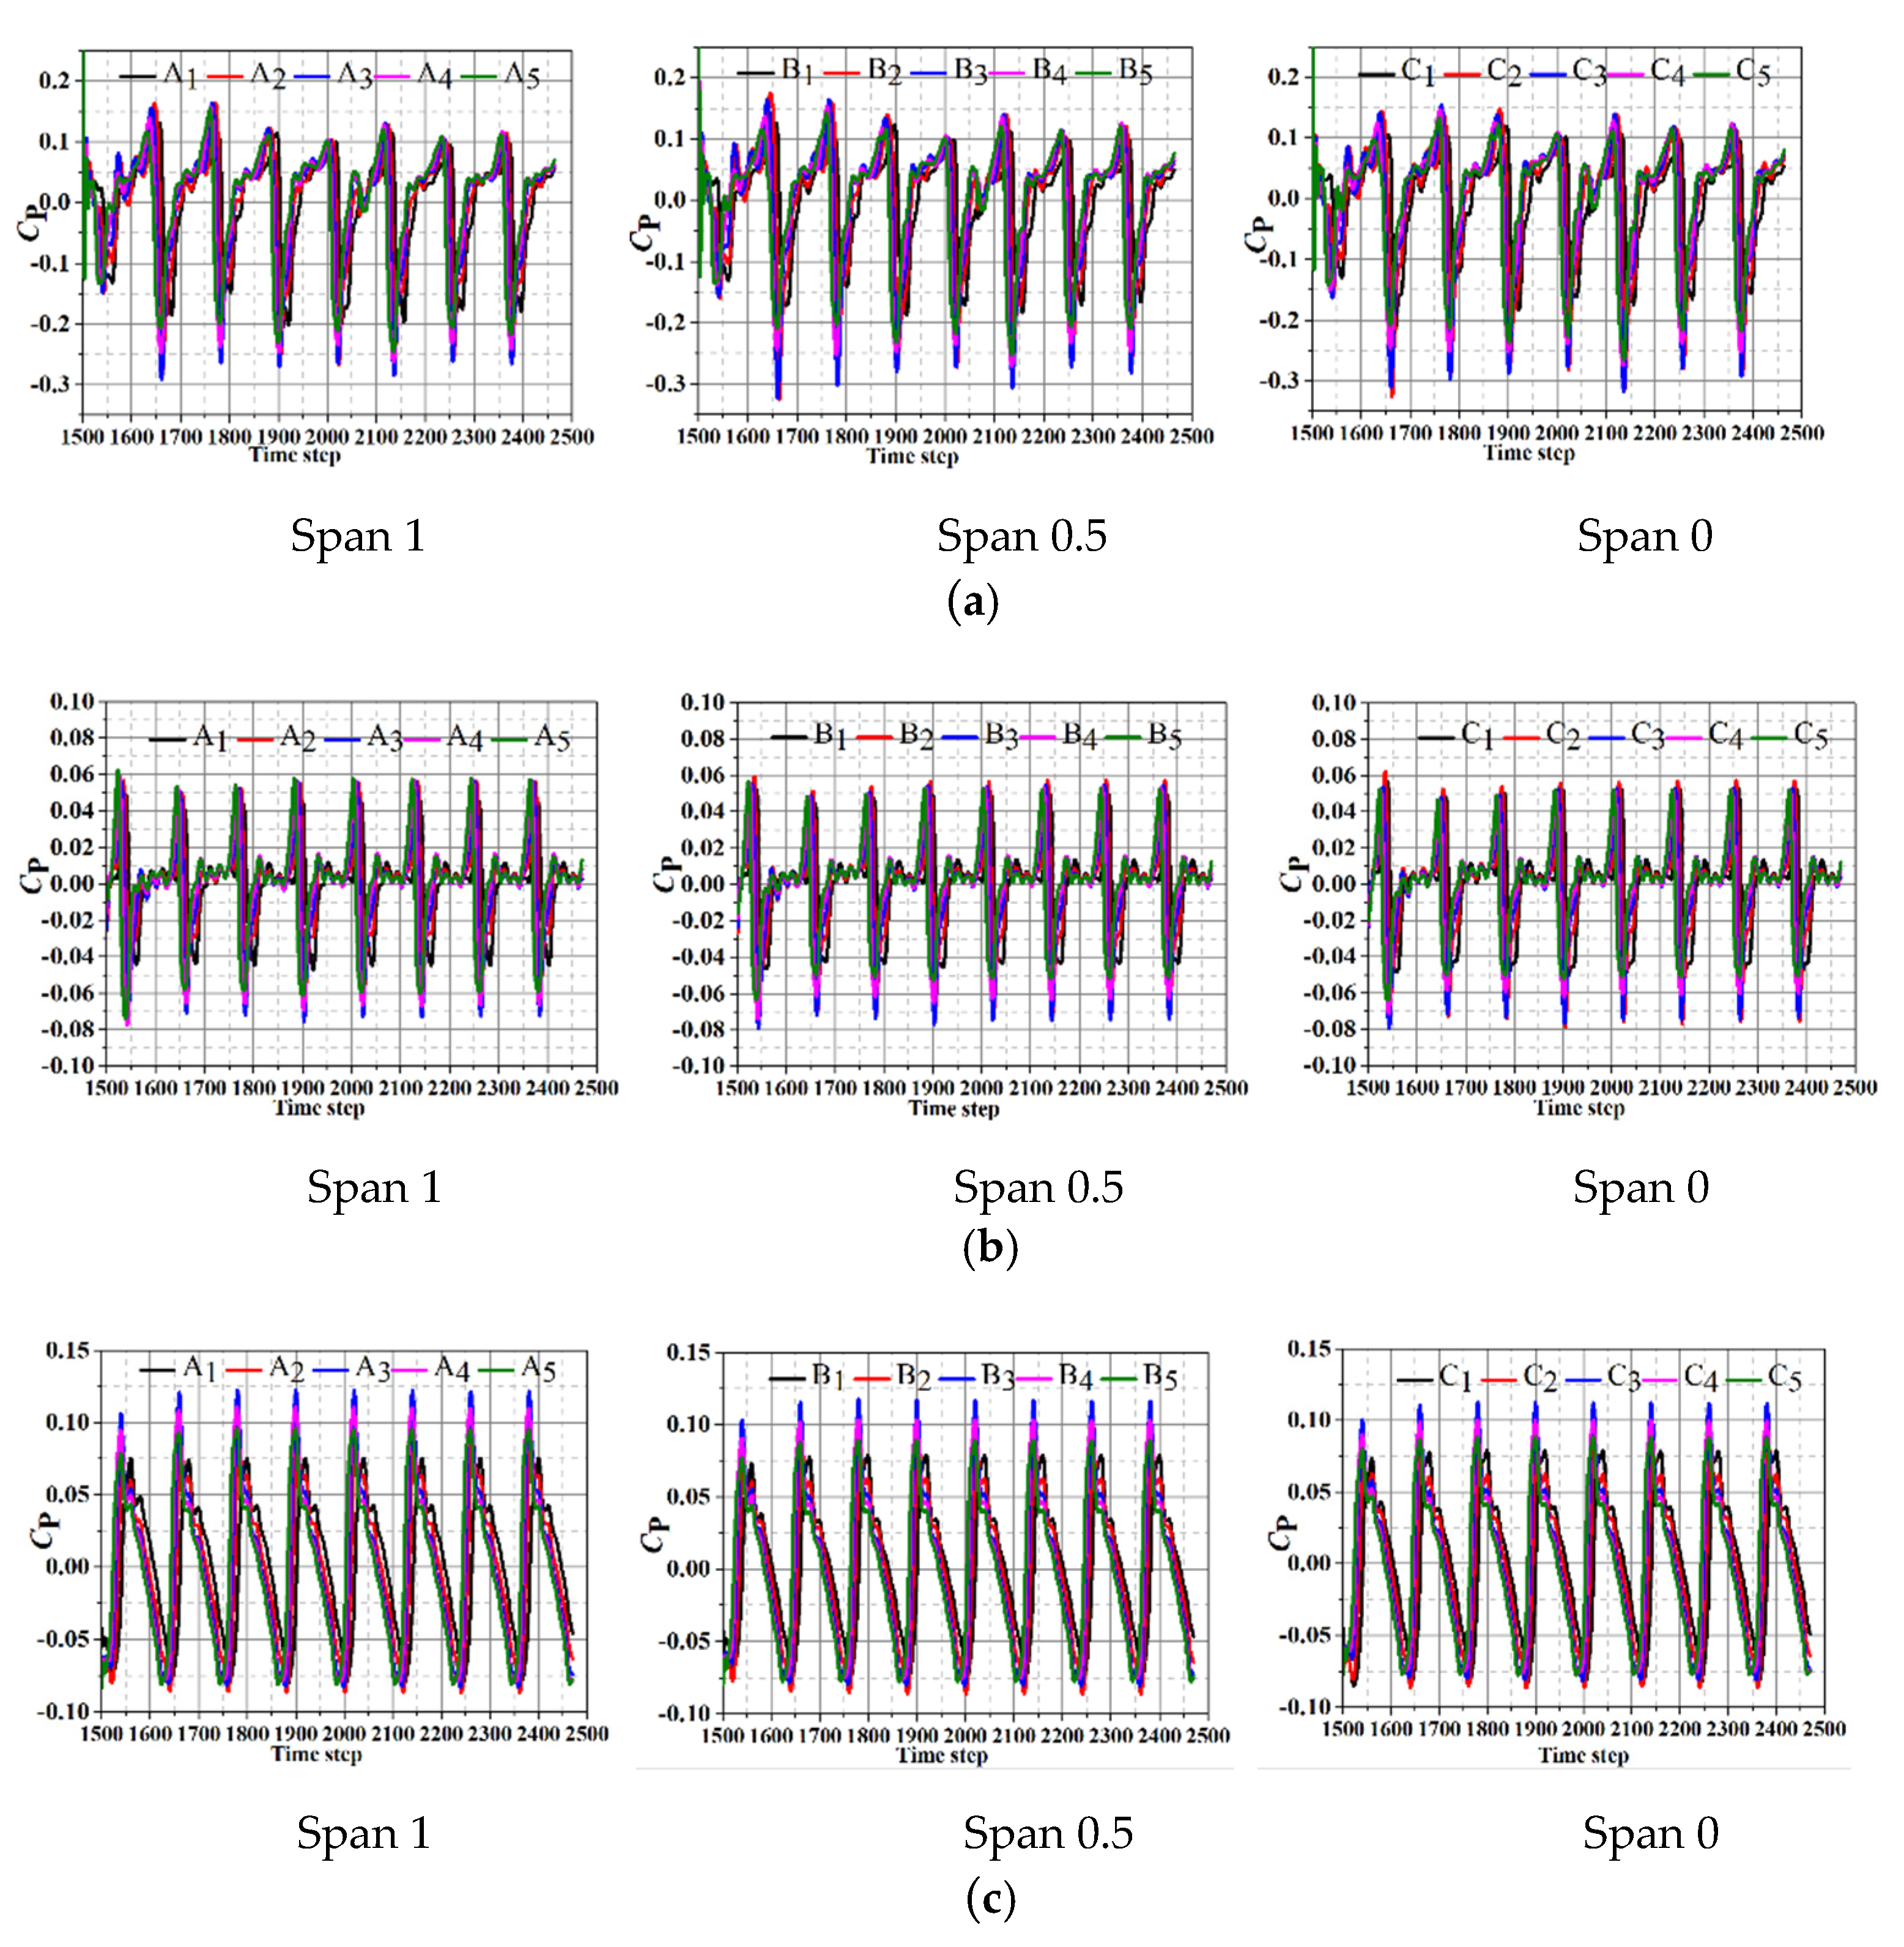
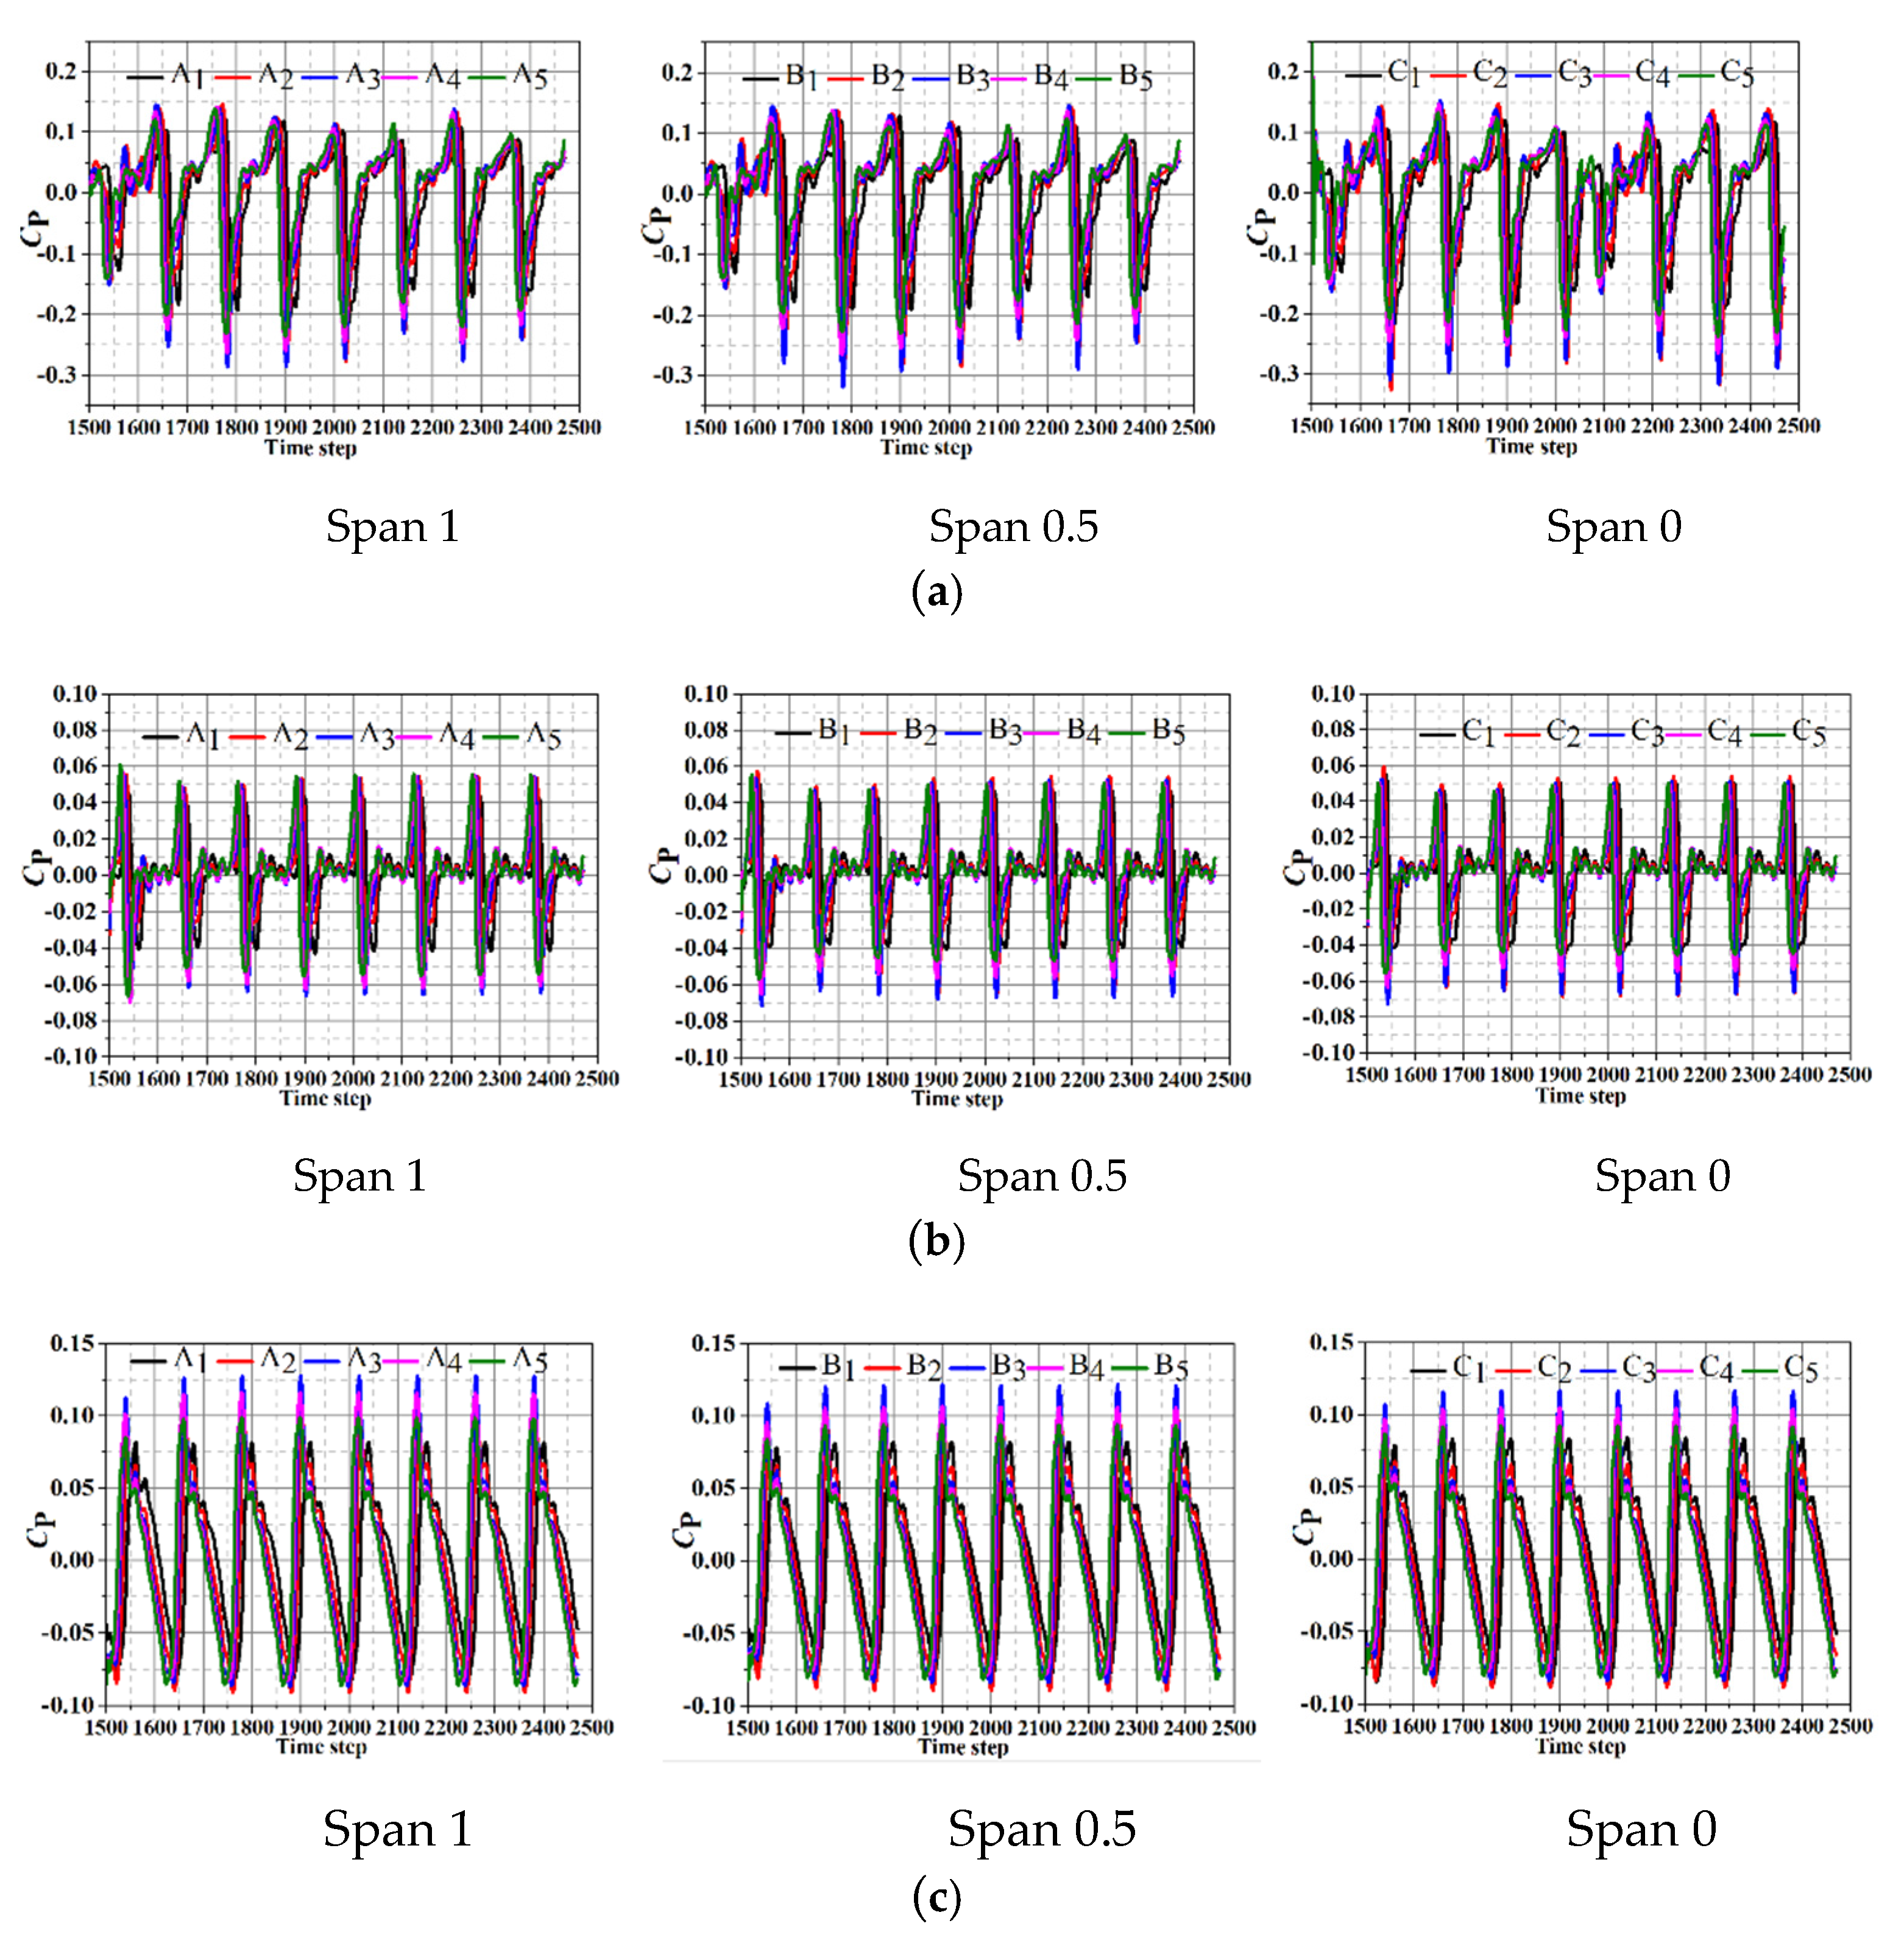
The pressure pulsation distribution on Span 1, Span 0.5, and Span 0 under the three flow conditions of Scheme 1 are shown in
Figure 12. It can be found that each scheme presents periodic peaks and troughs under the different flow conditions. Since monitoring points are set in the rotation domain of the impeller, only one stator-rotor interaction is generated in one revolution; thus, each monitoring point only has one trough in a calculation period. Meanwhile, the pressure pulsation amplitude of each group of monitoring points is quite different; the pressure pulsation amplitude of each monitoring point is the largest and the negative amplitude is greater than the positive amplitude under part-load conditions; when the flow is increased to optimal flow conditions, the pressure pulsation amplitude is reduced to the minimum, and the negative amplitude is greater than the positive amplitude. However, as the flow increased to overload conditions, the pressure pulsation amplitude increases instead, but it is still lower than part-load conditions, and the positive amplitude is greater than the negative amplitude.
By comparing the pressure pulsation amplitudes on different circumferential surfaces, it can be seen that as the monitoring point moves from the shroud to the hub, the pressure pulsation amplitude increases continuously. At the same time, due to the different locations of the monitoring points, there is a significant phase difference in the pressure pulsation peaks. The No. 5 monitoring point is the first one to sweep the tongue. Therefore, the first wave peak is generated at the No. 5 monitoring point, and the other wave peaks all appear behind the No. 5 monitoring point. Furthermore, it can be found that the order of the pressure pulsation amplitude is: 3 > 2 > 4 > 5 > 1, so the positions where the pressure pulsation amplitude changes drastically are mainly concentrated in the middle of the impeller outlet. When the monitoring point is far from the A3, B3, and C3 positions, the pressure pulsation amplitude is smaller.
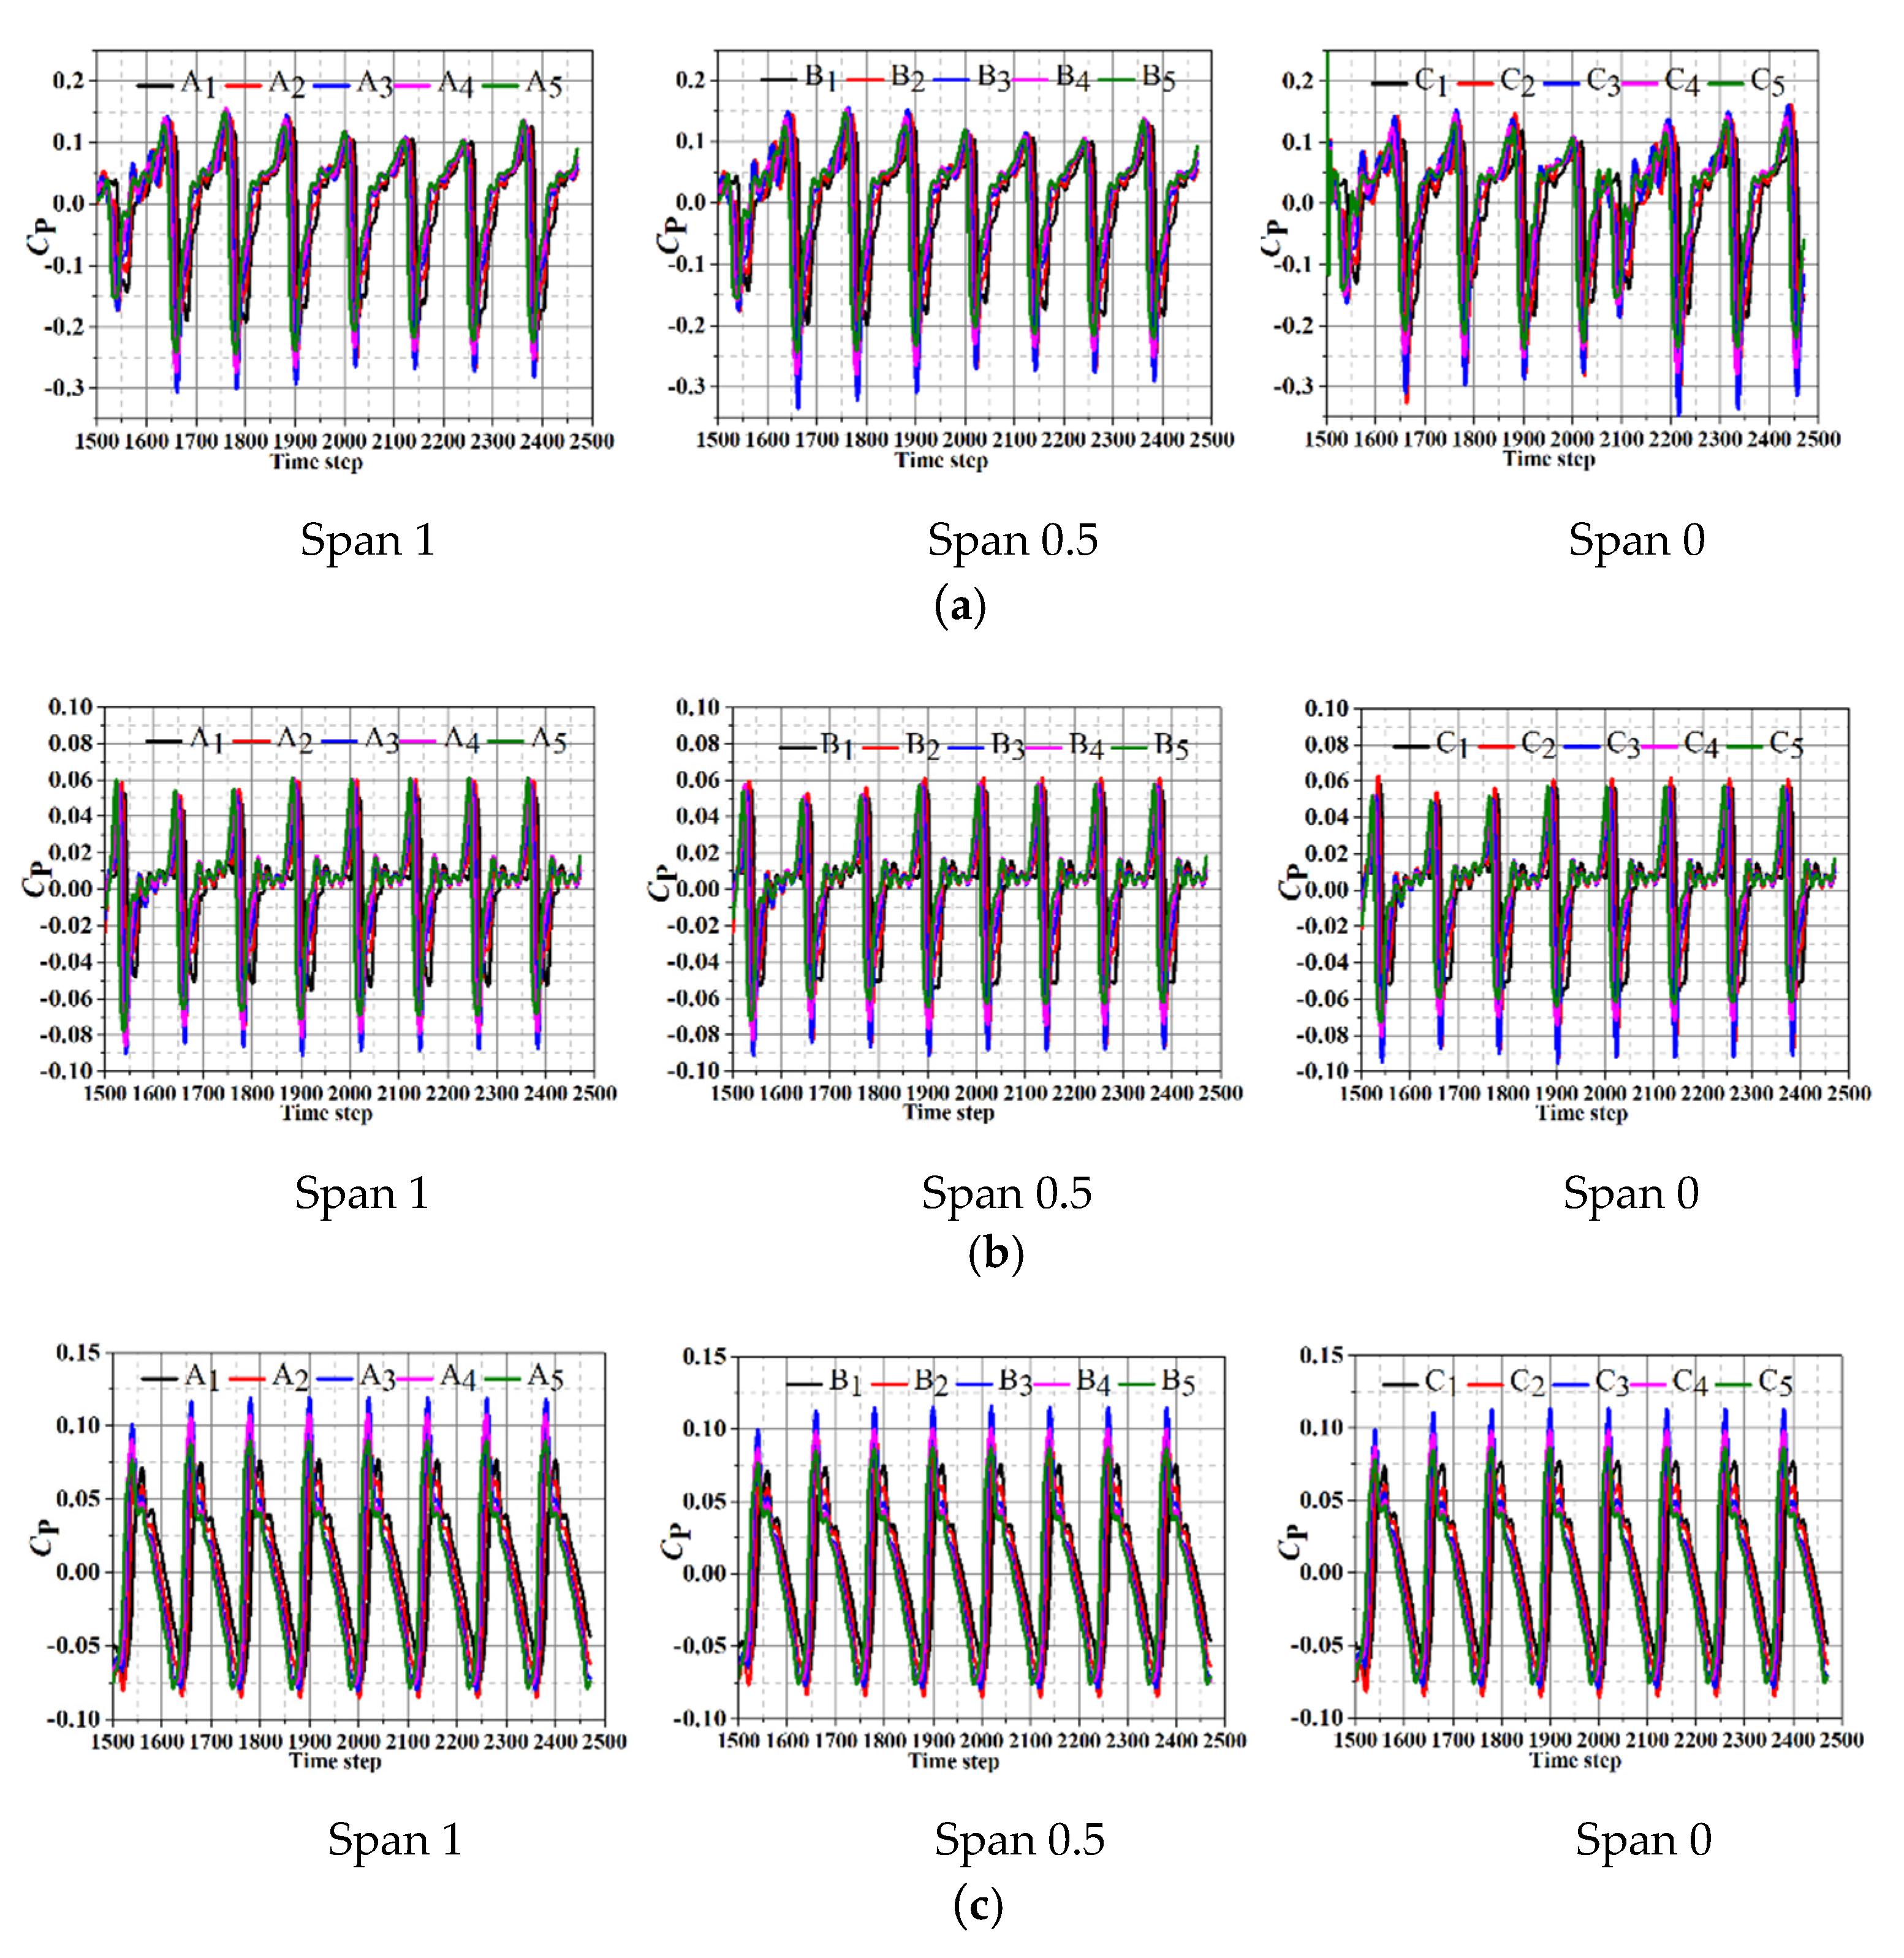
Figure 13,
Figure 14 and
Figure 15 are the pressure pulsation distributions of Scheme 2, Scheme 3, and Scheme 4, respectively. Through comparison, it can be found that each scheme has a similar variation trend. The pressure pulsation amplitude of the monitoring point is the largest, and the negative amplitude is greater than the positive amplitude under part-load conditions. However, the pressure pulsation amplitude is reduced to the minimum, and the negative amplitude is greater than the positive amplitude under optimal flow conditions. When the flow continues to increase to overload conditions, the amplitude increases instead and the positive amplitude is greater than the negative amplitude. The main reason for this phenomenon is the velocity of the water flowing from the impeller continues to increase, which collides with the water in the volute. Due to the large difference in velocity and direction, a great impact loss is formed in the volute, which results in severe pressure pulsation. After the impact, the velocity of the water flowing out of the impeller is reduced to the same as the flow field of the volute; part of the energy is dissipated during the collision, and the remaining kinetic energy is transferred to the water in the volute, which makes the pressure of the volute continue to rise. When pump operation is under overload conditions, the velocity of water flowing out of the impeller is faster; meanwhile, the velocity of water in the volute increases significantly, so that the velocity difference with the impeller is smaller. Although collisions are generated under overload conditions, the collision intensity and energy dissipation are significantly lower than under part-load conditions. Therefore, the obvious pressure pulsation will be generated under part-load and overload conditions.
At the same time, as the hub radius continues to increase, the pressure pulsation amplitudes of the corresponding monitoring points all show a downward trend, indicating that the impeller with a large hub radius is beneficial to weaken the pressure pulsation. In addition, it is further verified that the internal flow field of Scheme 4 is relatively smooth in the analysis of internal flow characteristics, which has an important effect on improving the running stability of the self-priming centrifugal pump.
7. Analysis of Radial Force Characteristics
Since the geometric parameters of the self-priming centrifugal pump are designed based on the internal flow under optimal flow conditions, which results in the velocity and pressure distribution being symmetrical and uniform. However, when the self-priming centrifugal pump operation deviates from optimal flow conditions, the symmetry distribution of pressure and velocity in the flow field is destroyed, and the pressure push on the impeller is uneven. Therefore, the feedback on the impeller is the generation of radial force, and the deflection is generated on the pump under alternating stress, which reduces the service life of the pump shaft and causes damage to related parts such as bearings and seals.
The radial force on the impeller is mainly concentrated on the blade surface, the shroud, and the hub, which can be decomposed into two components perpendicular to the axial direction. In this paper, the impeller of the self-priming centrifugal pump rotates around the
Z-axis, so the radial force on the impeller can be decomposed into the component force
FX in the
X-axis direction and the component force
FY in the
Y-axis. In the process of numerical simulation, the resultant radial force can be calculated by detecting
FX and
FY, and the relevant calculation relationship can be expressed as [
23]:
where
FR represents the resultant force of radial forces and
θR represents the angle between the component forces.
In order to improve the accuracy of radial force analysis, dimensionless treatments are carried out on the radial force to obtain the radial force coefficient
CF. The calculation formula can be expressed as:
where
CF represents the dimensionless radial force coefficient,
ρ represents the liquid density,
u2 represents the peripheral velocity of the impeller outlet,
D2 represents the outer diameter of the impeller, and
b2 represents the width of the impeller outlet.
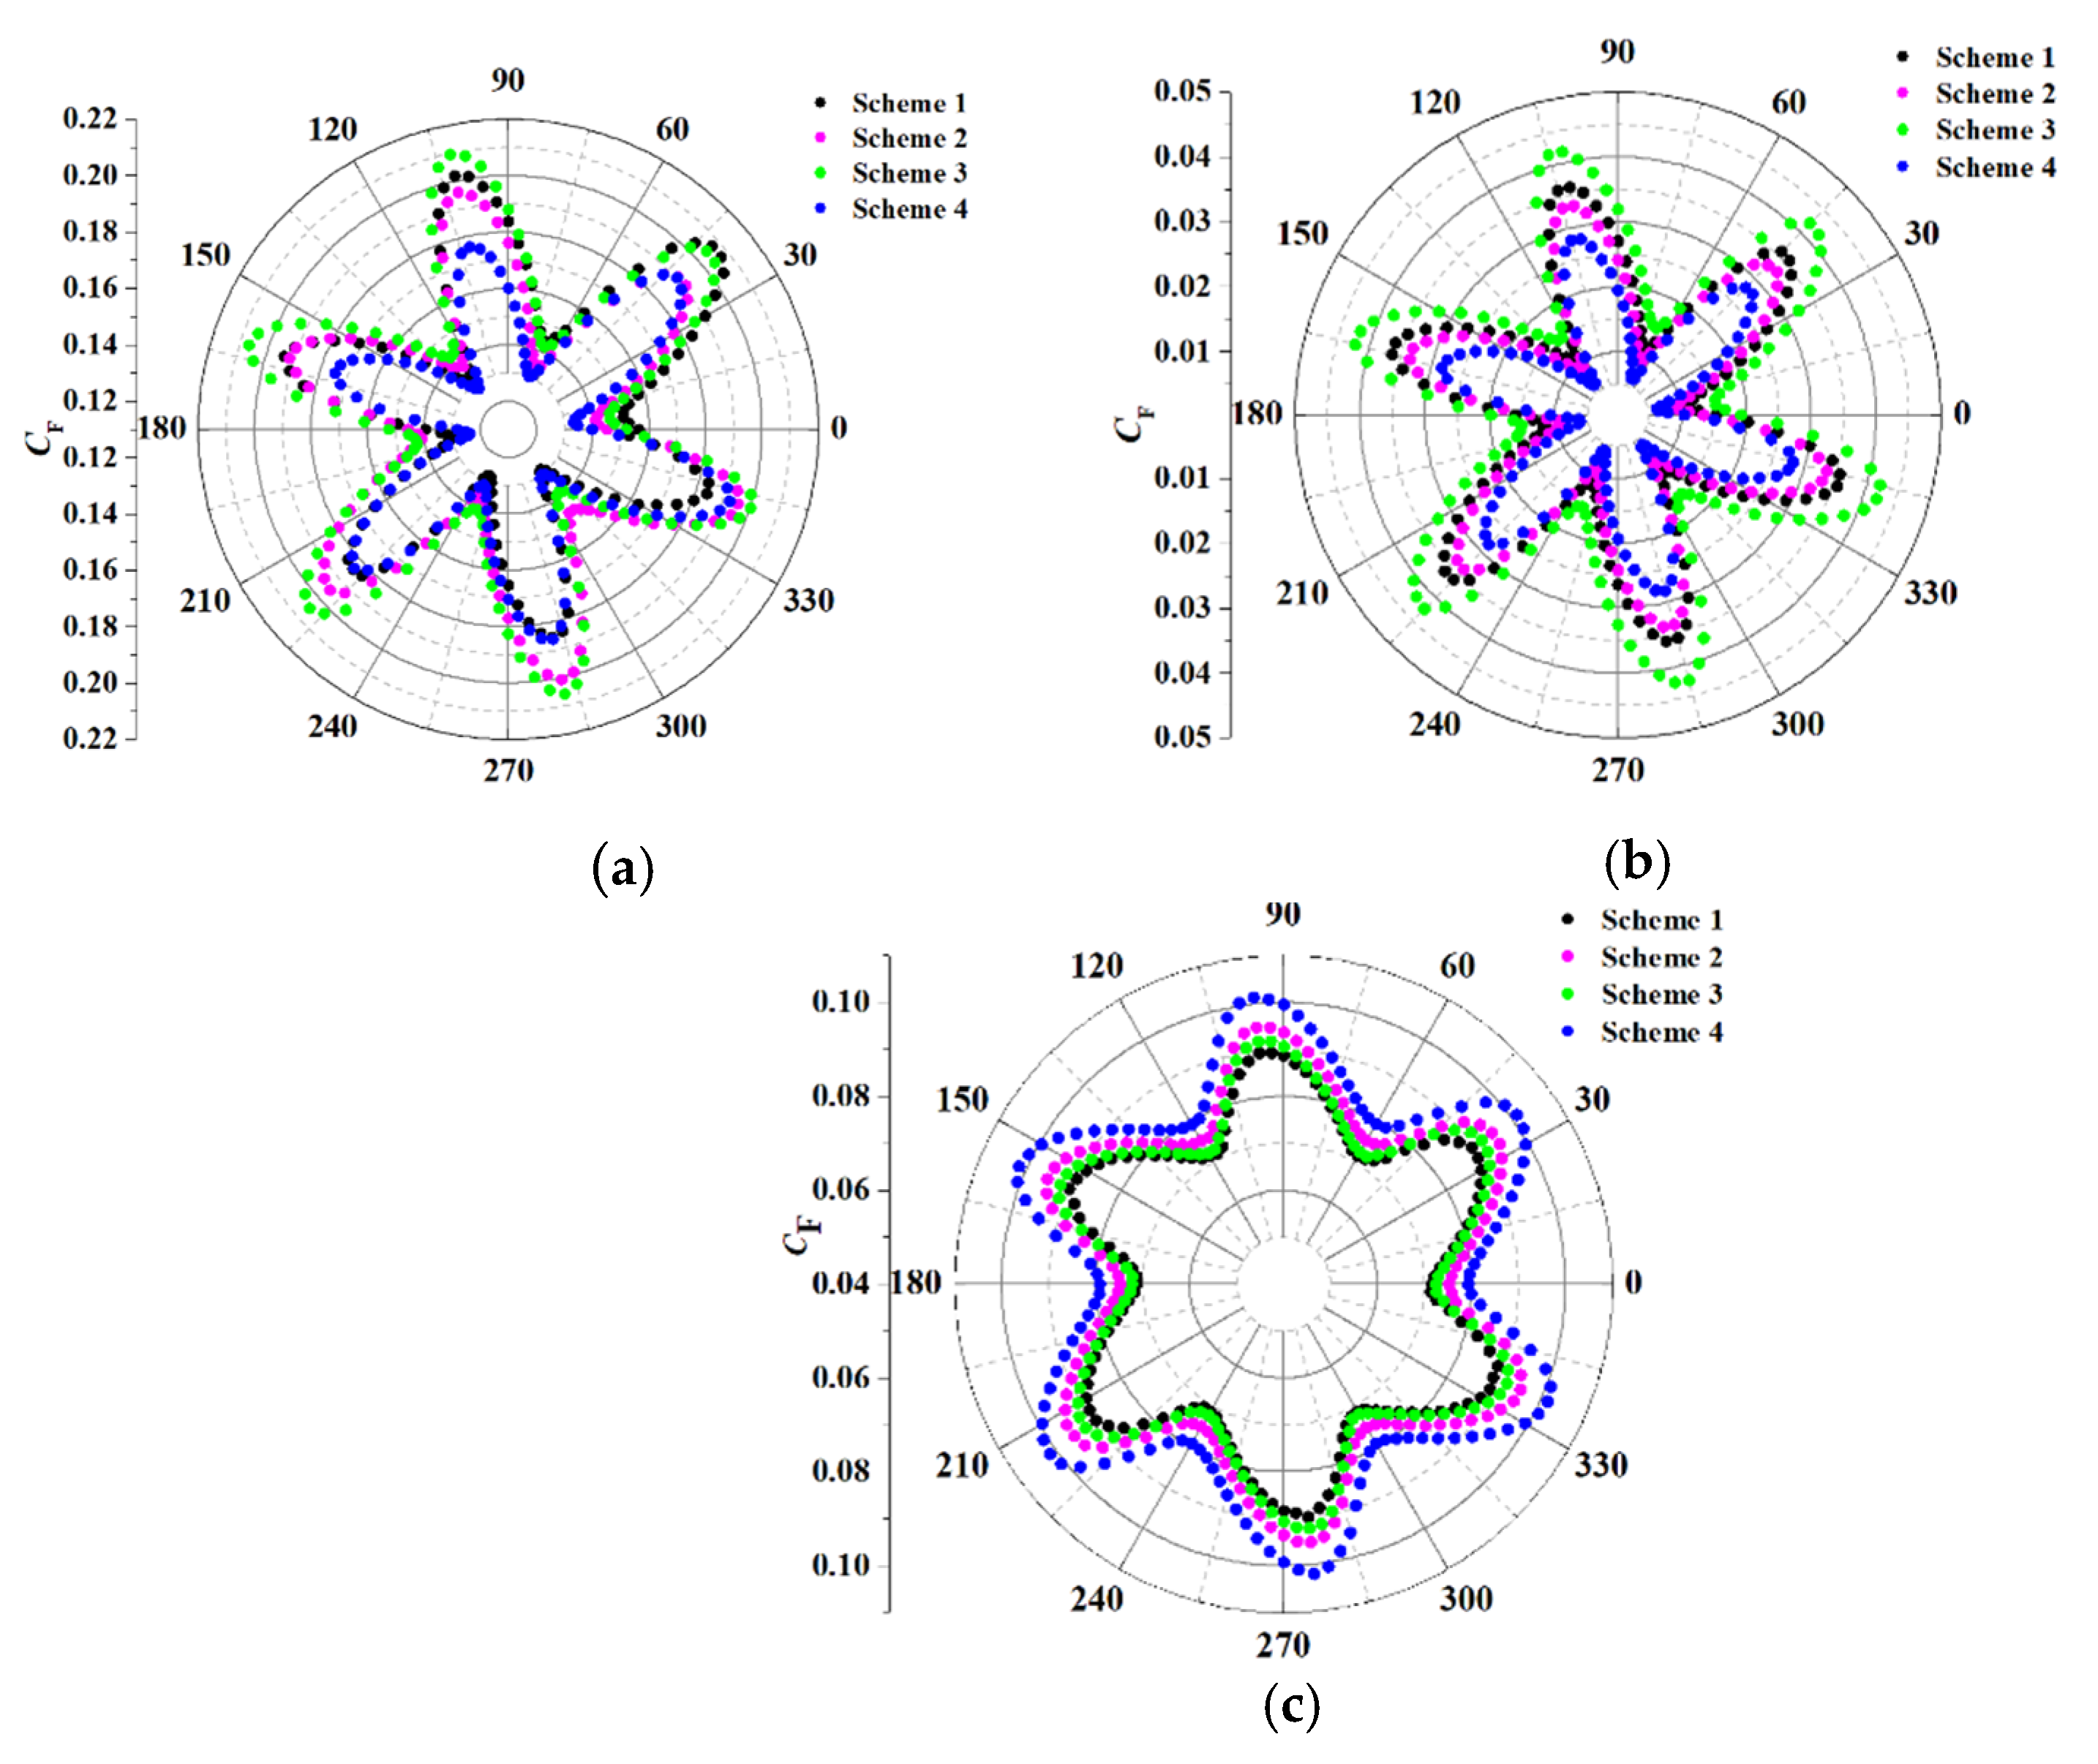
Figure 16 presents the polar coordinate distribution of radial force. It can be seen from the figure that the direction and magnitude of the radial force of each scheme have a similar variation trend. With the rotation of the impeller, six wave peaks and troughs appear in the radial force distribution, which is equal to the number of impeller blades, and the overall distribution is symmetrical. In addition, the wave peaks and troughs of each scheme are generated at the same angles. However, by comparing the radial force under the different flow conditions, it can be found that the radial force is largest under part-load conditions. When the flow rate increases to optimal flow conditions, the radial force decreases to the minimum. When the flow rate continues to increase to overload conditions, the radial force increases instead, but the magnitude is still lower than the radial force under part-load conditions. This phenomenon is similar to the analysis results of pressure pulsation in the previous investigation.
This phenomenon is attributed to that self-priming centrifugal pump operating under part-load conditions; the velocity and direction in the volute flow field are inconsistent with the impeller, therefore, the collision is generated between the impeller and the volute, resulting in uneven velocity distribution at the impeller outlet and the flow in the impeller is in relative disorder, thereby causing a relatively large radial force under part-load conditions. When the flow rate increases to design-flow conditions, the velocity direction is consistent with the design direction, the internal flow field is relatively smooth, the collision loss caused by the water flowing into the volute is the lowest, and the velocity distribution of the impeller outlet is uniform, so the radial force formed on the impeller is relatively low. When the self-priming centrifugal pump runs under overload conditions, the velocity of water flowing out of the impeller is faster. At this time, the water velocity in the volute improves significantly with the increase in the flow rate. However, the velocity difference with the water in the impeller is small. Although there will still be a collision with energy loss, the collision intensity and energy dissipation are significantly lower than under part-load conditions. Furthermore, an uneven flow state is formed at the exit of the impeller, thereby forming a certain degree of radial force. It shows that the magnitude and direction of the radial force are directly affected by the velocity distribution at the impeller exit. Comparing the radial force of the different hub radii schemes, it can be found that the radial force of Scheme 4 is symmetrically distributed as a whole, and the magnitude is lower than other schemes. The phenomenon is mainly caused because the internal flow channel of the impeller and the volute are better matched by employing a larger hub radius, plus the internal flow field is smoother, which results in a more uniform and stable flow state, and the radial force generated upon the impeller is relatively low.
7.1. Analysis of Hydraulic Performance
To compare the hydraulic performance of each scheme, head and efficiency are selected as indicators for analysis. The head represents the height that the water can be raised by a self-priming centrifugal pump, and the efficiency represents the energy conversion rate of the self-priming centrifugal pump; the expression of head and efficiency can be expressed as:
where
PO − PI,
VO2 −
VI2,
ZO −
ZI represent the pressure, velocity, and potential energy difference after operating the self-priming centrifugal pump, respectively;
M represents the torque,
n is the rotation speed of the impeller, and
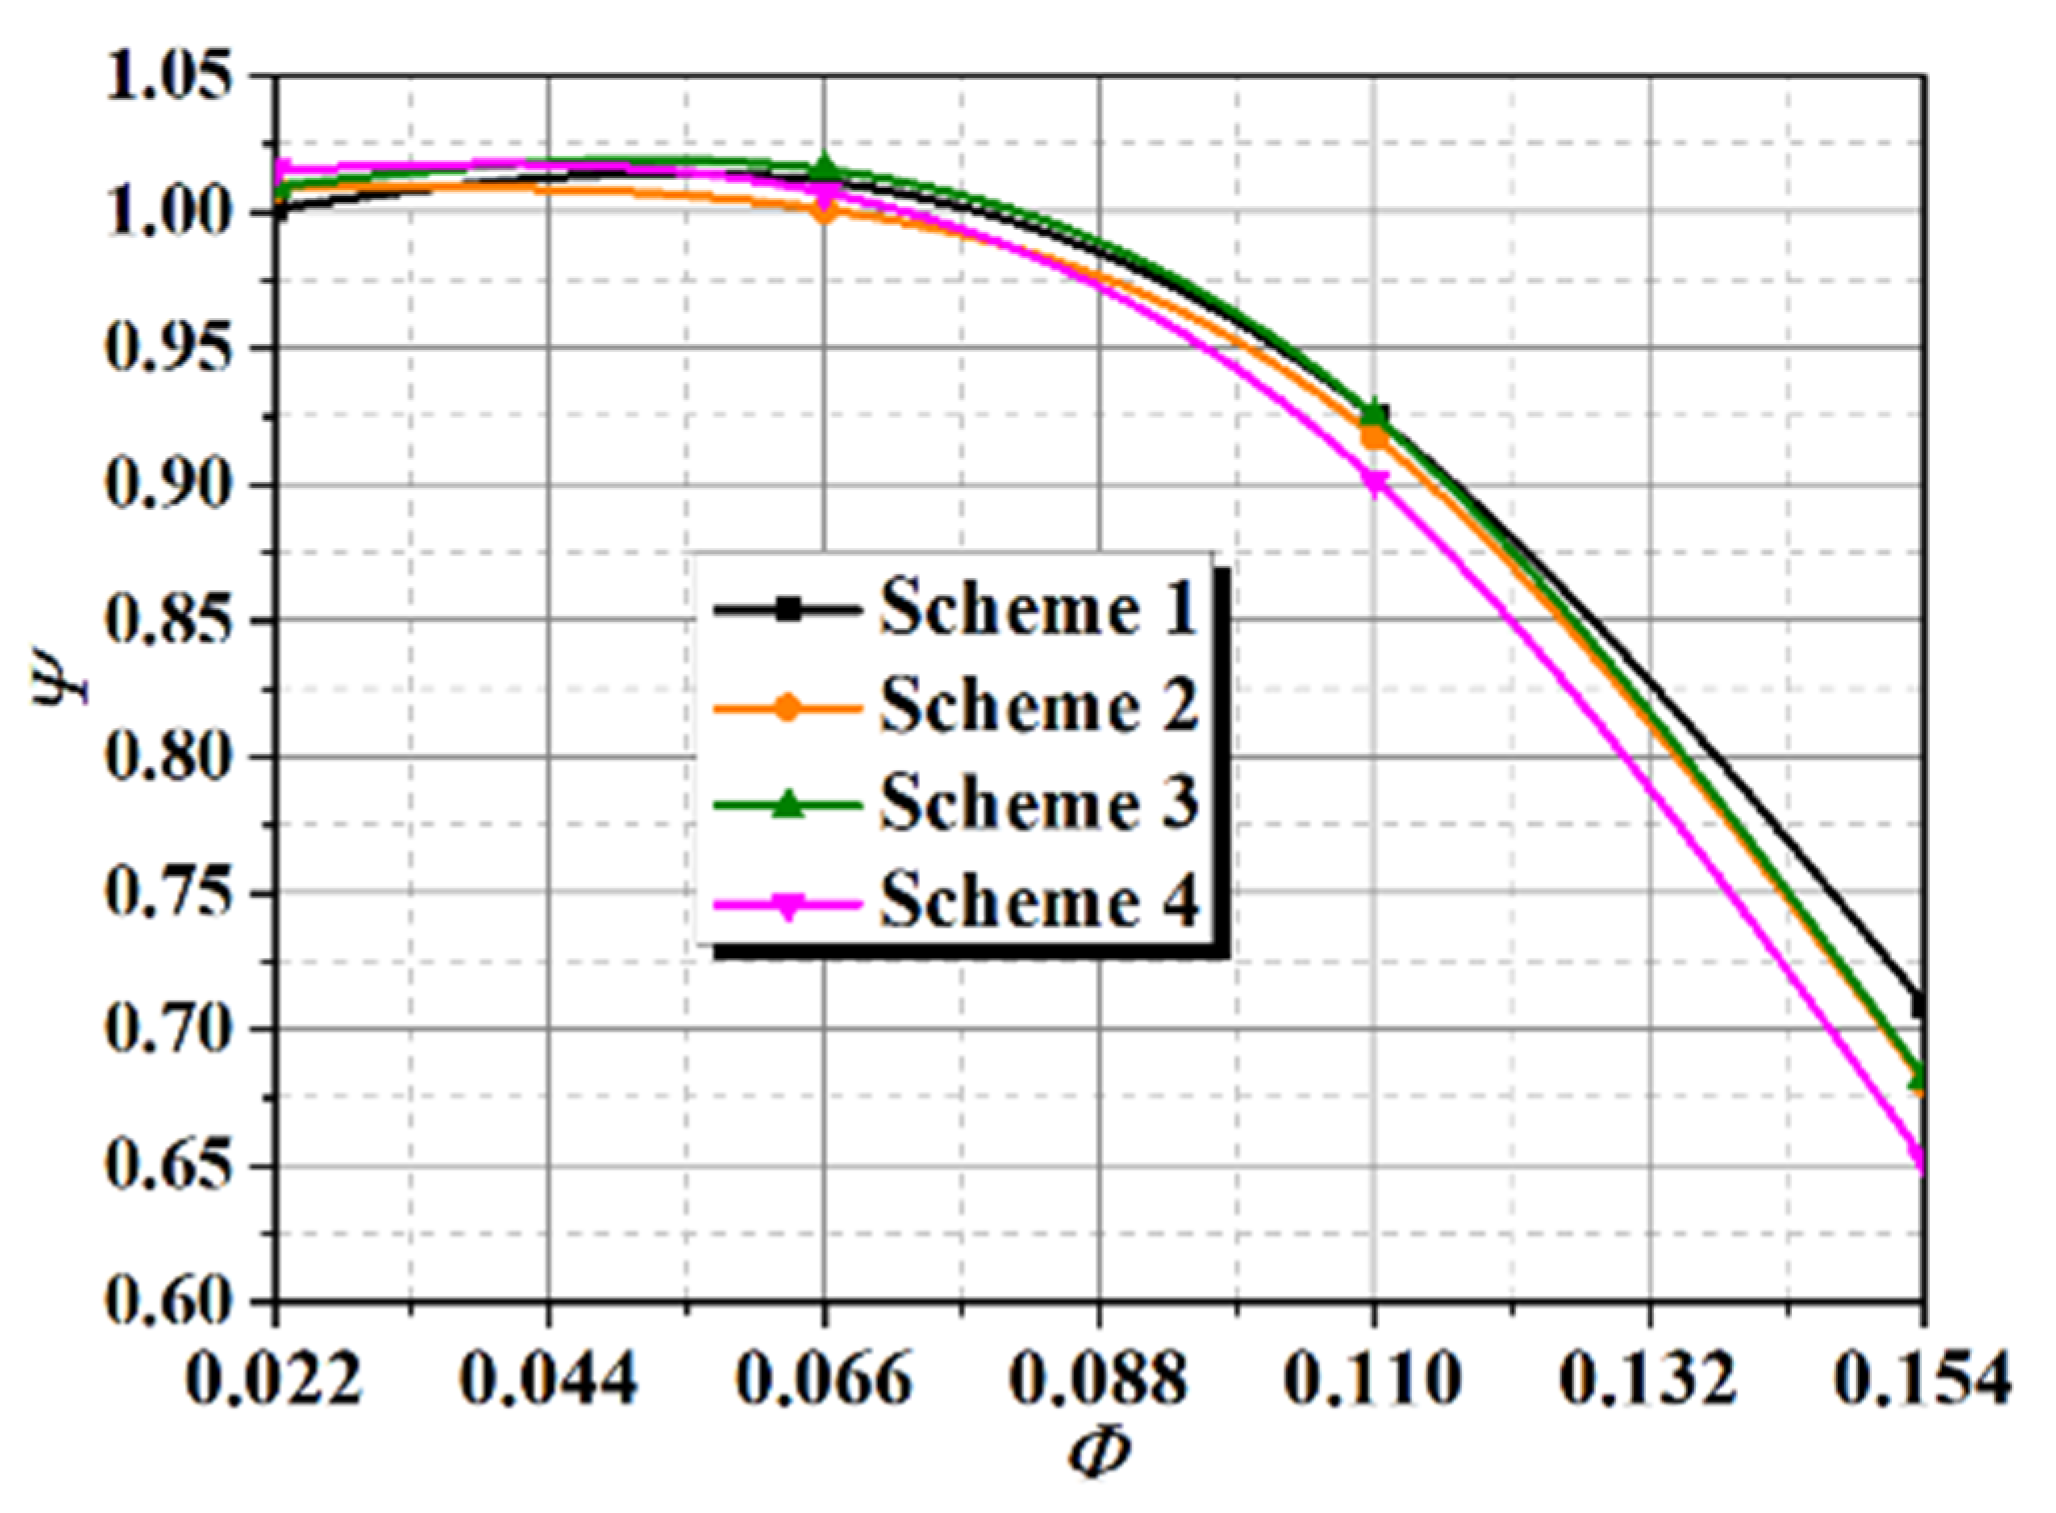
Q represents the flow rate. To reduce the errors generated in the analysis process, the dimensionless treatment on head and efficiency is carried out in this paper. The dimensionless calculation formula can be expressed as:
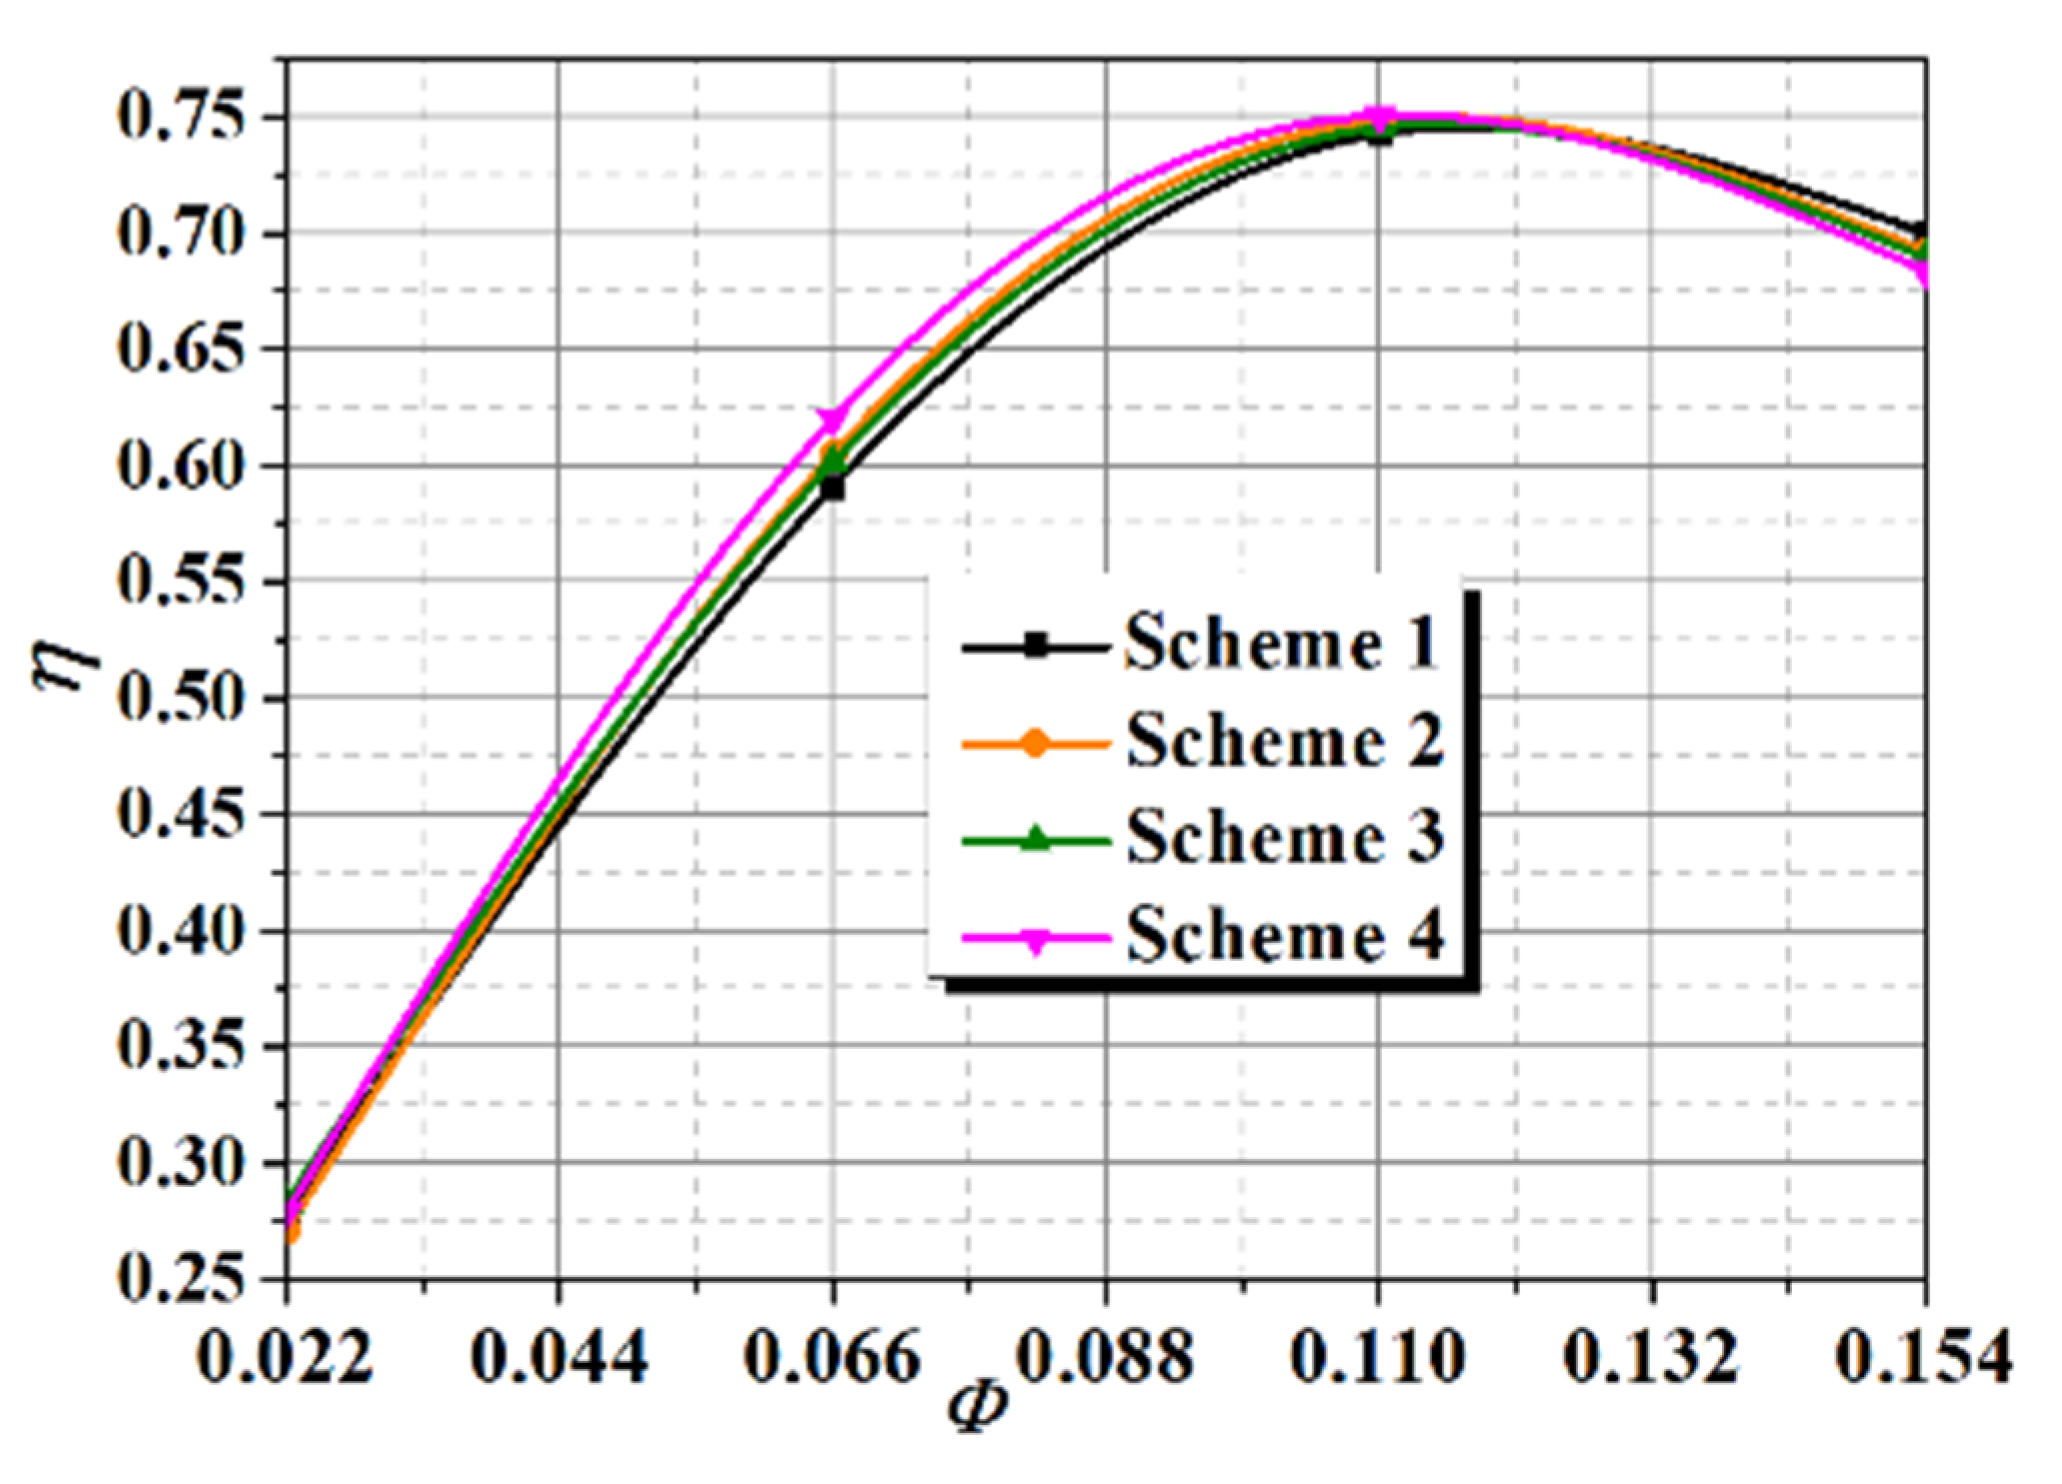
Figure 17 and
Figure 18 reveal the relationship between the head and flow rate as well as the relationship between the efficiency and flow rate of each scheme, respectively. It can be seen that the head of Scheme 4, with a larger hub radius, is lower than other schemes. Through the analysis of the internal flow characteristics in the previous section, it is concluded that more turbulent vortices are generated in the internal flow field of Scheme 1 with a smaller hub radius; the impeller flow passage is blocked by the vortex structure, which significantly reduces the effective flow area; and the actual flow of the self-priming centrifugal pump is lower than the internal flow channel without a vortex. Considering that the head shows a decreasing trend as the flow increases, therefore, the head of Scheme 1 is higher. At the same time, a large amount of energy dissipation is caused by the formation of vortices in the internal flow field of Scheme 1, which results in the efficiency of Scheme 1 being lower. When the hub radius continues to increase, the curvature of the entire meridian flow channel rises, the flow state in the impeller is continuously improved, and the vortex is gradually eliminated, making it more in line with the ideal internal flow rule. Therefore, the increase in hub radius is beneficial for improving the internal flow law and increasing the energy-conversion capability of the self-priming centrifugal pump.
7.2. Test Measurement Standards and Device Accuracy
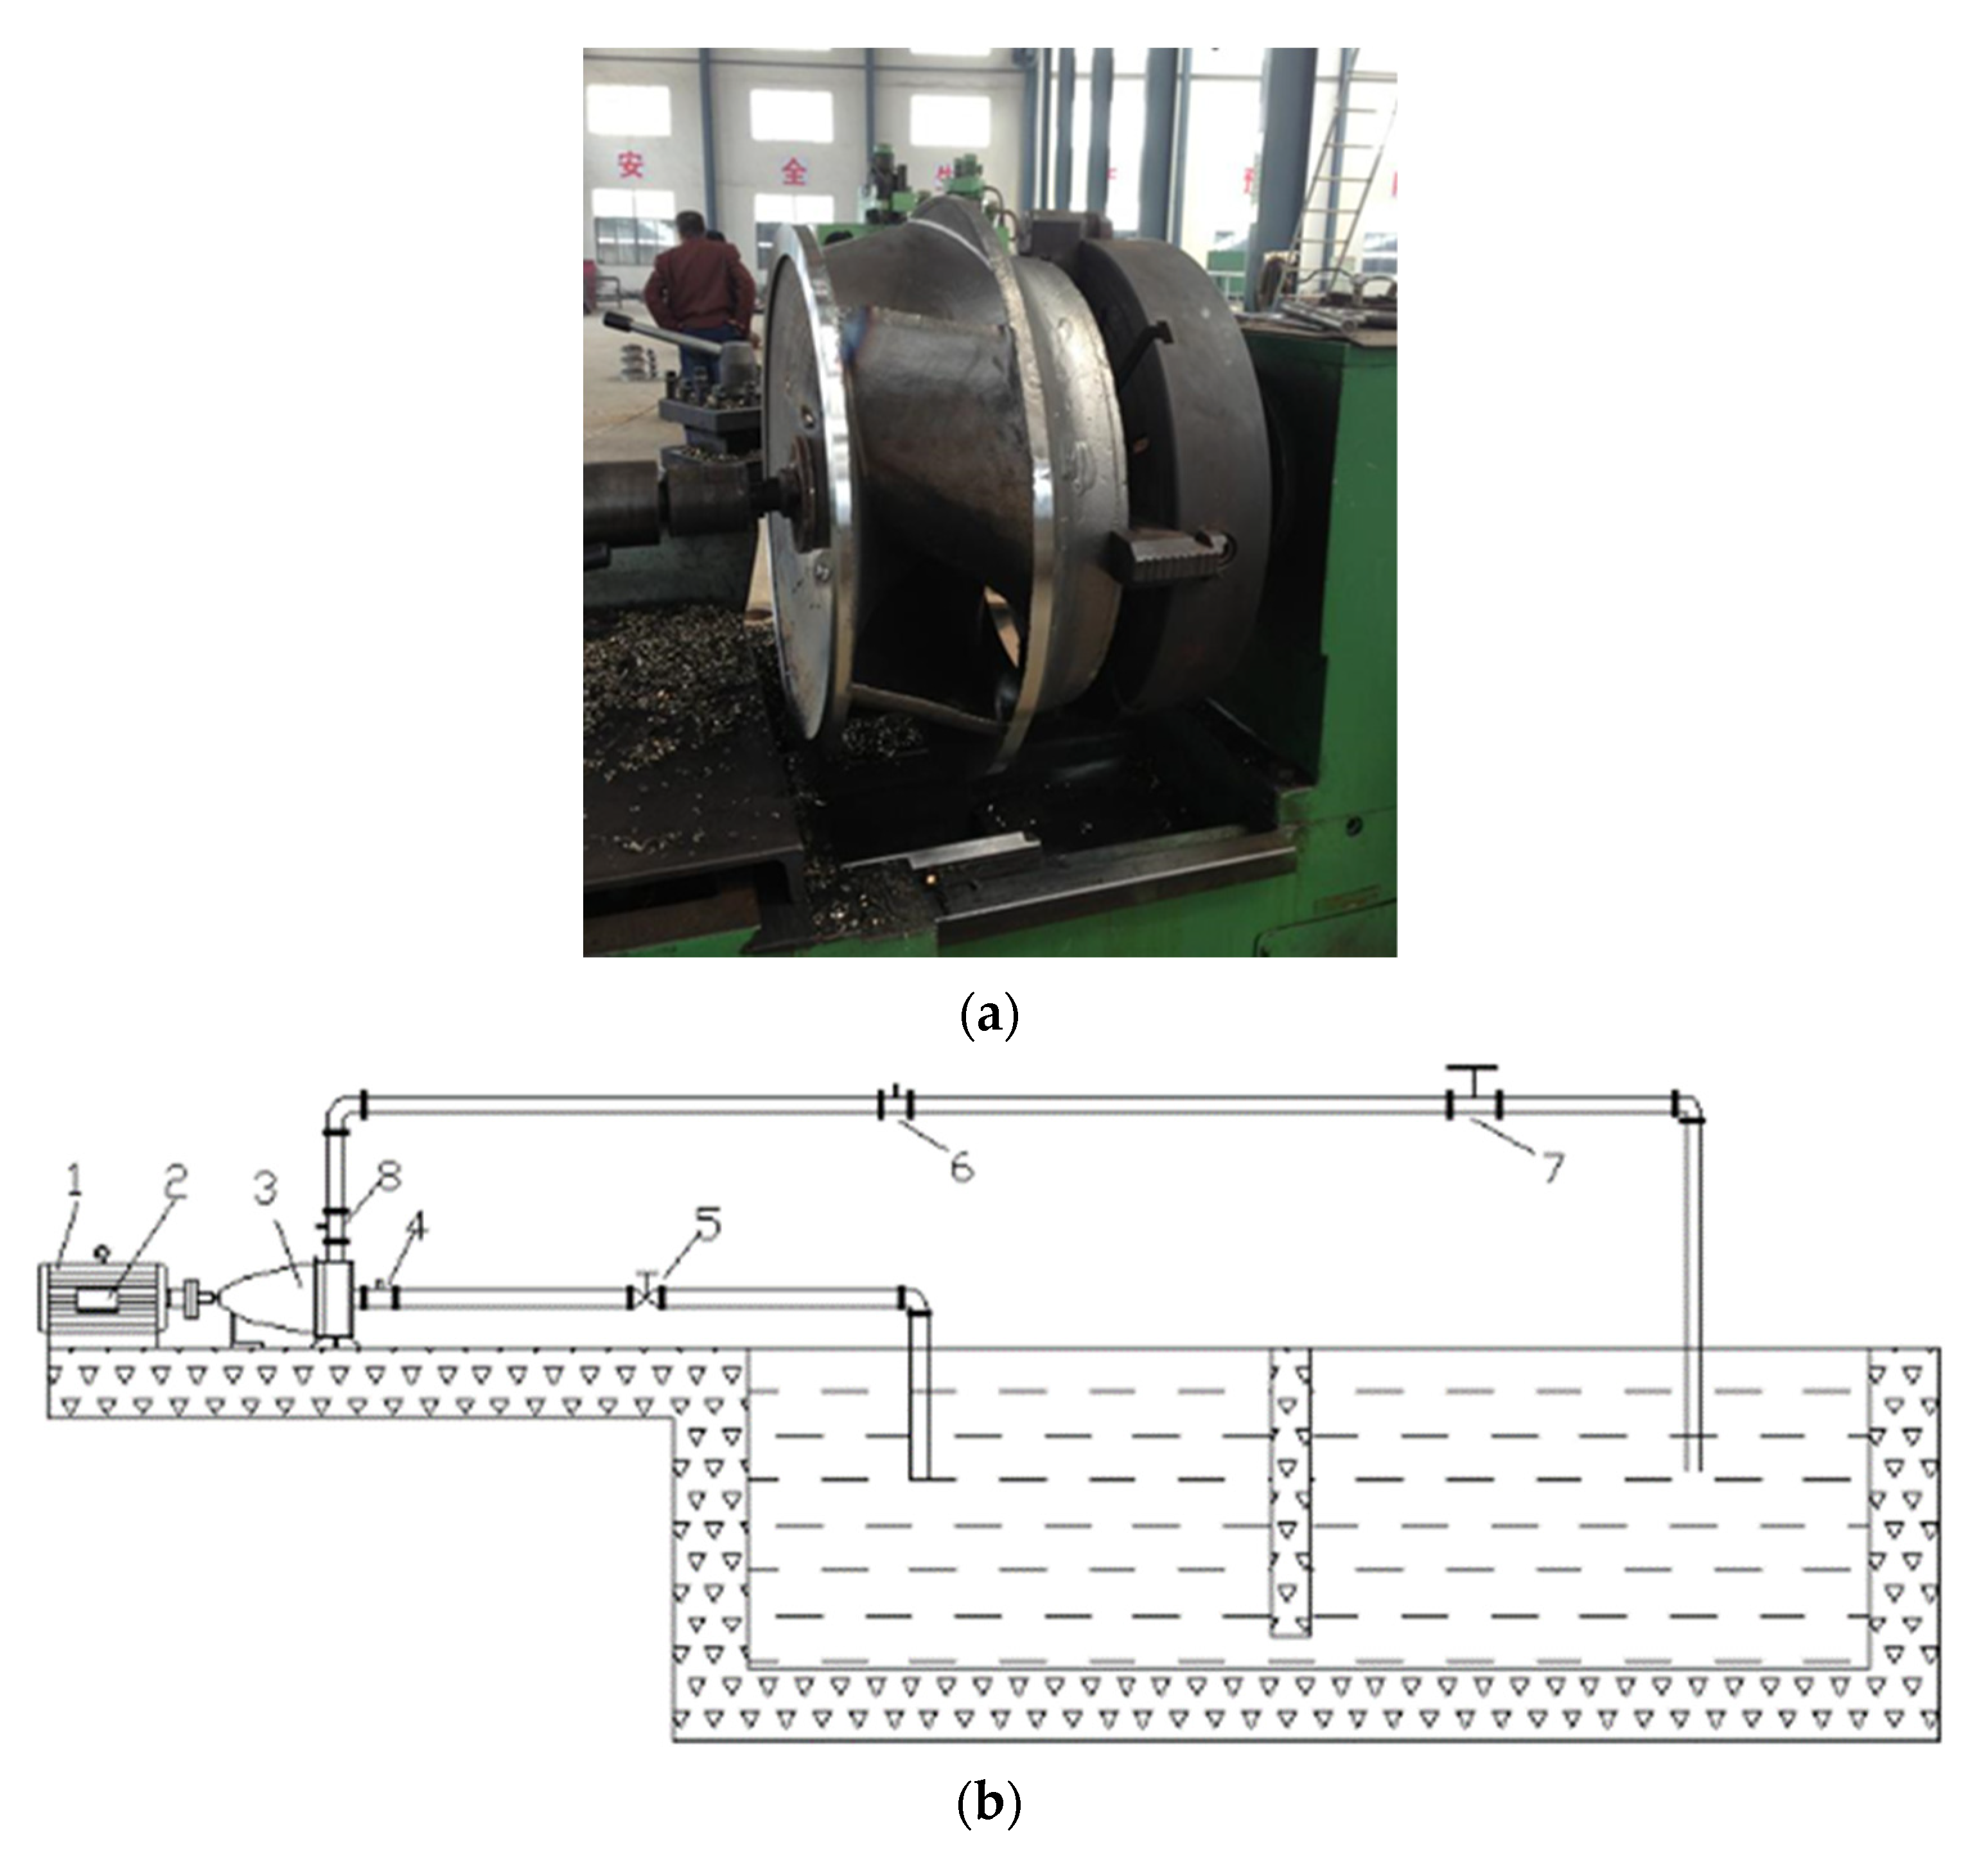
To further verify the accuracy of the calculation results, the impeller of Scheme 4 is manufactured and the relevant hydraulic experiment is conducted; the impeller model of Scheme 4 is shown in
Figure 19a. During the test, pressure sensors were used to monitor the inlet and outlet pressures, and the measurement errors of the inlet and outlet pressure sensors were both ±0.5%. At the same time, the measurement error of the turbine flowmeter is ±1.0%, while the measurement error of the torque sensor and the speed sensor are ±0.5% and ±1.0%, respectively. The measurement error of the test is ±1.22%, and the test bench is shown in
Figure 19b.
The comparison results of the test and numerical calculations are shown in
Figure 20; the test results have the same variation trend with the calculation results. Considering the complexity of the calculation structure, the front pump cavities, rear pump cavities, seals, and bearings are not included in the calculation domain, which leads to the calculation results of the self-priming centrifugal pump possessing a slight deviation. The result of the test is slightly lower than the calculation, but the difference is below 3%, which is within the allowable range of the error in the analysis process. Therefore, it is concluded that the model and setting of the calculation are reliable.
8. Conclusions
In this paper, a self-priming pump with different hub radii was systematically investigated by numerical simulations and experiments; the internal flow characteristics, blade surface load, pressure pulsation characteristics, and radial force distribution were analyzed. The following conclusions can be drawn.
According to the analysis of blade surface load characteristics, the results present that the pressure on the pressure surface and the suction surface show an upward trend as a whole. Furthermore, it can be found that the blade load increases first and then decreases along with the streamline position, while the blade surface load continues to enhance as the flow increases. At the same time, as the hub radius increases, the blade surface load continuously increases, which effectively improves the ability of the blade to work on the internal flow field.
The velocity of the water flowing from the impeller continues to increase, which collides with the water in the volute. In addition, due to the large differences in velocity and direction, great impact loss is formed in the volute, which results in severe pressure pulsation. Therefore, the pressure pulsation is reduced to the minimum under optimal flow conditions. In addition, as the hub radius continues to increase, the pressure pulsation amplitudes of the corresponding monitoring points all show a downward trend, indicating that the impeller with a large hub radius is beneficial to weaken the pressure pulsation.
By comparing the radial force of the different hub radii schemes, it can be found that six wave peaks and troughs are generated in the radial force distribution, which is equal to the number of impeller blades, and the overall distribution is symmetrical. In addition, the wave peaks and troughs of each scheme are generated at the same angles. Considering this, the internal flow channel of the impeller and the volute are better matched by employing a larger hub radius, and the internal flow field is smoother. Thus, the radial force generated upon the impeller is relatively low, the radial force of Scheme 4 is symmetrically distributed as a whole, and the magnitude is lower than other schemes. Finally, the relevant hydraulic experiment is conducted, and the difference between the experiment and calculation is below 3%, which ensures the accuracy of the calculation results.


