1. Introduction
As a non-destructive testing instrument, Ground Penetrating Radar (hereinafter referred to as GPR) relies on electromagnetic waves to detect the signal characteristics of materials with different dielectric constants. It has an important application in the detection of railway tunnel lining [
1]. The main defects that GPR can detect are non-compactness, cavity, and water content [
2,
3]. In reinforced concrete lining, GPR echo signal generates strong reflection at the metal, which can effectively detect the distribution of reinforcement/steel arch [
4,
5,
6].
Due to the low efficiency and inconsistent standards of traditional manual detection, the GPR detection method of tunnel lining has changed. Vehicle-mounted GPR detection is a mainstream and advanced rapid detection mode of tunnel lining. In the process of vehicle-mounted detection, the GPR is air-launched, which is not necessary and impossible to contact the tunnel lining. The authors have developed the first high-speed railway tunnel lining detection vehicle in China [
7]. For vehicle-mounted GPR detection, a mechanical arm or other forms of mechanical device needed to be used to carry the GPR antenna to the required detection line station. The detection device of the high-speed railway tunnel detection vehicle with automatic detection capability developed by the author is composed of an innovatively designed mechanical arm and a control system carrying various sensors. The detection device can carry three GPR antennas to detect at one time, which can pass smoothly from the spatial area of the catenary frame and lining surface without stopping, thus as to ensure the continuity of detection [
8]. The detection device can automatically control and maintain the distance between the antenna and the lining [
9]. Through the field application of the detection vehicle and the analysis of the detection data, it is concluded that the vibration of the detection device and the control ability of the distance parameters between the antenna and the lining has significant impacts on the data quality of GPR [
10]. These factors not only reduce the detection accuracy, affect the result recognition but also limit the improvement of data processing quality. This article intends to solve the problem and propose a solution strategy.
There are few analyses and research on the influence factors of echo signal or data detected by vehicle-mounted GPR. At present, the research points for relevant aspects mainly include lining defect analysis and identification, engineering test research, and field verification effect [
11,
12]. Research on the algorithm of forward simulation and data effect actual measurement correction of vehicle-mounted GPR detection technology in Highway tunnel detection to improve data accuracy and analysis quality [
13]. The analysis effect of many processing algorithms with different adaptabilities such as Short-Time Fourier Transform, Wavelet Transform, and Empirical Mode Decomposition method of GPR echo signal [
14,
15,
16,
17]. In addition, researcher Qi F.L of the authors’ team conducted research on the influence factors of tunnel lining detection of non-contact vehicle-mounted GPR system, including the distance control between the surface and the antenna. The analysis object is a normal-speed railway tunnel. Researcher Qi analyzed the influence effect of the different distances between antennas and lining and confirmed the appropriate center frequency and detection speed parameters of GPR antenna [
18]. References [
11,
12,
13,
14,
15,
16,
17,
18] achieved the results in the corresponding research points, studied the rationality of tunnel lining non-contact detection by vehicle-mounted GPR, the judgment of detection results, and the effect of engineering processing algorithms thus far. However, the vibration characteristics of the detection device, detection data affected by vibration, and the vibration suppression scheme of the detection device have not been solved. Therefore, it is extremely important to clarify the vibration characteristics of the detection device, analyze the influence sensitivity of external vibration excitation on GPR echo signal during tunnel lining detection, and propose the vibration suppression strategy under vehicle detection conditions.
Generally, there are several methods to suppress vibration: applying viscoelastic damping materials to reduce the vibration energy to achieve the purpose [
19,
20,
21,
22]. The vibration amplitude can be effectively decreased by applying reverse vibration or changing excitation control. If the natural frequency characteristics of the system need to be adjusted, the material characteristics should be changed, or additional structures should be added [
23,
24].
The significance of this article is to quantitatively analyze the amplitude-frequency characteristics of GPR antenna echo signal under the influence of external vibration excitation during tunnel lining detection. Combined with measurement, dynamic simulation, and control mode optimization, and the quality and signal-to-noise ratio of detection data is successfully improved, which further ensures the accuracy of the detection results.
2. Overview of the Detection Device and the Establishment of the Finite Element Simulation Model
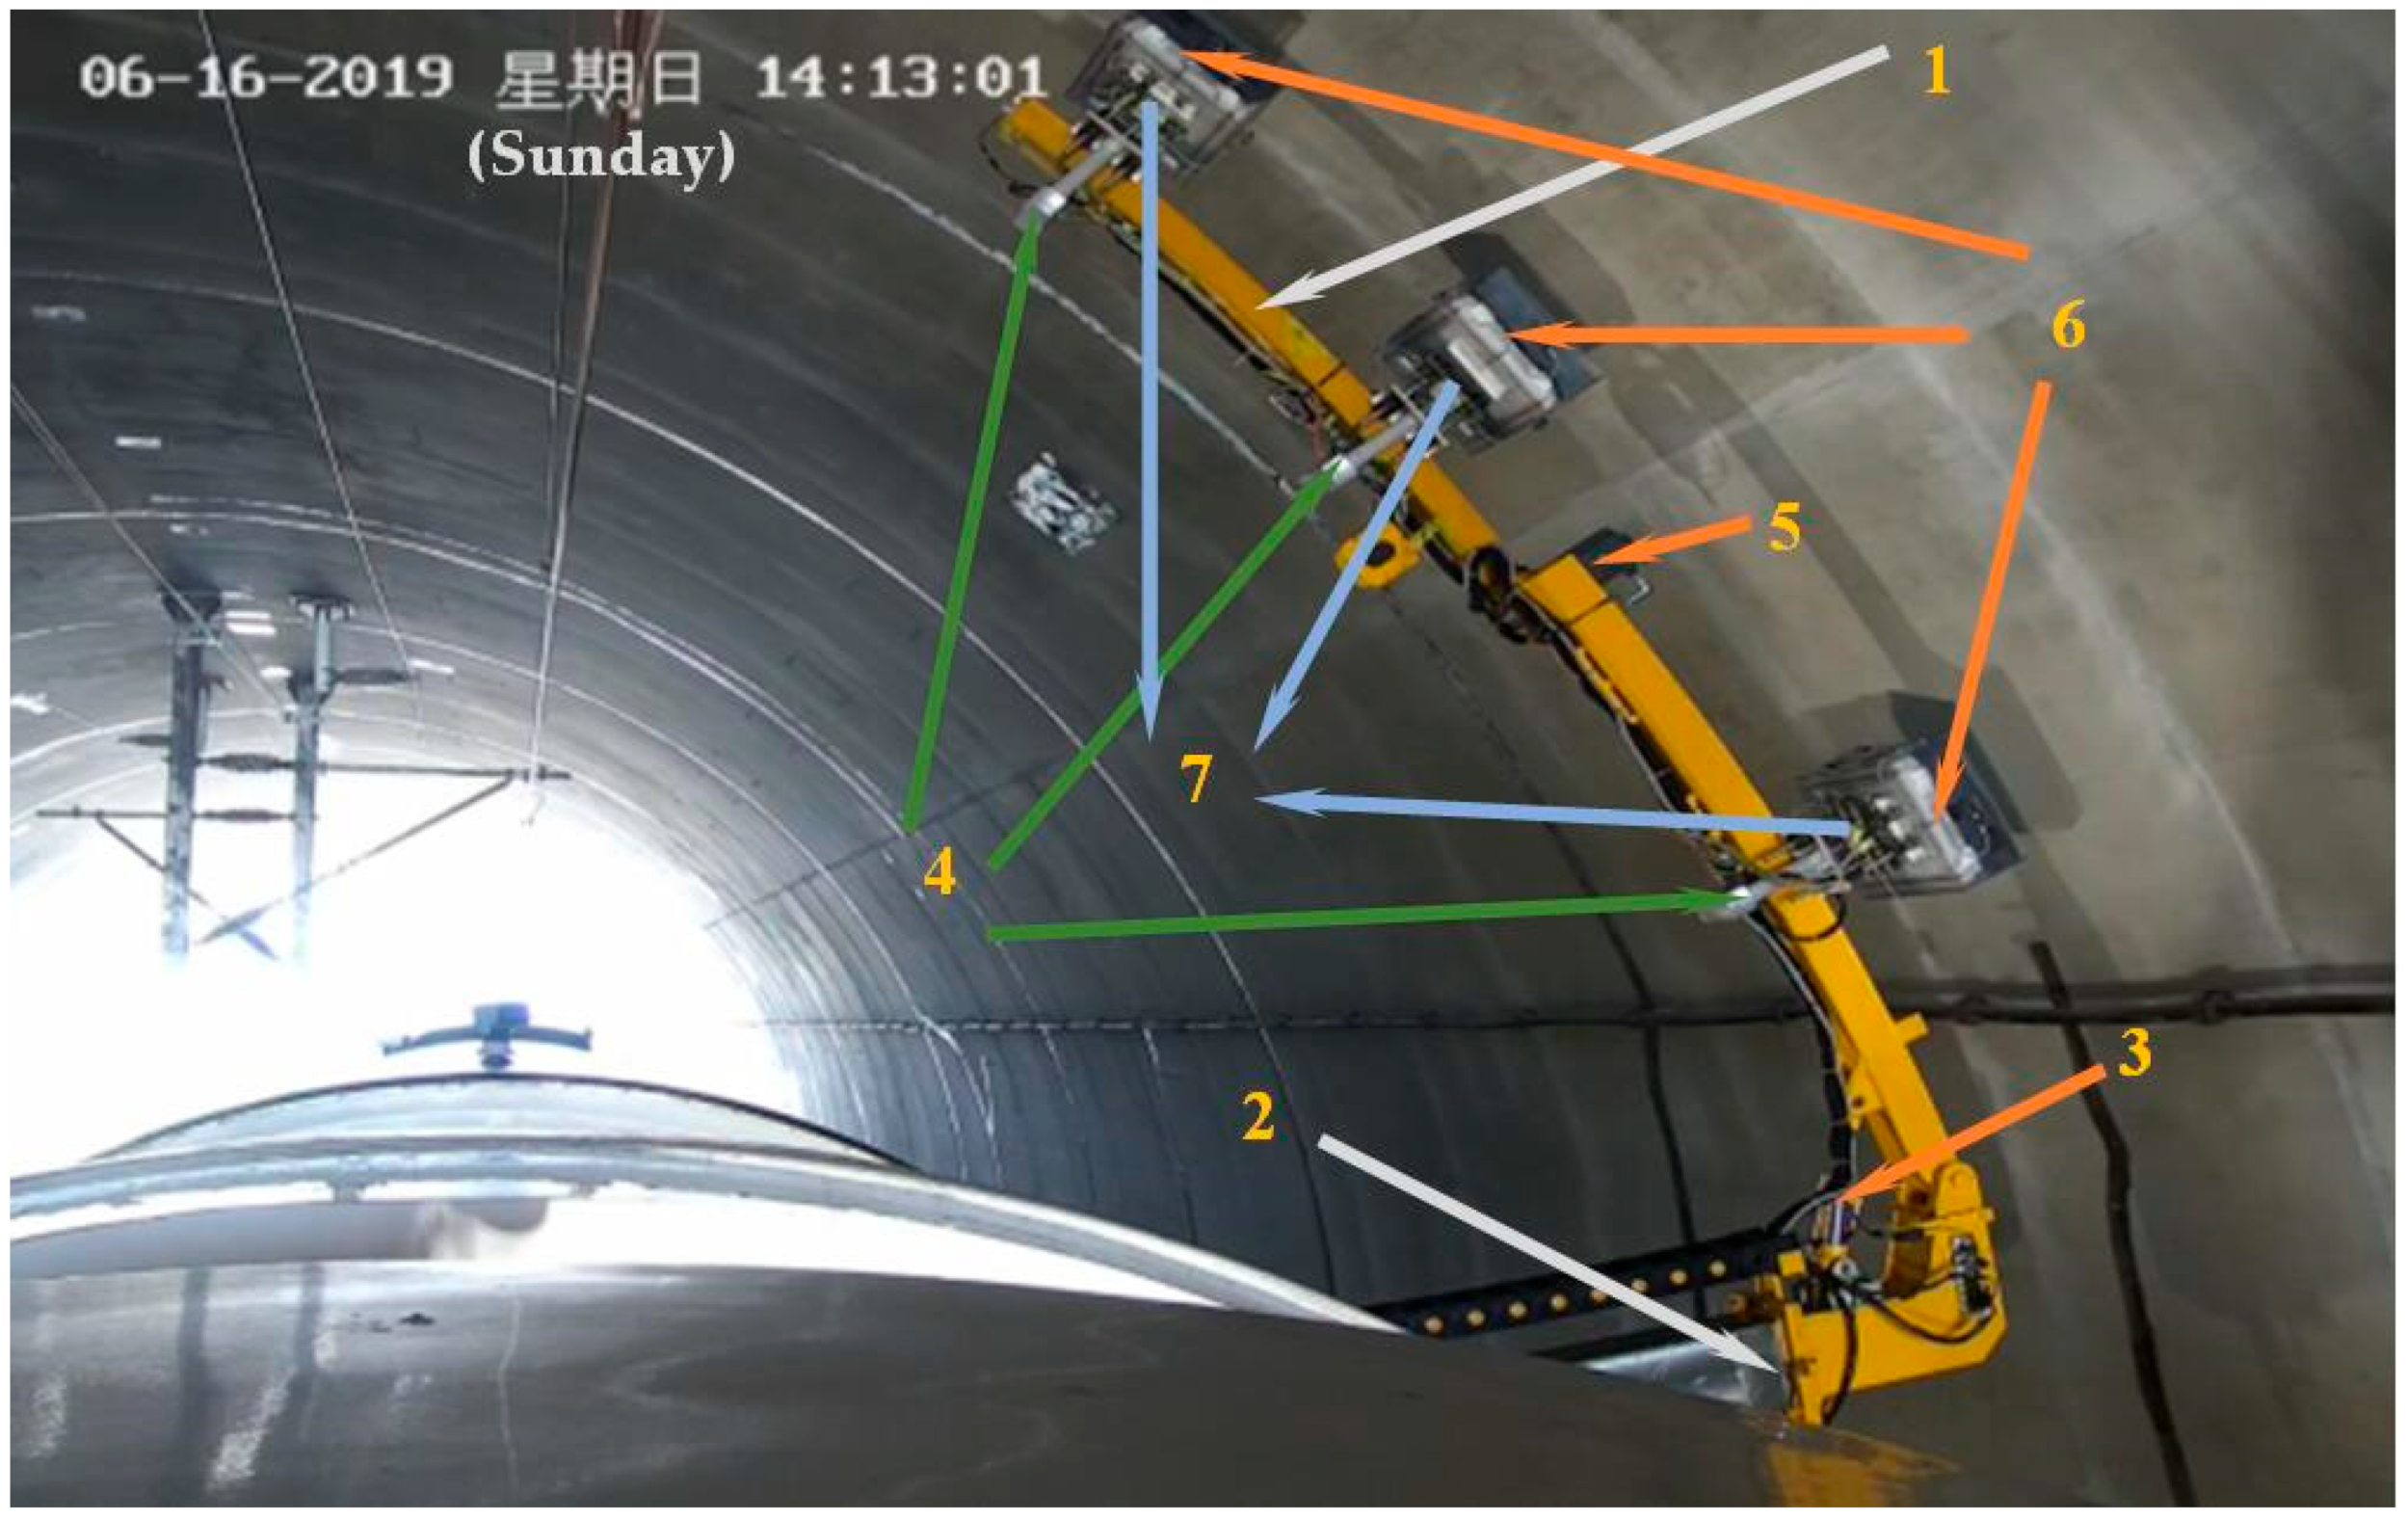
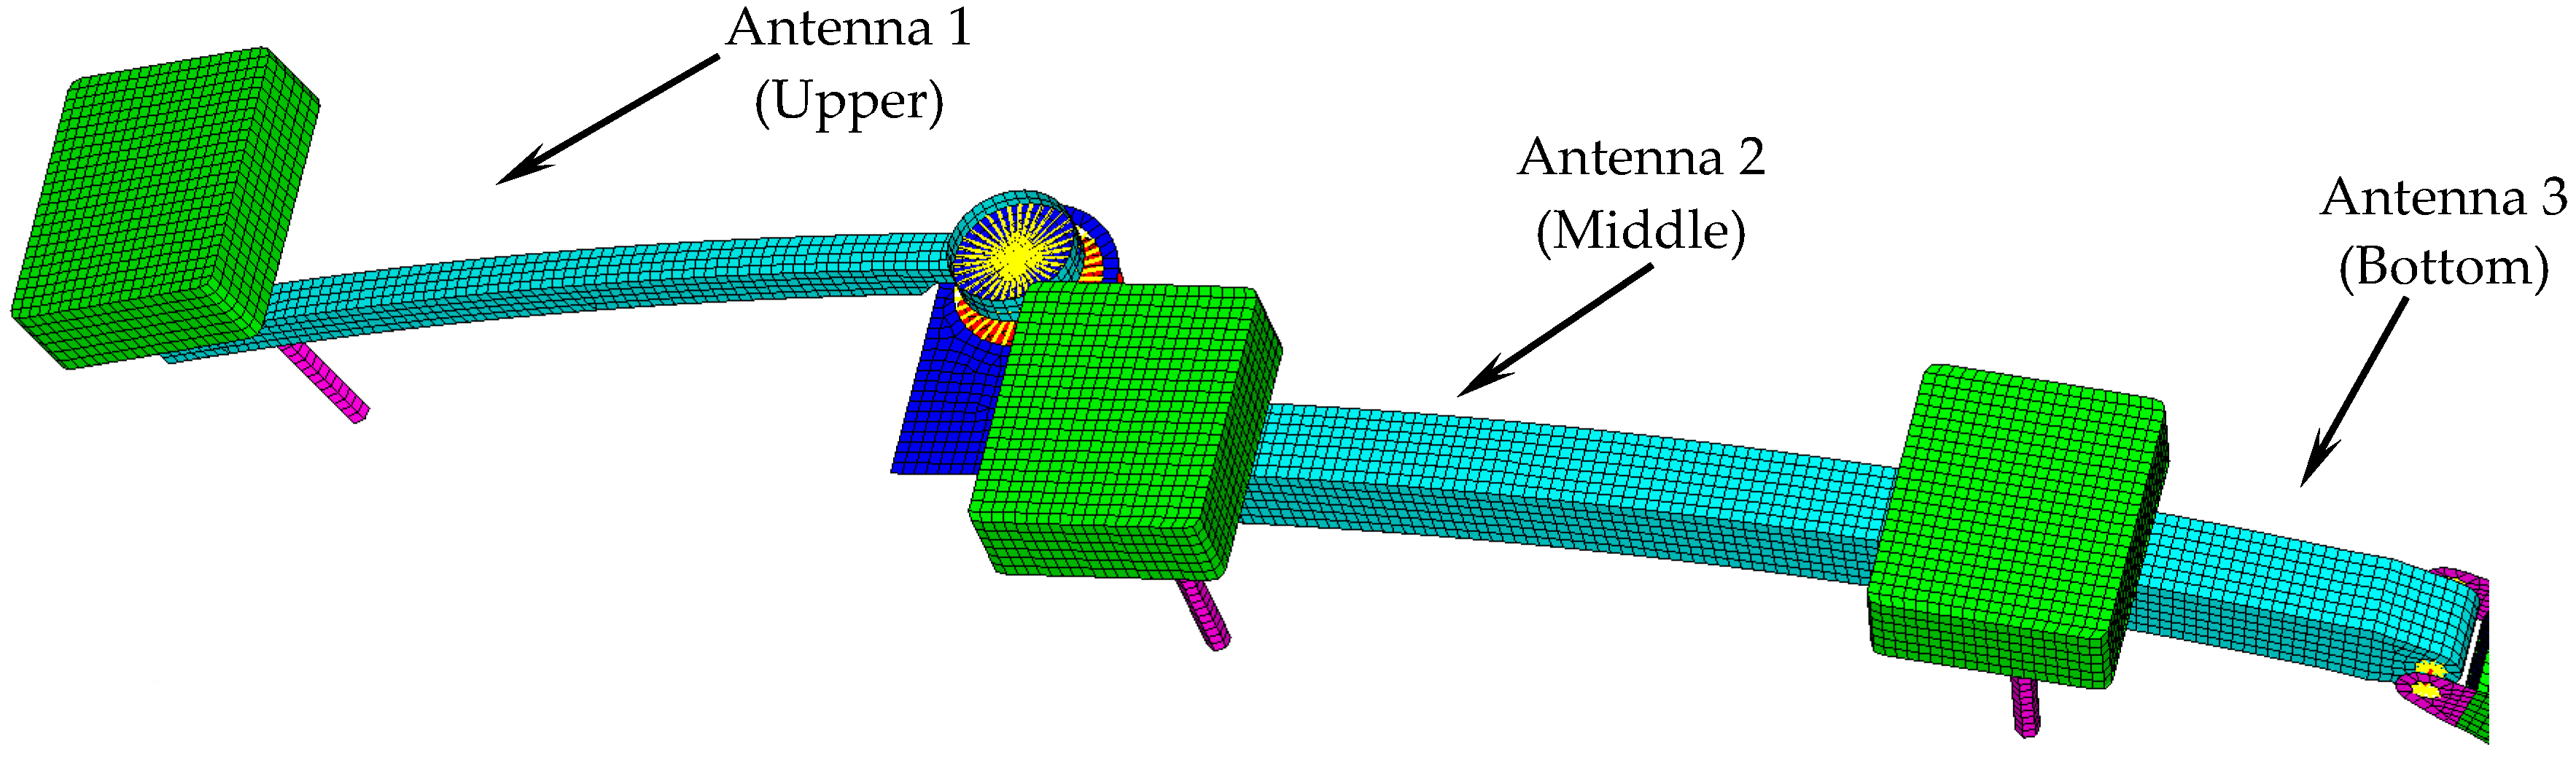
In order to obtain accurate vibration characteristics of the detection device, modeling and simulation should be carried out to restore the working conditions of detection site presented in
Figure 1.
Main technical conditions:
- (1)
Bent arm: refers to the two-section arc rotating arm equipped with three GPR antennas for tunnel lining detection. The arc lengths of the two sections are 1.8 m and 2.2 m, respectively. The mass is 100 kg, and the material is 0.45% carbon steel (45-type steel).
- (2)
Main arm: refers to the telescopic arm of the detection device rooted on the detection vehicle, which is also the main carrier for connecting the bent arm.
The main arm has a telescopic stroke of 3.4 m, an adjustable swinging angle of 60°, and a mass of 850 kg. The telescopic motion is driven by two hydraulic servo cylinders in the sleeve.
The main arm is installed on the lifting platform inside the vehicle and concentrates the main mass of the detection device.
- (3)
Swinging cylinder: refers to the swinging hydraulic cylinder. The swinging of the main arm is driven by one hydraulic cylinder, and the swinging of the bent arm is driven by one hydraulic servo cylinder. The swing adjustment of the bent arm can be carried out during the detection process through the expansion and contraction of the Swinging cylinder.
- (4)
Electric actuator: refers to the linear pusher supporting the Antenna pedestal, and the stroke is 100 mm (If it exceeds 100 mm, there is a risk of interference with the catenary frame or lining surface). The electric actuator is made of aluminum alloy.
- (5)
Rotating motor: before the detection, the upper and lower sections of the bent arm are fully folded and retracted, and the relative 180 °rotation of two sections is realized by the rotating motor during the detection process, the rotating motor does not carry out follow-up adjustment.
- (6)
GPR antenna: refers to the detection data acquisition sensor. The shell material of the antenna is nylon.
- (7)
Antenna pedestal: refers to the bearing support between the GPR antenna and the bent arm, which can realize the telescopic action relative to the bent arm of the detection device through the electric actuator
The bent arm swinging and the electric actuator telescoping are automatically adjusted in real-time during the detection process to determine the stability and distance (100 ± 20 mm) between the antennas and the tunnel lining surface. Therefore, the bent arm is the key object of simulation calculation and test.
The material parameters details are presented in
Table 1.
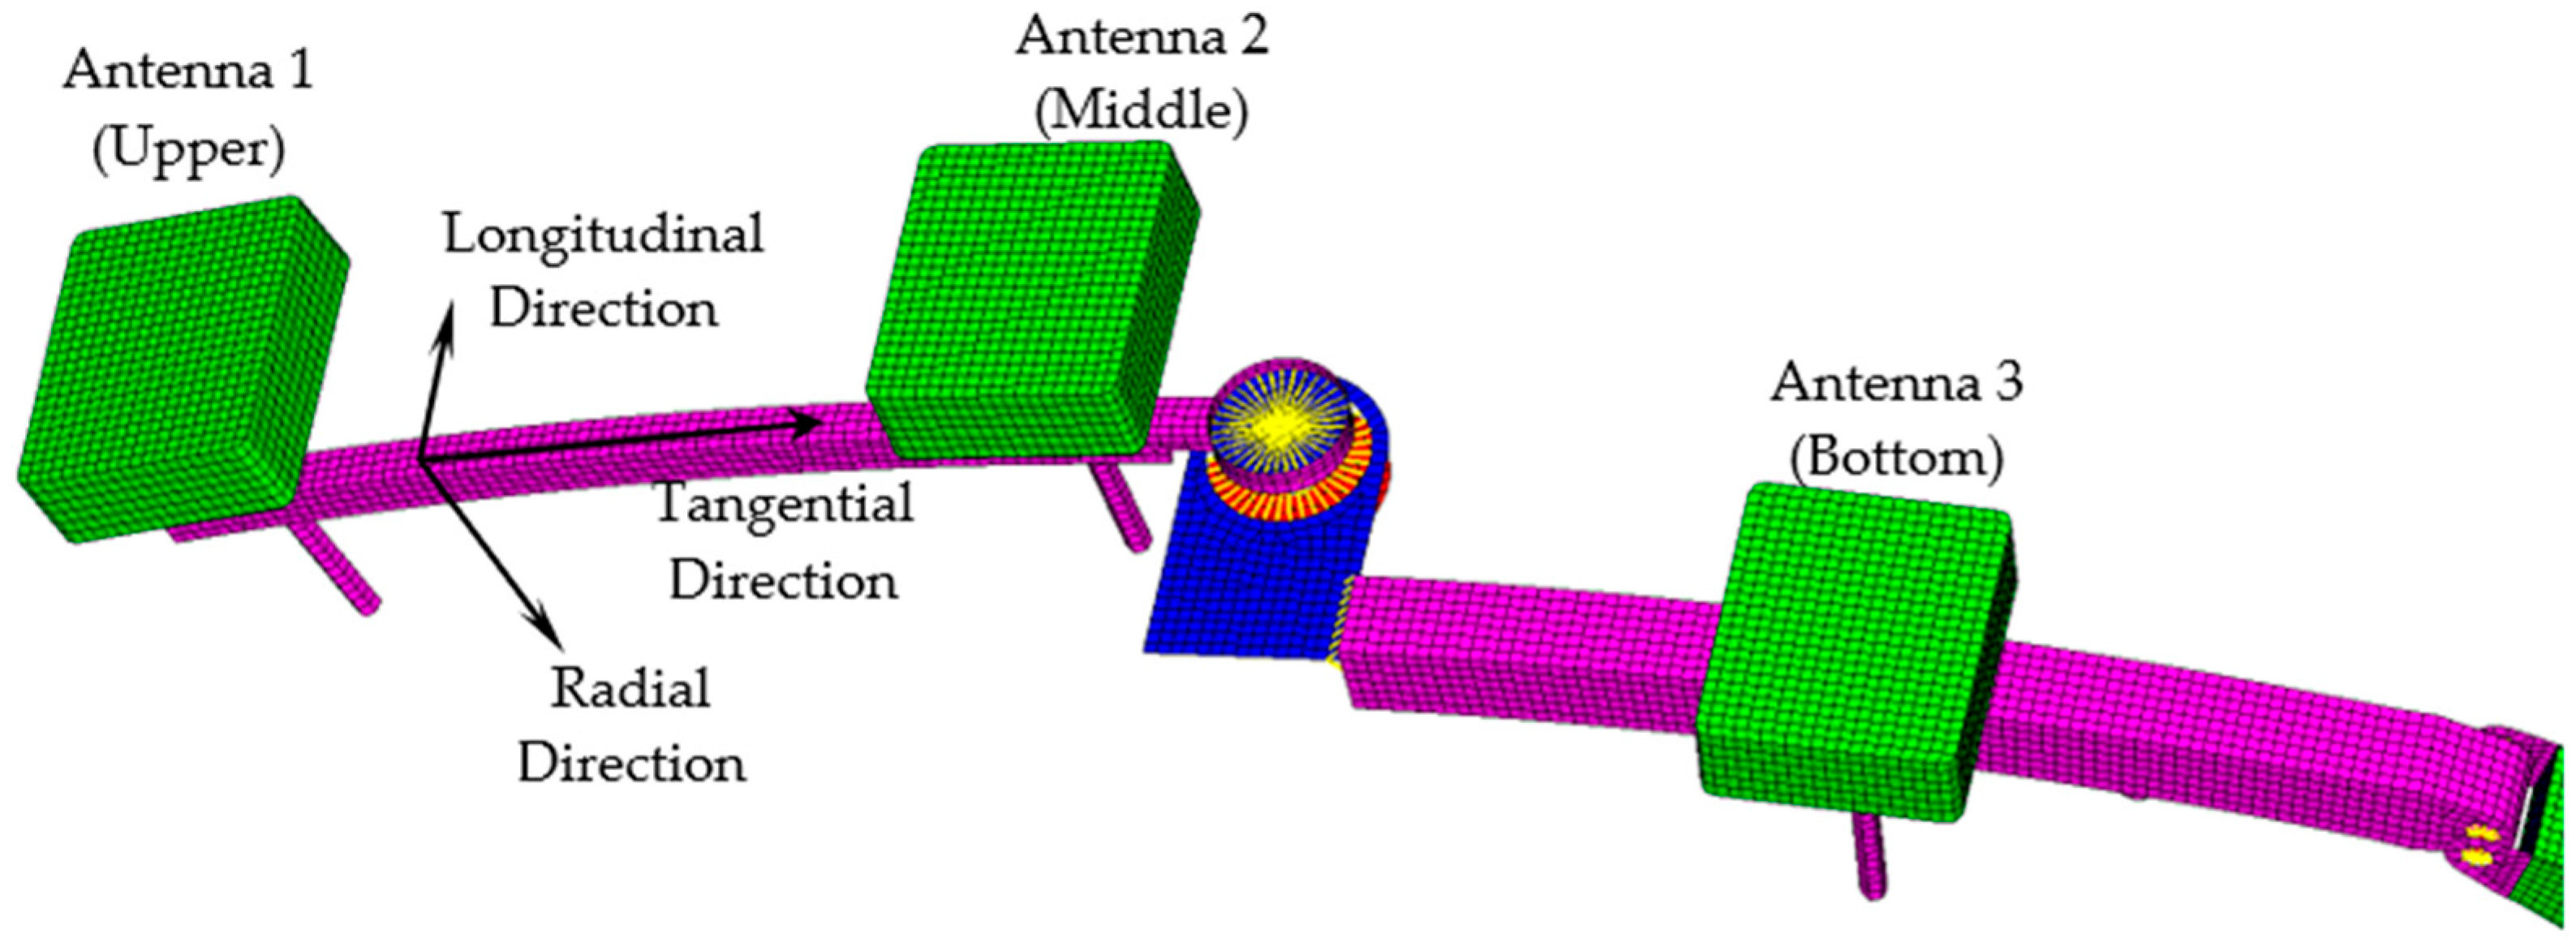
Then, the ABAQUS-Hyper Mesh finite element model is established. The structure type of three-dimensional deformable elastomeric is selected. The global seeds dimension is 0.02. The model is divided into 93,350 units.
The type and quality of the grid unit closely influence the accuracy, smoothness, and spectrum of simulation results. In order to acquire the accurate solution of contact dynamics, the grid unit of the fine linear hexahedral hourglass-stiffness-control-type reducing-integral element C3D8R is divided into mechanical arm in ABAQUS software [
25]. The finite element model is presented in
Figure 2.
The differential equations of the motion represented by the displacement of free vibration Timoshenko beam (considered the torsional effect of the bent arm itself) is [
26]
The general dynamic vibration differential equation (hereinafter referred to as Equation) is
The Lanczos algorithm is selected to do the matrix operations through the linear perturbation frequency method, and the natural frequencies can be effectively solved by using ABAQUS program. Natural frequencies calculation results are presented in
Table 2.
The longitudinal direction is defined as the direction of travel of the detection vehicle and the radial direction is the direction of oscillation of the device’s bent arm towards the vehicle width section. These two directions are intersecting vertically.
3. Vibration Characteristics Simulation and Test of the Detection Device
3.1. The Amplitude and Frequency Characteristics Simulation Analysis of Forced Vibration under Different Working Conditions
The vibration of the detection device can be roughly divided into two categories, one is the longitudinal vibration caused by the vehicle running, and the other is the radial vibration caused by the dynamic servo adjustment of the main arm bent arm. Longitudinal vibration occurs in three working conditions: the start-up moment, the normal detection stage of 5 km·h−1 velocity, and the emergency braking. Vibration characteristic is most seriously affected during the start-up and emergency braking stages, which may have a certain influence on the data results. However, the duration is short in the whole detection process.
The radial vibration changes the distance between the antenna and lining significantly and frequently, which is bound to have a significant influence on the data results. The implicit dynamic calculation is used in the simulation [
25].
The Newmark method assumes that the acceleration varies linearly within the time interval
, and the following acceleration and velocity equations are used:
Substitute Equations (3) and (4) into Equation (2):
where the effective stiffness matrix is
Implicit analysis iterates the next result repeatedly with the current result and the next unknown result. The iteration converges unconditionally.
The vibration characteristics of the antenna pedestals not only reflect the dynamic characteristics of the bent arm but also directly act on the GPR antennas, which could provide an excitation basis for the experimental study of the GPR echo signal.
The dynamic expectation of the device are as follows:
- (1)
The longitudinal shock vibration amplitude of each antenna pedestal is limited to 25 mm, and the stable amplitude is controlled to 10 mm.
- (2)
The radial vibration amplitude of each antenna pedestal is limited to 20 mm.
3.1.1. Simulation Analysis of Longitudinal Forced Vibration Based on Measured Data of Platform
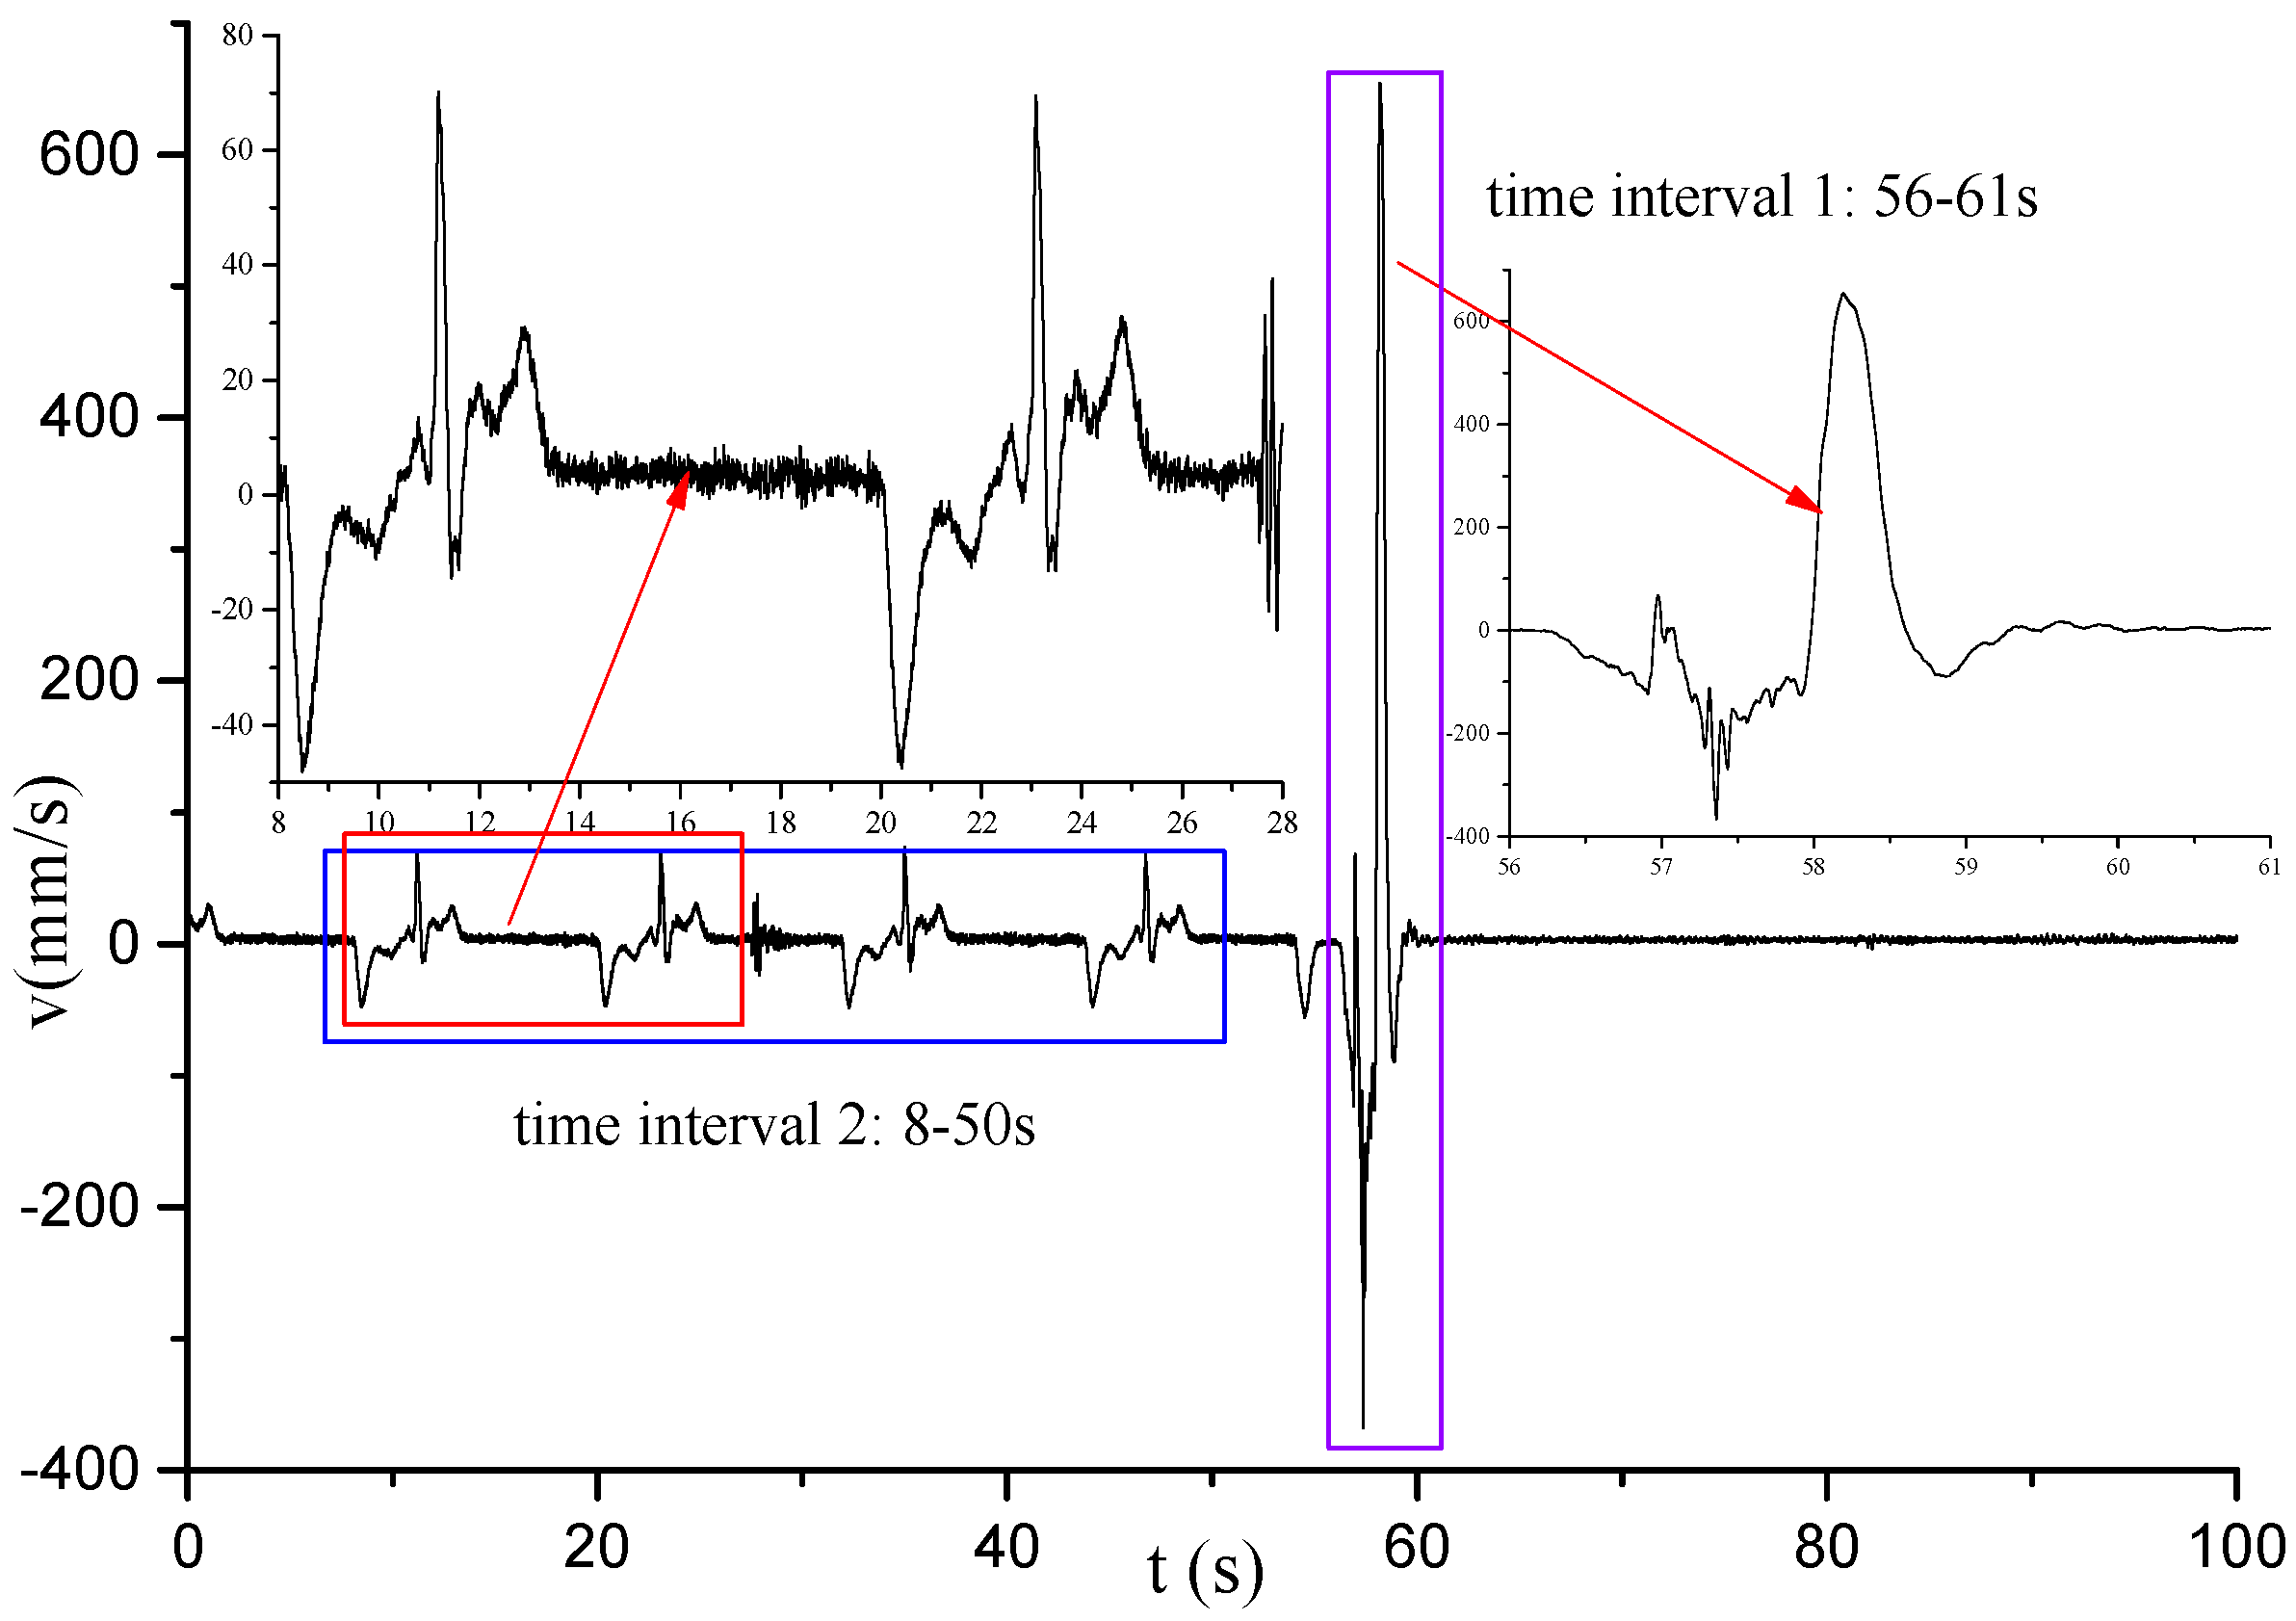
The vibration results of the platform are the most direct boundary conditions for the finite element model of the detection device. The longitudinal vibration data collected for the complete running condition of the platform, specifically including two excitation periods, is shown in
Figure 3.
The two excitation periods are different. The detection vehicle does not have its own traction power. The on-site emergency braking cannot be avoided. The curve of period 1 is the longitudinal vibration speed curve of the platform under the emergency braking of the traction vehicle during the running process of the detection vehicle, and the curve of period 2 corresponds to the test results of the normal running of the detection vehicle under traction.
Time interval 1
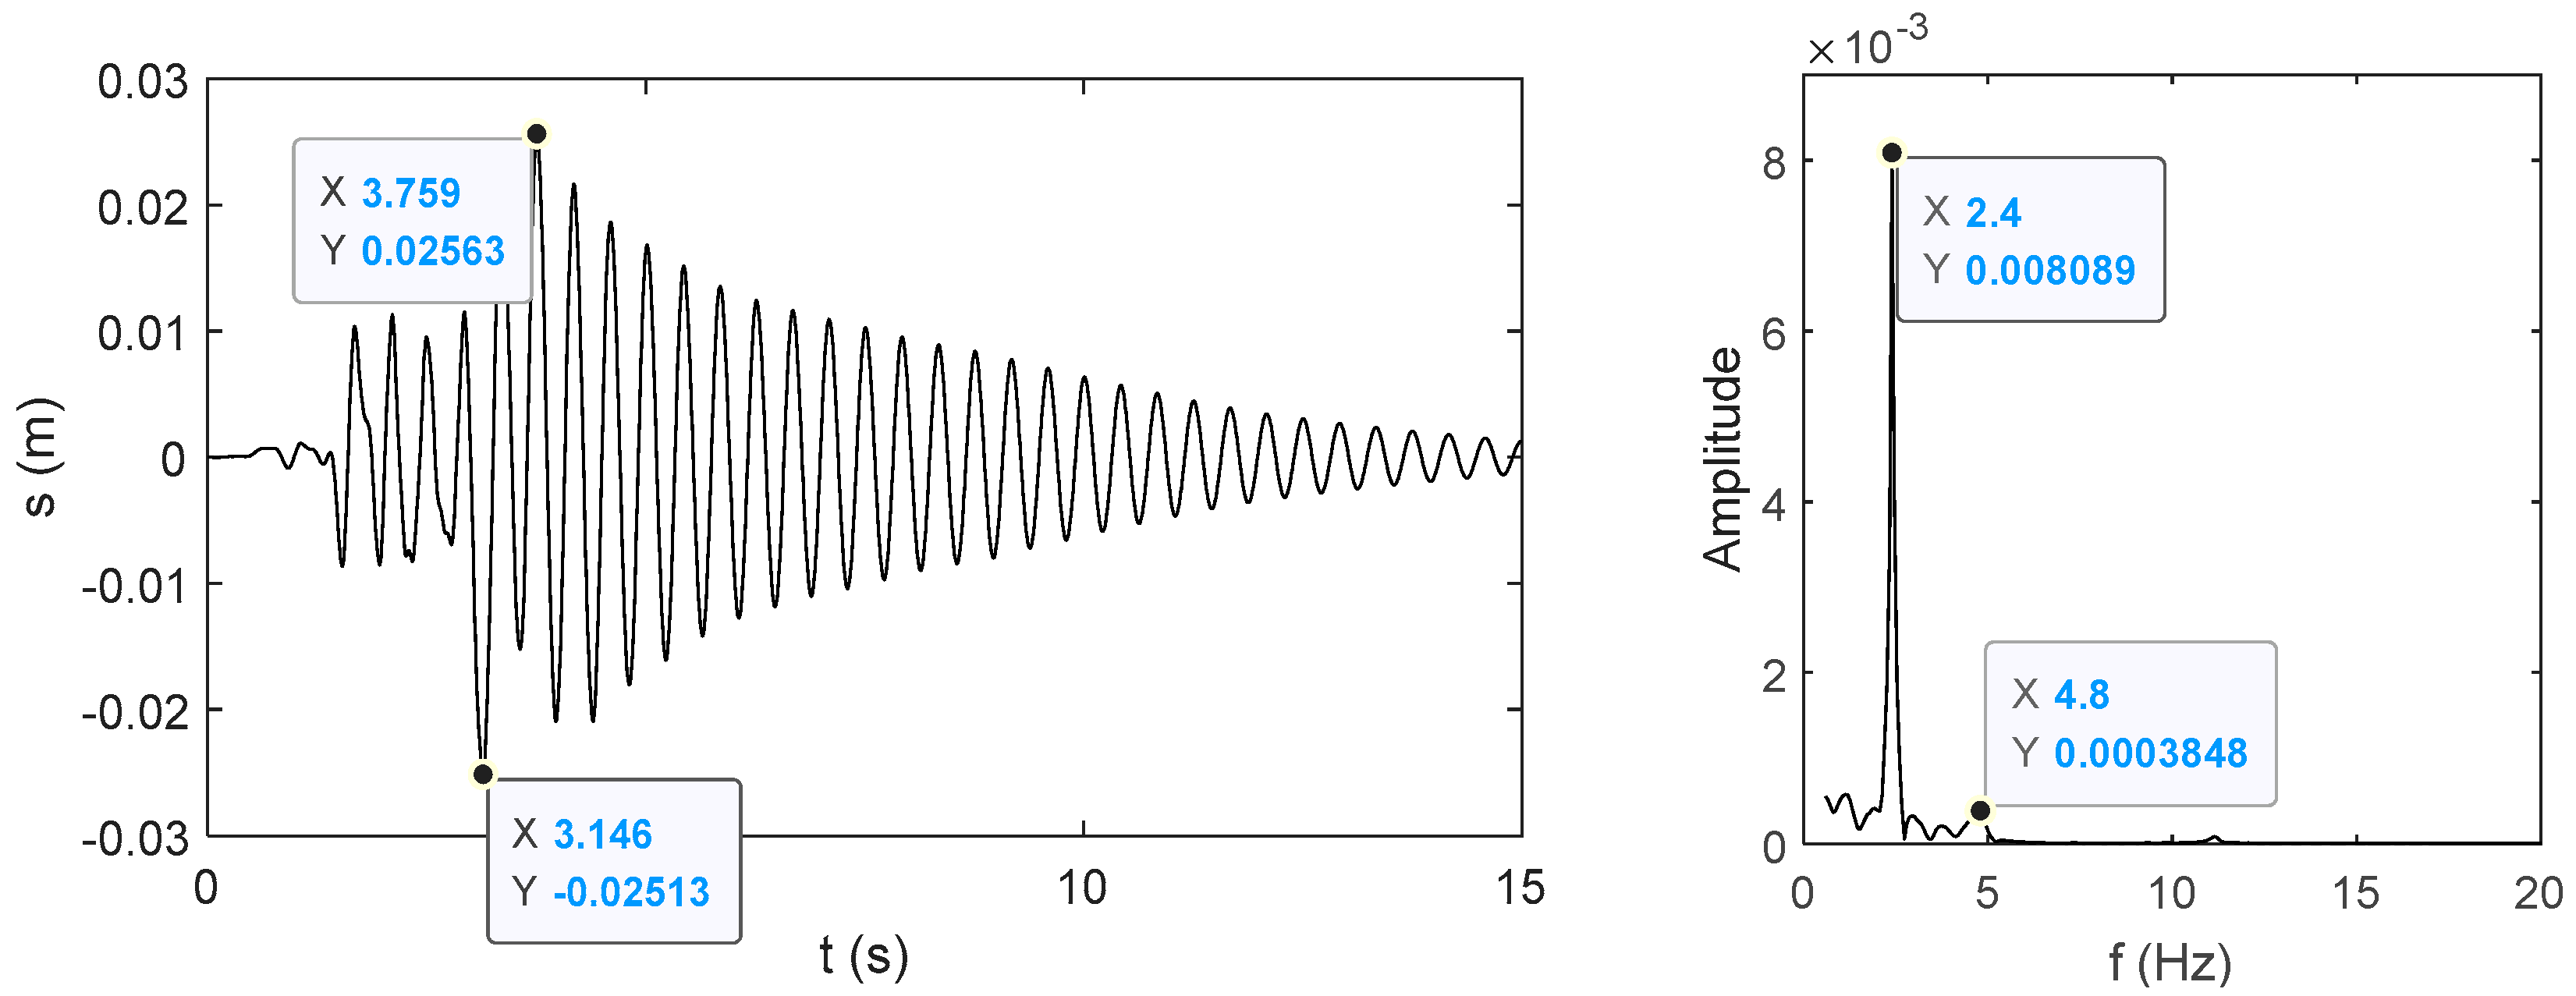
The simulated displacement curve of the Antenna 1 pedestal longitudinal vibration relative to the vehicle body under the large value effect of longitudinal velocity shock is presented in
Figure 4.
Time interval 2
In this period, the longitudinal speed vibration characteristics of the platform are stable as the vehicle runs normally. The relative longitudinal vibration displacement simulation of the Antenna 1 pedestal is presented in
Figure 5.
The data results simulation obtained from the two periods above characterize the 2.4 Hz primary response frequency of vibration displacement, and a secondary dominant frequency around 4.8 Hz with minor amplitude could be discovered. The natural frequencies of the first-order longitudinal vibration and the second-order longitudinal vibration are matched, respectively, and the natural frequencies of the bent arm over the third-order are not excited.
In time period 1, the vibration simulation displacement maximum amplitude under the condition of emergency braking can reach 25 mm, and the decay time is about 6 s. Thus, it is necessary to optimize the mechanical dynamics further. In time period 2, the vibration simulation displacement maximum amplitude is about 4 mm, which does not exceed the dynamic expectation in the process of stable running.
3.1.2. Simulation Analysis of Radial Forced Vibration Based on the Loading Curve of Servo-Hydraulic Cylinder
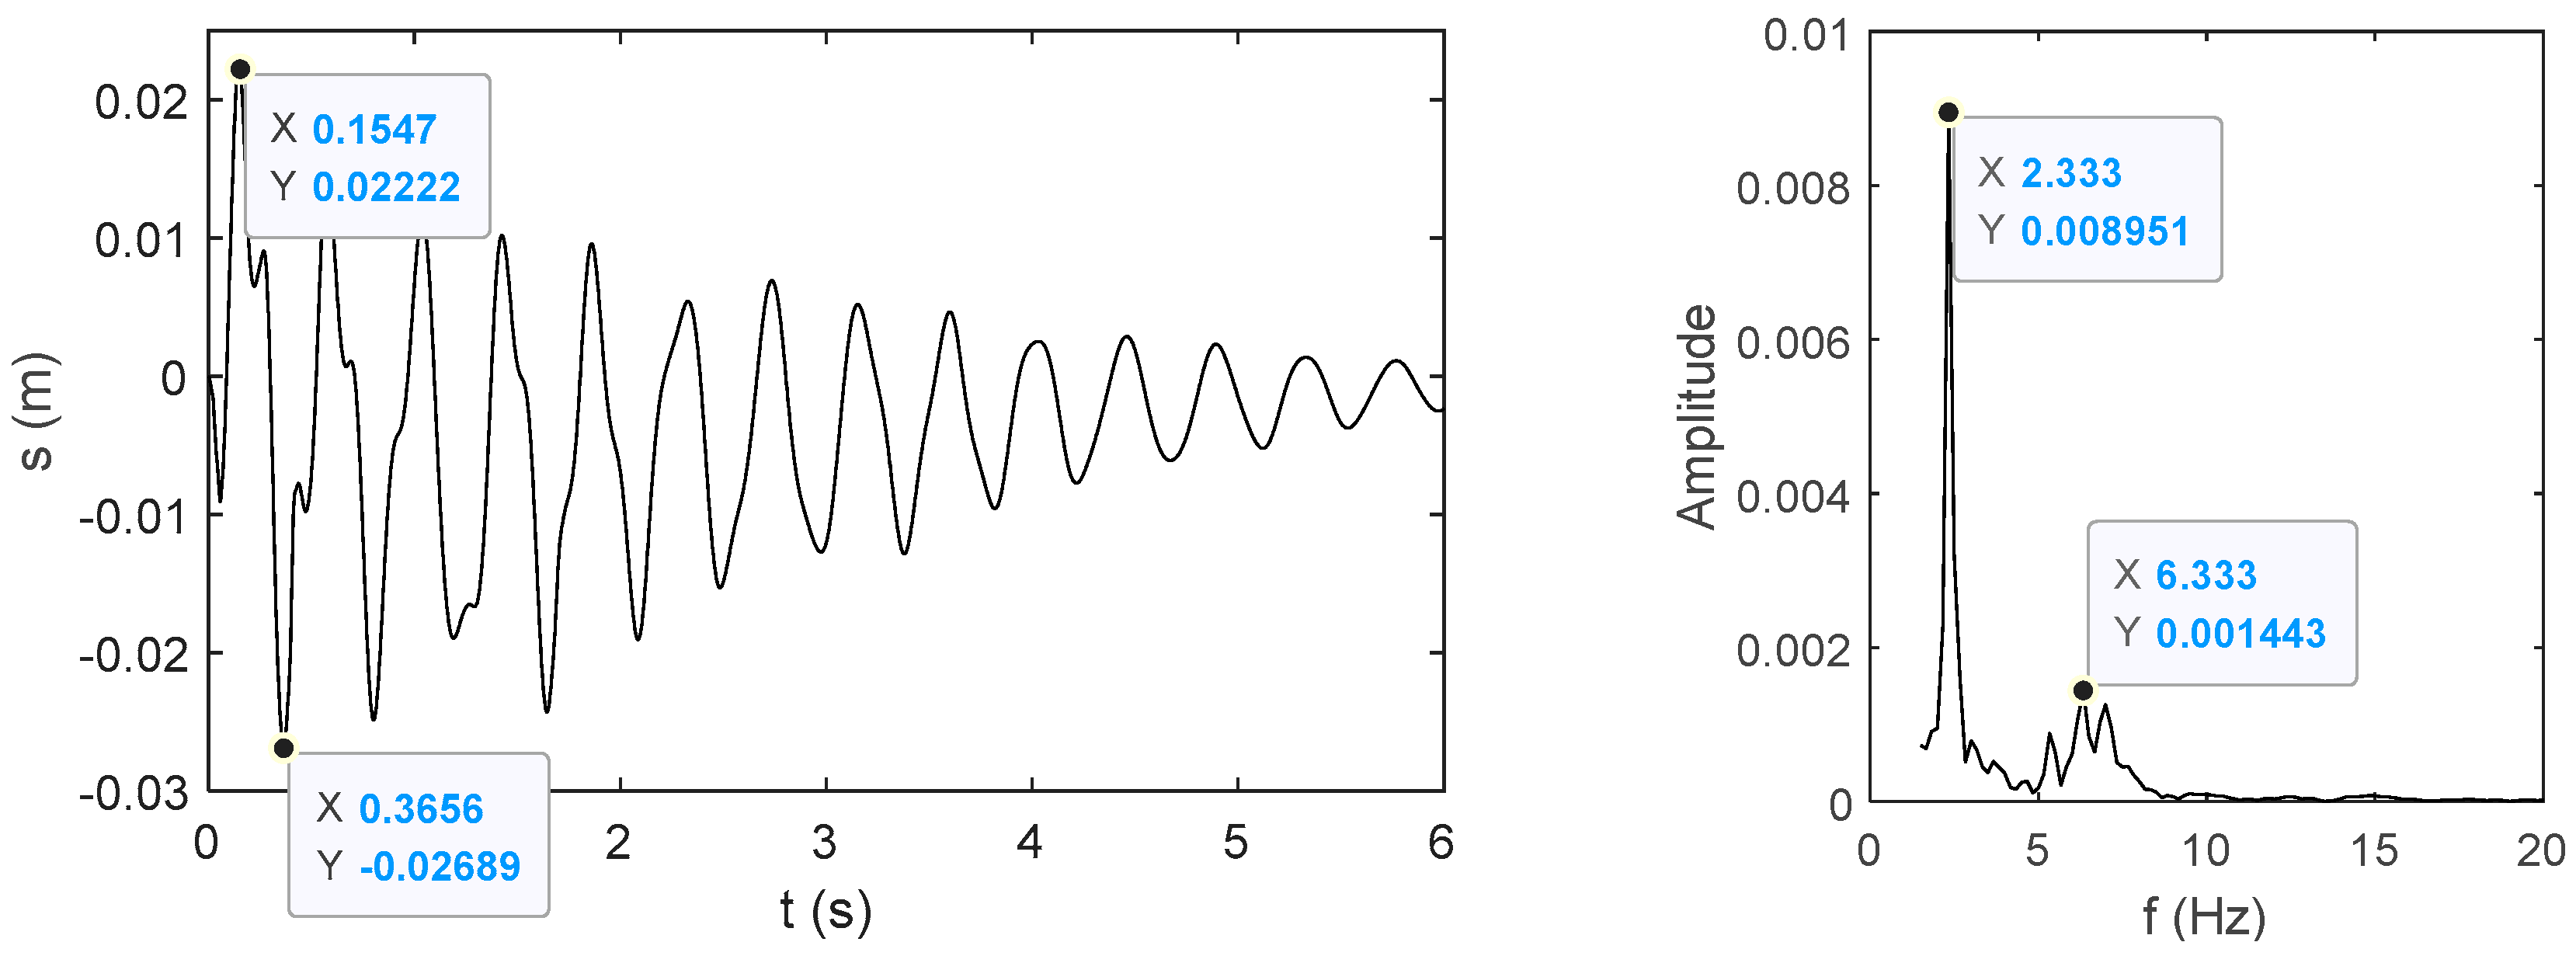
The bent arm pressure range of automatically distance tracking is usually 0.5–3.0 MPa. For the safety and rapid response requirement, the most disadvantageous working conditions are concerned. The maximum transient pressure of 3 MPa is applied in the working area of the hydro-cylinder to make it decay rapidly to 0 within 0.1 s (different adjustment time according to the instant displacement value of closed-loop feedback is usually within 0.1 s), and the bent arm will produce radial shock vibration. The radial vibration amplitude-frequency characteristic of the Antenna 1 pedestal is simulated in
Figure 6.
It is presented from the simulation calculation results, the maximum amplitude of about 25 mm, the main response frequency is 2.33 Hz, and the sub-dominant frequency of about 6.33 Hz with the minor amplitude is visible. These frequencies, respectively, match the first-order radial vibration and the second-order radial vibration natural ones. It could be verified that it is difficult to excite the higher-order response dominant frequency for long cantilever beam structures. The radial adjustment action will be inevitable in the whole detection process. Moreover, the radial vibration will directly affect the stability of the distance between the GPR antenna and the lining surface. Therefore, compared with the longitudinal vibration, optimizing the radial vibration may be more important.
3.2. Analysis of Vibration Amplitude-Frequency Characteristic Tested on Field
On the basis of the simulation analysis, it is vital to obtain the actual measurement results for comparison in order to check the rationality of the modeling simulation calculation and to make the simulation calculation results after structural optimization reliable.
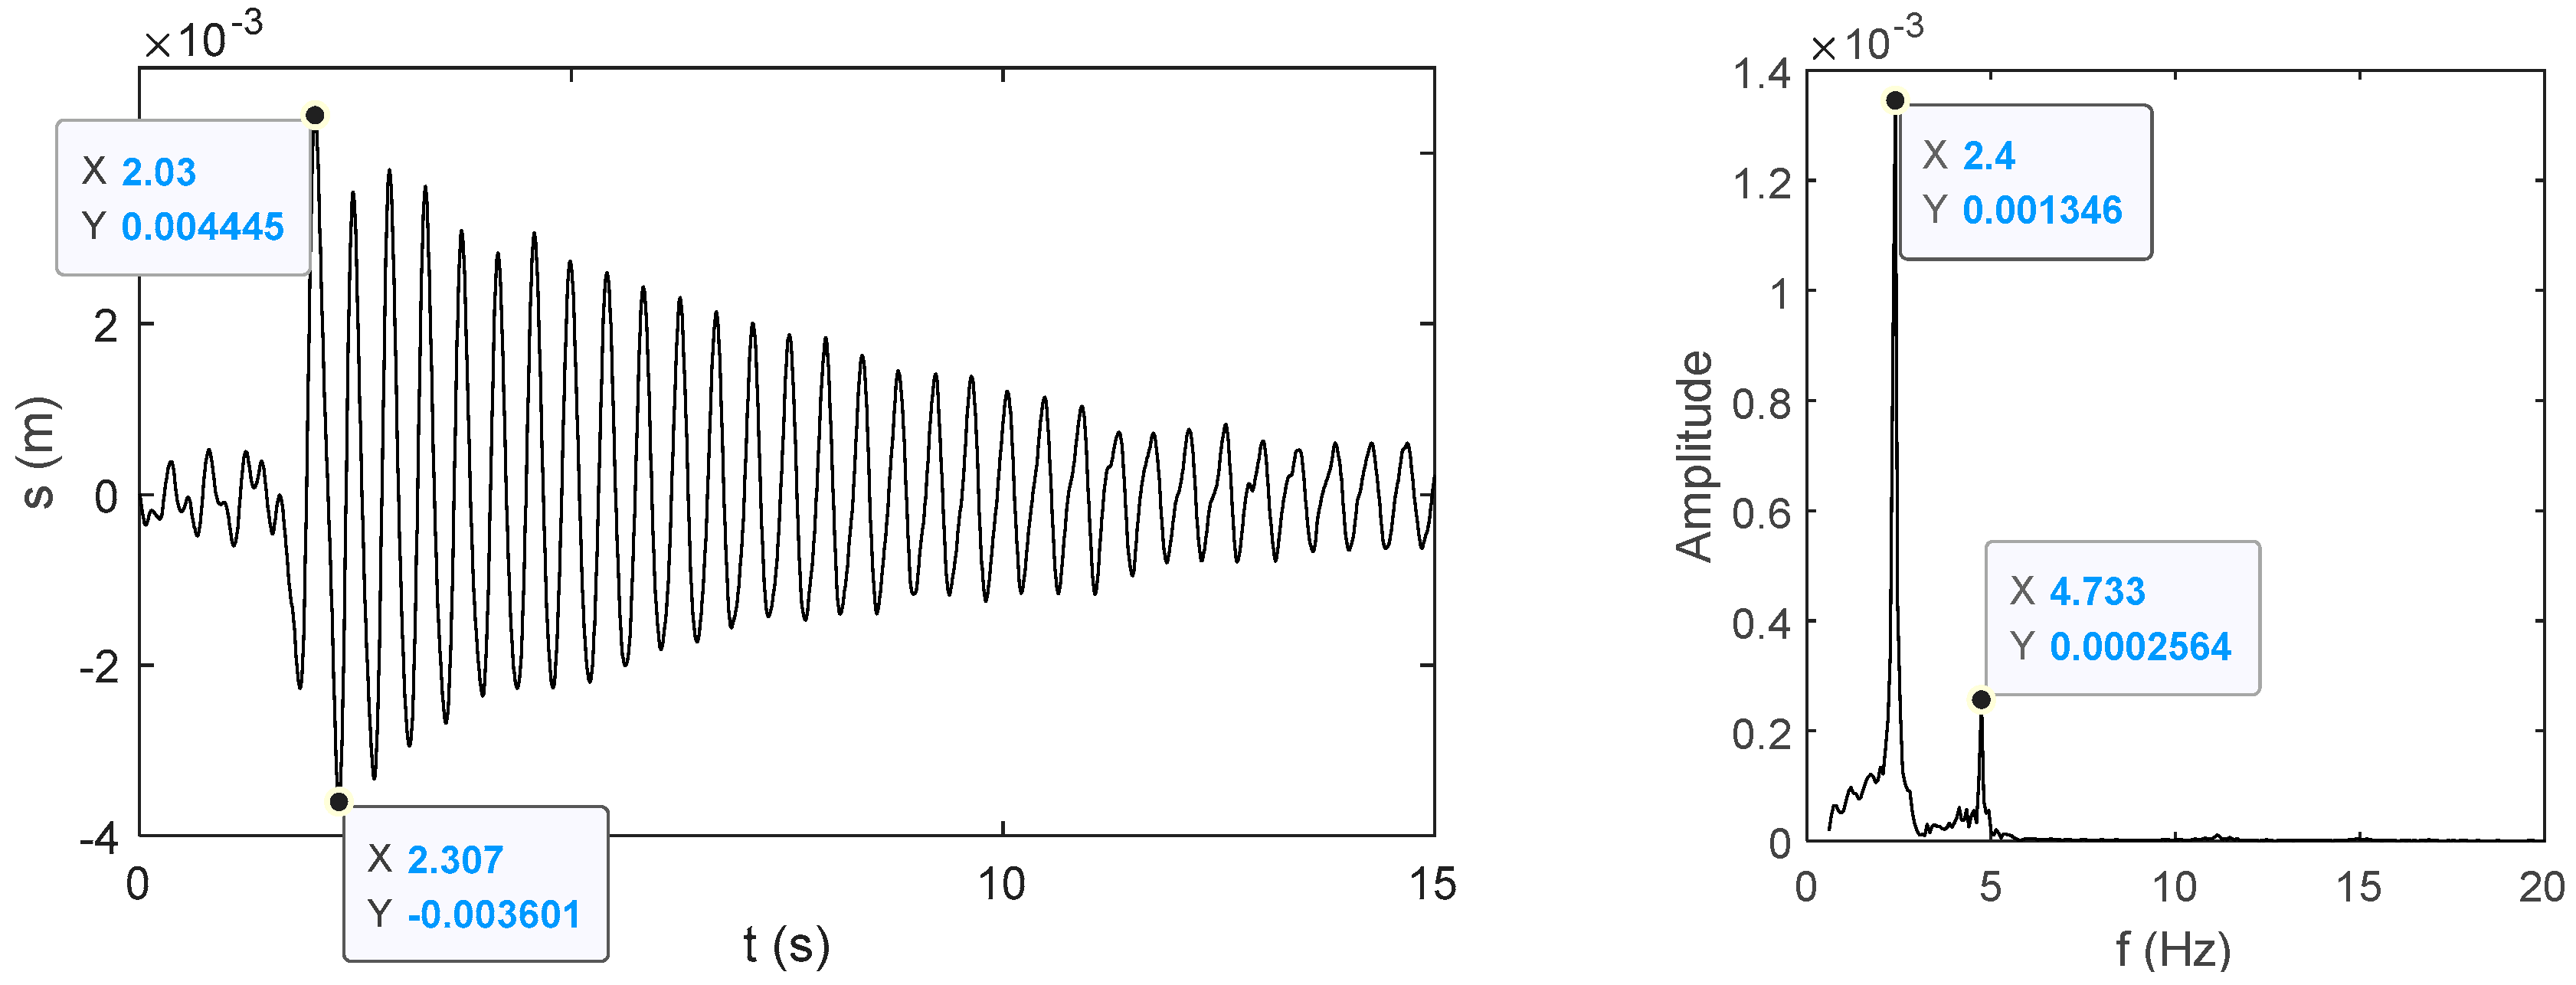
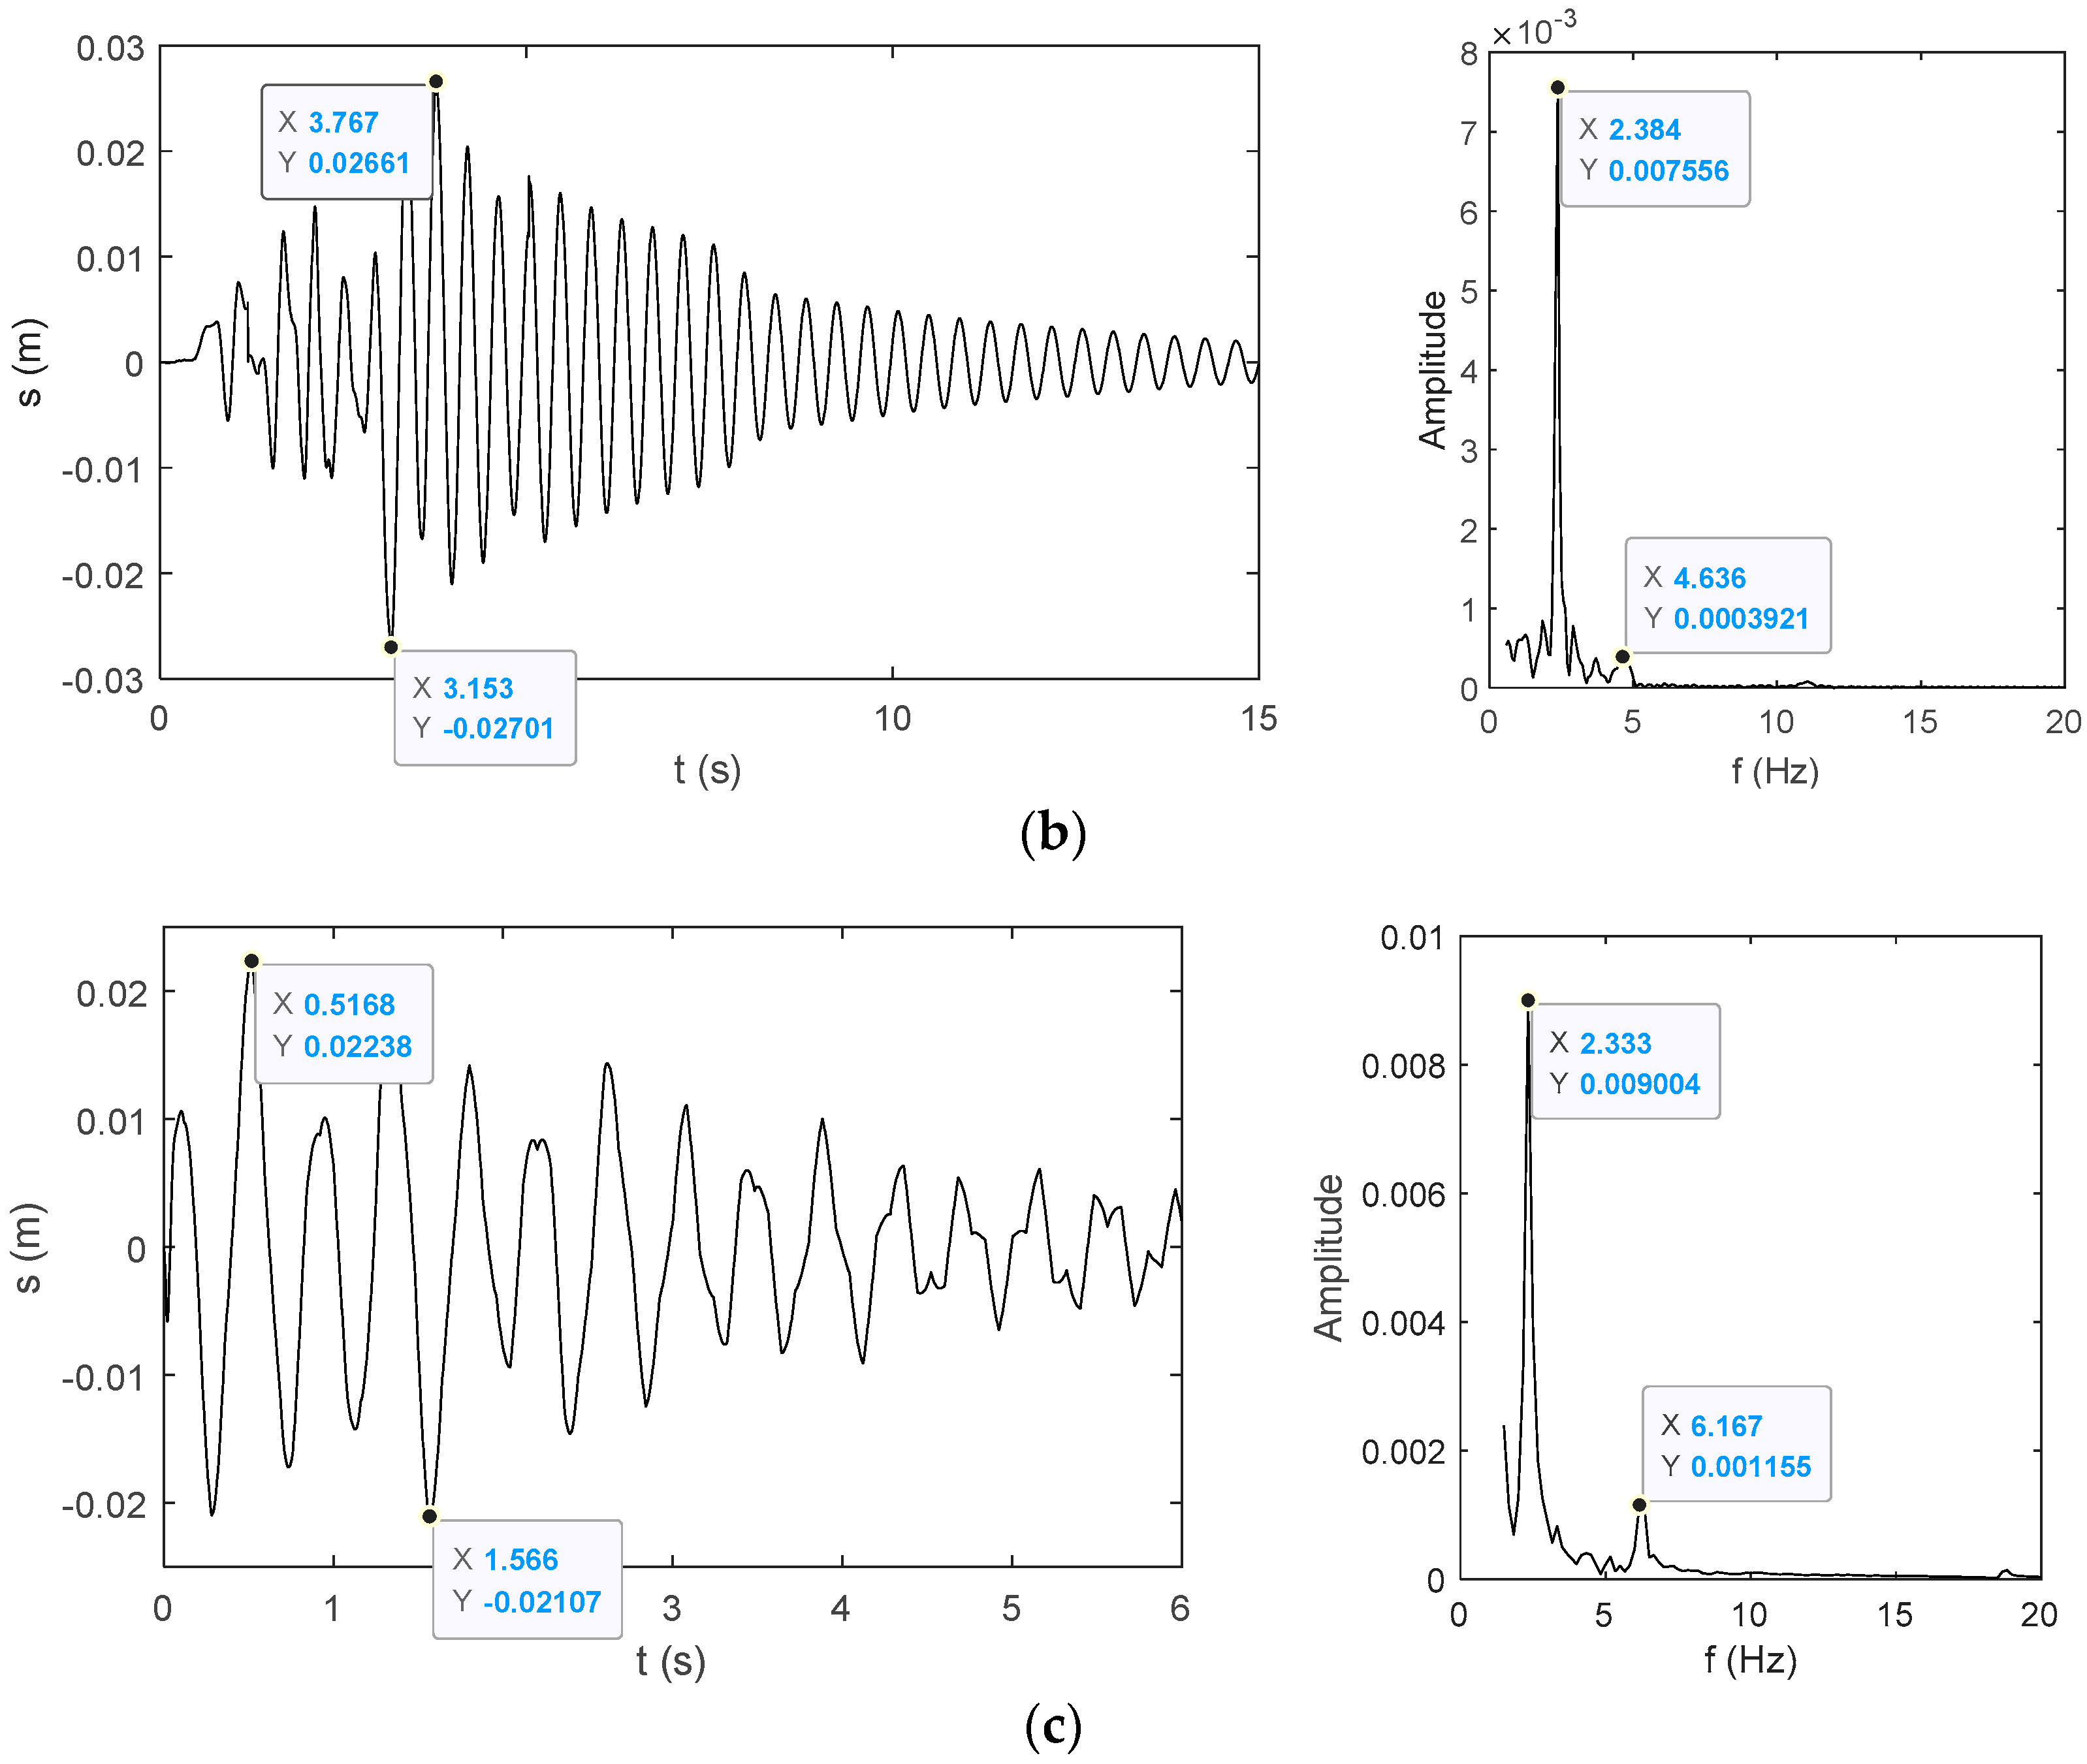
The authors used the three-dimensional vibration sensors to measure the longitudinal and radial vibration response characteristics presented in
Figure 7 of the Antenna 1 pedestal in the detection condition.
According to the results of
Section 3, it could be concluded that:
- (1)
The maximum longitudinal vibration relative displacement amplitude of the Antenna 1 pedestal under emergency braking conditions is 27 mm, and the main response frequency is 2.38 Hz.
- (2)
Maximum radial vibration displacement amplitude during a dynamic adjustment is 22 mm with a decay time of 4–5 s, and the main response frequency is 2.33 Hz.
- (3)
The vibration characteristics under these conditions mainly reflect the first-order natural frequency of each directional vibration mode shapes accompanied by the second-order natural frequency with a minor amplitude. These amplitudes of main dominant frequencies are much higher than those of other response frequencies.
- (4)
The vibration characteristics calculated in this section need to be suppressed, especially radial vibration. There is a risk that the quality of GPR detection data will be seriously affected. The amplitude-frequency adjustment details need to be further verified in combination with the effect on the GPR echo signal.
- (5)
The difference between the measured results and the simulation results is about 10%, which can verify the accuracy and rationality of the simulation.
4. Influence of the Vibration Excitation on the Amplitude-Frequency Sensitivity of GPR Echo Signal when GPR Detects Tunnel Lining
Based on the modal calculations, simulations, and measurements of the Antenna 1 pedestal, it is planned that the excitation conditions will be applied gradually by the Vibration Generating Table (hereinafter referred to as VGT) in order to achieve completeness in the coverage of the excitation parameters. The GPR used for calculation, analysis, and experimental research in this section is the GPR system actually carried by the high-speed railway tunnel detection vehicle, which is the Fastwave MCH multi-channel host and HiMod 900 shielded antenna manufactured by IDSGeoradar, Italy. The radar antenna center frequency is 900 MHz, 512 samples/scans are used according to the measured depth range with the 40 ns time range of the high-speed railway tunnel lining thickness and defect. There are three antennas carried by the detection device, and three of them are used by the equivalent system carried in the test.
4.1. Time-Frequency Analysis Methods of GPR Echo Signal
In the transmitting and receiving period of the GPR antenna, the antenna vertical vibration will change the round-trip time of the detected target, the Single Trace Waveform (hereinafter referred to as STW) will shift, and the Radar Profile (hereinafter referred to as RP) will produce certain signal fluctuations. The STW is the most basic and central object reflecting the quality of the signal from the GPR acquisition. The RP is generated by single trace waves. Specifically, the x-axis of STW is the sampling points of 512, the y-axis is the corresponding electrical signal value, and the value is taken as a column. Then, the columns created by all STWs acquisition along with the movement in the detection process are formed into a matrix, and all the elements in this matrix are obtained gray values. Finally, the RP is generated. The x-axis of RP can be converted into detection travel distance, and the y-axis of RP can be converted into time window coordinates. Therefore, the RP is usually presented as the final data for analysis to distinguish the defects intuitively.
The antenna horizontal (corresponding to longitudinal in the vehicle-mounted environment) vibration may cause the signal stacking phenomenon of the STW in the vibration period, and the signal continuity of the RP will be influenced.
Section 4.2 will focus on the amplitude and frequency characteristics of GPR echo signals.
4.2. Analysis of the Amplitude and Frequency Characteristics of GPR Echo Signal under Different Vibration Excitations
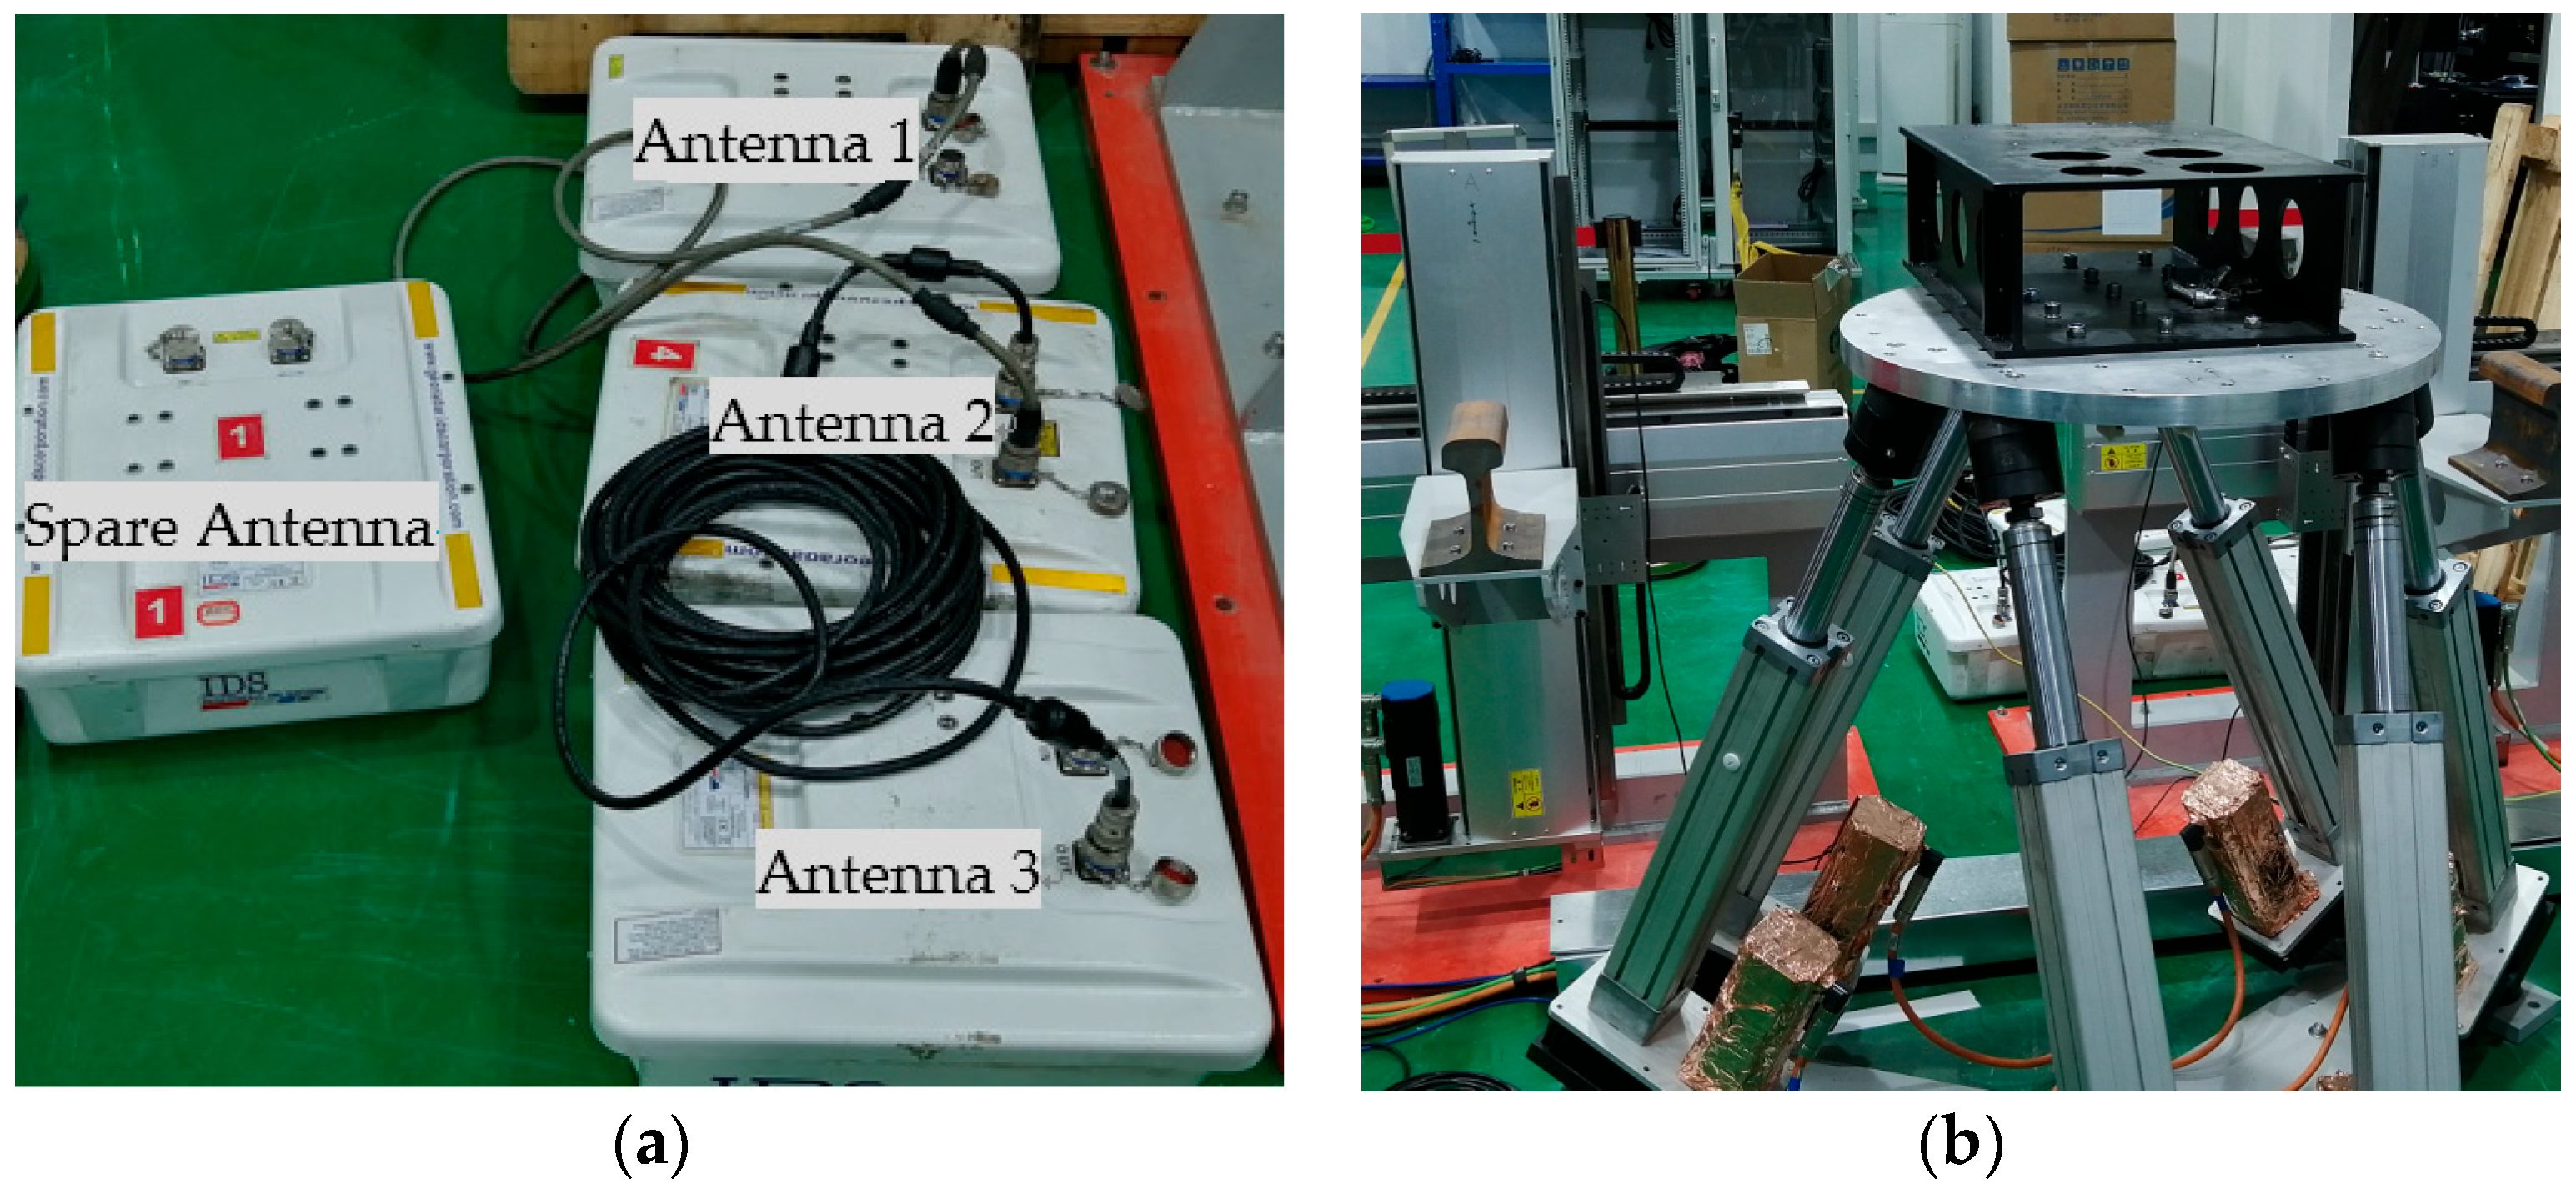
The testing antenna is mounted on the VGT, and the remaining radar antennas are connected in series into the host system according to operating conditions.
The target under test is the concrete lining blocks with a trolley, and the trolley track is parallel to the outside surface of the antenna. The distance datum between the lining blocks and the antenna is set to 100 mm required by technical conditions. After the experiment starts, the trolley will keep a uniform translation motion to avoid repeated iteration of the GPR echo signal statically, which is of detection data practical analysis significance.
Servo motors control the VGT to drive the radar antenna to produce vibrations of different directions, frequencies, and amplitudes.
The main directions are vertical (corresponding to radial in the vehicle-mounted environment) and horizontal. The experimental environment is shown in
Figure 8.
4.2.1. The Influence of the Vibration Excitation Directions on GPR Echo Signal
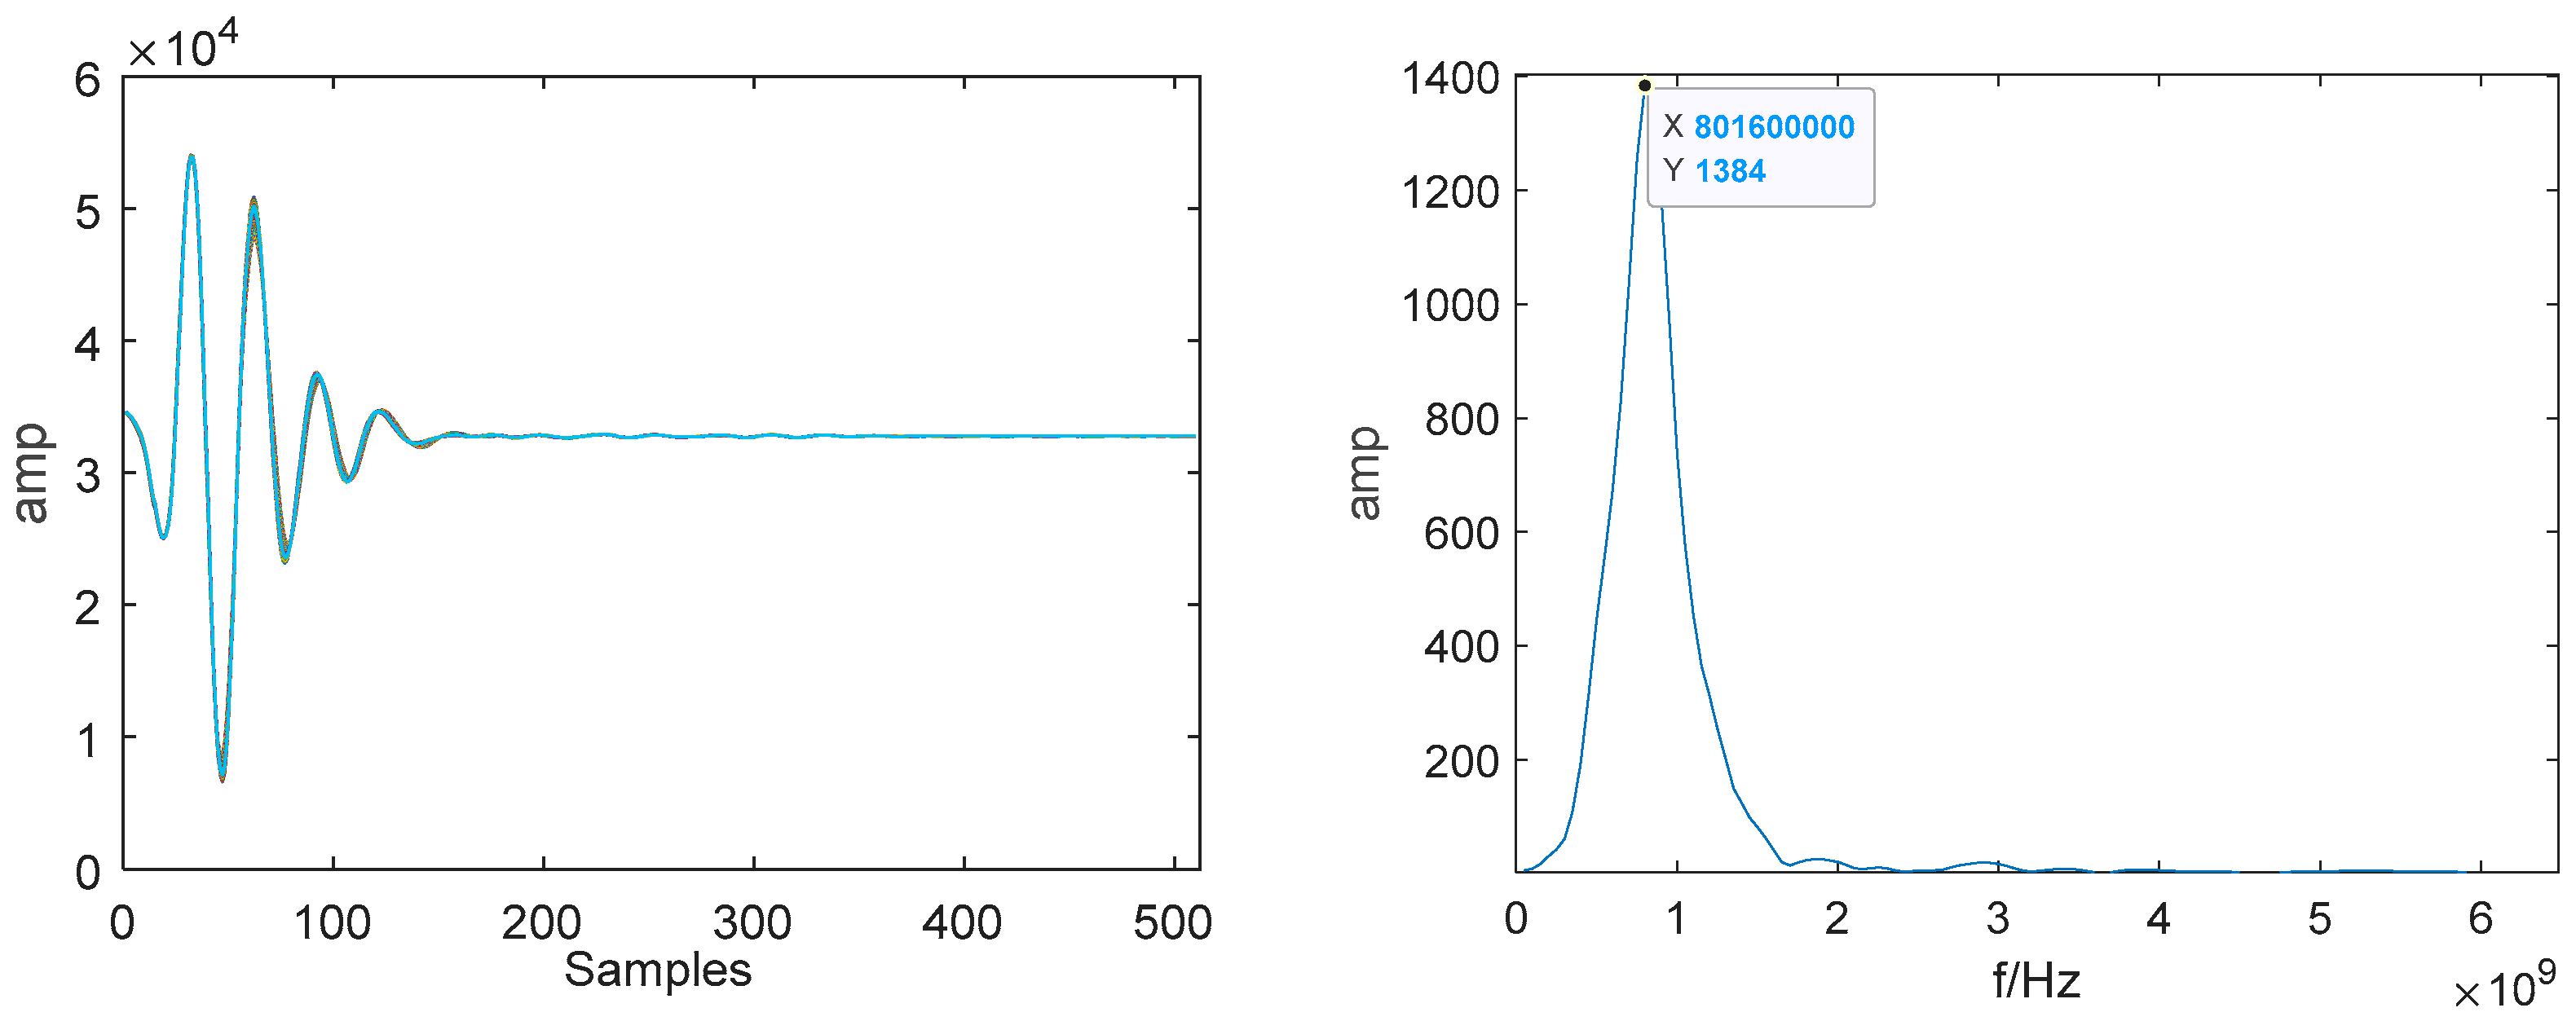
A. Basic time-frequency analysis
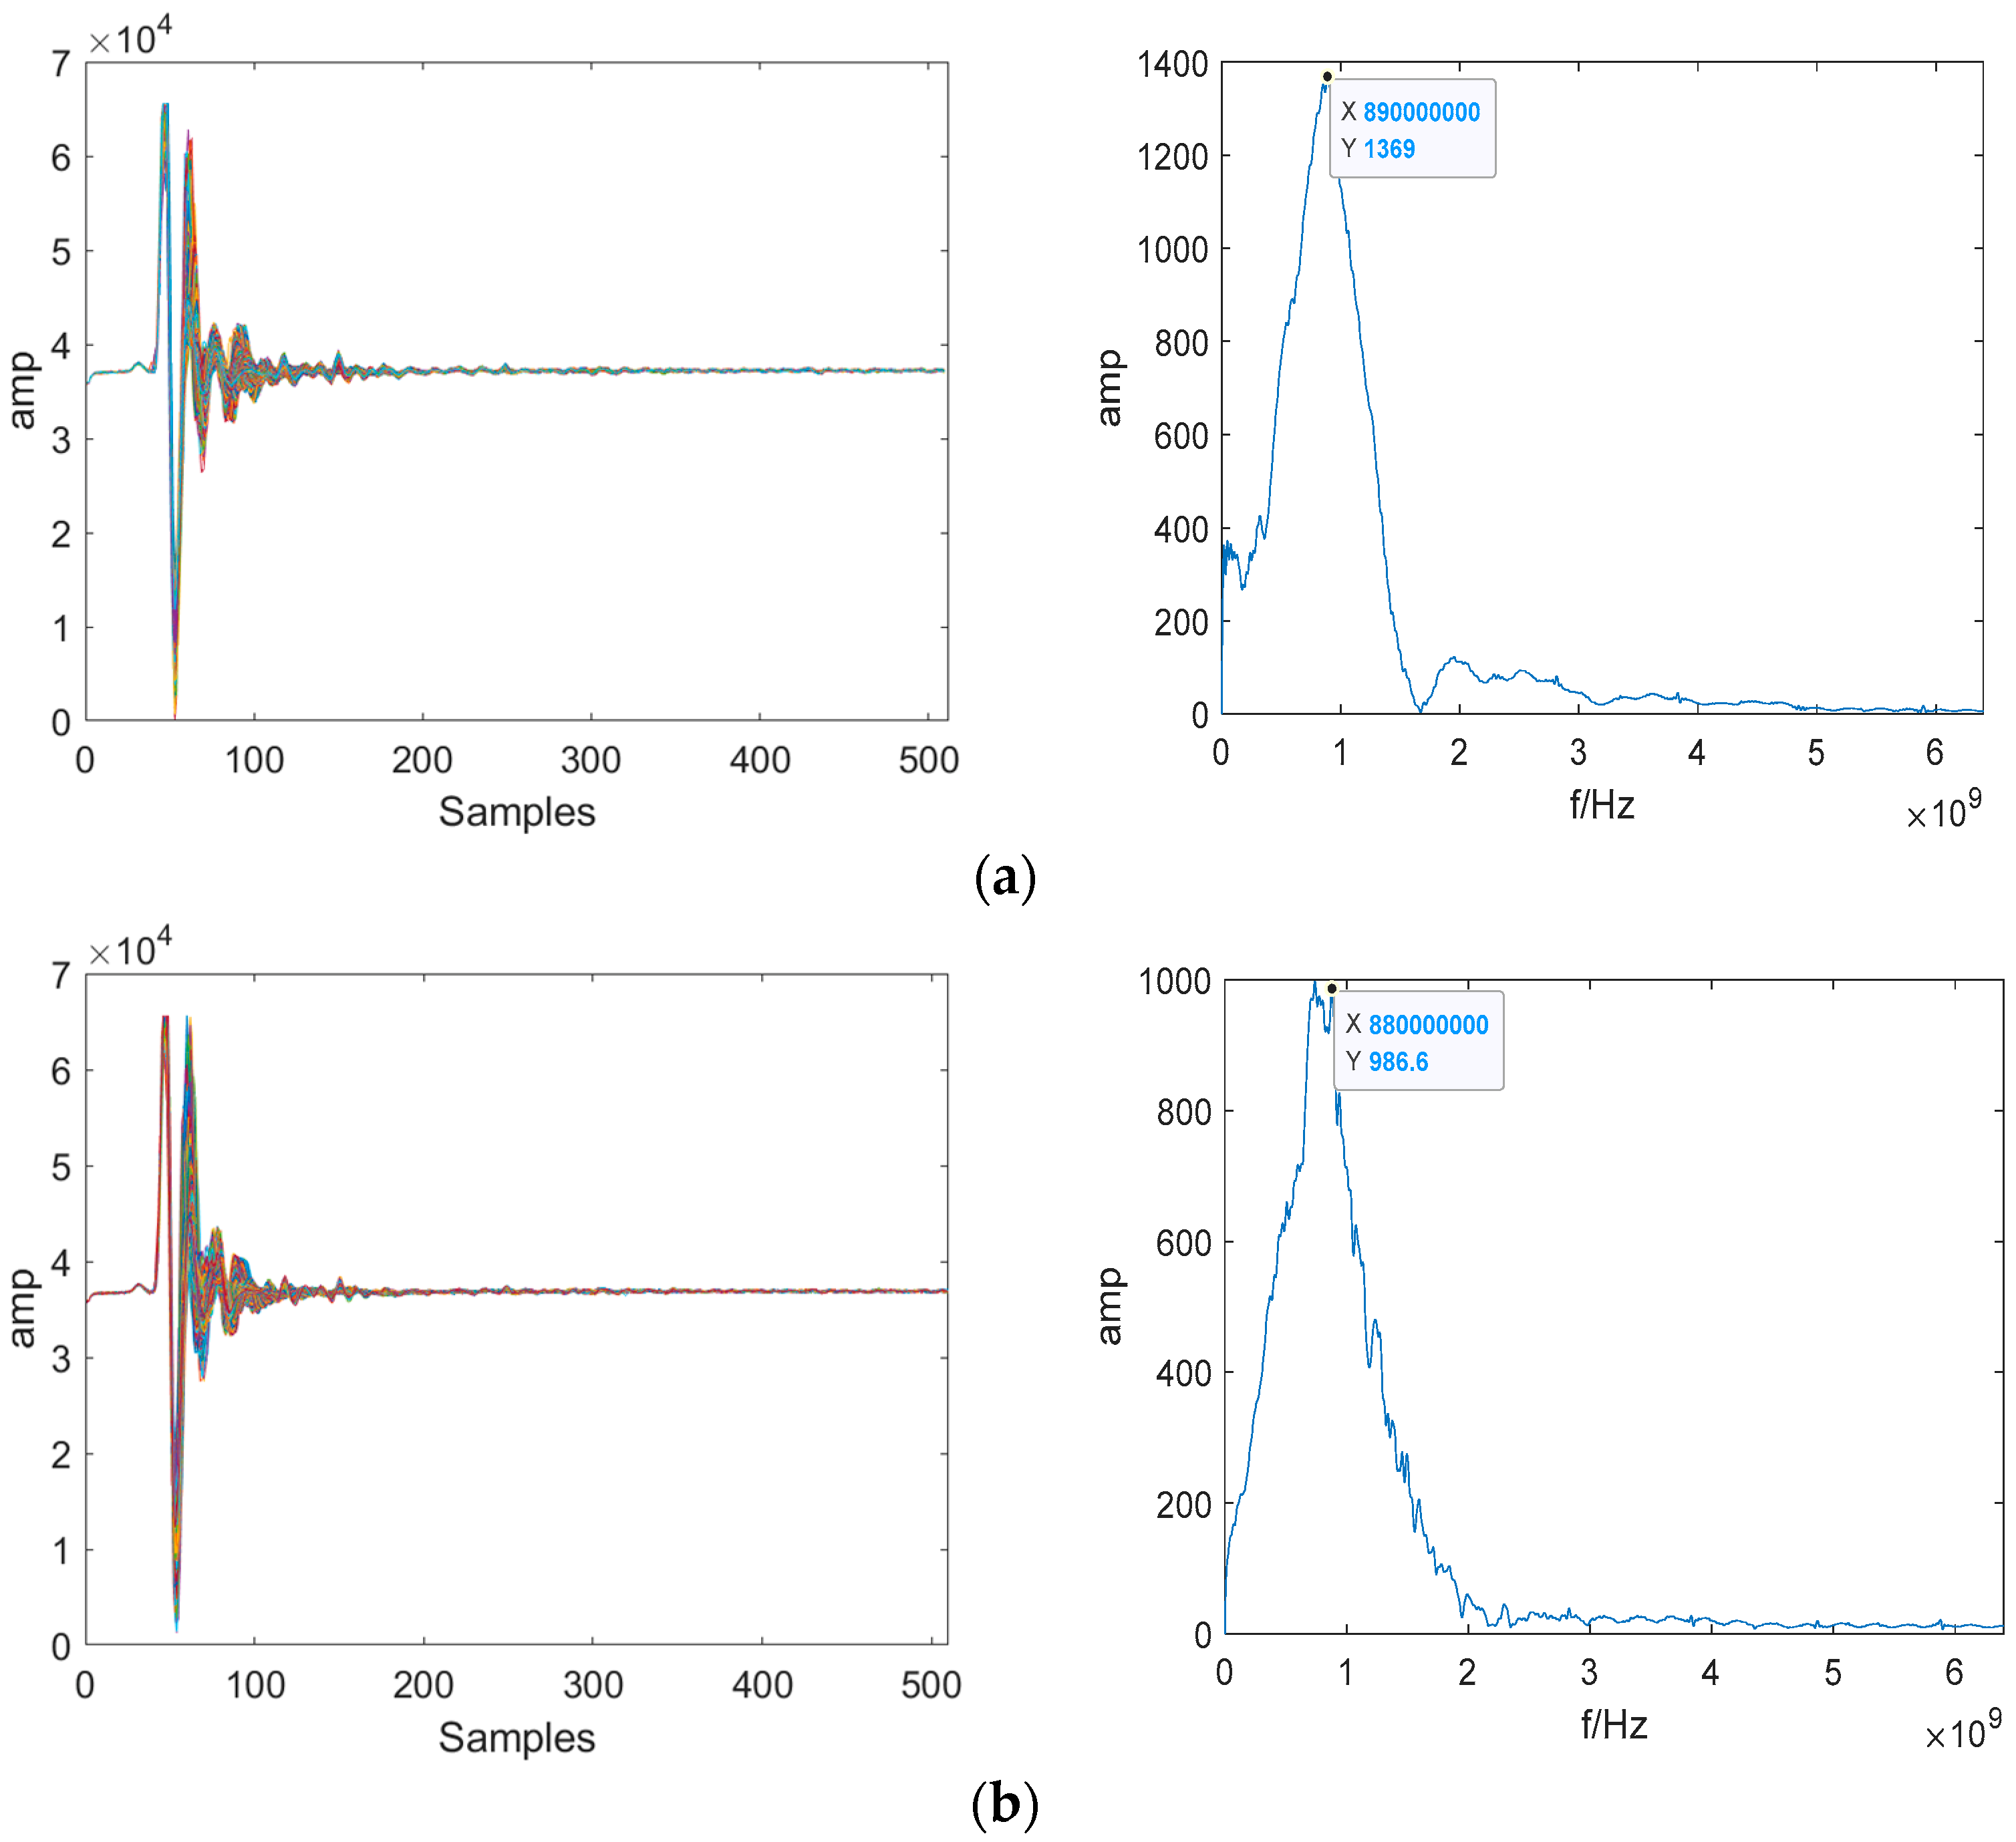
As an example, Time Domain Diagrams (hereinafter referred to as TDD) and spectrums are presented in
Figure 9 under the static condition of GPR antenna. In this article, in order to reflect the stacking characteristics of the STW and to prevent the non-objective characteristics of the trace extracting analysis, all the STWs of the test object are superimposed in the TDD, and the Frequency Amplitude (hereinafter referred to as FA) of the spectrum is the average amplitude after linear summation of all the corresponding STW. Under static conditions, the superposition of STWs has high coincidence. The main frequency band is relatively concentrated without burr interference (refers to the chaotic and sharp interference curve with variable amplitude formed in the main frequency band and its surroundings in the spectrum).
TDDs and spectrums are presented in
Figure 10 for both horizontal and vertical directions under 2.5 Hz-25 mm excitation according to the forced vibration characteristics of Antenna 1 pedestal.
According to the TDDs and spectrums in
Figure 9 and
Figure 10, it can be discovered the stacking signal is very stable under the horizontal vibration conditions compared with that under vertical vibration conditions. From the spectrums, the main frequency is concentrated at 890 MHz with an amplitude of 1369 under the horizontal vibration conditions, while the main frequency is lightly dispersed around 880 MHz with an amplitude of 986.6 under the vertical vibration condition far less than the value of horizontal vibration condition, including many burr interference. Therefore, under the same amplitude and frequency excitation condition, the interference of vertical vibration to the GPR echo signal is significantly greater than that of horizontal vibration.
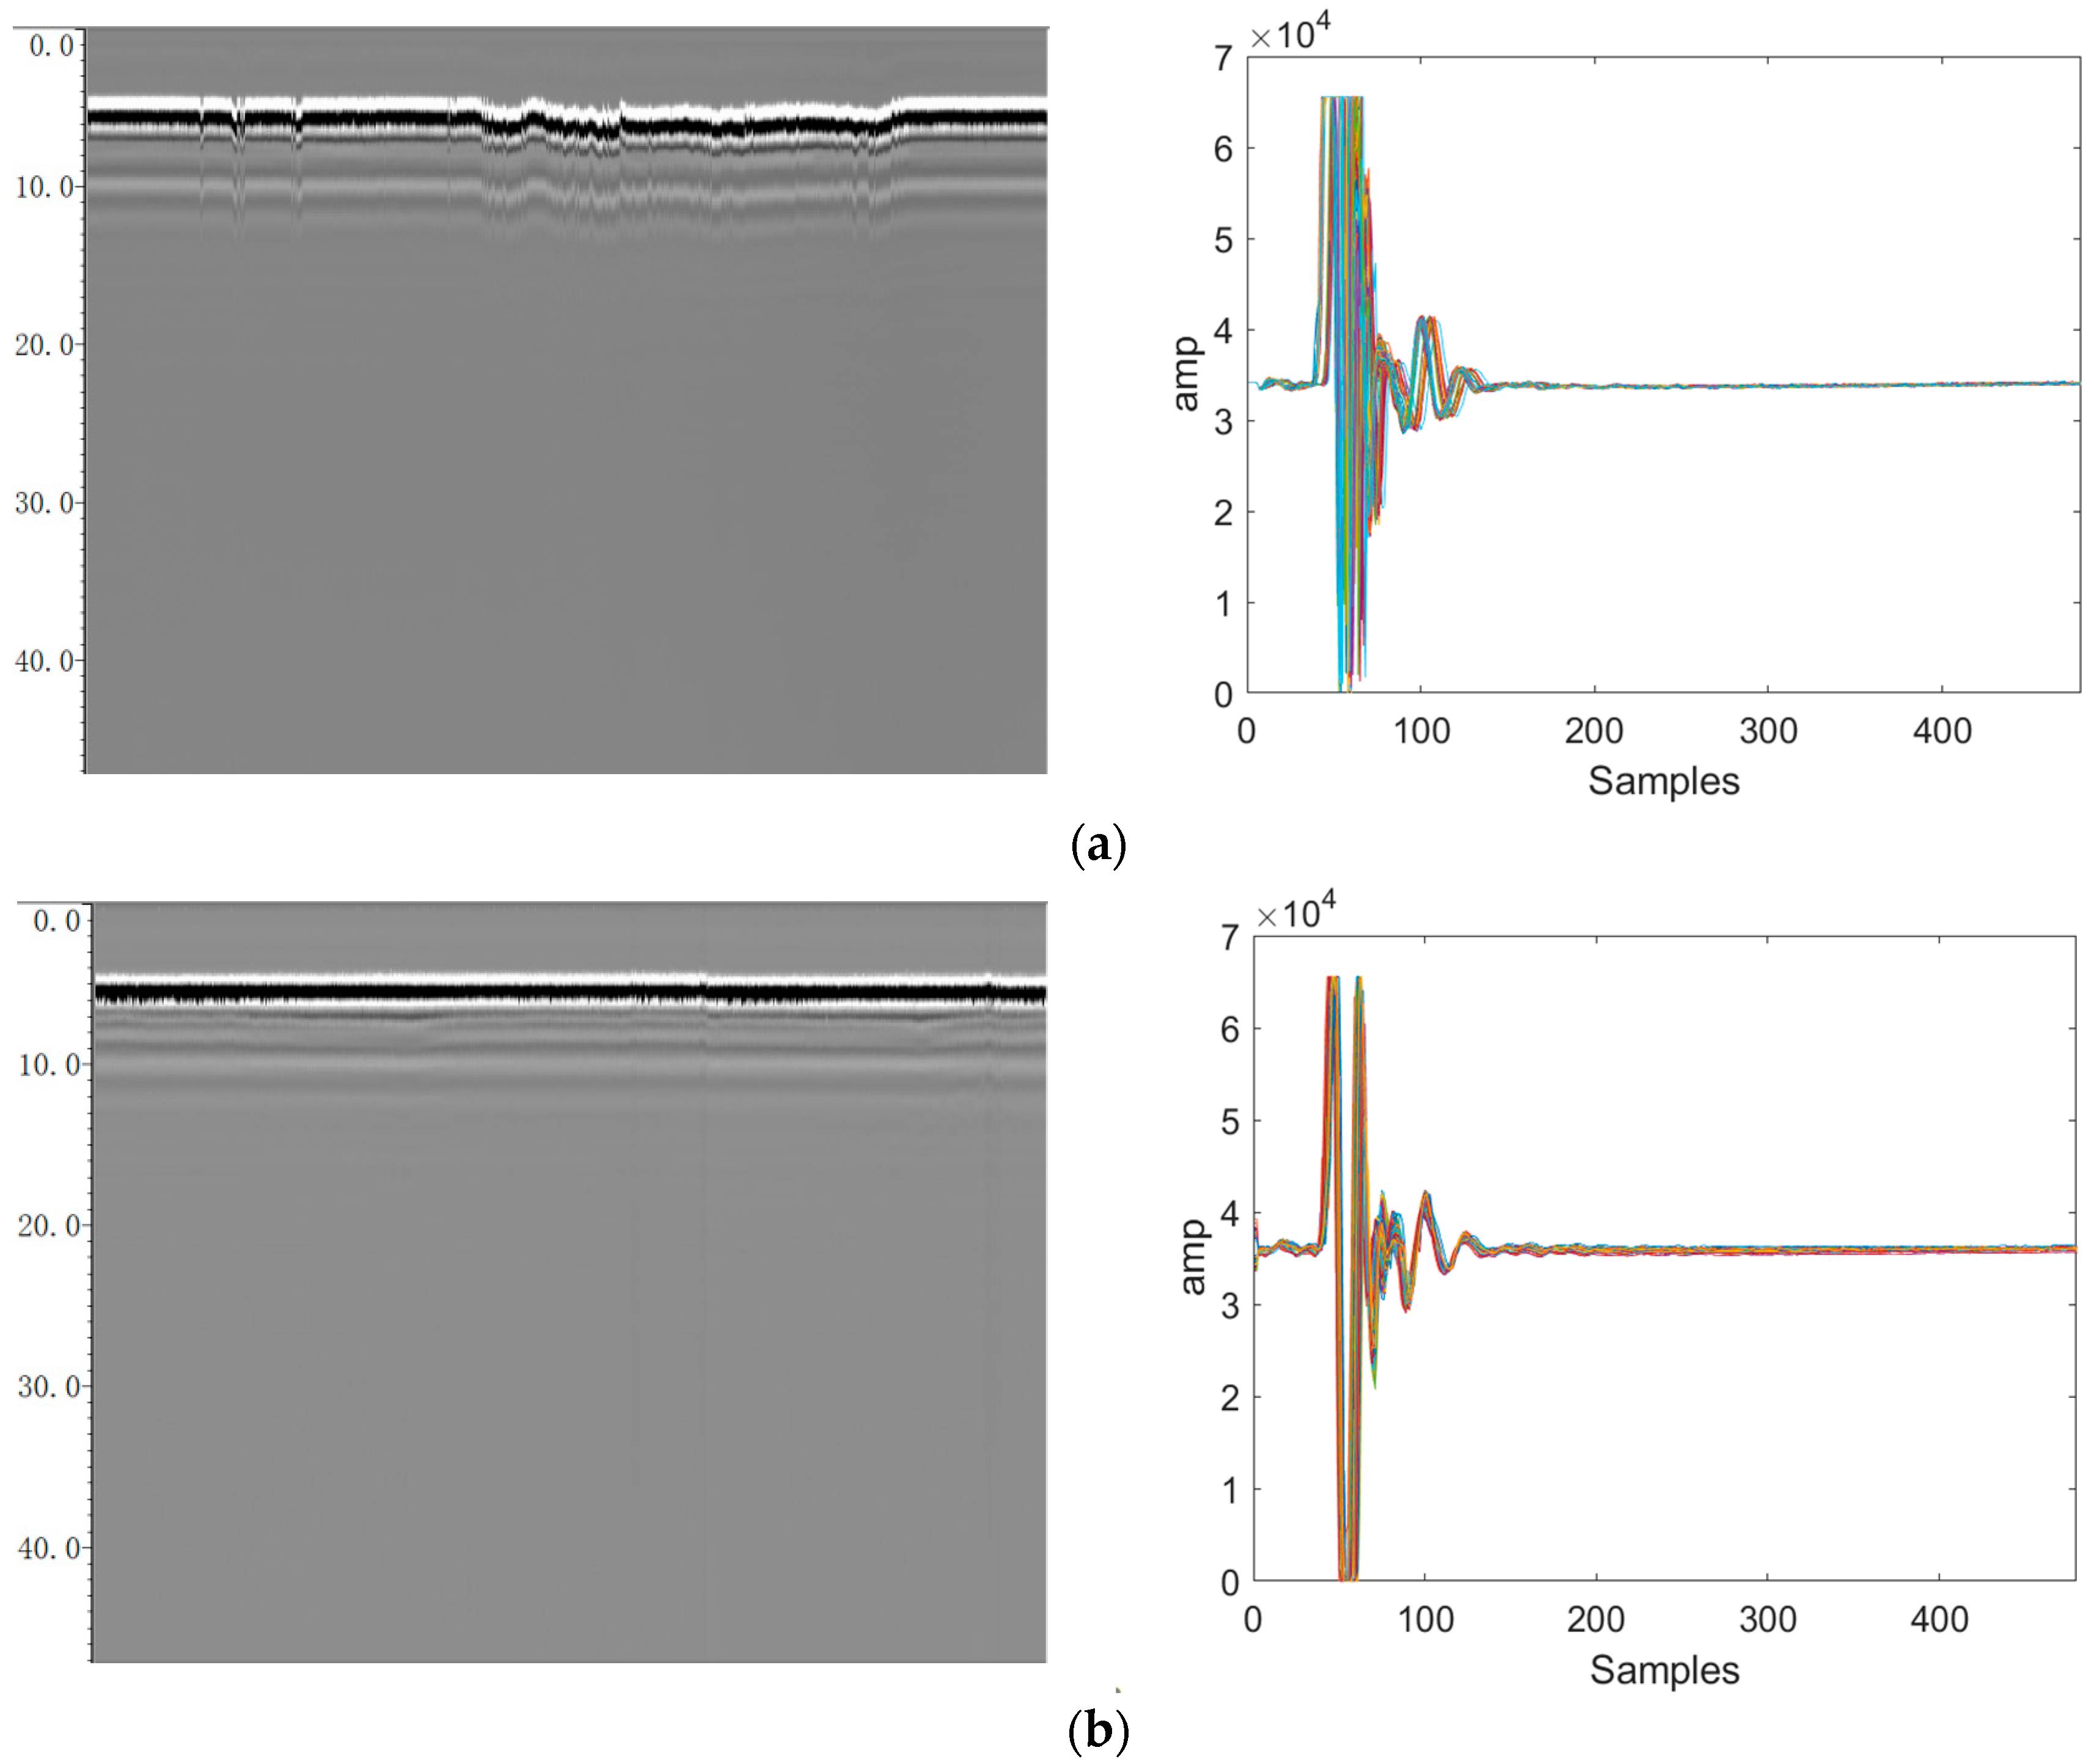
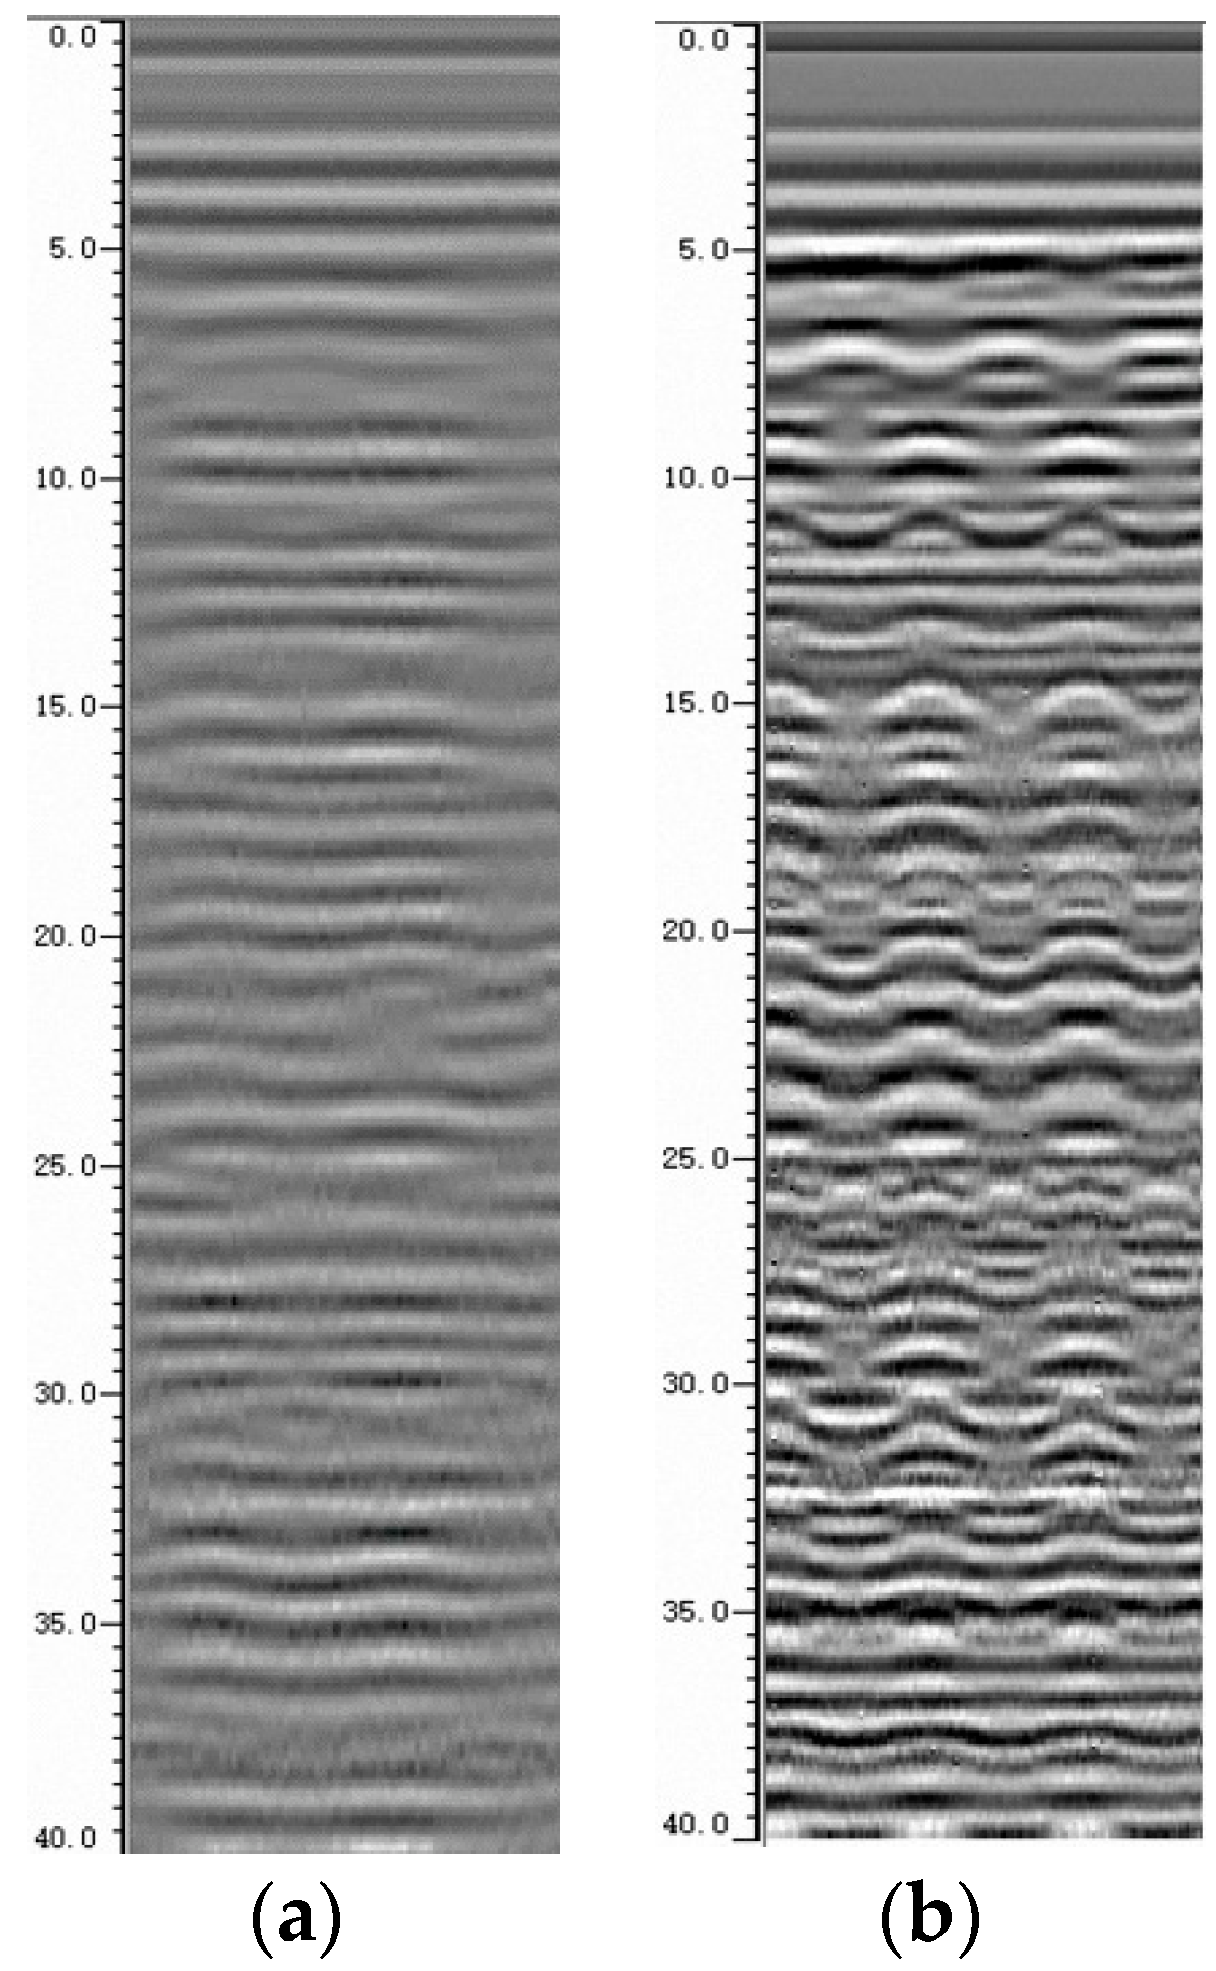
B. RPs analysis
The GPR echo signal of the tested lining block under horizontal vibration (
Figure 11a) is more abundant than that under vertical vibration (
Figure 11b). The interference under vertical vibration has a great influence on the deep region of RP.
Therefore, it can be concluded that the interference to GPR signal under vertical vibration is significantly greater than that under horizontal vibration. The same procedure was taken to compare the data under horizontal and vertical vibration at 2 Hz-10 mm, 3 Hz-10 mm, 5 Hz-10 mm, and 6 Hz-5 mm, and the same effects were obtained.
4.2.2. Extension Analysis of Vibration Excitation Amplitude-Frequency on GPR Echo Signal with Same Vibration Directions
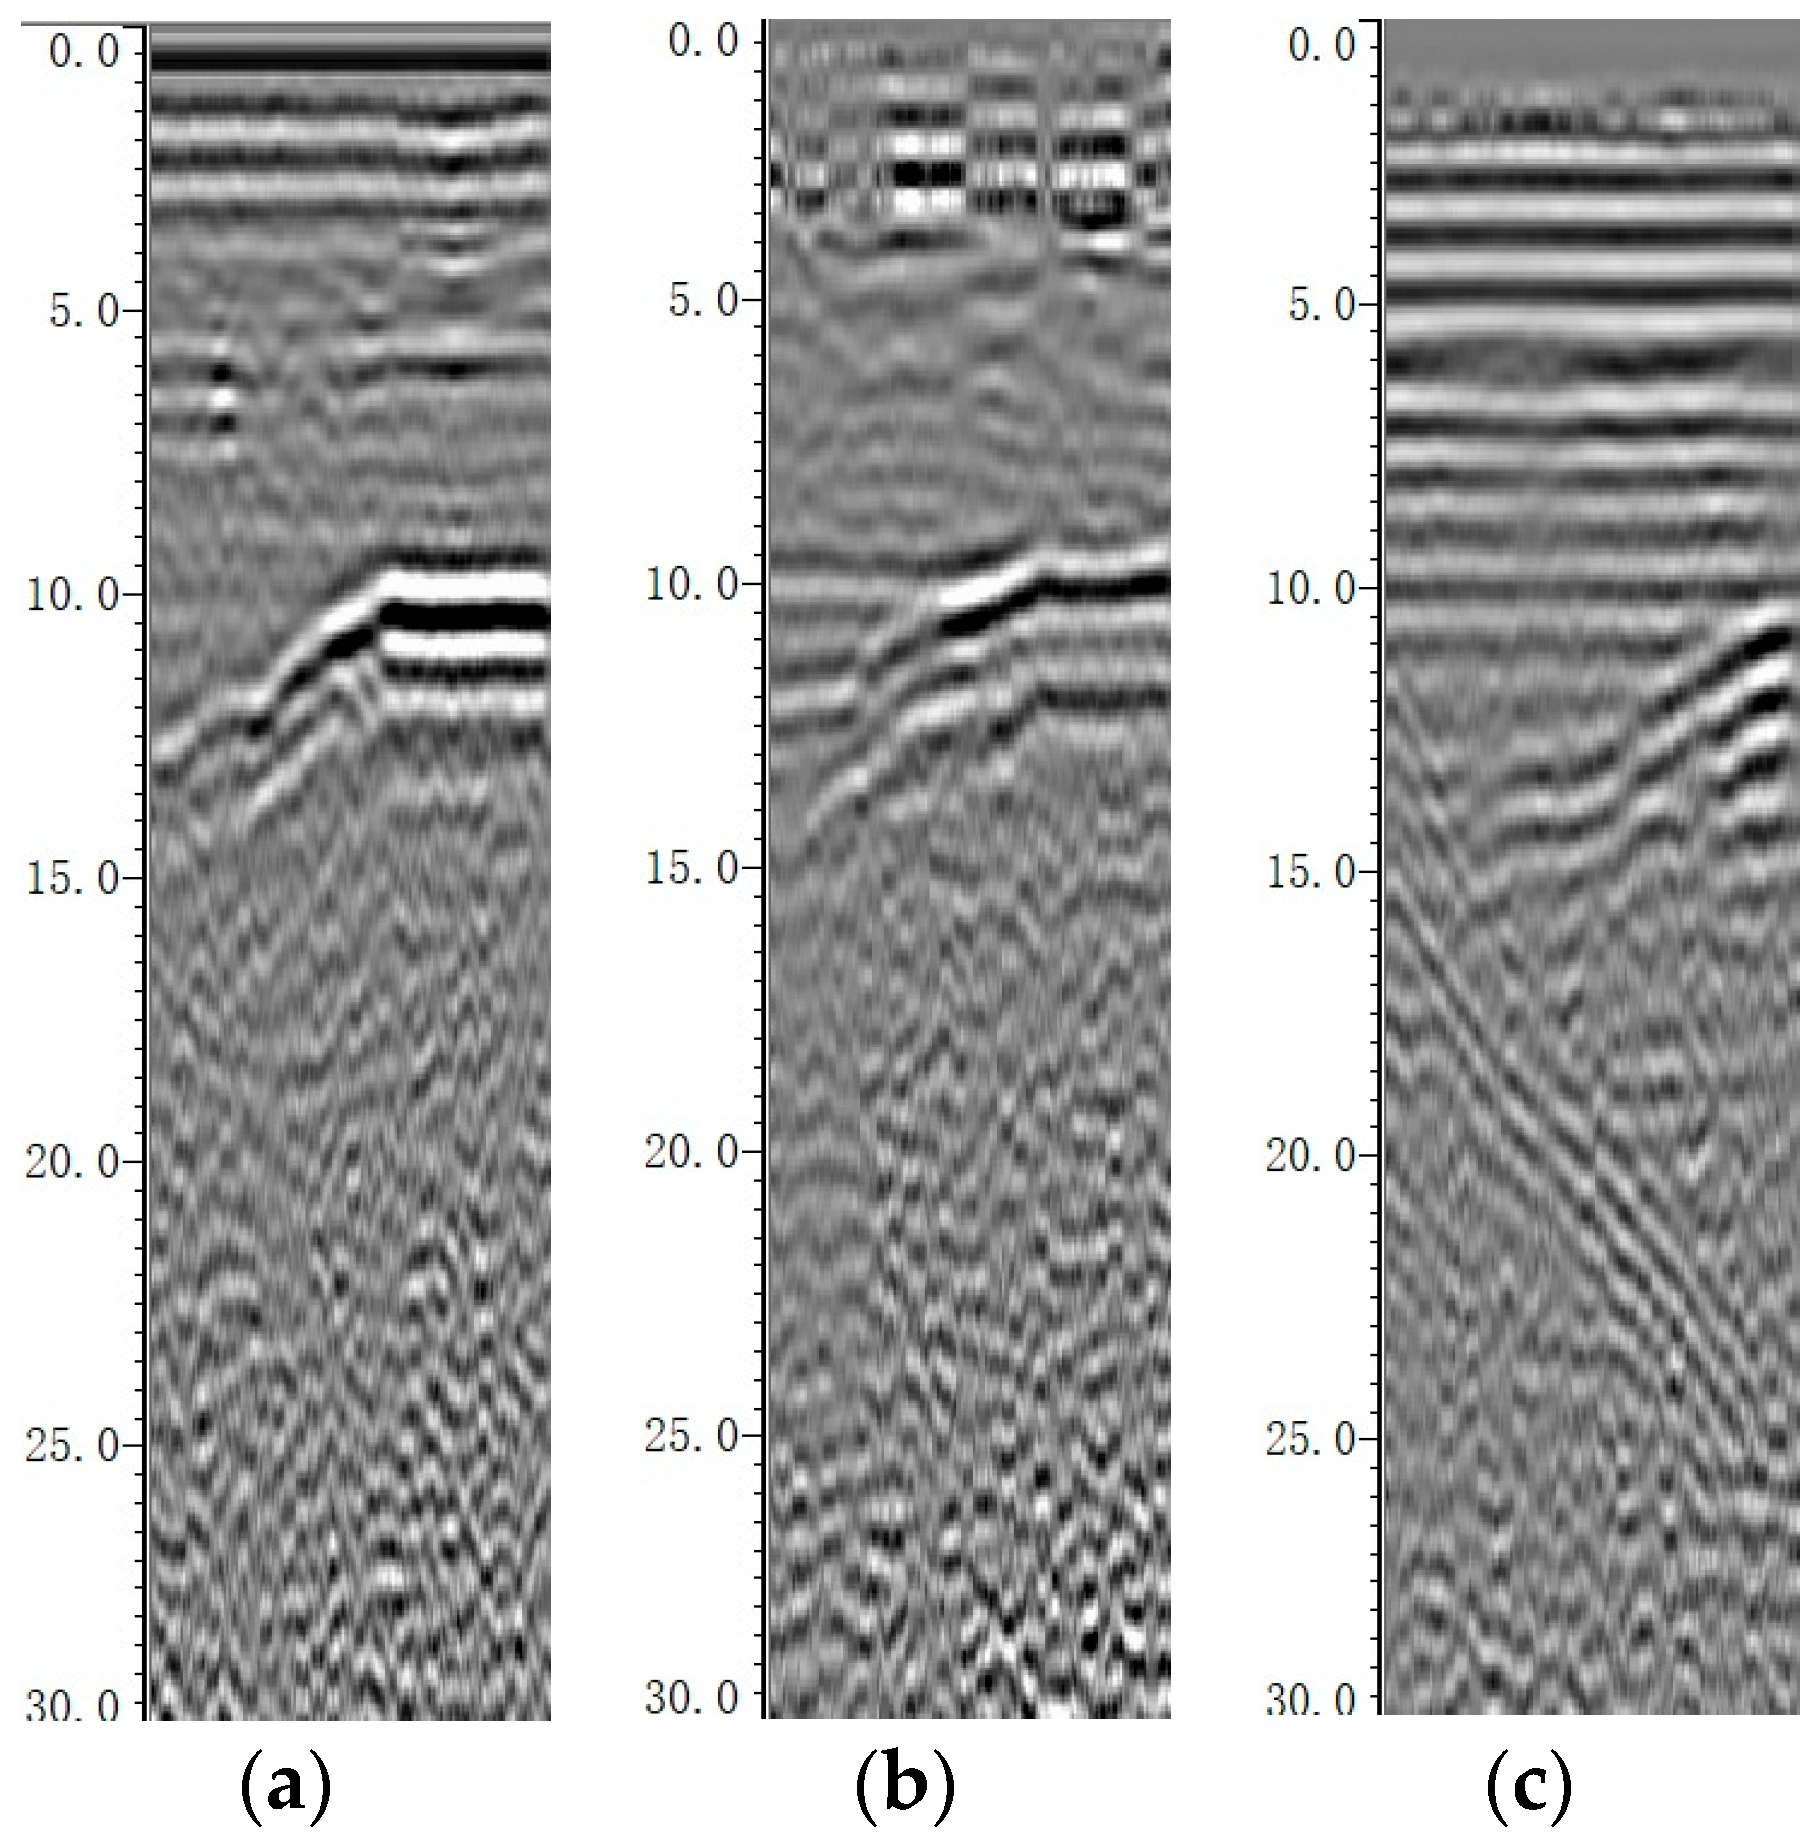
It is necessary to analyze the influence weight of excitation amplitude and frequency on the detection GPR data further. The excitation frequency and amplitude are changed alternately under the vertical vibration condition. RPs of multi-working conditions are presented in
Figure 12, and the main FAs of STWs are presented in
Table 3.
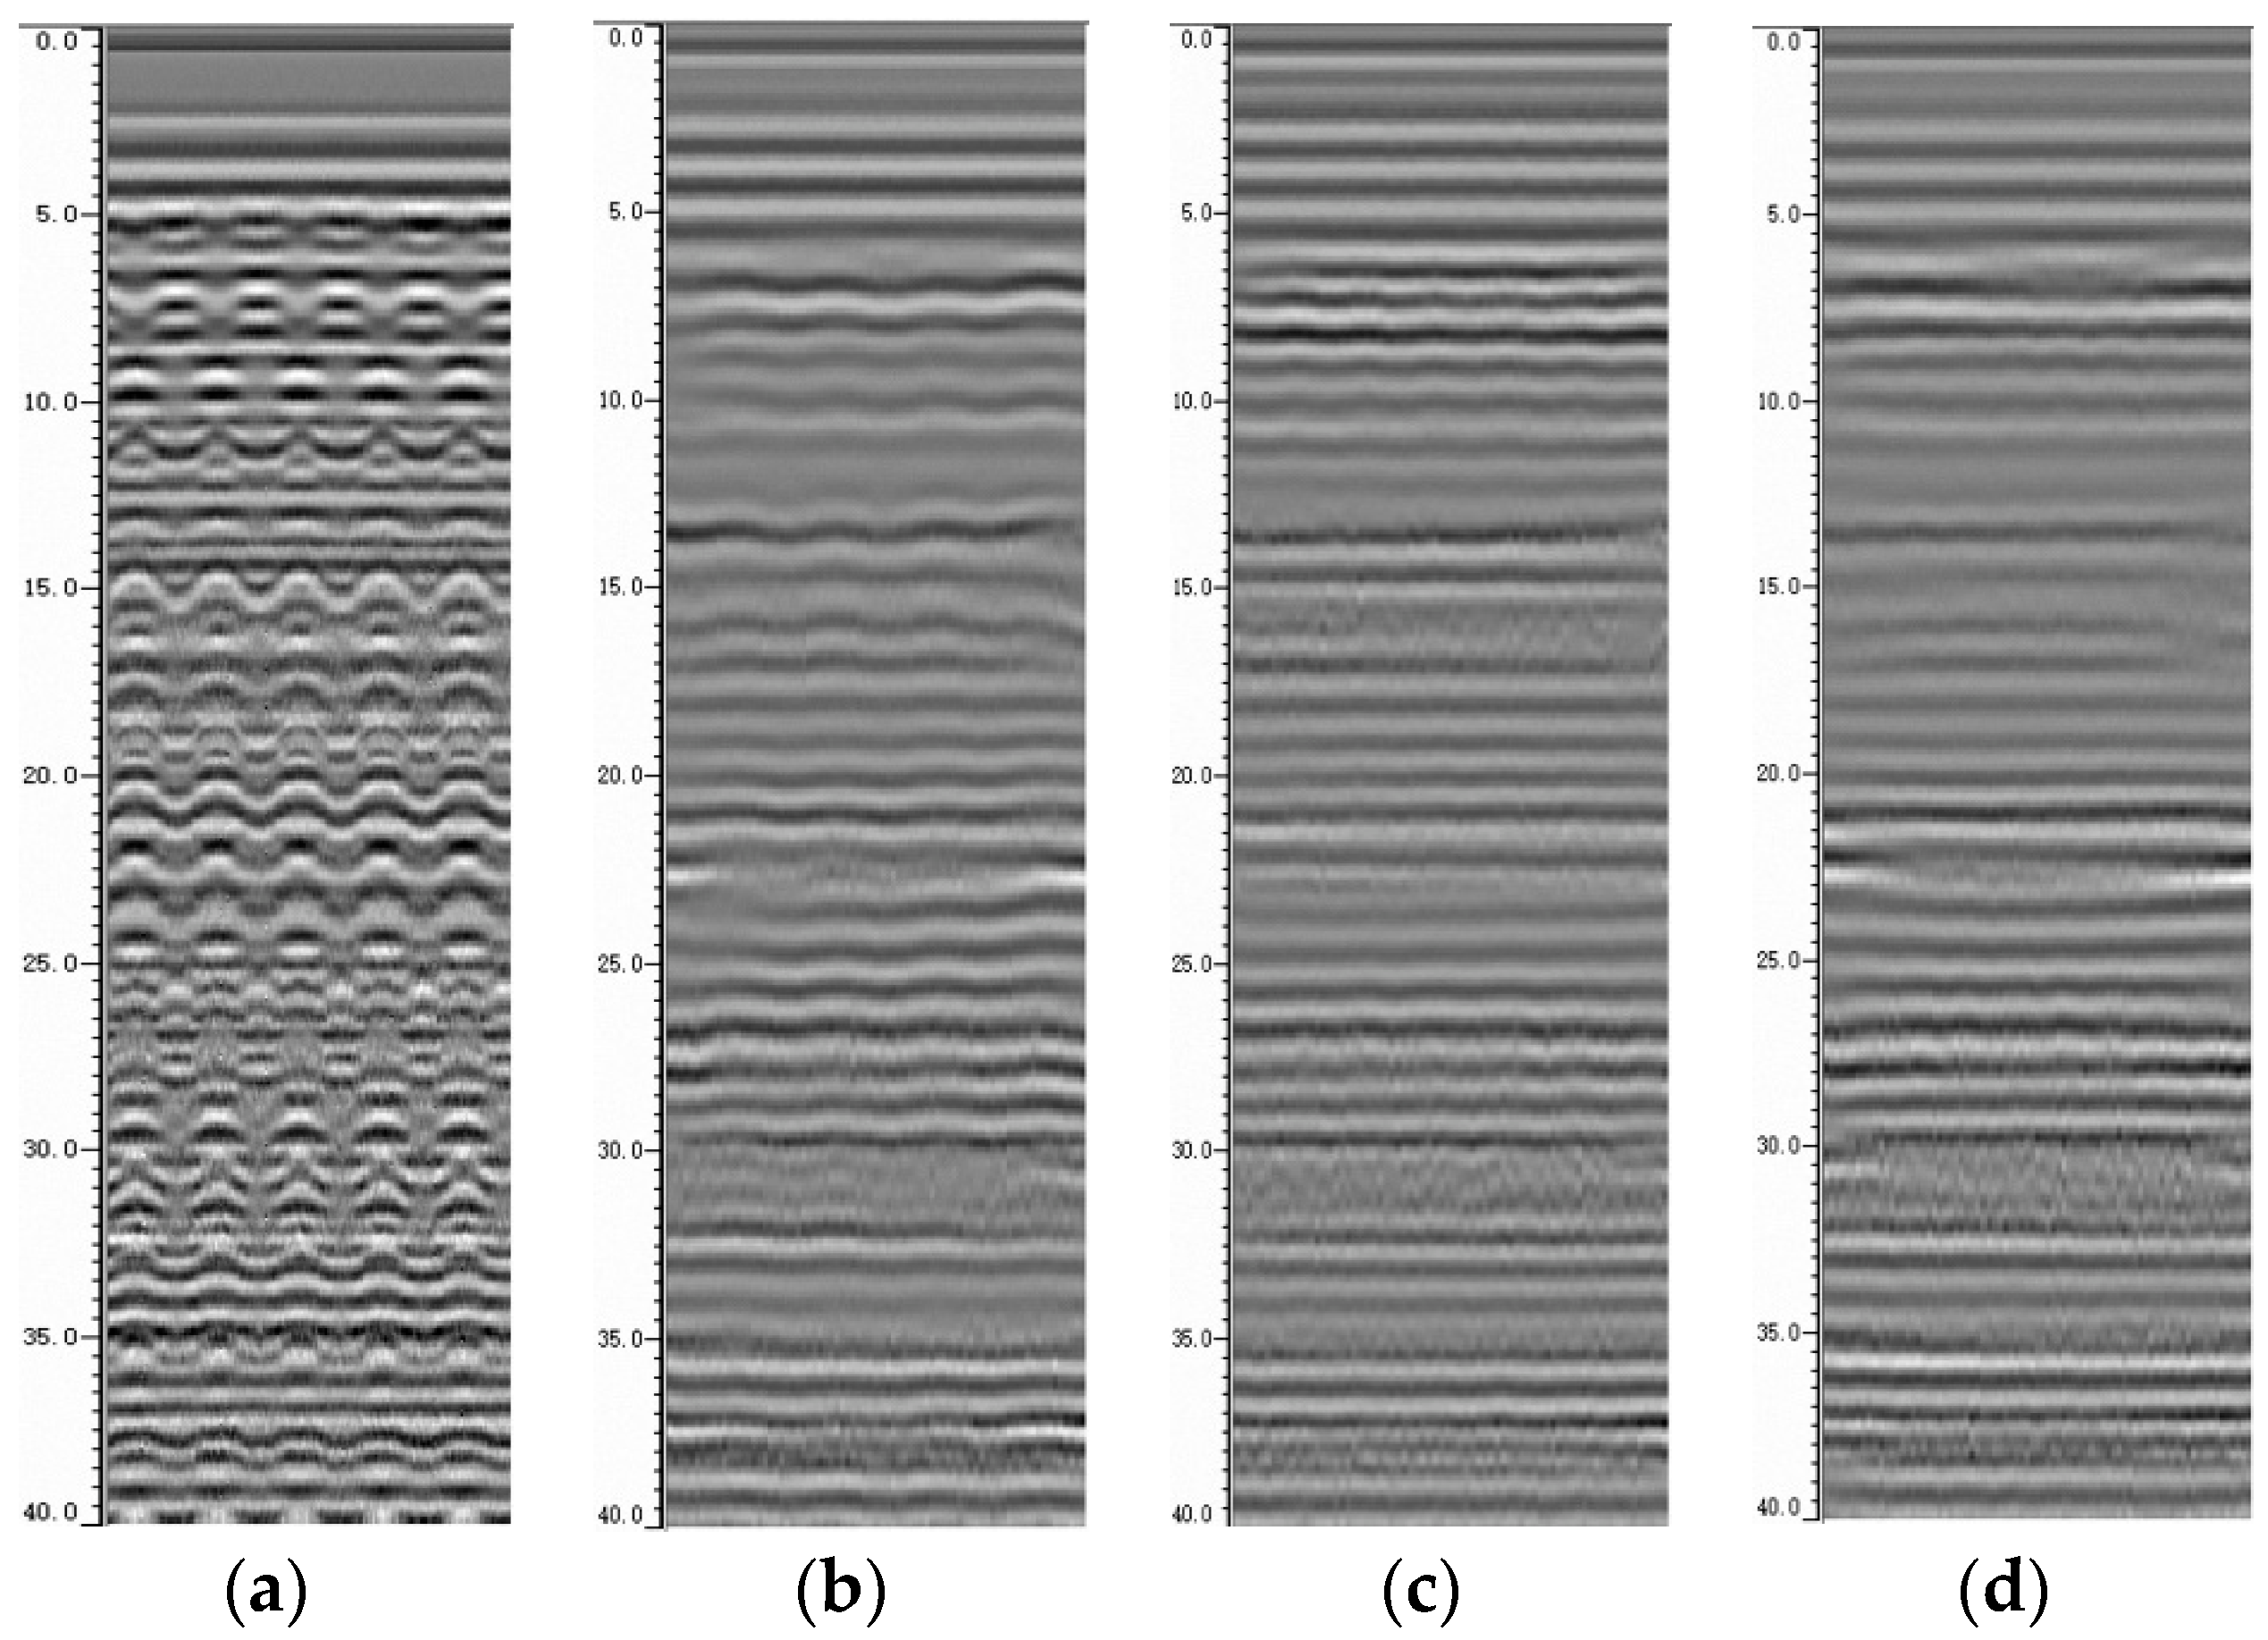
According to the RPs and the main FAs of STWs analysis table, it can be statistically concluded that:
- (1)
The main FA under excitation 2.5 Hz-25 mm is the lowest and is far lower than that under the other conditions; the multiple reflection interferences are very obvious in the RP, the effective deep information range is minimum, and the data quality is worst, which cannot support the analysis of tunnel lining defects. When the excitation amplitude is less than 10 mm, the RPs quality can support the effective analysis generally.
- (2)
When excitation amplitude is controlled within a certain range (less than 10 mm), the main FA of STW changes with the excitation frequency. When the excitation frequency is less than 10 Hz, FA is slightly affected. However, when the excitation frequency is higher than 10 Hz, FA is significantly affected. For example, the main FA of STW under 15 Hz-3 mm excitation will be weaker than that under 5 Hz-10 mm excitation, while these data qualities are less affected overall. However, when the excitation amplitude reaches 15 mm, the main FA of STW and the RPs quality are decreased obviously with the essential difference. For example, the STW characteristics under excitation 1 Hz-15 mm are slightly worse than those under excitation 15 Hz-5 mm.
It can be confirmed that the influence of vertical vibration on the echo signal when GPR detects tunnel lining is greater than that of horizontal vibration, the safe excitation amplitude should be limited to within 10 mm, and the safe excitation frequency should be limited to 10 Hz.
4.3. Effect Analysis of RPs with Different Detection Distance from Lining Surface
The vertical vibration will inevitably lead to the change of the distance between the GPR antenna and the tunnel lining. When the distance is different, the effect of RP is different. The GPR antenna is loaded on a simple wheelbarrow to detect a known defect of void in the actual tunnel site under detection distance.
In
Figure 13, the RP under distance 8 cm shows the complete characteristics of the defect, and the characteristic of the shallow effective reflection signal is abundant, and the interference is less. The signal reflection of the RP at the defect under a distance of 12 cm is relatively clear, the reflected signal is weaker than that under 8 cm working condition, and the shallow effective signal cannot be displayed completely.
When the distance reaches 16 cm, the interference signal of RP increases to a great extent, the reflected signal of the defect weakens greatly, and the shape of the reflected signal is also affected, which cannot fully reflect the real situation of the defect, and may cause missed judgment. Therefore, a distance of 8–12 cm (100 ± 20 mm) should be implemented to detect high-speed railway tunnel detection vehicles.
5. Analysis and Verification of Vibration Suppression Strategy for Detection Device
5.1. Proposal of the Vibration Suppression Strategy
The sensitivity frequency of railway locomotive and rolling stock equipment is usually 0–2 Hz, the natural frequency of the detection device should be 2 times greater than its sensitivity frequency band, and the safety response amplitude should not be greater than 20 mm. Combined with the analysis results in
Section 4.2, the longitudinal and radial vibration response frequency of Antenna 1 pedestal should be controlled within 4–10 Hz, and the response amplitude should be limited to 10 mm.
The optimization of the detection device can effectively improve the radial and longitudinal dynamic amplitude-frequency characteristics of the system and achieve the purpose of smoothing the amplitude and adjusting the main frequency.
Structural design and material optimization can change the natural characteristics and vibration response characteristics of the detection device, which include the adjustment of material properties, the reasonable optimization of dimensions design, and the stiffness reinforcement of joints.
The logic of the control system and the adjustment of the loading curve can actively change the vibration response amplitude characteristics of the detection device. In addition, according to the main technical conditions in
Section 2 and analysis results in
Section 4.3, in order to ensure the continuity and accuracy of GPR data, it is necessary to keep the distance between GPR and tunnel lining at 100 ± 20 mm. It is presented that from the calculation and measurement results in
Section 3, the maximum response radial amplitude has exceeded 20 mm and caused pressure to the control interval (±20 mm) obviously.
5.2. Optimization of Material Properties and Structural Parameters
The following optimized design scheme is initially proposed, and the finite element model diagram after optimization is shown in
Figure 14.
- (1)
Composite material: carbon fiber is selected for the two sections of the bent arm.
- (2)
Dimensional Optimization: the longitudinal width of the bottom section is increased by 50%, the arc length is increased by 25%; the arc length of the upper section is decreased by 15%, and the longitudinal width is increased by 40%.
- (3)
Stiffness enhancement: the occlusal position of the rotating motor is widened by 10%.
- (4)
Antenna pedestal position adjustment: replace the pedestal of Antenna 2 to the bottom section.
Natural frequencies calculation results after structure optimization are presented in
Table 4. Then, the new finite element model is simulated and calculated according to the working conditions and loading conditions in
Section 3, and the results in
Figure 15 can be obtained.
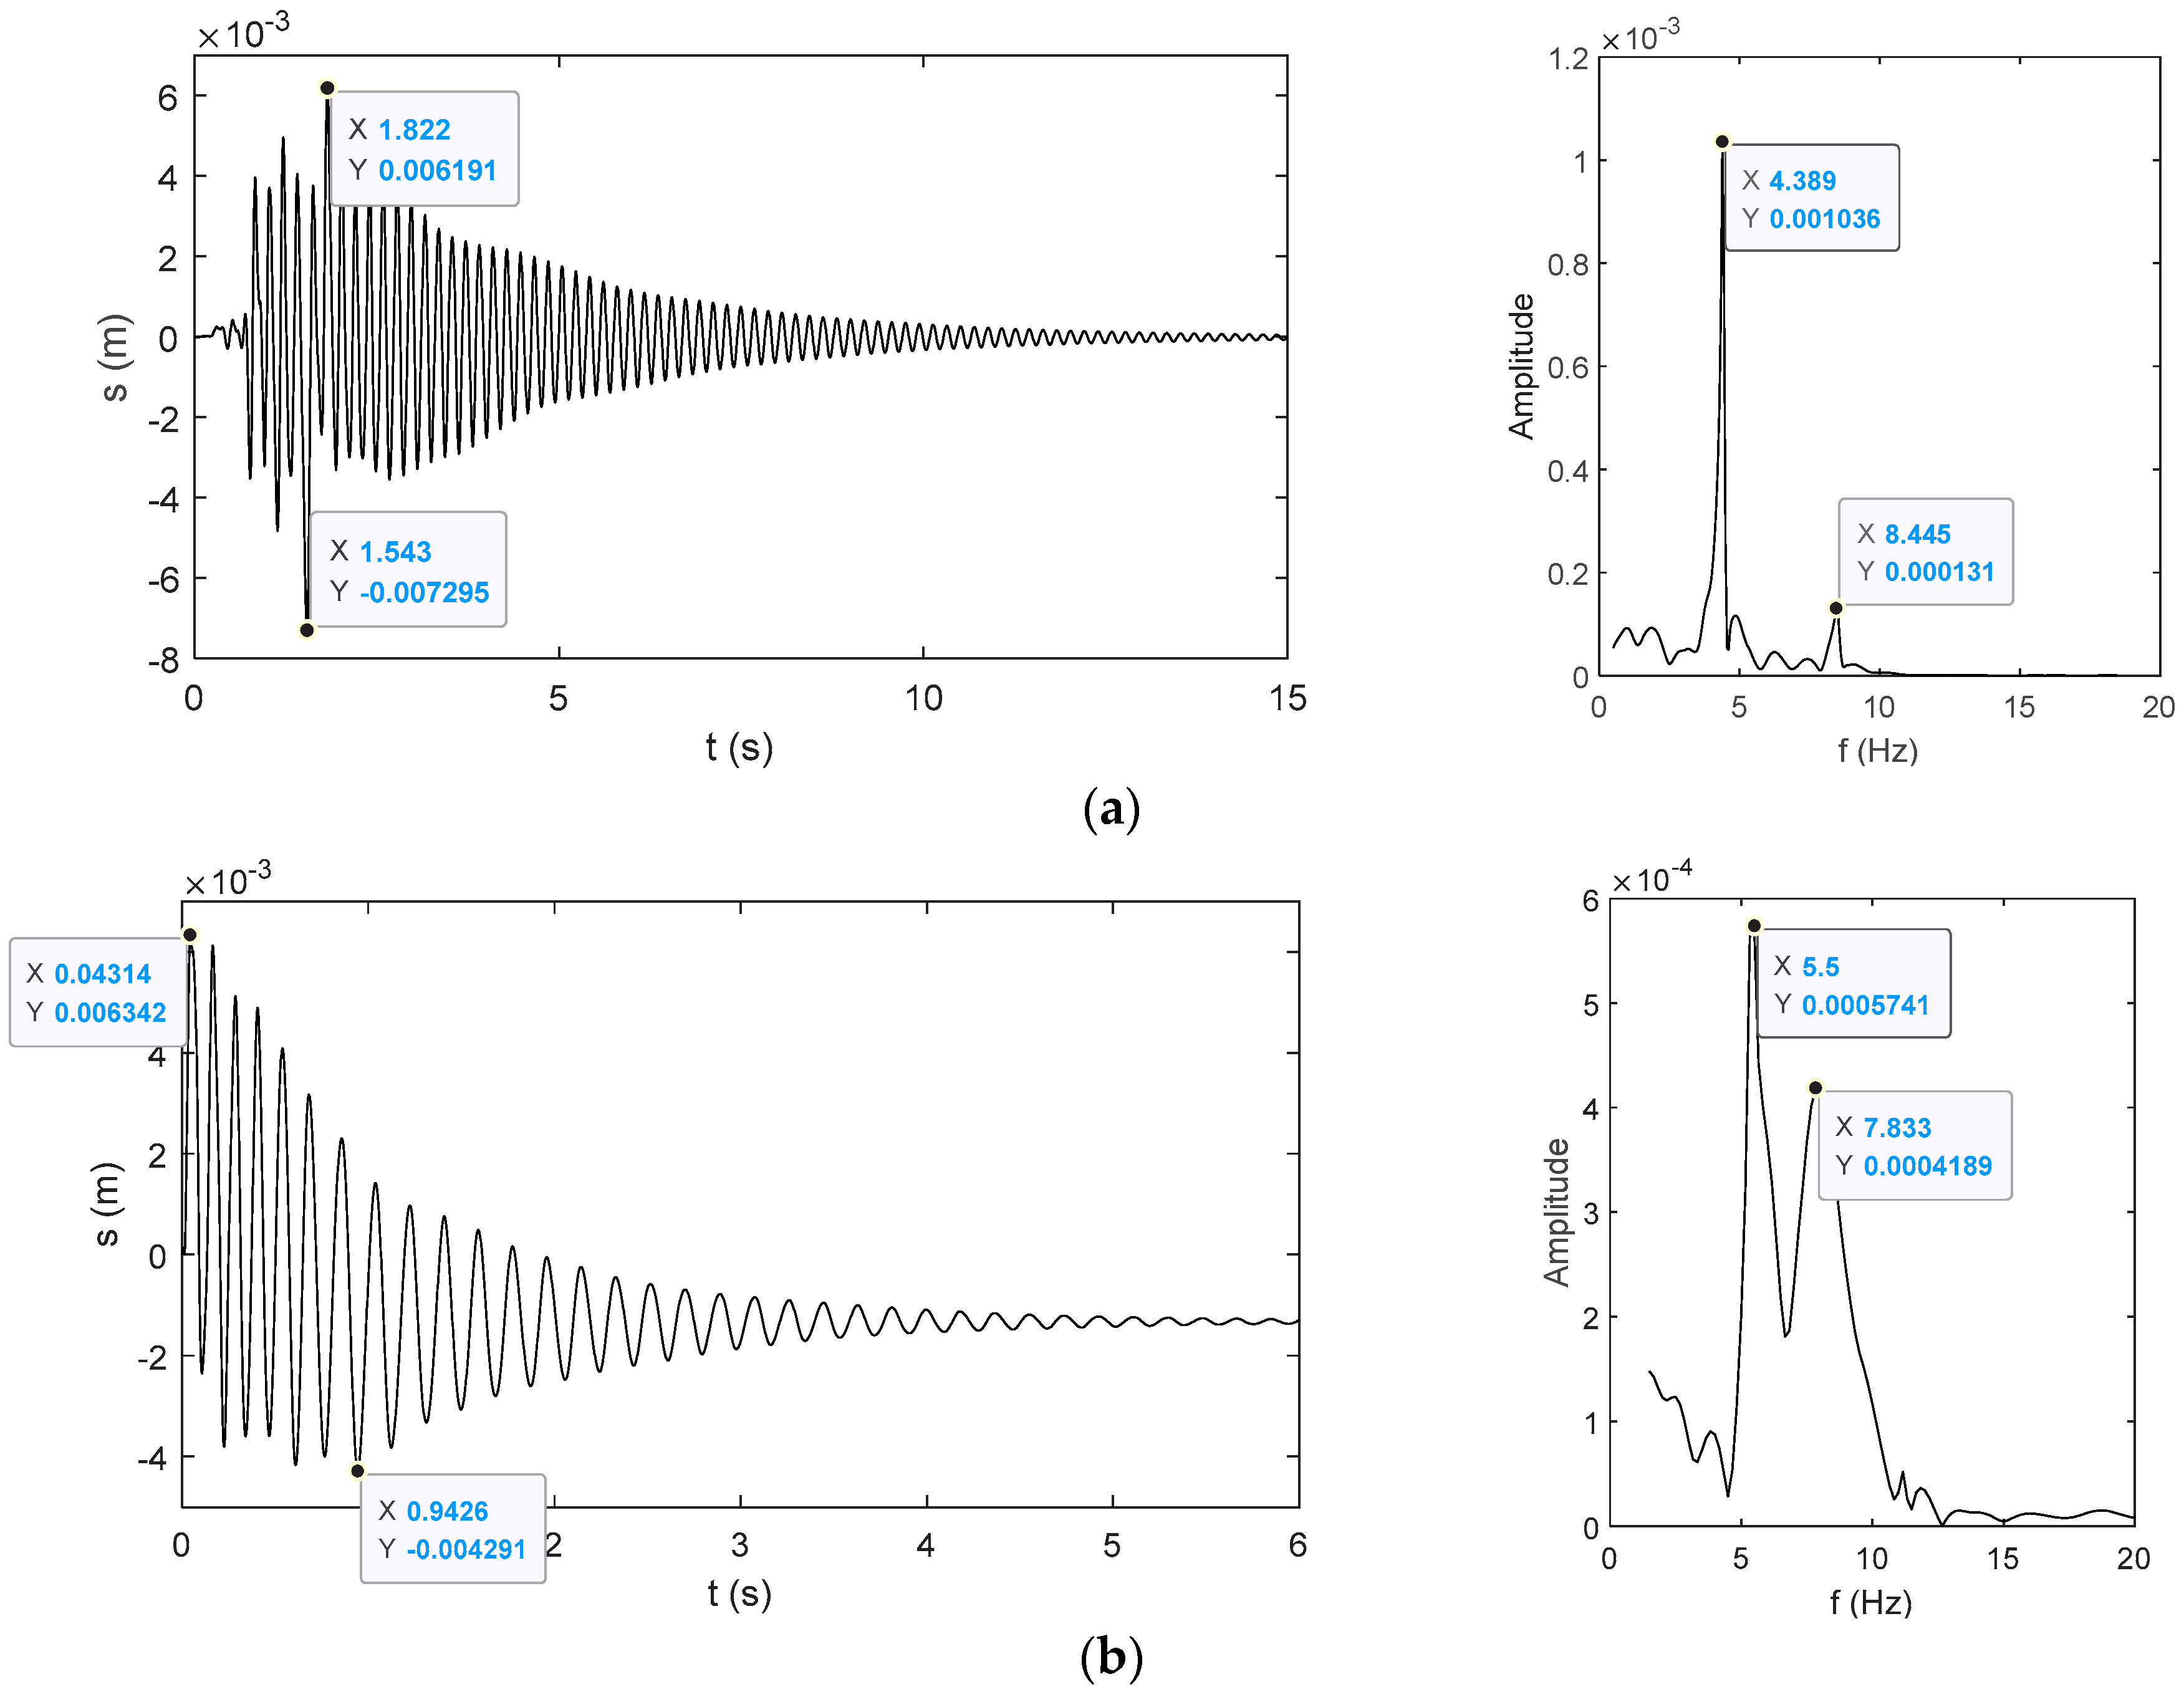
It is presented that the main frequency of longitudinal vibration is 4.389 Hz, and the main frequency of radial vibration is 5.5 Hz. In the spectrum, the second dominant frequencies corresponding to each mode are visible, and the amplitude corresponding to the secondary dominant frequency 8.445 Hz is 1/7 of the amplitude corresponding to the main dominant frequency 4.389 Hz.
Compared with the results before optimization, the amplitude under the same working condition can be decreased by 70%, the maximum longitudinal amplitude of emergency braking and the maximum radial amplitude under automatic adjustment is less than 10 mm. It is proved that the scheme of structure optimization can passively improve the dynamic characteristics and have a substantial influence on the vibration response.
5.3. Control Logic Optimization and Measured Results of Excitation Curves
The basic principle of the control logic is that the telescopic motion of the main arm and swinging of the bent arm should keep the concentric state of the bent arm and the tunnel lining surface during the whole detection process and keep the reasonable detection distance between the radar antenna and the tunnel lining surface without frequent impact adjustment.
The distance signal input of the control strategy comes from the laser range sensor installed at the corresponding location with a ranging accuracy of 0.1 mm. Every sensor is installed on the corresponding control executor.
The authors use Auto Disturbance Rejection Controller (hereinafter referred to as ADRC) technology to adjust. This nonlinear controller combines the classical Proportional-Integral-Differential (hereinafter referred to as PID) control, solves the contradiction between the control rapidity and overshoot, and the limitation of modern control theory, which depends on the control object model. The “observation + compensation” method is used to deal with the nonlinearity and uncertainty in the control system. The disturbance suppression does not require an external disturbance model or observation. The control algorithm does not need to identify the control object. The decoupling control only considers static coupling without dynamic coupling.
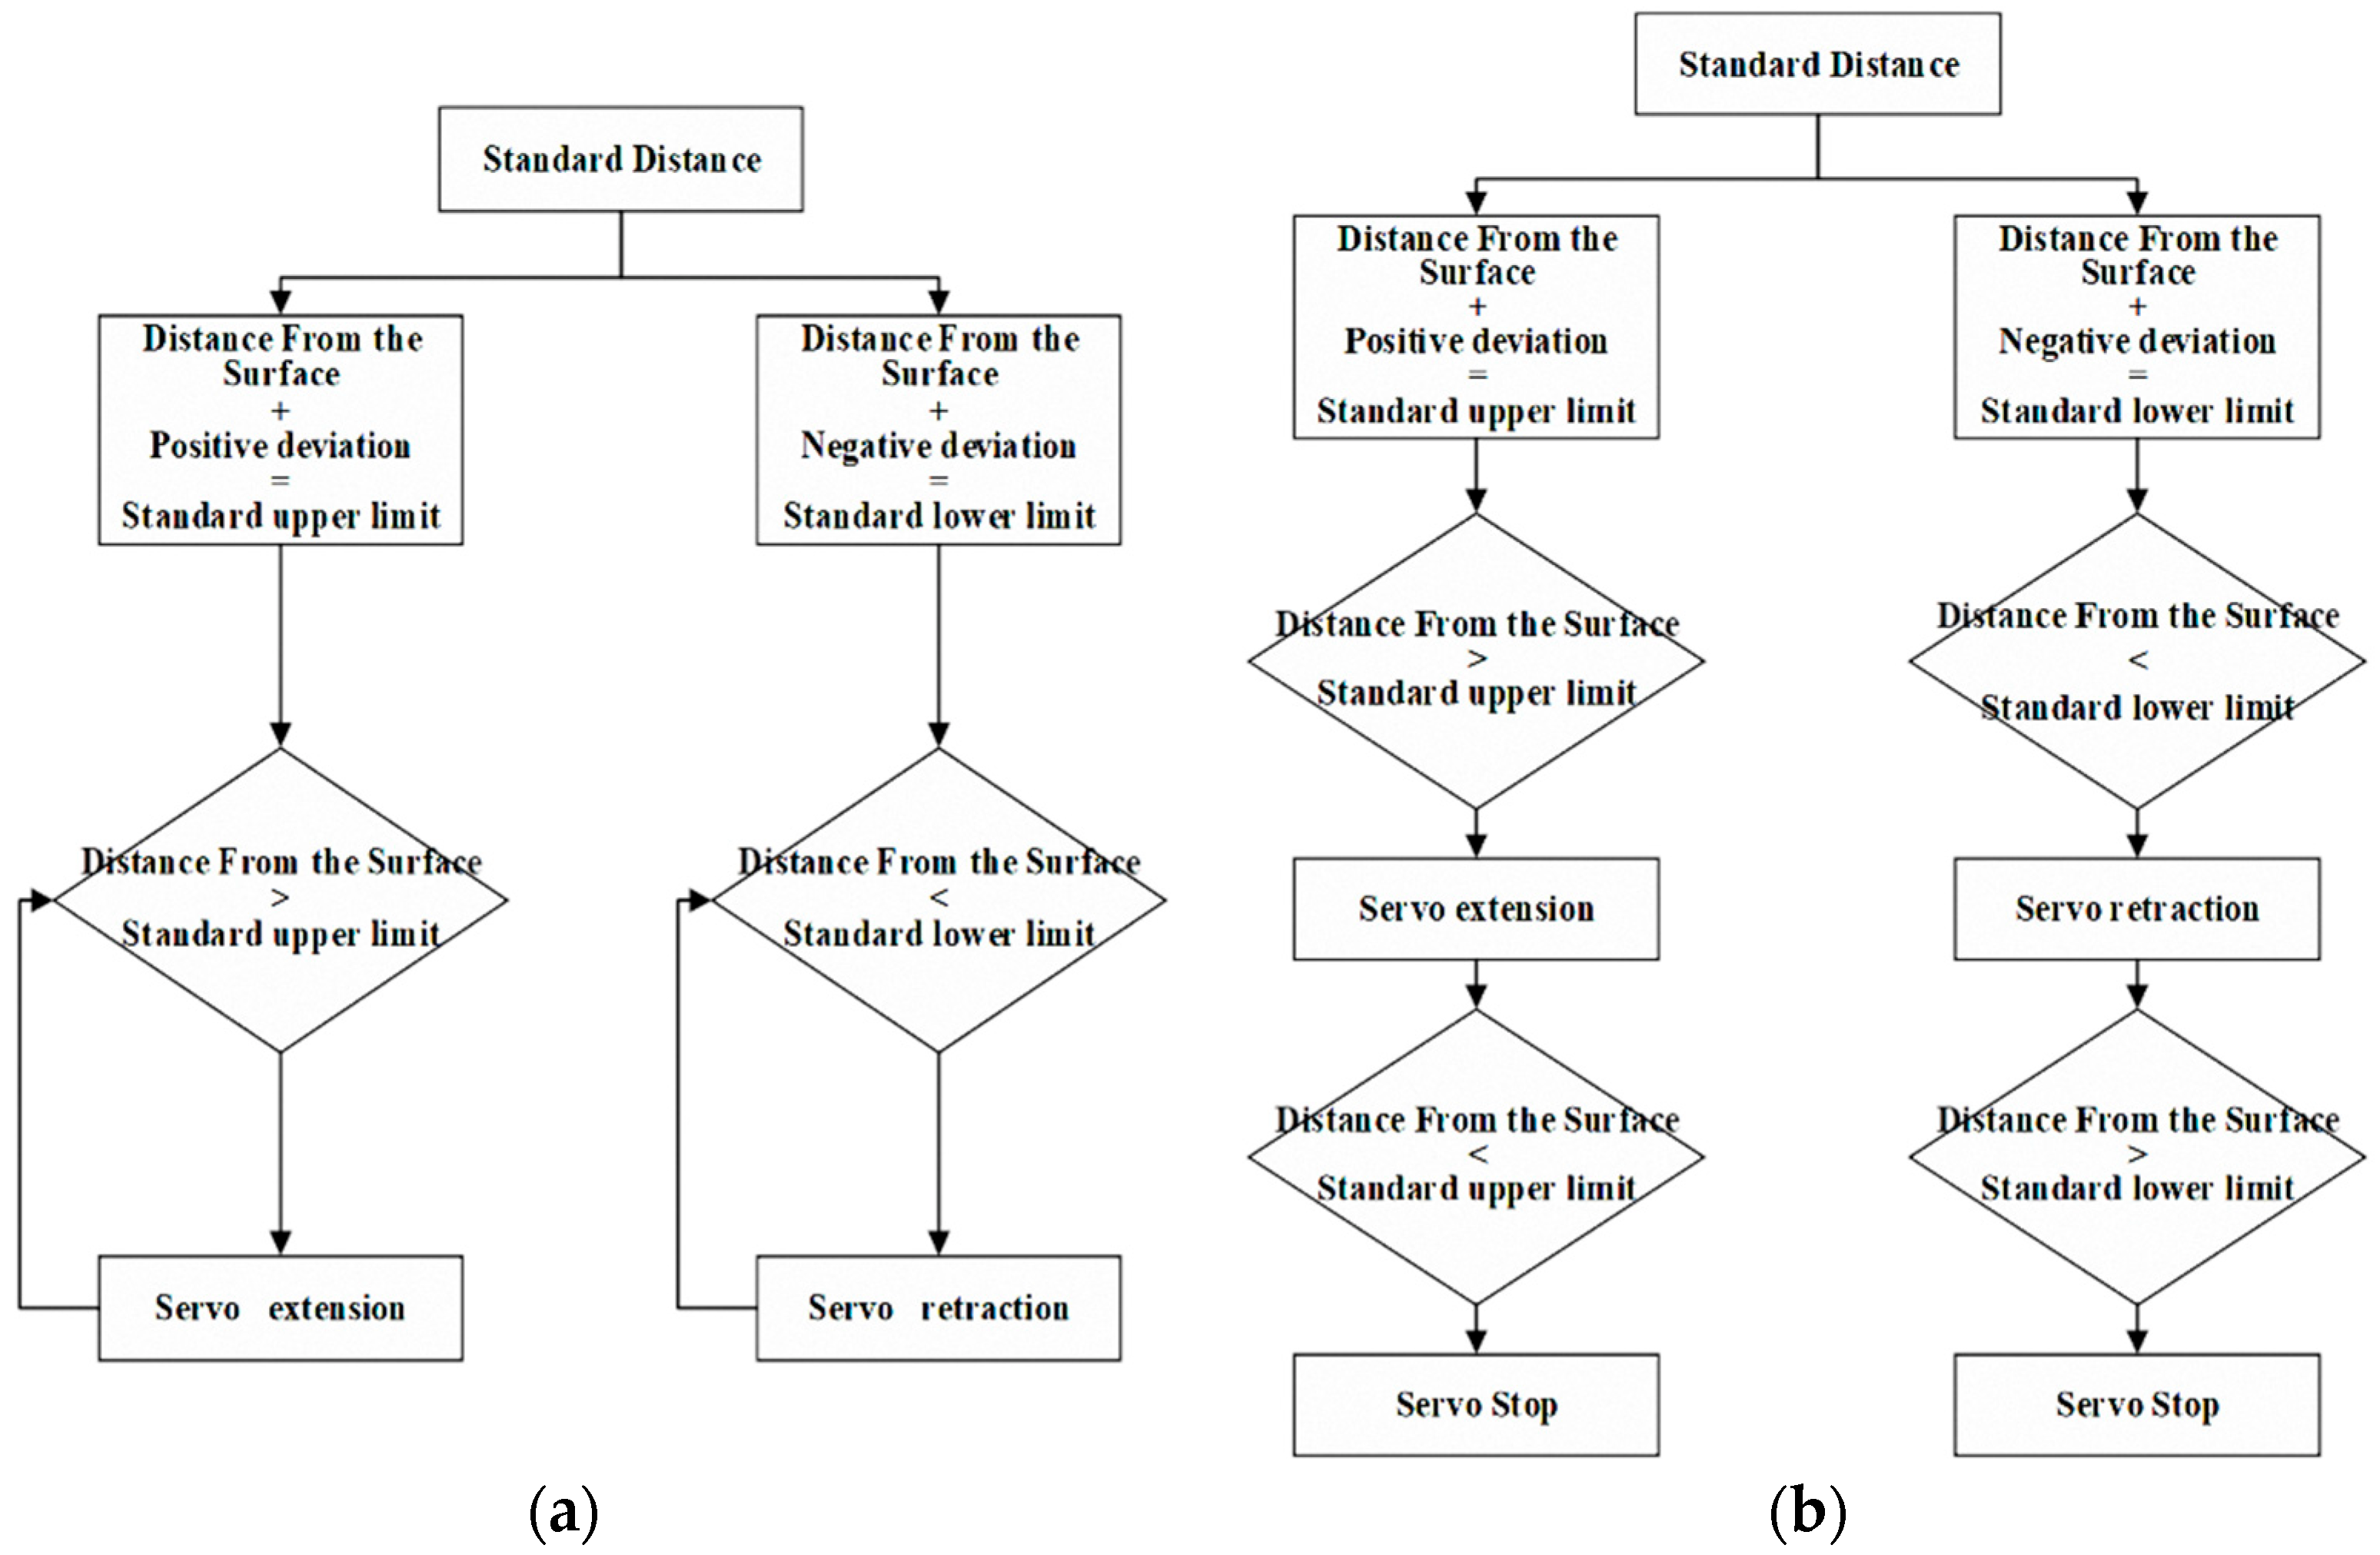
The control logic of the servo valve is modified, presented in
Figure 16.
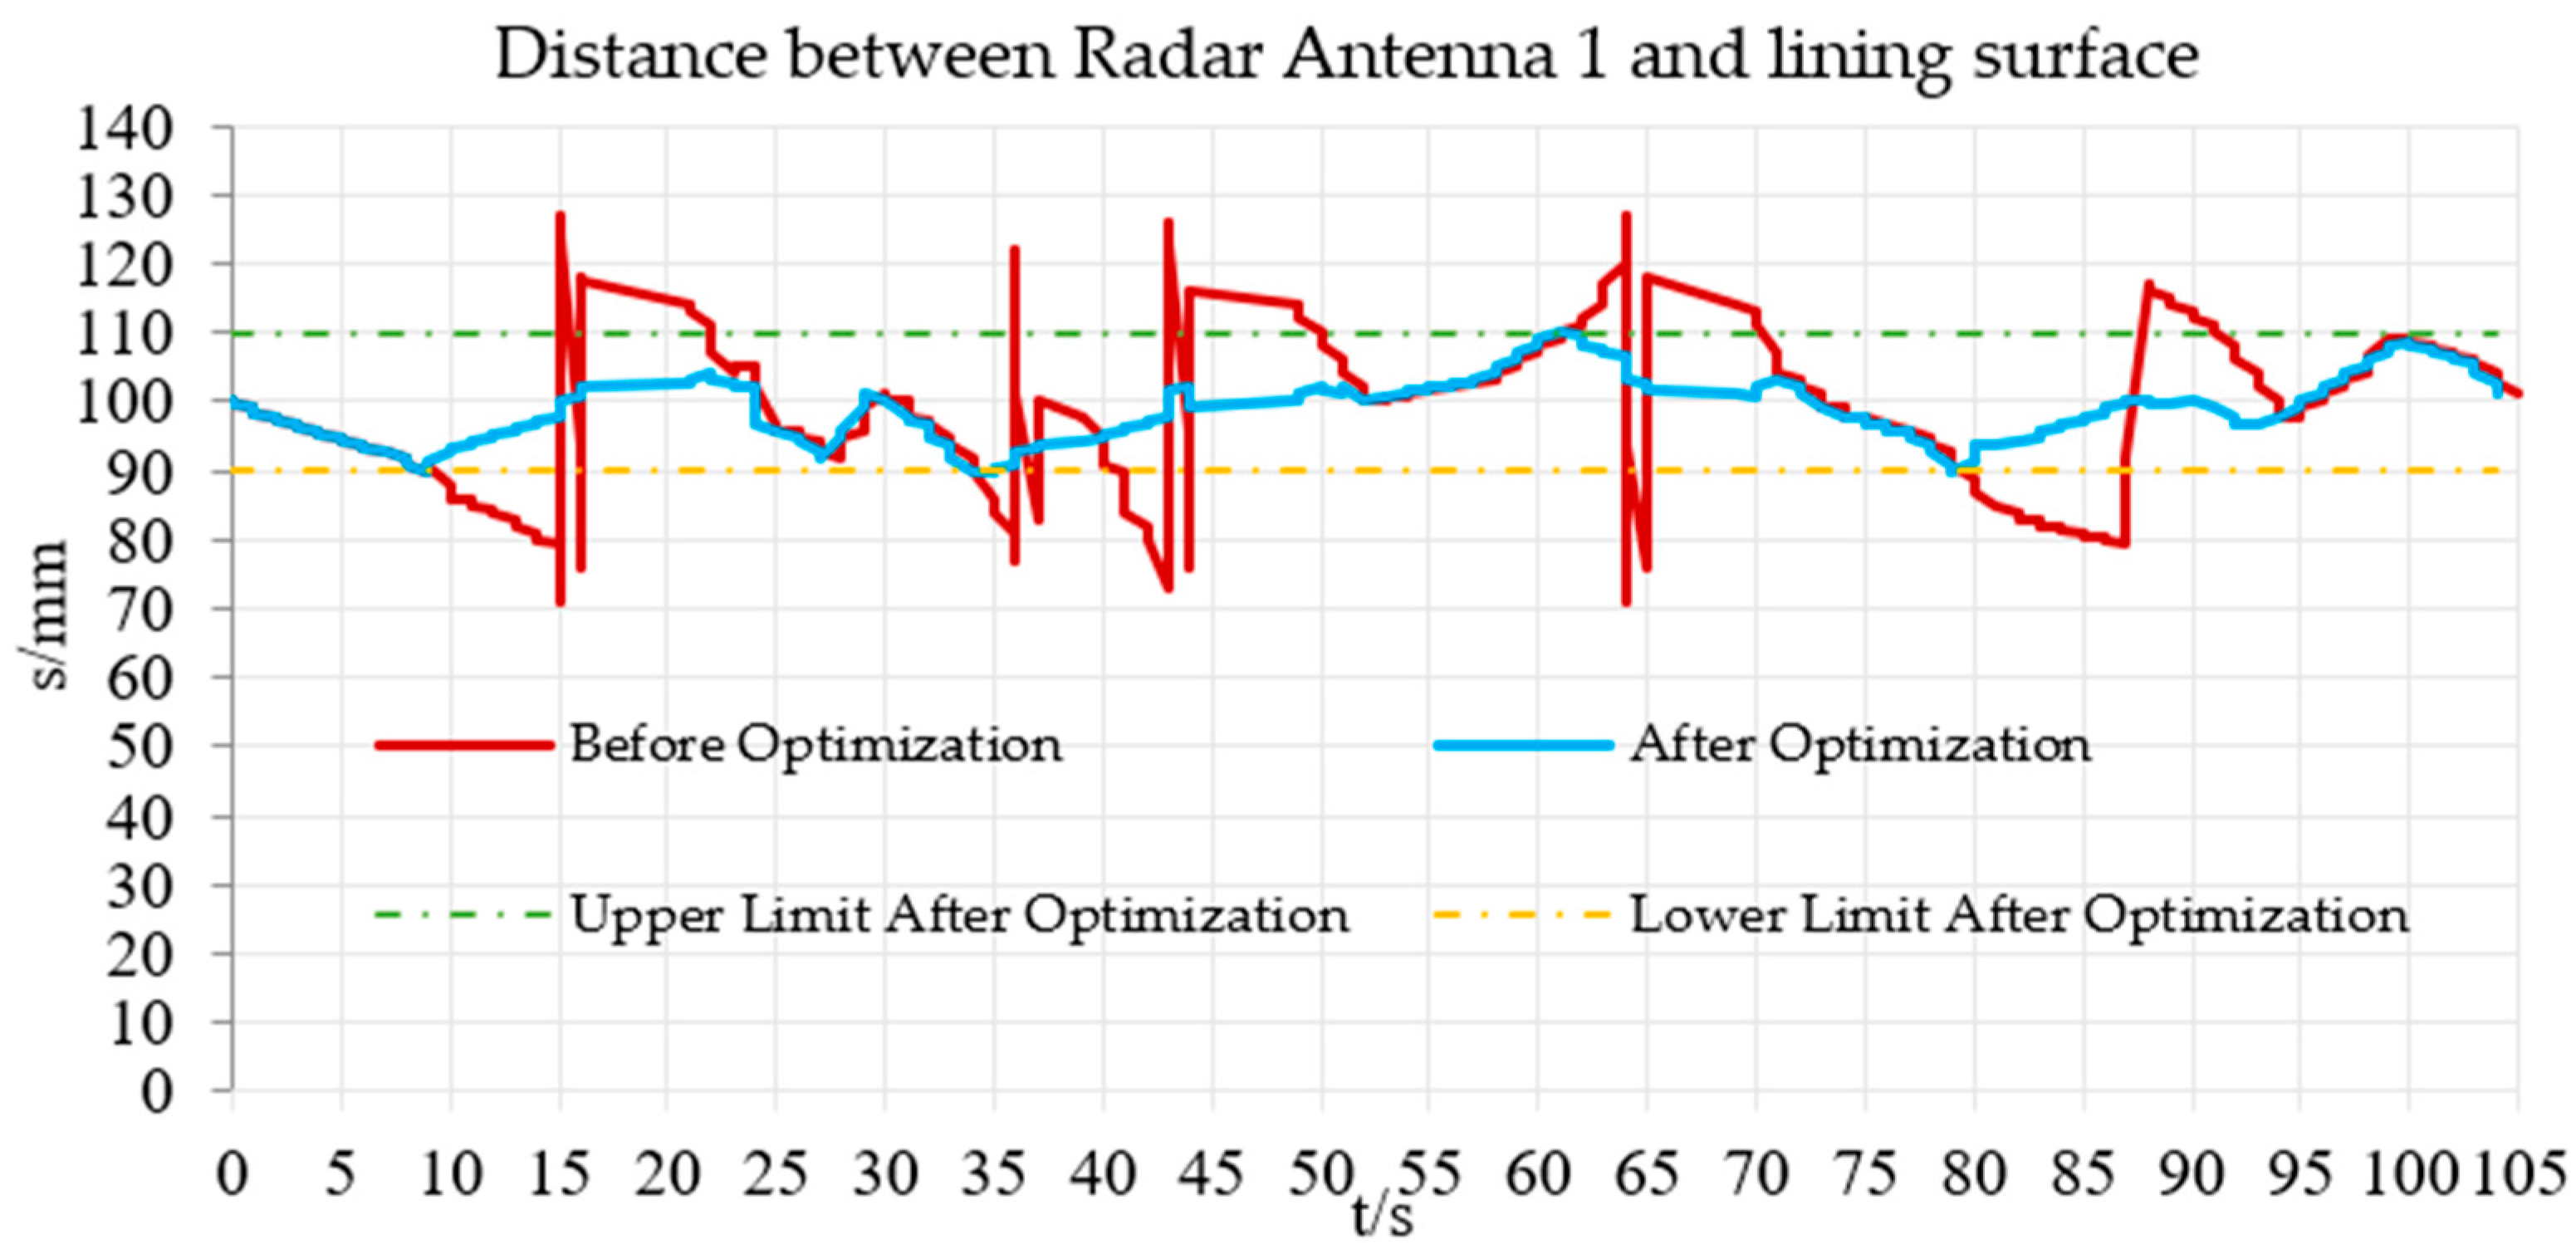
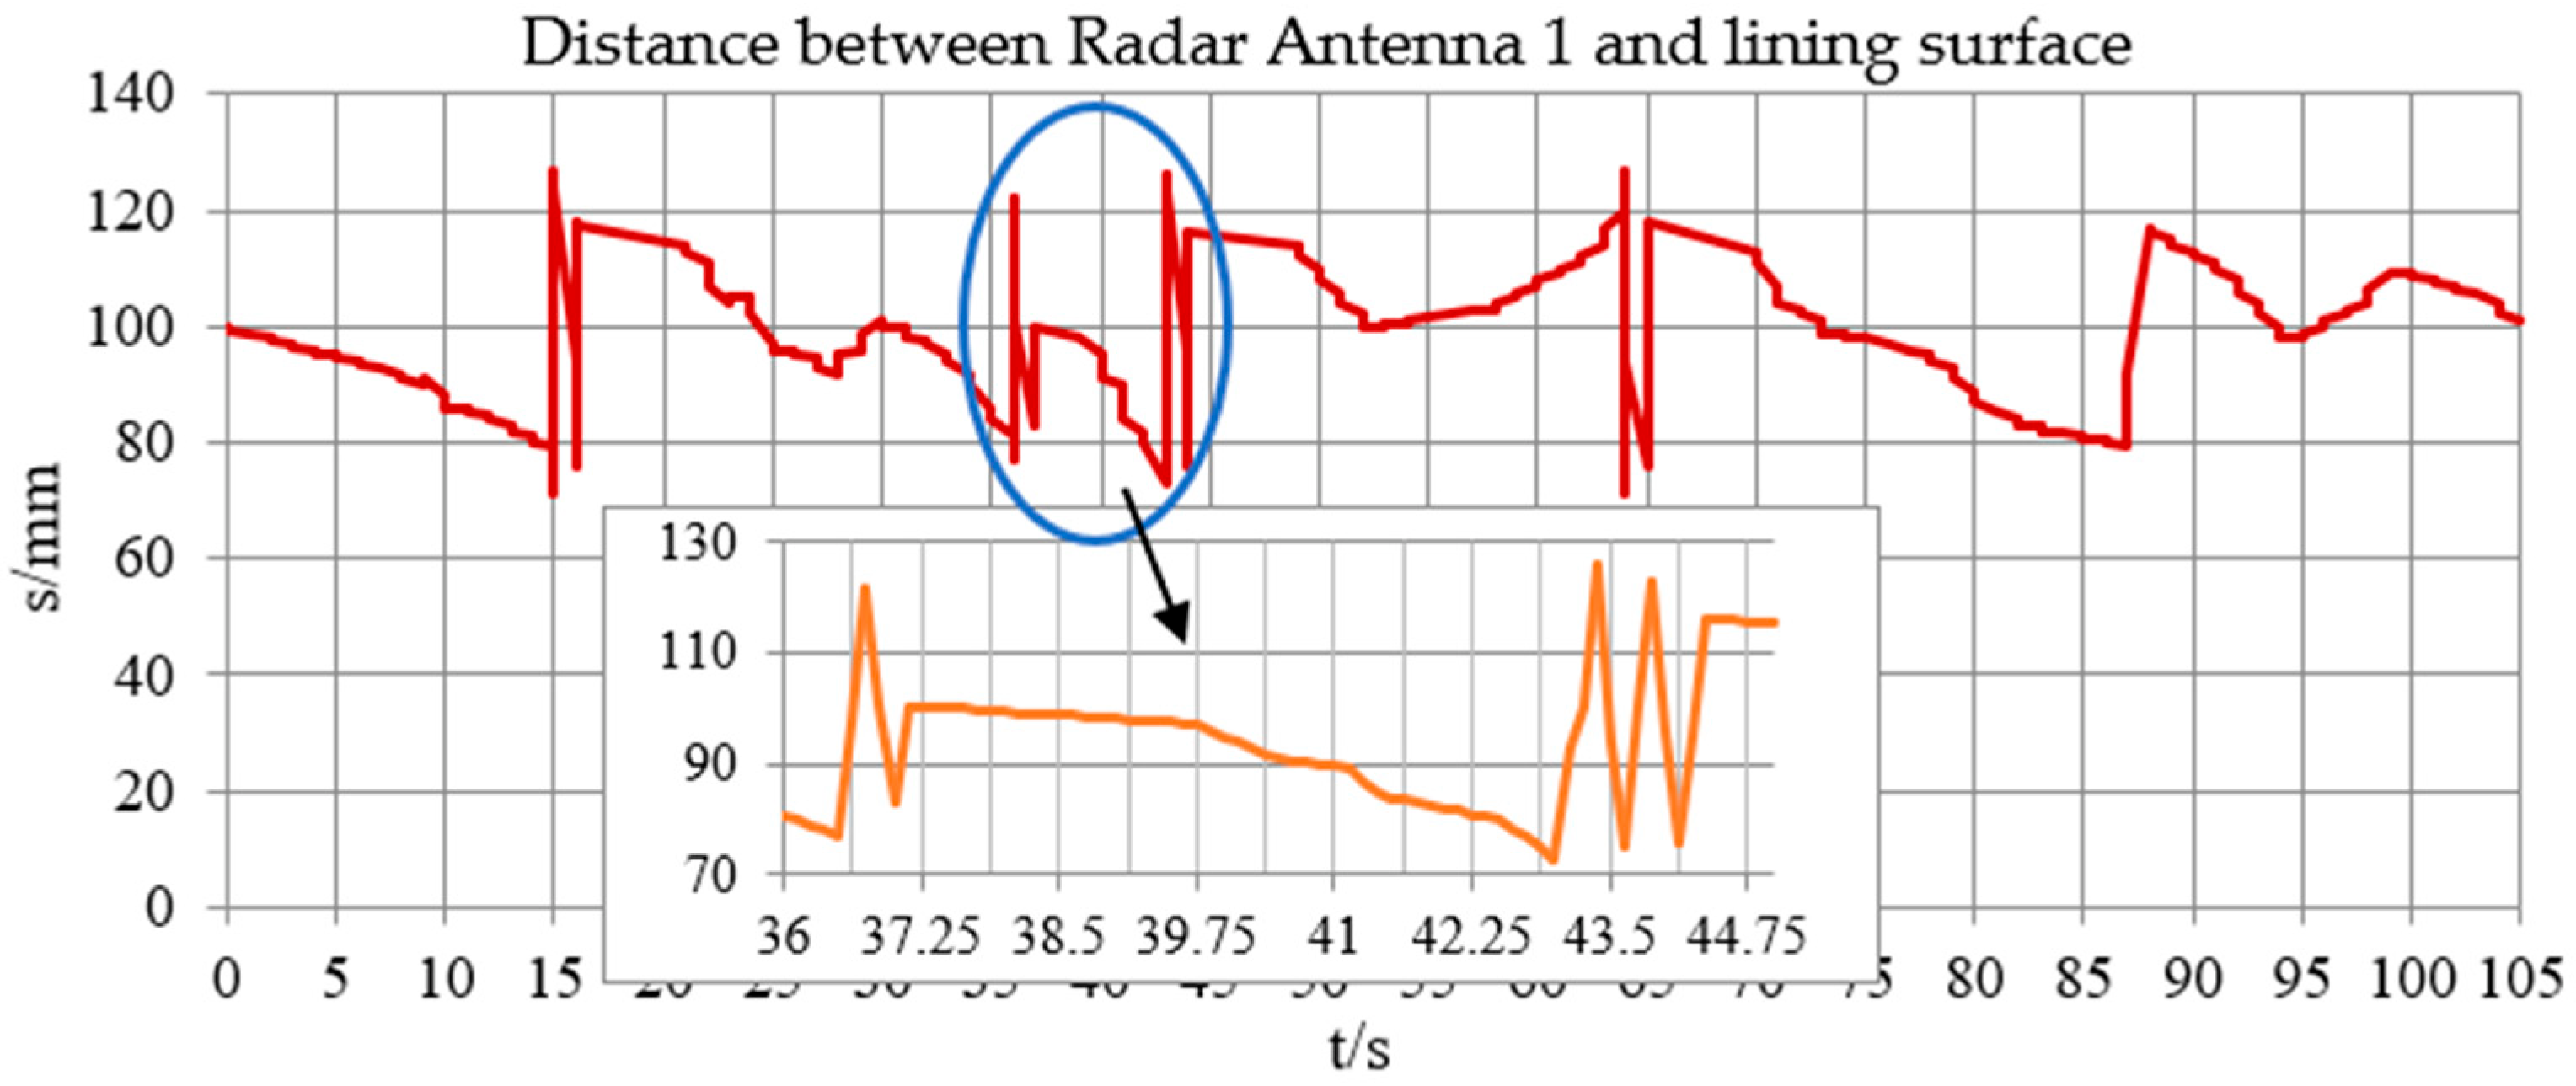
The PID regulation of the amplifier of the servo valve is changed to open-loop control, and the original transient step loading is changed to gentle slope loading when the servo valve operates, which can make the dynamic characteristics of the system during start-up and emergency braking significantly smoothed. The optimized control threshold is changed from ±20 mm to ±10 mm. Then, when a high-speed railway tunnel detection vehicle performed the on-site detection task, a section of lining profile variable area was selected, the ranging value of 100 mm was taken as the base point, and the initial state of the electric actuator was 50 mm. The ranging data were recorded for 105 s. The radial displacement detection results of Antenna 1 from lining surface before and after optimization are presented in
Figure 17,
Figure 18 and
Figure 19.
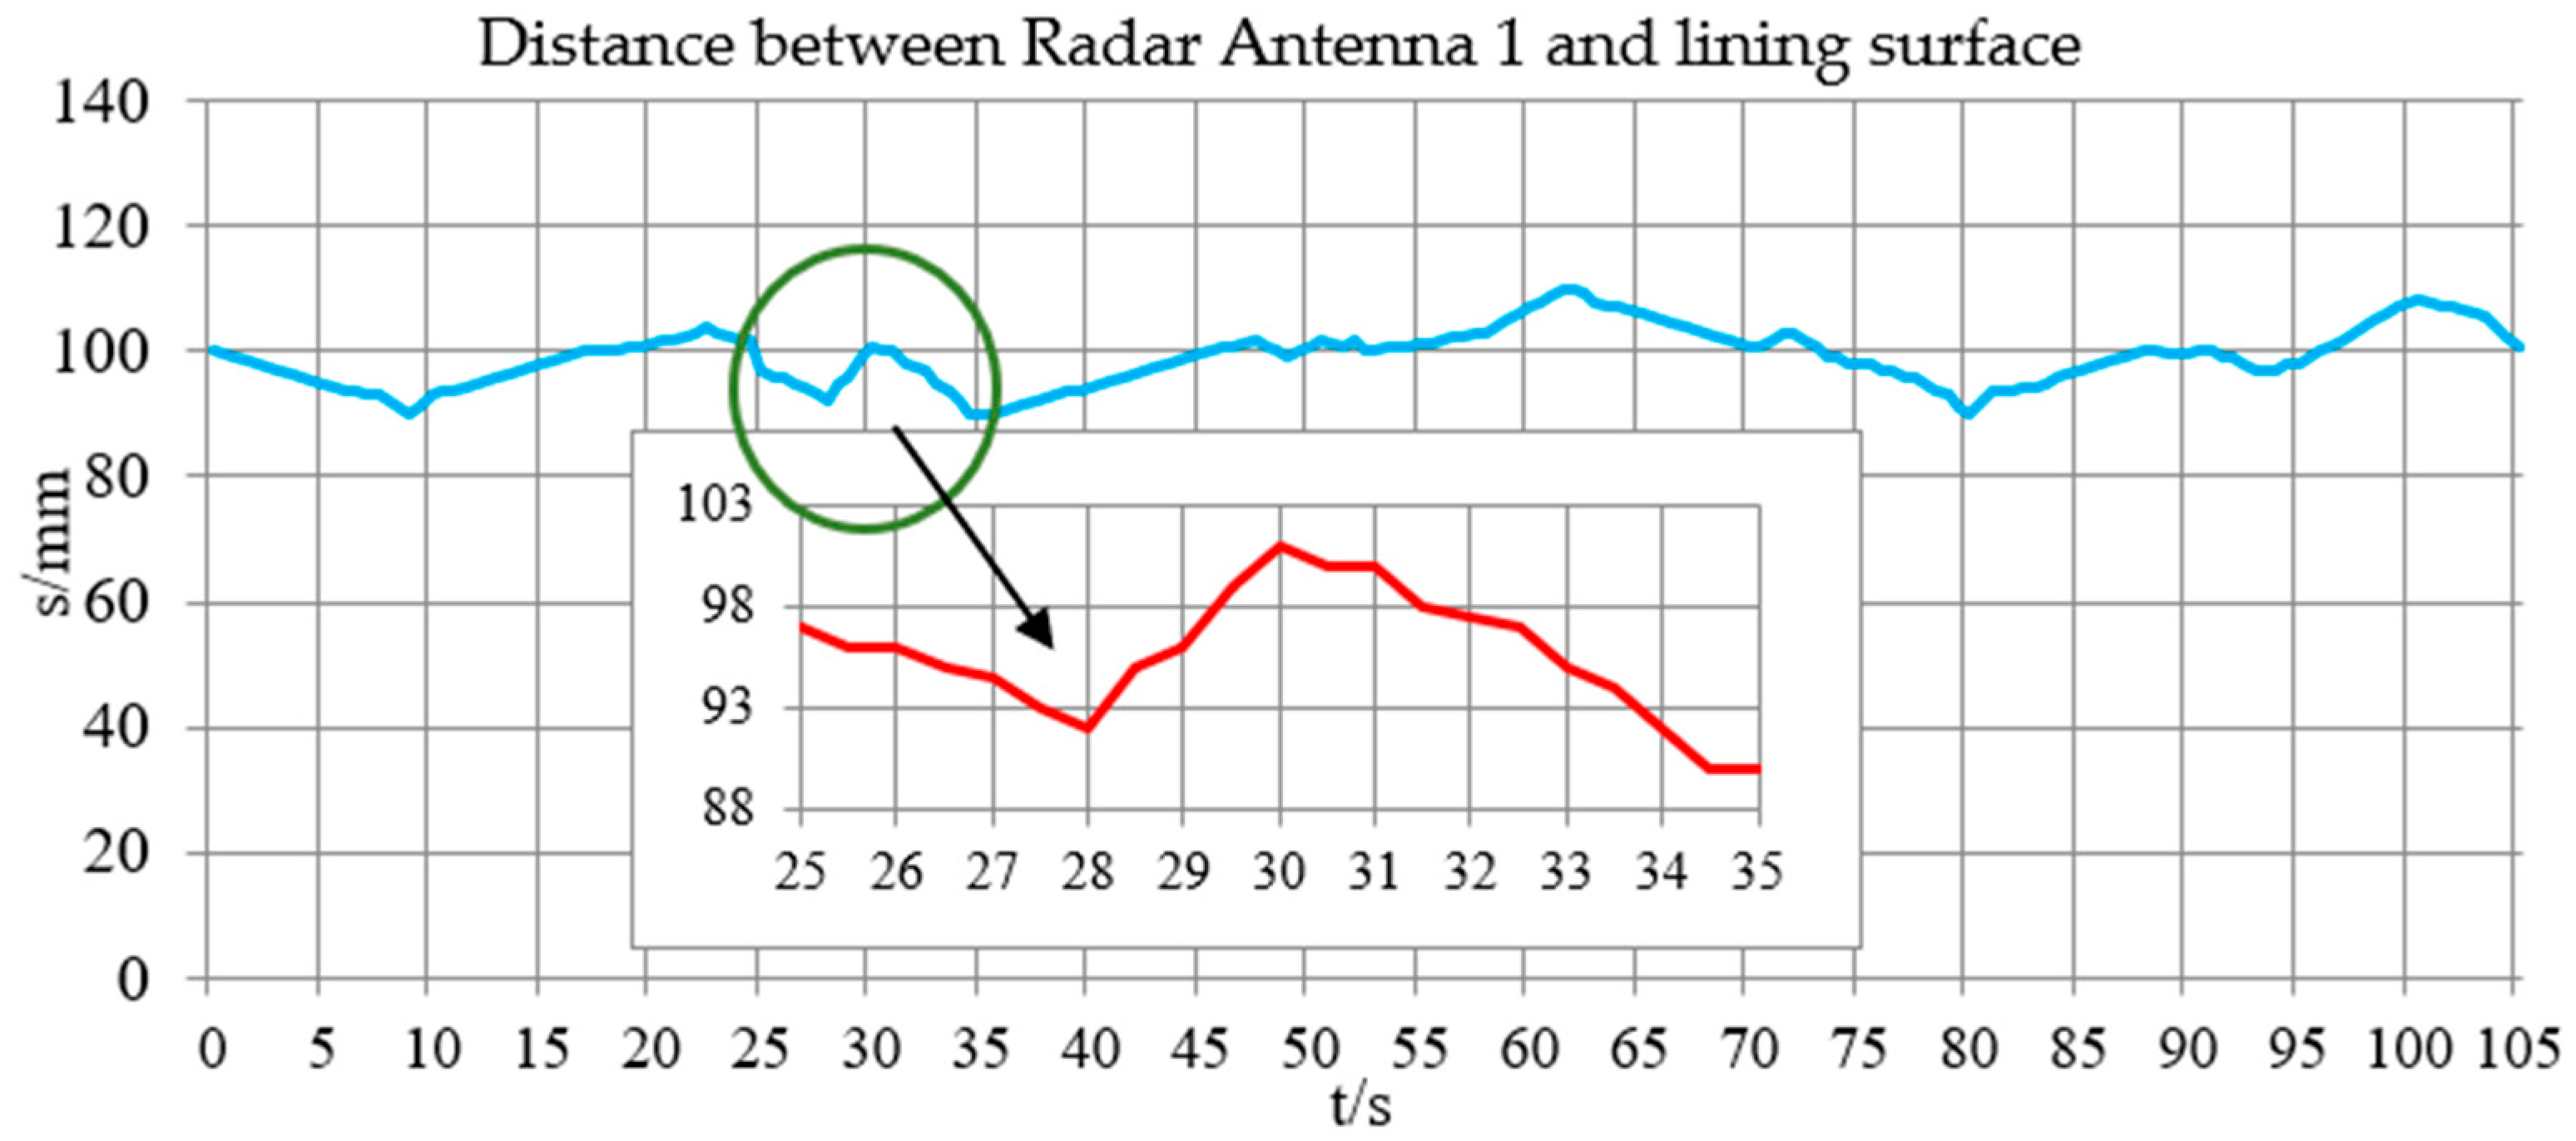
The action execution of the electric actuator is extremely stable. When the actual distance between the bent arm body and the lining surface is changed to less than ±50 mm, the radial distance measurement value can be maintained unchanged. When the threshold value is exceeded, multiple adjustments of servo-hydraulic cylinders on the main arm and bent arm will inevitably occur. In
Figure 17, 17 times of frequent adjustments appeared in 100 s, and the time of each adjustment is only 0.1 s. The relative real-time maximum adjustment is more than ±20 mm, which exceeded the control threshold several times, resulting in repeated instability in the distance maintenance range.
It is presented in
Figure 18 that the time of each adjustment increased by 9 times after optimization. The system fully responded to distance maintenance without repeated adjustment. Finally, the adjustment frequency was reduced by 76.5%. The dynamic characteristics of the detection device were greatly stabilized, and the relative real-time maximum adjustment was controlled to less than 5 mm (±2.5 mm), which satisfies the requirement of control threshold (±10 mm) after optimization.
The vibration effect and distance control were effectively guaranteed. The RPs and the TDDs of STW measured on-site are compared in
Figure 20 before and after optimization, and the adjustment effect of ADRC technology is very obvious.
- (1)
The zero axis with obvious oscillation can be completely corrected.
- (2)
The STW superposition amplitude of the original signal is greatly reduced (roughly reduced by 80%), and the phase deviation is almost eliminated.
- (3)
Compared with the adaptive algorithm correction of the original data, the dynamic correction on the original data can effectively improve the interference removal effect during data analysis.
6. Conclusions
A special detection device that carries three GPR antennas was mounted on the high-speed railway tunnel detection vehicle. Through a series of work such as simulation, experiments, GPR echo signal analysis, and optimization measures, the stability of the detection device and anti-interference performance of GPR echo signal was significantly improved. The main vibration response frequency of the detection device was increased from about 2.5 Hz to 4–5 Hz. The amplitude of longitudinal and radial vibration displacement was controlled within 10 mm, and the maximum real-time adjustment of radial displacement can be controlled by less than ±2.5 mm.
The author plans to analyze different GPR equipment in the follow-up research work, accumulate more field detection data for verification. Then, the research results will be supplemented to have better universality.
Author Contributions
Conceptualization, methodology, software, Y.L.; validation, Y.L., Y.Z., and T.T.; formal analysis, Y.L.; investigation, T.T.; resources, Y.L.; data curation, Y.Z. and T.T.; writing—original draft preparation, Y.L.; writing—review and editing, Y.L. and Y.Z.; visualization, Y.L. and B.J.; supervision, F.Q.; project administration, Y.L., F.Q. and B.J.; funding acquisition, Y.L. All authors have read and agreed to the published version of the manuscript.
Funding
This research was funded by Key Project of Science and Technology Research of China Academy of Railway Sciences, grant number 2019YJ157; Project of Science and Technology Research and Development Plan of China Railway Corporation, grant number 2017G003-H.
Institutional Review Board Statement
Not applicable.
Informed Consent Statement
Not applicable.
Data Availability Statement
The original data contributions presented in the research are included in the article, further inquiries can be directed to the corresponding authors.
Acknowledgments
The authors would like to express the heartfelt thanks to all the institution, companies, engineers and researchers who provided assistance during the project “Study on The Influence Dynamics Factors of Tunnel Lining Detection Device and Processing Algorithm Parameters Optimization of GPR Detection Data”.
Conflicts of Interest
The authors declare no conflict of interest.
Nomenclature
| Cross-sectional shape factor |
| Cross-sectional area |
| The cross-sectional moment of inertia |
| Vibration displacement |
| Density |
| Beam’s elastic modulus |
| Beam’s shear modulus |
| Mass matrix |
| Damping matrix |
| Stiffness matrix |
| Inertial element displacement vector |
| Inertial element velocity vector |
| Inertial element acceleration vector |
| Matrix of system’s external load |
| Parameters that can be adjusted according to the accuracy and stability of the integral |
Abbreviations
| GPR | Ground Penetrating Radar |
| Freq. | Frequency |
| Eq. | Equation |
| VGT | Vibration Generating Table |
| STW | Single Trace Waveform |
| RP | Radar Profile |
| TDD | Time Domain Diagram |
| FA | Frequency Amplitude |
| PID | Proportional-Integral-Differential |
| ADRC | Auto Disturbance Rejection Controller |
References
- Zhu, Z.R.; Zhao, S.Q.; Qi, X.; Wu, H.G.; Cui, Y. Application of Ground Penetrating Radar in Nondestructive Testing of Railway Tunnel Lining Quality. Chin. J. Eng. Geophys. 2021, 18, 703–708. [Google Scholar]
- Lu, X.Z. Application of ground penetrating radar in railway tunnel inspection. Geophys. Geochem. Explor. 2017, 41, 775–778. [Google Scholar]
- Wang, W.F.; Xu, H.Z. Application analysis of GPR in highway tunnel lining detection. China Water Transp. 2020, 20, 120–122. [Google Scholar]
- Battista, B.M.; Addison, A.D.; Knapp, C.C. Empirical Mode Decomposition Operator for Dewowing GPR Data. J. Environ. Eng. Geophys. 2009, 14, 163–169. [Google Scholar] [CrossRef] [Green Version]
- Chen, Y.P.; Li, Y.; Chen, G.F. The application of geological radar in detection of burial bodies. Comput. Tech. Geophys. Geochem. Explor. 2009, 31, 319–322. [Google Scholar]
- Wang, Z.Y.; Chen, Z.F.; Sun, B.; Liu, J. Application and study on ground penetrating radar technology in concrete structure. Concrete 2013, 12, 138–141. [Google Scholar]
- Lei, Y. Development of High Speed Railway Tunnel Lining Detection Vehicle; China Academy of Railway Sciences: Beijing, China, 2018; pp. 174–188. [Google Scholar]
- Lei, Y. Development Report of WX25T High Speed Railway Tunnel Lining Detection Vehicle; China Academy of Railway Sciences: Beijing, China, 2019; pp. 35–44. [Google Scholar]
- Lei, Y.; Tian, T. The Vibration Characteristic and Impact Analysis of Tunnel Lining Detection Device Based on Arc Rotating Multi-section Mechanism. Adv. Mech. Eng. 2020, 12, 1687814020912974. [Google Scholar] [CrossRef]
- Tian, T.; Jiang, B. Probation Assessment Report of WX25T High Speed Railway Tunnel Lining Detection Vehicle—Guiyang-Guangzhou High-Speed Railway; China Academy of Railway Sciences: Beijing, China, 2019; pp. 7–11. [Google Scholar]
- Shen, Y.W.; You, Z.M. Detection technology using geological radar for inspecting of lining quality of tunnel on high speed railway. Railw. Eng. 2012, 12, 57–60. [Google Scholar]
- Hu, Q.H. Experimental Study on Detection Of Tunnel Lining With On-Board Gpr And High Frequency Surface Waves. Ph.D. Dissertation, Southwest Jiaotong University, Chengdu, China, 2017. [Google Scholar]
- Liu, X.L. Research on Road Tunnel Detection Technology Based on Vehicle-borne Non-Contact Radar. Ph.D. Dissertation, Chongqing Jiaotong University, Chongqing, China, 2019. [Google Scholar]
- Dai, Q.W.; Wu, K.J.; Zhang, B. A study of application of short-time Fourier transform to GPR data interpretation. Geophys. Geochem. Explor. 2016, 40, 1227–1231. [Google Scholar]
- Shi, X.M.; Zhang, J.; Liu, M.H.; Wang, C. Application of Wavelet Transform in De-Nosing Ground Penetrating Radar Data. Chin. J. Eng. Geophys. 2008, 5, 279–286. [Google Scholar]
- Feng, D.S.; Dai, Q.W.; Yu, K. GPR signal processing under low SNR based on empirical mode decomposition. J. Cent. South Univ. 2012, 43, 596–604. [Google Scholar]
- Ciampoli, L.B.; Tosti, F.; Economou, N.; Benedetto, F. Signal processing of GPR data for road surveys. Geosciences 2019, 9, 96. [Google Scholar] [CrossRef] [Green Version]
- Cao, R.L.; Qi, F.L.; He, S.H. Research on the Influential Factors of Lining Detection by Non-Contact GPR Vehicle-Based Detection System. Mod. Tunn. Technol. 2016, 53, 17–24. [Google Scholar]
- Lane, J.S.; Dickerson, S.L. Contribution of Passive Damping to the Control of Flexible Manipulators. In Proceedings of the International Computers in Engineering Conference, Las Vegas, NV, USA, 12–15 August 1984; ASME: New York, NY, USA, 1984; pp. 175–180. [Google Scholar]
- Sassine, J.H. Suspension component with sealed damping layer. Acoust. Soc. Am. J. 2009, 125, 1263. [Google Scholar] [CrossRef]
- McTavish, D.J.; Hughes, P.C. Modeling of linear viscoelastic space structures. J. Vib. Acoust. Stress Reliab. Des. 1993, 115, 103–110. [Google Scholar] [CrossRef]
- Garq, D.P.; Anderson, G.L. Research in active composite materials and structures: An overview. Proc. SPIE-Int. Soc. Opt. Eng. 2000, 3992, 2–12. [Google Scholar]
- Zhang, Q. Research on Dynamics and Restraining Vibration of Assembled Flexible Link. Ph.D. Dissertation, Nanjing University of Science and Technology, Nanjing, China, 2010. [Google Scholar]
- Hu, H.S. Research on Active Vibration Control of Beams Excited by Moving Mass. Ph.D. Dissertation, Nanjing University of Science and Technology, Nanjing, China, 2005. [Google Scholar]
- Ma, X.F. ABAQUS 6.11 Finite Element Analysis of Chinese Version, from the Entry to the Proficient, 1st ed.; Tsinghua University Press: Beijing, China, 2013; pp. 156–197. [Google Scholar]
- Qi, F.L.; Lei, Y.; Deng, P.; Huang, Q.D. Car body vertical vibration analysis under track medium wave irregularity and the influence factors of ballast bed. J. Low Freq. Noise Vib. Act. Control 2019, 38, 1160–1177. [Google Scholar] [CrossRef] [Green Version]
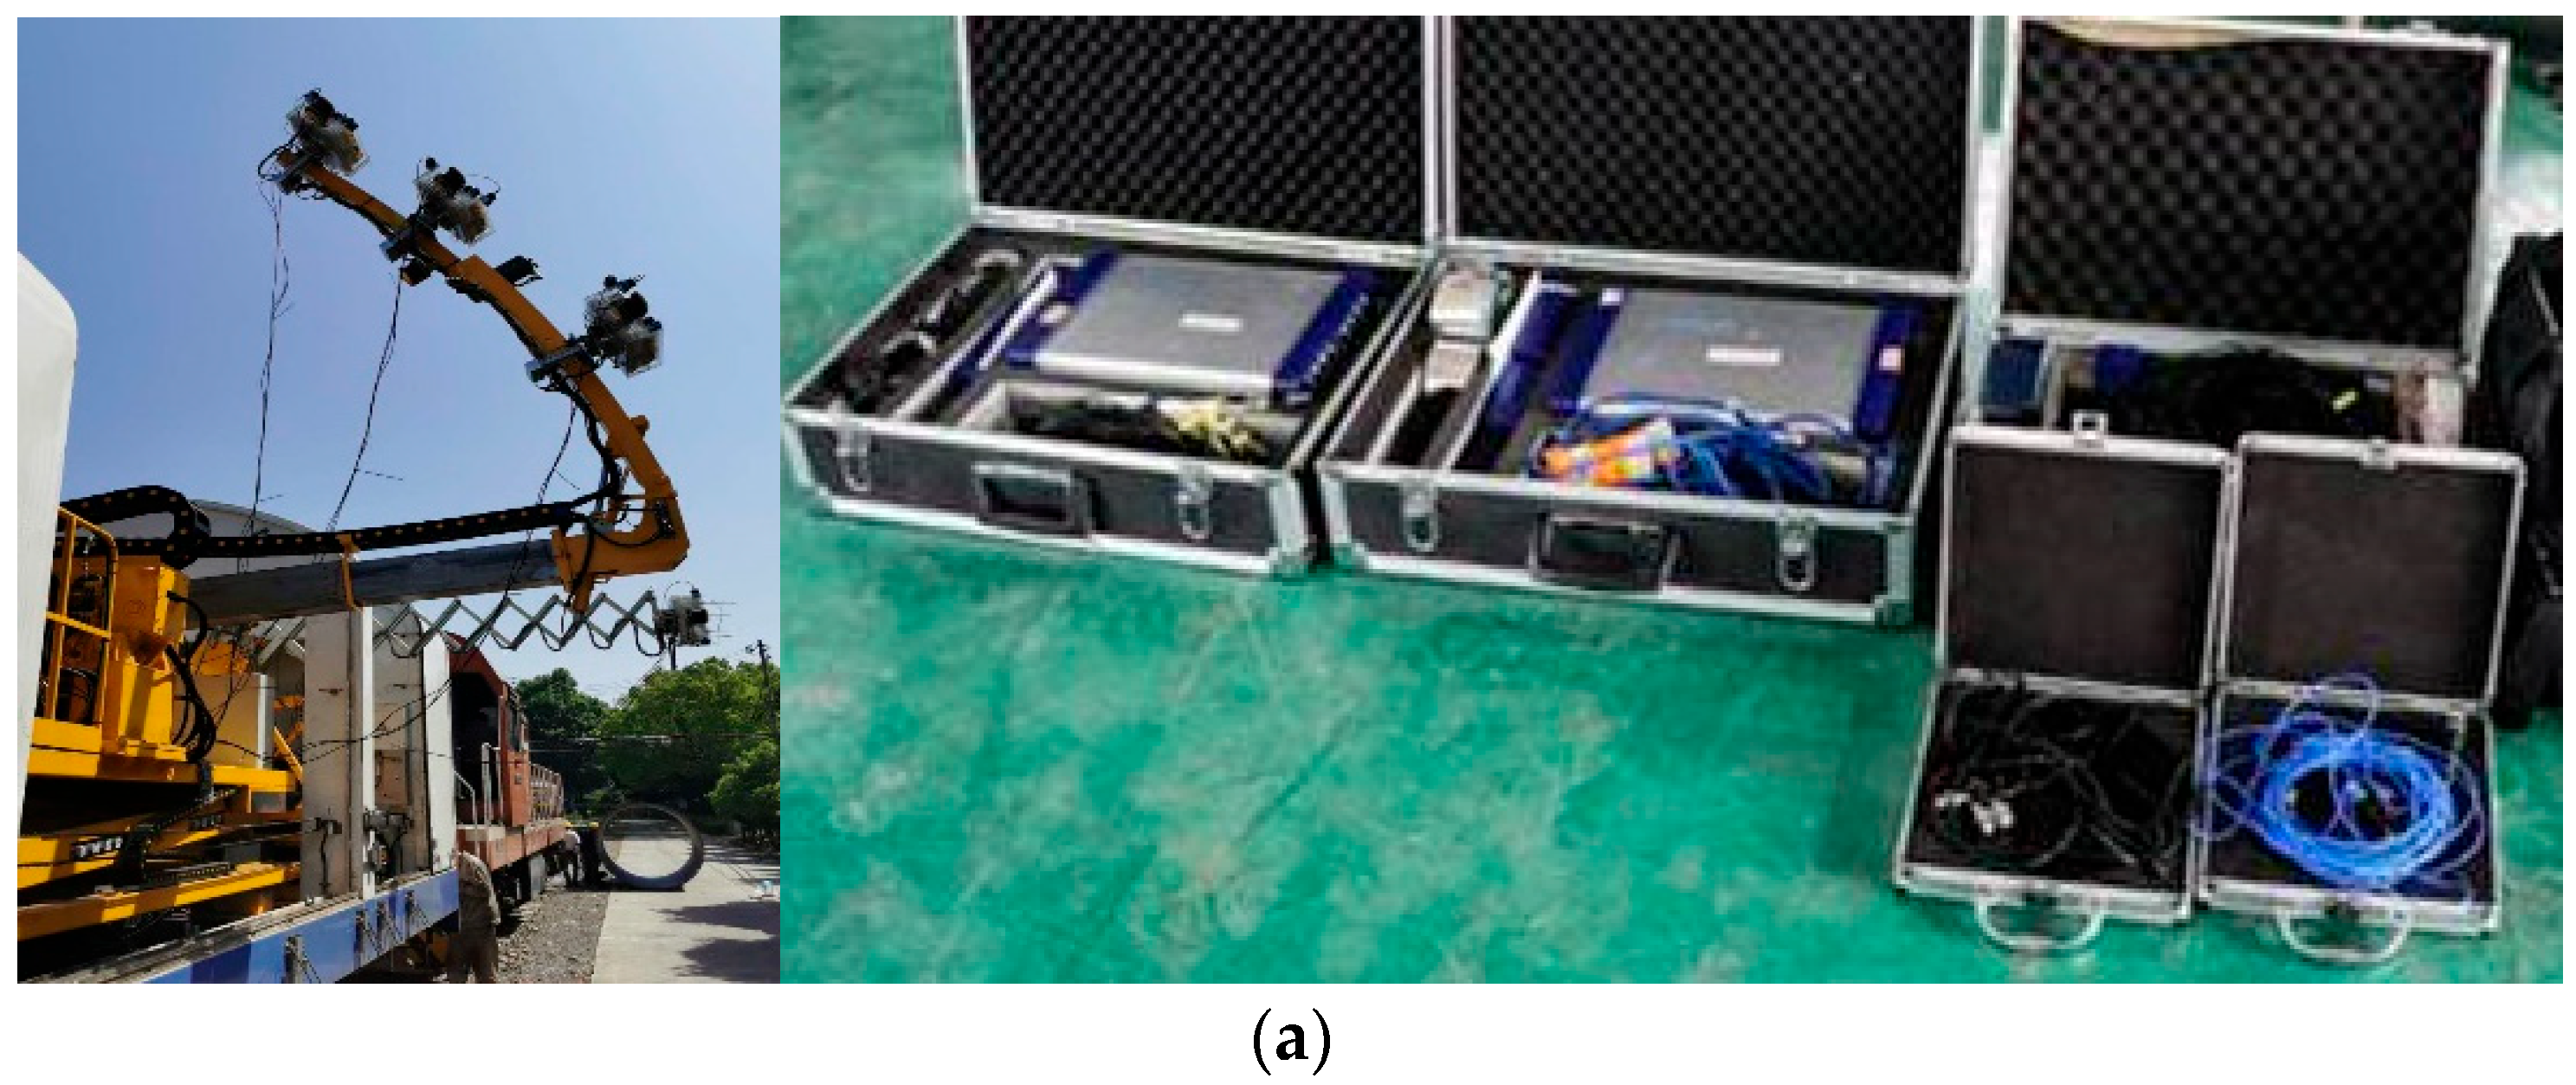
Figure 1.
Physical view of the on-site testing: (1) bent arm; (2) main arm; (3) swinging cylinder; (4) electric actuator; (5) rotating motor; (6) GPR antenna; (7) antenna pedestal.
Figure 1.
Physical view of the on-site testing: (1) bent arm; (2) main arm; (3) swinging cylinder; (4) electric actuator; (5) rotating motor; (6) GPR antenna; (7) antenna pedestal.
Figure 2.
The FE model of bent arm.
Figure 2.
The FE model of bent arm.
Figure 3.
Platform longitudinal vibration velocity applied.
Figure 3.
Platform longitudinal vibration velocity applied.
Figure 4.
Longitudinal vibration relative displacement simulation results of Antenna 1 pedestal in time period 1.
Figure 4.
Longitudinal vibration relative displacement simulation results of Antenna 1 pedestal in time period 1.
Figure 5.
Longitudinal vibration relative displacement simulation results of Antenna 1 pedestal in time period 2.
Figure 5.
Longitudinal vibration relative displacement simulation results of Antenna 1 pedestal in time period 2.
Figure 6.
Radial vibration displacement simulation results of Antenna 1 pedestal.
Figure 6.
Radial vibration displacement simulation results of Antenna 1 pedestal.
Figure 7.
Antenna 1 measurement of vibration response: (a) test equipment and site status; (b) longitudinal vibration response; (c) Radial vibration response.
Figure 7.
Antenna 1 measurement of vibration response: (a) test equipment and site status; (b) longitudinal vibration response; (c) Radial vibration response.
Figure 8.
Servo-controlled VGT and GPR antenna: (a) the testing antennas; (b) the VGT.
Figure 8.
Servo-controlled VGT and GPR antenna: (a) the testing antennas; (b) the VGT.
Figure 9.
TDD and spectrum under static conditions: 512 sampling points correspond to 40 ns time window in this article.
Figure 9.
TDD and spectrum under static conditions: 512 sampling points correspond to 40 ns time window in this article.
Figure 10.
TDD and spectrum of under 2.5 Hz-25 mm excitation: (a) horizontal vibration condition; (b) vertical vibration condition.
Figure 10.
TDD and spectrum of under 2.5 Hz-25 mm excitation: (a) horizontal vibration condition; (b) vertical vibration condition.
Figure 11.
RPs under 2.5 Hz-25 mm excitation: (a) horizontal vibration condition; (b) vertical vibration condition. All RPs in this article are zero bias removed and gain processed using the same parameters. Y-axes represent the two-way travel time T, and the unit is ns.
Figure 11.
RPs under 2.5 Hz-25 mm excitation: (a) horizontal vibration condition; (b) vertical vibration condition. All RPs in this article are zero bias removed and gain processed using the same parameters. Y-axes represent the two-way travel time T, and the unit is ns.
Figure 12.
RPs under the vertical vibration condition: (a) 5 Hz-15 mm; (b) 5 Hz-5 mm; (c) 8 Hz-3 mm; (d) 12 Hz-3 mm.
Figure 12.
RPs under the vertical vibration condition: (a) 5 Hz-15 mm; (b) 5 Hz-5 mm; (c) 8 Hz-3 mm; (d) 12 Hz-3 mm.
Figure 13.
RPs of the defective areas measured at different distances from the tunnel lining surface: (a) distance 8 cm; (b) distance 12 cm; (c) distance 16 cm.
Figure 13.
RPs of the defective areas measured at different distances from the tunnel lining surface: (a) distance 8 cm; (b) distance 12 cm; (c) distance 16 cm.
Figure 14.
Finite element model diagram of the detection device after structure optimization.
Figure 14.
Finite element model diagram of the detection device after structure optimization.
Figure 15.
Amplitude-frequency vibration simulation results of Antenna 1 pedestal after structure optimization: (a) longitudinal vibration relative displacement simulation results in time period 1; (b) radial vibration displacement simulation results.
Figure 15.
Amplitude-frequency vibration simulation results of Antenna 1 pedestal after structure optimization: (a) longitudinal vibration relative displacement simulation results in time period 1; (b) radial vibration displacement simulation results.
Figure 16.
Comparison of control logic before and after Optimization: (a) original control logic; (b) optimized control logic.
Figure 16.
Comparison of control logic before and after Optimization: (a) original control logic; (b) optimized control logic.
Figure 17.
Measured distance curve before optimization.
Figure 17.
Measured distance curve before optimization.
Figure 18.
Measured distance curve after optimization.
Figure 18.
Measured distance curve after optimization.
Figure 19.
Measured distance curve comparison results before and after optimization.
Figure 19.
Measured distance curve comparison results before and after optimization.
Figure 20.
The RPs and TDDs of STW measured on-site before and after optimization of Antenna 1: (a) before; (b) after.
Figure 20.
The RPs and TDDs of STW measured on-site before and after optimization of Antenna 1: (a) before; (b) after.
Table 1.
Individual components material parameters of detection device.
Table 1.
Individual components material parameters of detection device.
| Name | Density (kg.m−3) | Modulus of Elasticity (Pa) | Poisson’s Ratio |
|---|
| Arm body | 7850 | 2.1 × 10⁵ | 0.27 |
| Rotating motor shafts | 8200 | 2.06 × 10¹¹ | 0.3 |
| Electric Actuators | 2900 | 8 × 10¹⁰ | 0.35 |
| Radar antenna shell | 1140 | 2.6 × 10⁹ | 0.4 |
Table 2.
Vibration modes of the detection device.
Table 2.
Vibration modes of the detection device.
| No. | Vibration Type | Freq./Hz | No. | Vibration Type | Freq./Hz |
|---|
| 1 | 1st order radial | 2.326 | 7 | 3rd order longitudinal | 8.400 |
| 2 | 1st order longitudinal | 2.382 | 8 | 3rd order radial | 9.326 |
| 3 | 1st order torsion | 3.266 | 9 | 3rd order torsion | 10.04 |
| 4 | 2nd order longitudinal | 4.605 | 10 | 4th order radial | 12.44 |
| 5 | 2nd order radial | 6.432 | 11 | 4th order torsion | 14.03 |
| 6 | 2nd order torsion | 7.551 | 12 | 4th order longitudinal | 14.85 |
Table 3.
The main FA of spectrum under multiple conditions of vertical vibration excitation frequency-amplitude.
Table 3.
The main FA of spectrum under multiple conditions of vertical vibration excitation frequency-amplitude.
| Working Conditions | Main FA of Spectrum | Difference % | Working Conditions | Main FA of Spectrum | Difference % |
|---|
| Static | 1384 | Base Value | 5 Hz-10 mm | 1274 | 7.9% |
| 1 Hz-5 mm | 1367 | 1.2% | 5 Hz-15 mm | 1103 | 20.3% |
| 1 Hz-10 mm | 1296 | 6.4% | 8 Hz-3 mm | 1364 | 1.4% |
| 1 Hz-15 mm | 1166 | 15.8% | 8 Hz-5 mm | 1329 | 4.0% |
| 1 Hz-25 mm | 998 | 27.9% | 10 Hz-3 mm | 1360 | 1.7% |
| 2.5 Hz-5 mm | 1361 | 1.7% | 10 Hz-5 mm | 1309 | 5.4% |
| 2.5 Hz-10 mm | 1288 | 6.9% | 12 Hz-3 mm | 1298 | 6.2% |
| 2.5 Hz-15 mm | 1149 | 17.0% | 12 Hz-5 mm | 1251 | 9.6% |
| 2.5 Hz-25 mm | 987 | 28.7% | 15 Hz-3 mm | 1233 | 10.9% |
| 5 Hz-5 mm | 1346 | 2.7% | 15 Hz-5 mm | 1189 | 14.1% |
Table 4.
Vibration modes of the detection device after structure optimization.
Table 4.
Vibration modes of the detection device after structure optimization.
| No. | Vibration Type | Freq. (Before Optimization)/Hz | Freq. (After Optimization)/Hz |
|---|
| 1 | 1st order radial | 2.326 | 5.356 |
| 2 | 1st order longitudinal | 2.382 | 4.413 |
| 3 | 1st order torsion | 3.266 | 6.754 |
| 4 | 2nd order longitudinal | 4.605 | 8.512 |
| 5 | 2nd order radial | 6.432 | 7.732 |
| 6 | 2nd order torsion | 7.551 | 10.184 |
| Publisher’s Note: MDPI stays neutral with regard to jurisdictional claims in published maps and institutional affiliations. |
© 2021 by the authors. Licensee MDPI, Basel, Switzerland. This article is an open access article distributed under the terms and conditions of the Creative Commons Attribution (CC BY) license (https://creativecommons.org/licenses/by/4.0/).


