Article

Test Evaluation Method for Lane Keeping Assistance System Using Dual Cameras

1
Department of Mechanical Engineering, Keimyung University, Daegu 42601, Korea
2
Division of Mechanical and Automotive Engineering, Keimyung University, Daegu 42601, Korea
*
Author to whom correspondence should be addressed.
Machines 2021, 9(12), 310; https://doi.org/10.3390/machines9120310
Submission received: 18 October 2021 / Revised: 18 November 2021 / Accepted: 22 November 2021 / Published: 25 November 2021

Abstract

:
Recently, the number of vehicles equipped with the Lane Keeping Assistance System (LKAS) is increasing. Therefore, safety evaluation to validate the LKAS has become more important. However, the actual vehicle test for safety evaluation has disadvantages such as the need for professional manpower, the use of expensive equipment, and environmental constraints. Therefore, we attempted to solve this problem using the dual cameras system with only inexpensive and accessible cameras. The optimal position of the dual cameras, image and focal length correction, and lane detection methods proposed in previous studies were used, and a theoretical equation for calculating the distance from the front wheel of the vehicle to the driving lane was proposed. For the actual vehicle testing, LKAS safety evaluation scenarios proposed in previous studies were used. According to the test results, the maximum error was 0.17 m, which indicated the reliability of the method because all errors in the tested scenarios exhibited similar trends and values. Therefore, through the use of the proposed theoretical equations in conjunction with inexpensive cameras, it is possible to reduce time, cost, and environmental problems in the development, vehicle application, and safety evaluation of LKAS components.

1. Introduction

The Lane Keeping Assistance System (LKAS) is a type of autonomous driving technology used in Advanced Driver Assistance Systems (ADASs). The main function of an LKAS is to warn the driver and control the vehicle to prevent it from leaving its lane if it attempts to change lanes without operating its turn signal while traveling at a certain velocity or higher. The Society of Automotive Engineers (SAE) defines SAE levels, in the context of motor vehicles and their operation on roadways, from Level 0 (no driving automation) to Level 5 (full driving automation) [1]. Recently, commercialized autonomous driving technology is Level 2 and includes the LKAS.
As autonomous driving technology continues to develop, the market size of the autonomous vehicle market will also grow. In South Korea, the autonomous vehicle market is expected to grow by +4.11% annually from 2021 to 2030, with an average annual growth rate of 107.05% until 2025 for Level 2 vehicles [2]. Accordingly, it is expected that the number of vehicles equipped with the LKAS will also increase rapidly.
In addition, the number of lane-departure accidents in South Korea was 612 in 2020, accounting for 7.8% of single-vehicle accidents, according to an investigation by the domestic Traffic Accident Analysis System (TAAS) [3]. Although the proportion of traffic accidents due to lane departure is currently significant, the accident rates are expected to decrease as the LKAS becomes more widely applied. Based on random-effect model meta-analysis, for each increase in the LKAS penetration rate by 1%, the lane-departure accident rate decreases by 0.27%, whereas the lane-departure fatality rate decreases by 0.14% [4]. Therefore, the LKAS is considered to be greatly helpful for improving vehicle safety. As a result, improving the reliability of the LKAS has become a more important task, and thus many studies related to the functional implementation and evaluation of the LKAS are being conducted. The trends and contents of work related to the LKAS are as follows.
Some of the studies regarding the functional implementation of the LKAS are as follows. An et al. [5] developed a camera-based lane-departure warning system implemented using Field Programmable Gate Arrays (FPGAs). Kim et al. [6] proposed the use of a Long Short-Term Memory (LSTM) model, which provides an advantage in that data sequences from the camera sensor, expressed as steering angle data, are used to estimate the yaw rate value based on the dynamic movement of the vehicle. Nguyen et al. [7] devised an approach to detect information about lanes and vehicles for driver assistance systems or lane-change assistance systems. Shin et al. [8] constructed an automatic lane-change algorithm that uses vision sensors and similar lanes to generate a route for lane changes. Em et al. [9] proposed a vision-based lane-departure warning framework for lane-departure detection in daytime and nighttime driving environments. Bian et al. [10] designed an advanced LKAS with two switchable assist modes: lane-departure avoidance mode and lane-keeping co-pilot mode. Chen et al. [11] devised a fuzzy Takagi-Sugeno (T-S) model as a lane-keeping control method for reducing the lateral deviation of autonomous vehicles. Yoo et al. [12] presented a robust lane-marking feature extraction method that is fast enough for real-time application using a graph model-based approach. Meng et al. [13] built the Lane Keeping Control (LKC) model of an Electric Vehicle Driven by Four Wheels Independently (EV-DFWI) to design a controller to improve the output response and robustness of the LKC. Xu el al. [14] developed a control design approach with correctness guarantees for the simultaneous operation of Lane Keeping (LK) and Adaptive Cruise Control (ACC), where the longitudinal force and steering angle are generated by solving quadratic programs. Péter et al. [15] presented a full solution of lane changing, implemented in a real vehicle based on a steering wheel actuator. Kővári et al. [16] presented two new algorithms for the lateral vehicle control problem of a dynamic nonlinear single track vehicle model in the form of lane-keeping, along with the in-depth statistical and strategic comparison of six different Machine-Learning (ML) and search-based algorithms. Gaikwad et al. [17] proposed a new Lane Departure Identification (LDI) technique that uses only three lane-related parameters based on the Euclidean distance transform to compute the lane departure of a vehicle. Xu et al. [18] presented a safeguard-protected preview lane keeping control algorithm for automated vehicles, to achieve smooth and safe operations. Yang et al. [19] developed an integrated lane-keeping and forward anti-traffic system for semi-trailer trucks.
Meanwhile, some of the studies regarding the evaluation of the LKAS are as follows. Woo et al. [20] discussed and summarized a number of test procedures for the LKAS through an extensive study of previously published documents and reports regarding the LKAS and lateral test procedures, including the Lane Departure Warning System (LDWS). Yoon et al. [21] developed an LKAS test scenario tailored to domestic road environments and proposed an equation for determining the target relative distance. Bae et al. [22] developed and simulated an additional steering-angle application modeling technique using the Prescan for scenarios proposed in previous studies, and verified the validity of the modeling technique via comparative analysis with data obtained through actual vehicle tests. Reddy et al. [23] evaluated the performance of a lane assistance system by estimating the effect of the driving environment on the performance, defined the performance level of the lane assistance system, and provided a classification system to define the characteristics of the Operational Design Domain (ODD). Jiang et al. [24] proposed a maneuver evaluation algorithm for the lane-change assistance system and verified it through a simulation environment in the Prescan. Lee et al. [25] proposed comprehensive synthesis and analysis methods to find the performance limits and the impact of parameter changes on the lane keeping system performance. Hwang et al. [26] proposed the LKAS by adopting the desired reference path generation algorithm and optimal control technique. Bae et al. [27] proposed a theoretical equation for calculating the distance from the front wheel to the lane using a monocular camera, and verified the validity of the theoretical equation through actual vehicle tests.
However, although studies on the implementation and evaluation of the LKAS functions are being actively conducted, studies on image processing and correction using the dual cameras and on the theoretical safety evaluations of these methods have thus far been scarce. In addition, studies related to the safety evaluation of the LKAS focused on comparative analysis of evaluation procedures or proposals for scenarios. These studies lacked detailed explanations of the process or method of obtaining result values only with specific equipment. In addition, expensive equipment such as simulation programs, multiple cameras, Global Positioning System (GPS), etc. are required in the actual vehicle test and verification stage.
The safety evaluation of ADAS performs an actual vehicle test in order to consider various variables that occur during actual driving. In the actual vehicle test, expensive equipment such as Differential Global Positioning System (DGPS) and Data Acquisition (DAQ) is installed in addition to the camera to measure the dynamic characteristics of the vehicle. In order to use such equipment, trained professionals are required, and there are environmental restrictions. These factors cause problems in that the cost and time required for test evaluation are increased. The purpose of this study is to propose a method that can perform a simple safety evaluation of the LKAS with only a camera with general specifications such as a webcam and the proposed theoretical formula.
This study proposes a method to test and evaluate the LKAS using dual cameras. To achieve the objective, theoretical formulas were proposed and actual vehicle tests were conducted according to the test and evaluation procedure. Additionally, methods such as correction and lane detection methods and camera mounting location determination were cited from the previous study in [28], and test evaluation scenarios were cited from the related study in [29]. The study structure is as follows.
First, the image processing method and variables necessary to derive the equation are defined. Second, to calculate the distance to the lane, a theoretical equation is derived from the geometric relationship between the vehicle and the road. The equation is based on an existing lane detection algorithm and image and focal length correction method, and on the optimal dual-camera position as determined in previous research. In addition, it enables theoretical verification of the proposed theoretical equation in an environment where ADAS-related parts development or actual vehicle safety evaluation is impossible. Finally, Through the use of LKAS tests and evaluation scenarios proposed in a previous study, the theoretical equation is evaluated through an actual vehicle test, and the reliability of the LKAS safety evaluation using the dual cameras is verified.

2. Proposed Theoretical Equation for the LKAS

2.1. Background of Theoretical Equations

In a previous study, the optimal position of dual cameras for mounting on a vehicle was determined [28]. The optimal mounting position was tested for three parameters: the mounting height, spacing, and angle of the camera. In addition, the test range was determined by checking the locations where physical mounting is possible and whether vehicles and lanes are detected when each variable is changed. In addition, after mounting the dual camera on the actual vehicle, we used an experimental method to calculate the precision of the distance while changing each variable on the road. As a result, the highest precision was achieved at height 40 cm, baseline 30 cm, and angle 12°, so this position was determined as the optimal mounting position.
Moreover, image and focal length correction and lane detection methods using these dual cameras were developed. These already existing parameters and algorithms are used as basis for the development of the equation proposed in this study. Specifically, this section proposes a formula for calculating the distance from the front wheel to the lane using the relationship between the vehicle and road, as determined based on images acquired by dual cameras.

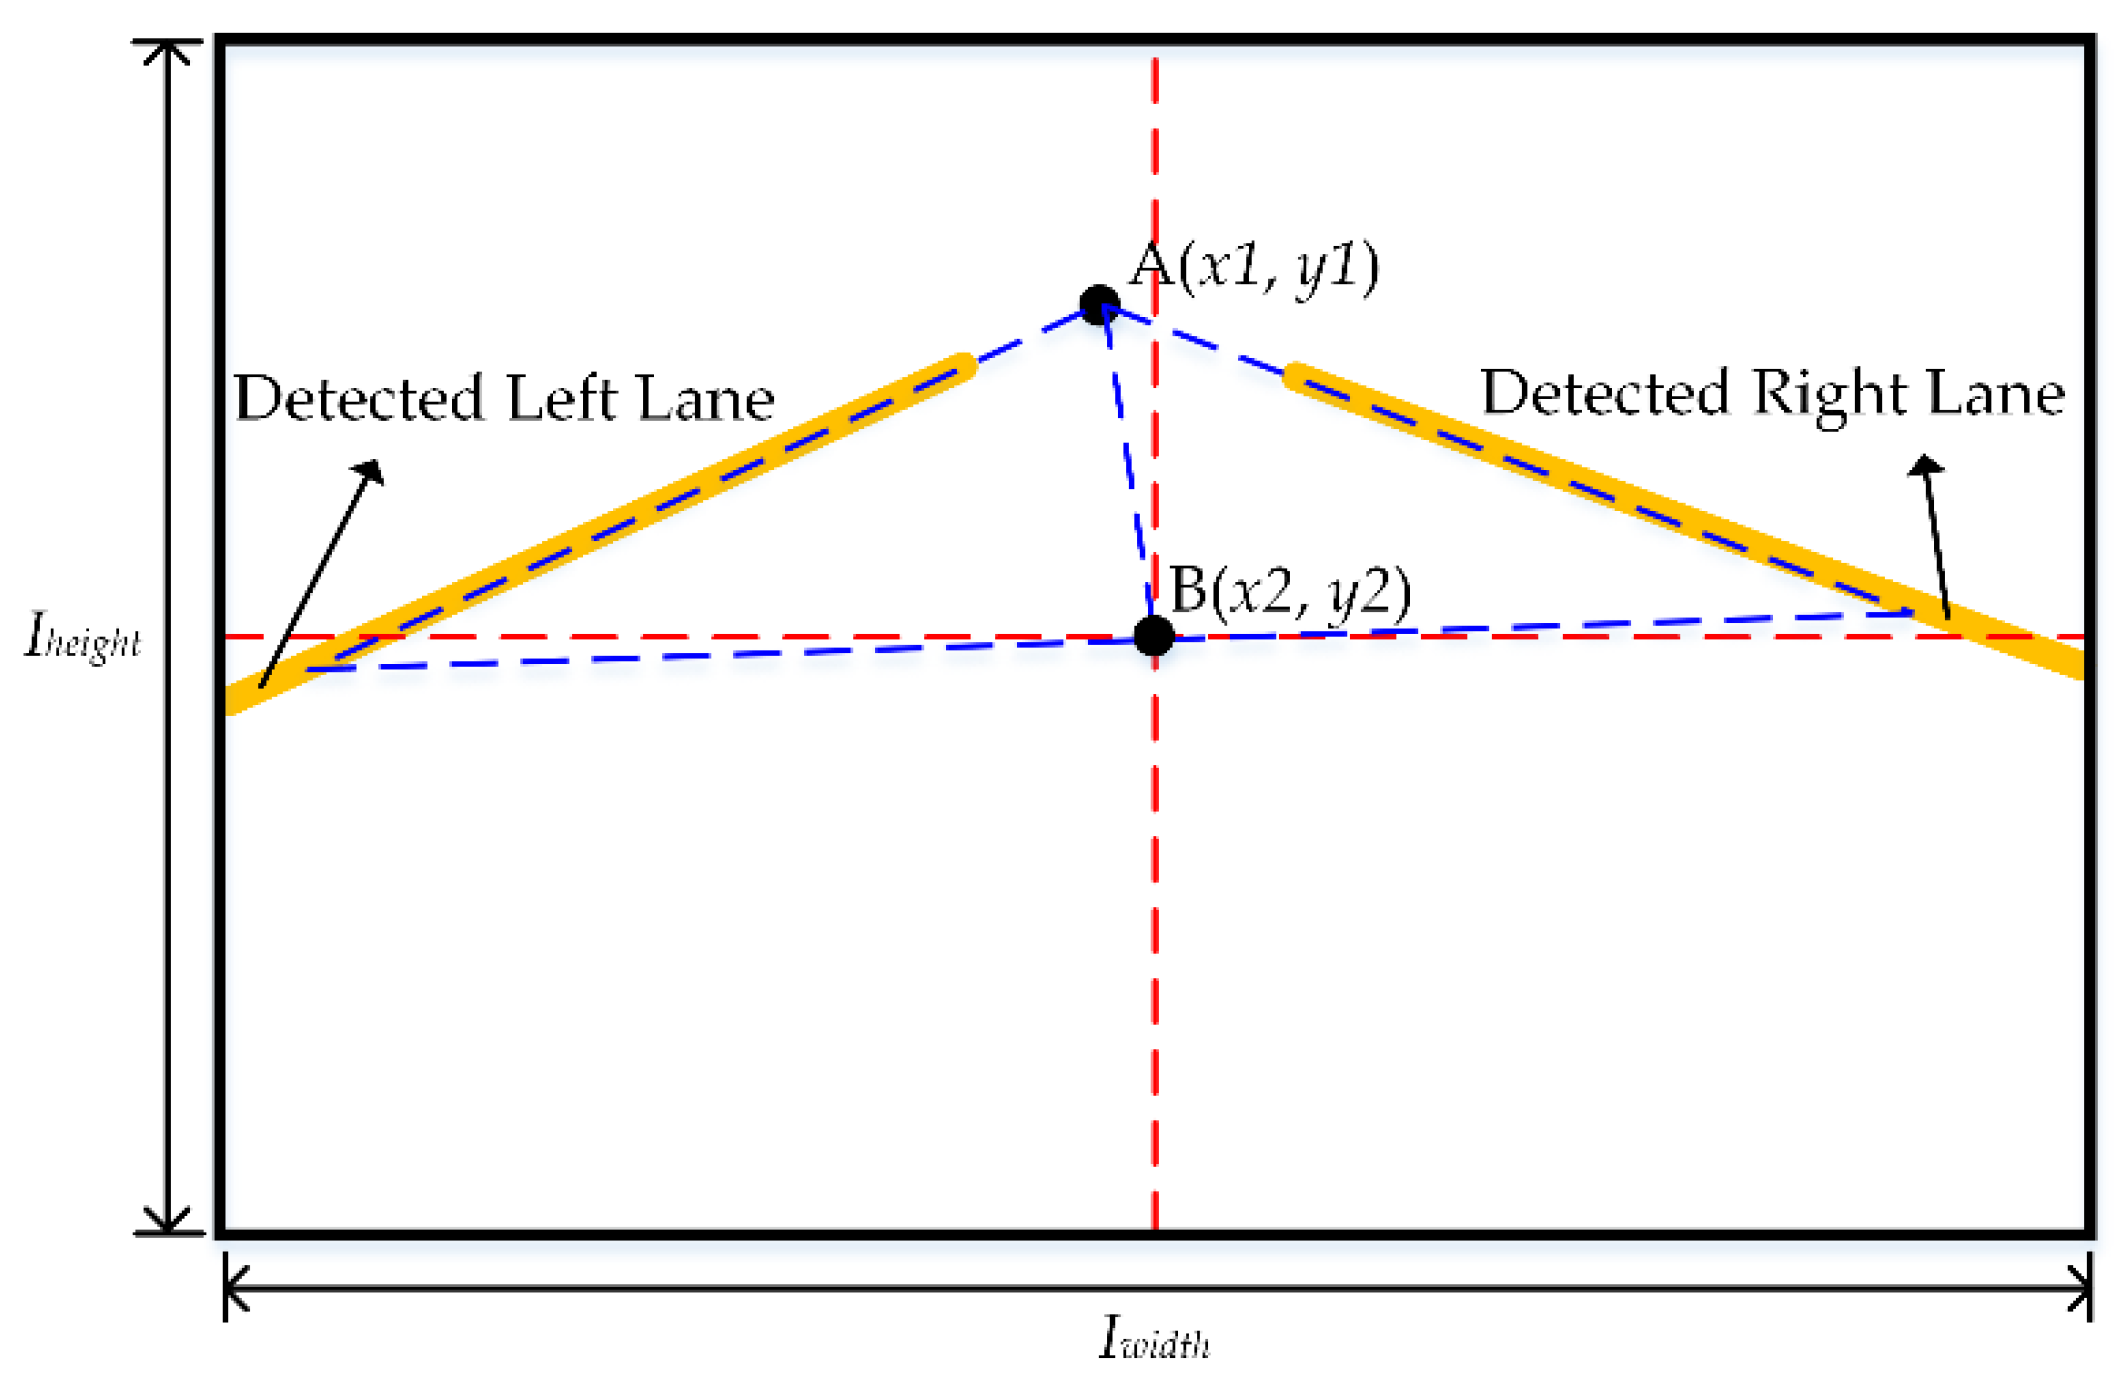
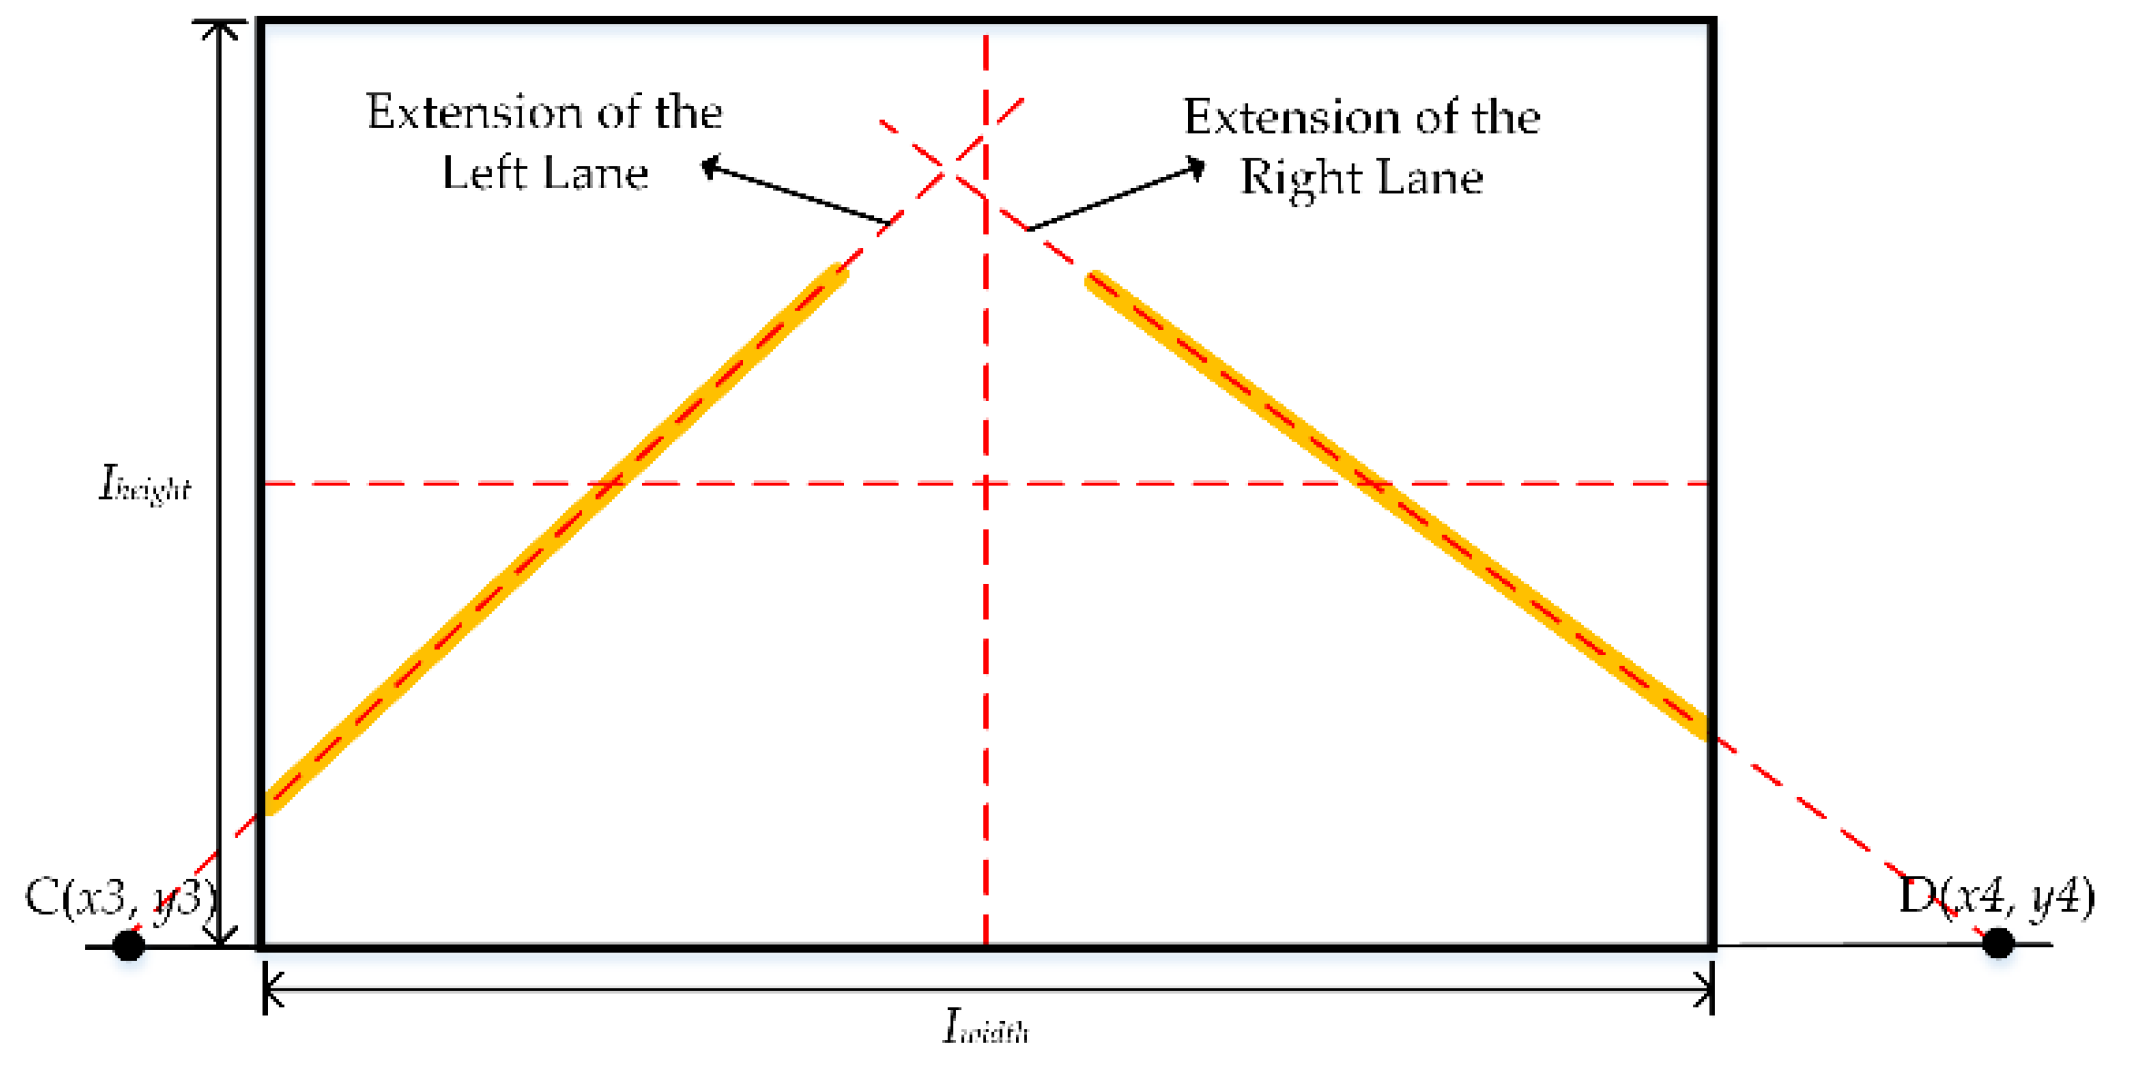
2.2. Variables of Camera Image

To define the variables, it is assumed that the width of the image (Iwidth), height of the image (Iheight), and focal length of the camera (f) used for lane detection are constant, and that the specifications of the vehicle and camera used are known.
The vanishing point and center point required for calculation can be obtained using the lane detected through the lane detection algorithm. Figure 1 shows the detected right and left lanes extended above the image, with which the coordinates of the vanishing point A(x1, y1) and the coordinates of the center point B(x2, y2) can be obtained.
In addition, based on a curve equation corresponding to the detected lanes, the coordinates of points with respect to a specific y-coordinate of the image can be obtained. Figure 2 shows the equations for the detected left and right lane curves extended to the bottom of the image. As a result, when the y-coordinate is equal to Iheight, the coordinates of point C(x3, y3) of the extension line of the left lane and of point D(x4, y4) of the extension line of the right lane can be obtained.

2.3. Geometrical Variables of Vehicle

Figure 3 shows the geometric composition of the dual cameras installed in the vehicle when viewed from the side. Given the installation angle (α), installation height (h), and vertical field of view (θv) of the dual cameras, the shortest distance from the ground (dg) that can be detected in the image can be obtained.
Figure 4 shows the geometric composition between the vehicle and lane when the vehicle is being driven on the road. Variables relevant to vehicle and camera specifications include the length from the front of the vehicle to the center of the front wheel (Cwh), overall width of the vehicle (Cw), baseline of the dual cameras (b), and horizontal field of view (θh). Variables relevant to the camera image include the width of the lane (Lw), distance from the optical axis of the camera to the left lane (Llw), and heading angle of the vehicle (ψ). Based on the relationship of the proposed variables, an equation for calculating the distance from the left front wheel of the vehicle to the left lane (dleft) is derived. The reference point for calculating the distance to the lane was set as the part where the center of the wheel contacts the ground to minimize steering errors.

2.4. Formulation

With the variables defined in Figure 1, the heading angle (ψ) can be derived as shown in Equation (1).
ψ = a tan ( x 1 x 2 ( y 1 y 2 ) 2 + f 2 )
With the variables defined in Figure 2, the distance from the front-left wheel to the left lane (Llw) can be derived as shown in Equation (2).
L l w = x 3 I w i d t h 2 x 4 x 3 × L w
With the variables defined in Figure 3, the shortest distance from the ground (dg) that can be detected in the image can be derived as shown in Equation (3).
d g = h × tan ( 90 α θ v 2 )
With the variables defined in Figure 4, the distance from the left front wheel of the vehicle to the left lane (dleft) can be derived as in Equations (4)–(6).
d l l = ( L l w C w b 2 ( d g + C w h ) tan ψ ) cos ψ
d l r = ( L l w C w + b 2 ( d g + C w h ) tan ψ ) cos ψ
d l e f t = d l l + d l r 2
The proposed theoretical equations can be tested and evaluated using only the left or right camera, depending on the user’s needs. However, it includes the process of calculating the lane distance between the left and right cameras constituting the dual camera and averaging the results. It can reduce the error compared to the conventional monocular camera. In addition, the test evaluation method using the dual camera can use the lateral distance calculation formula proposed in this study and the longitudinal distance calculation formula proposed in the previous study in [28] without changing the physical configuration.

3. Actual Vehicle Test

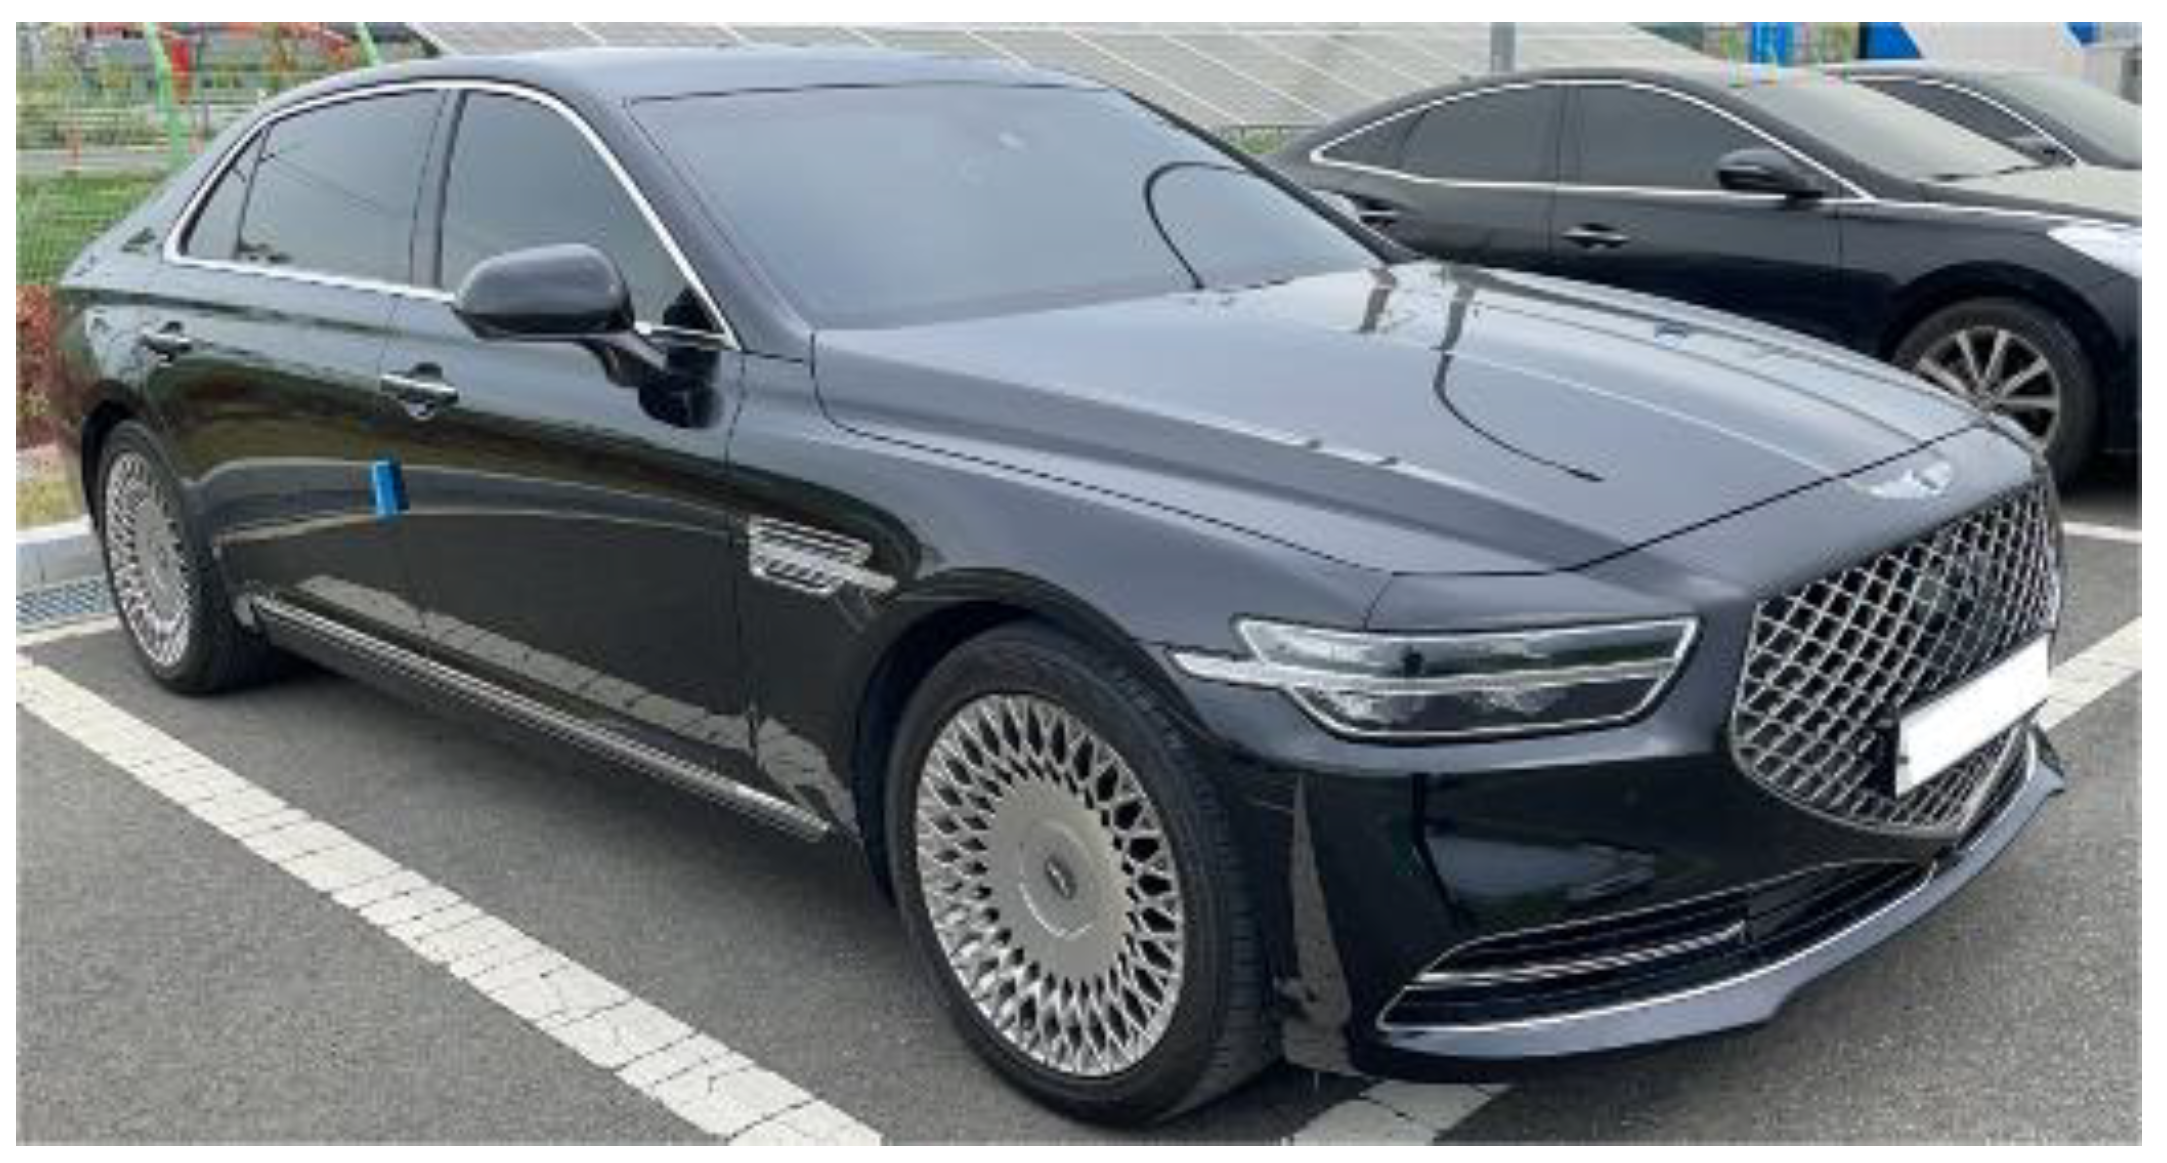
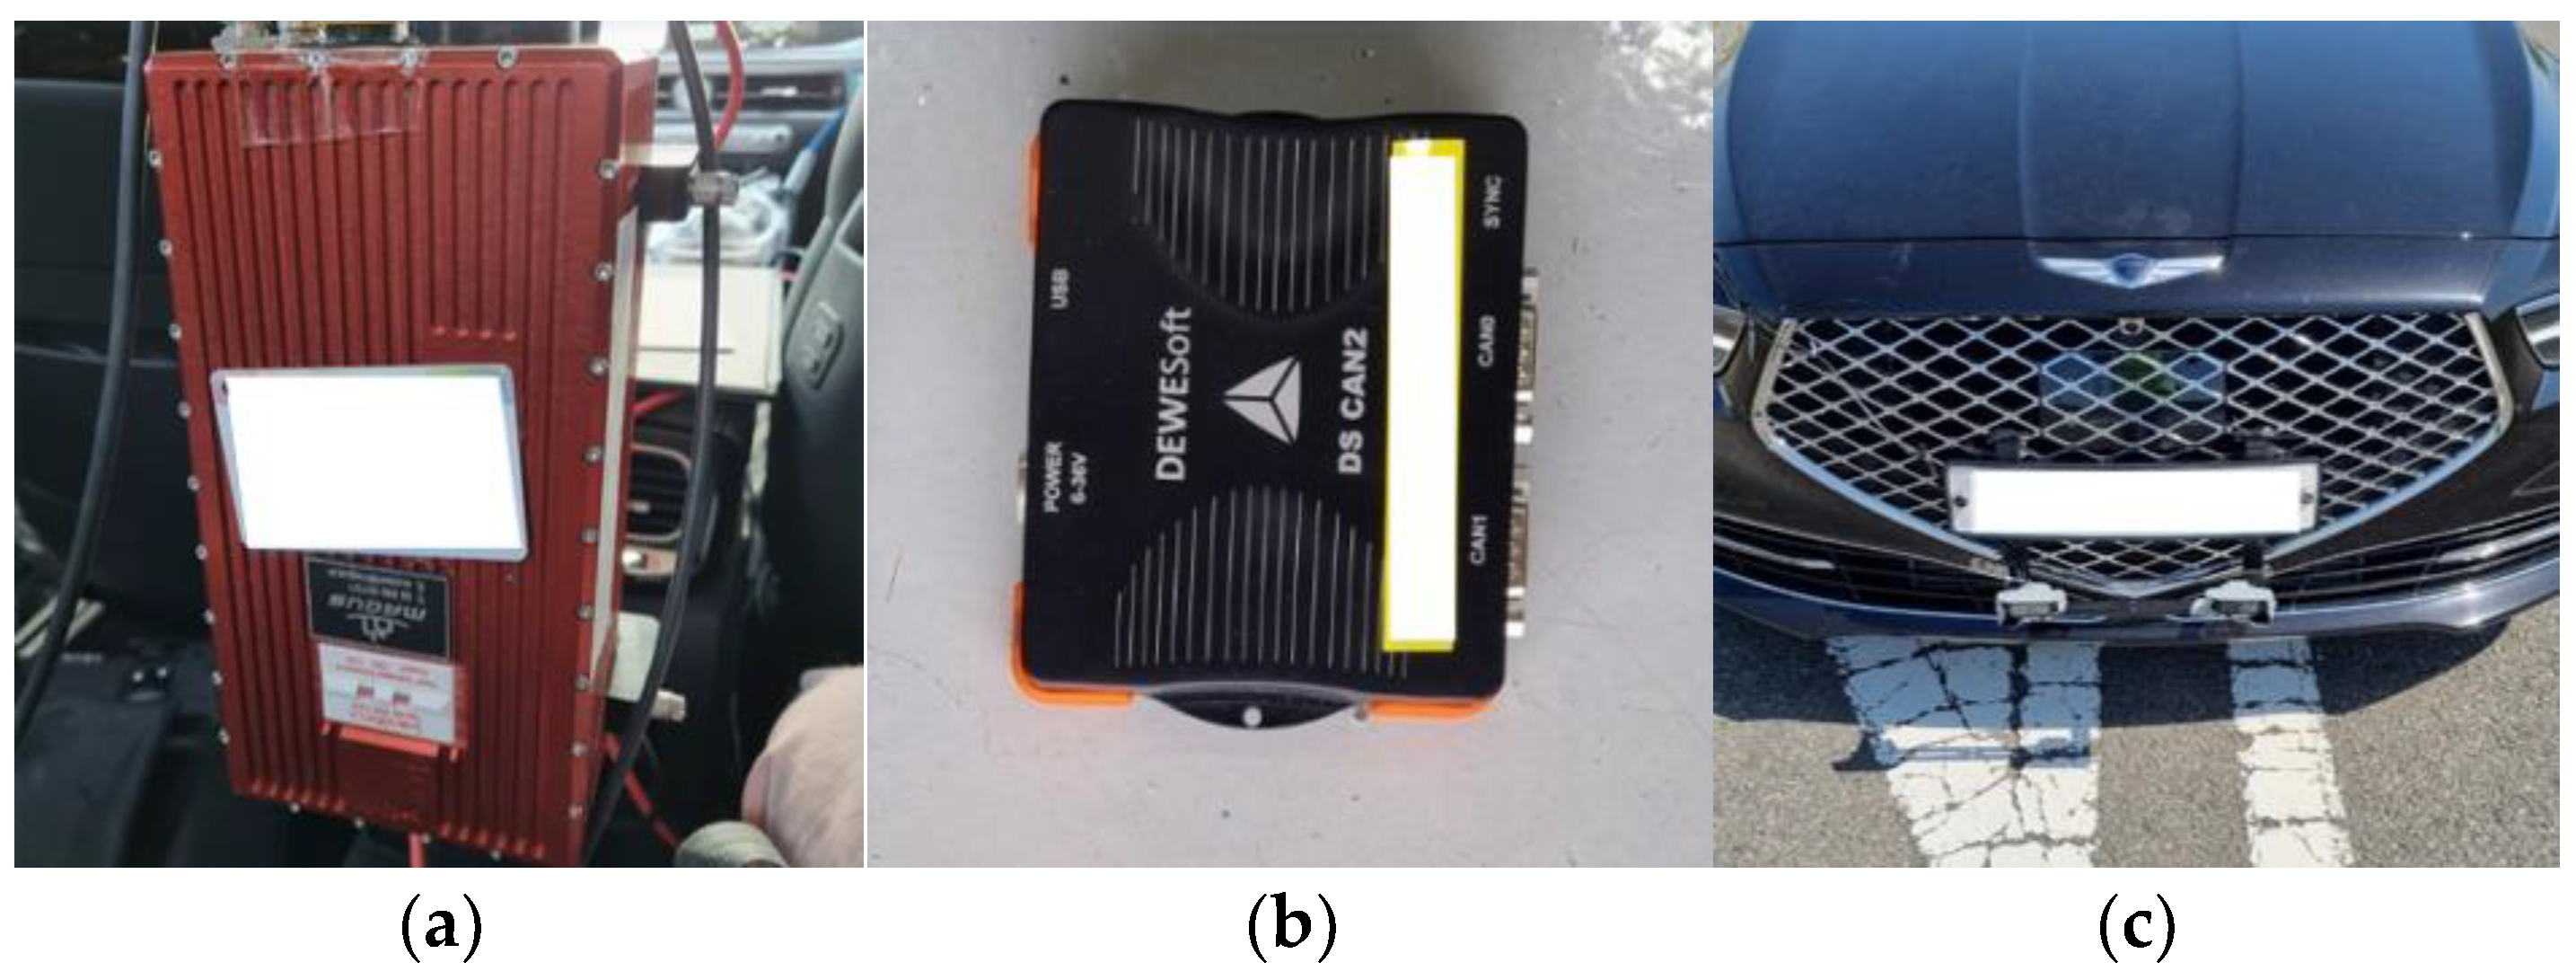
3.1. Test Vehicle and Equipment

This section describes the actual vehicle test conditions conducted to verify the proposed equation. Figure 5 shows the vehicle, a Genesis G90 model, used in the actual vehicle test. The vehicle is equipped with ADAS functions, such as the LKAS. The specifications of the vehicle are listed in Table 1.
In the actual vehicle test, the images required for the theoretical calculation were obtained using the dual cameras installed on the front of the vehicle, whereas the actual value for verification was obtained using the camera installed on the side of the vehicle. Figure 6 shows the equipment used in the test to measure and record data on the dynamic characteristics of the vehicle. The specifications of the equipment are listed in Table 2.

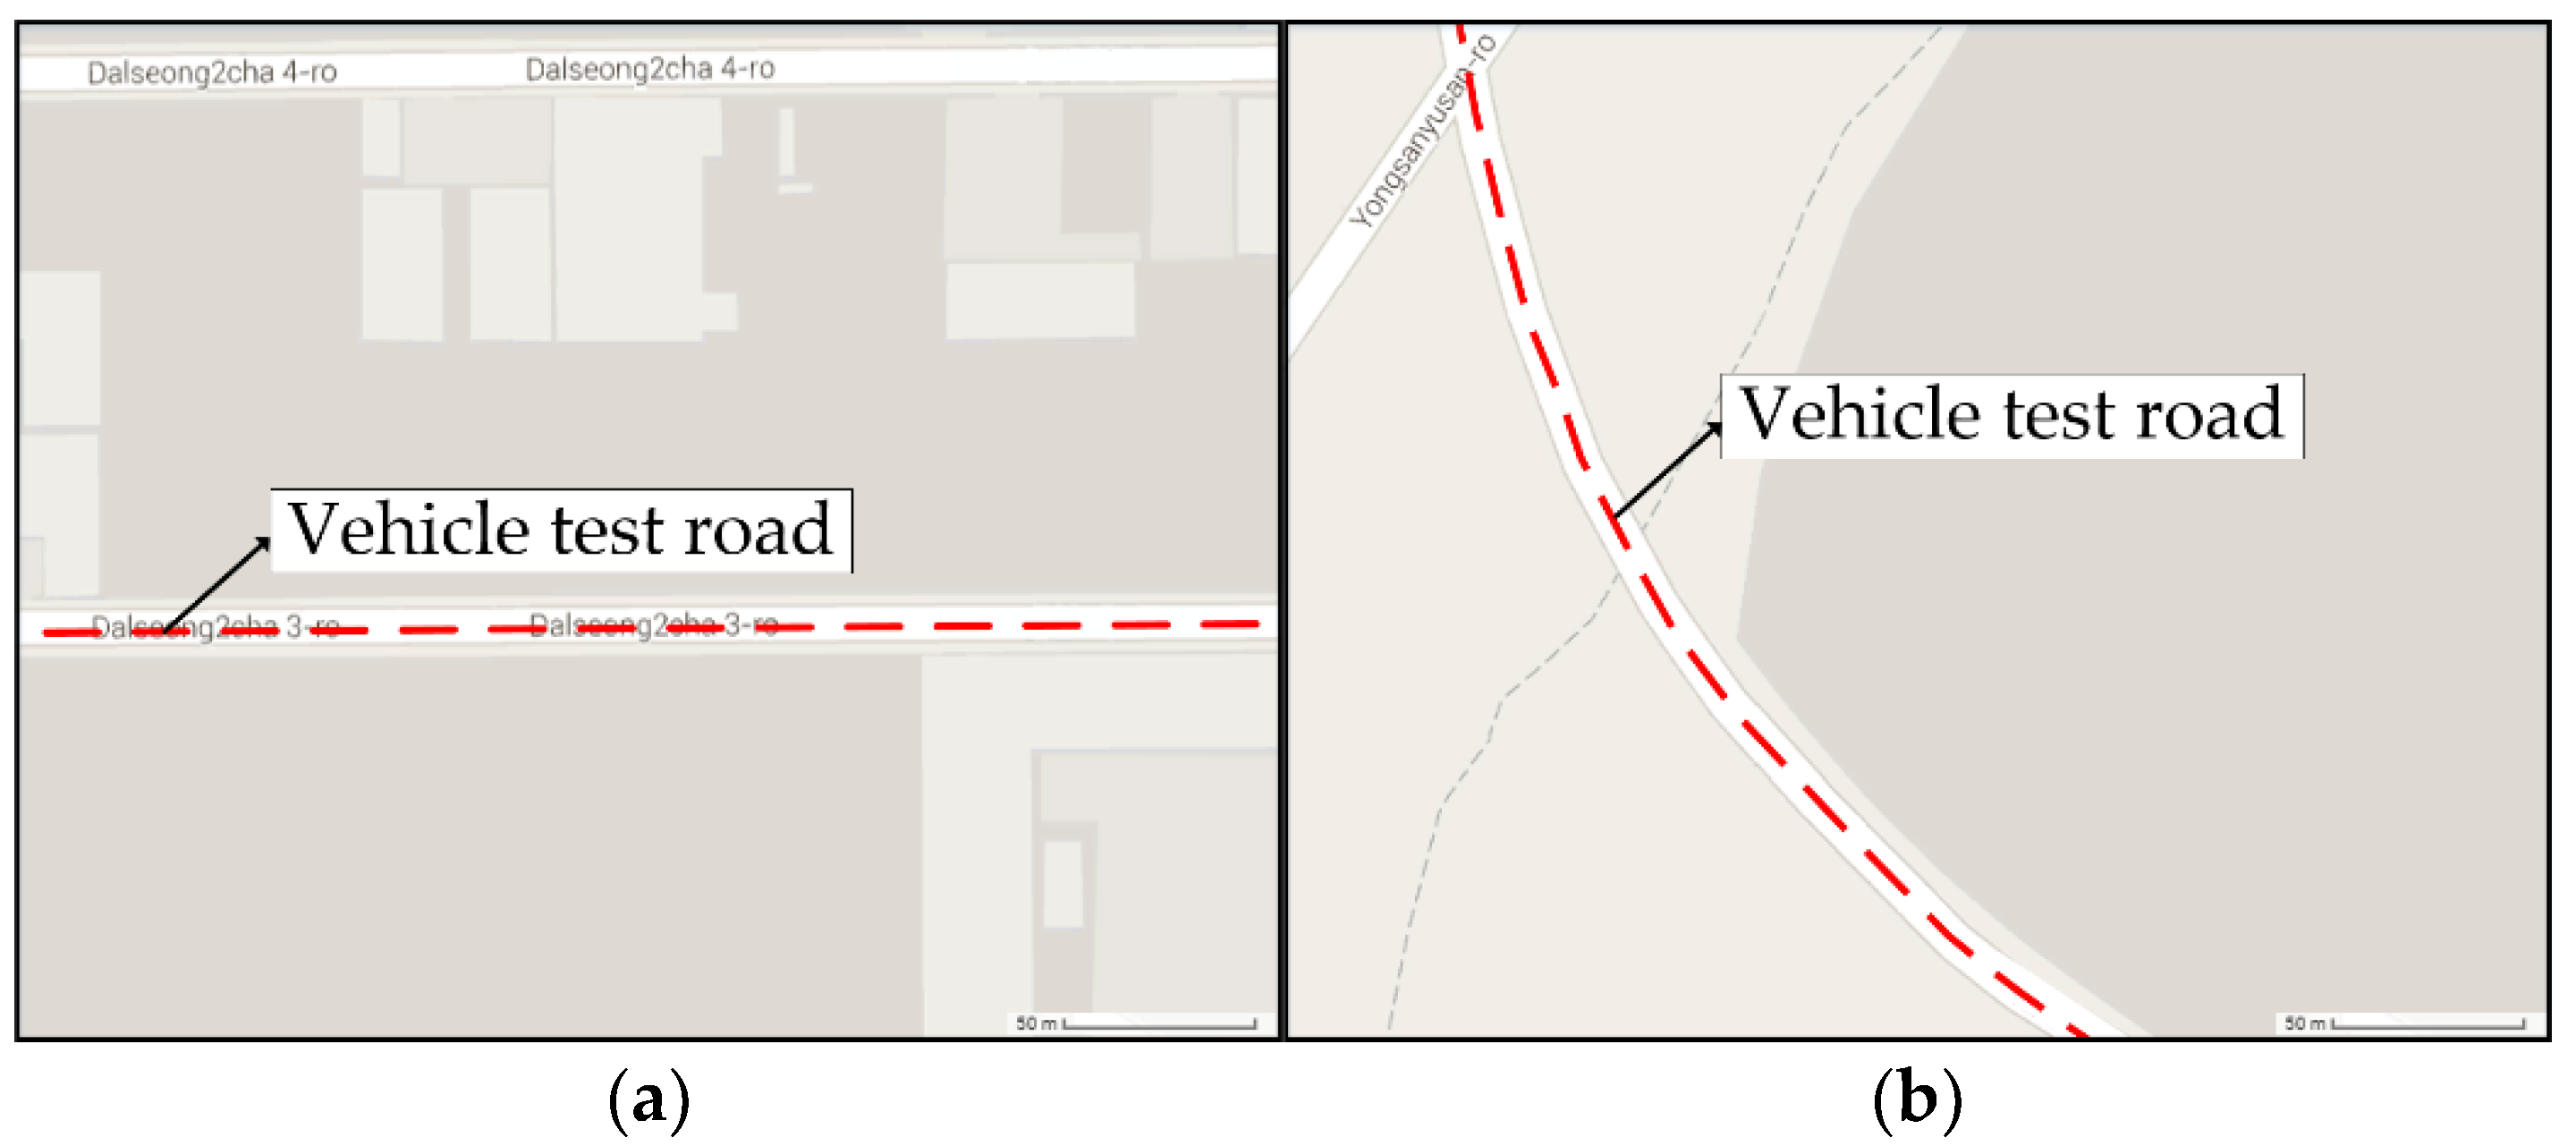
3.2. Vehicle Test Conditions and Location

Figure 7 shows the safety evaluation scenario of the LKAS on an actual road, as proposed by Yoon et al. [30]. The scenario considered the LKAS test procedure standard ISO11270 and the domestic road environment. In addition, a scenario considered complex factors such as the theoretical evaluation equation proposed based on Saïd Mammar’s theoretical equation, domestic road environment, curvature radius, steering angle, and lane departure, and finally evaluates the LKAS function. This study proposed a theoretical equation for the LKAS safety evaluation, and the scenario was used because the actual test for verification was conducted on domestic general roads.
In each scenario, after confirmation that the LKAS of the vehicle operates normally, a heading angle or steering angle is artificially assigned. The functionality of the vehicle to return to its original driving lane when it attempts to depart from its driving lane is then evaluated. In the entire test scenario, the velocity of the test vehicle remains constant at 60 km/h. This condition was determined in consideration of the fact that almost all vehicles, including the G90, have an operating velocity of 60 km/h or more and a legal velocity limit of 60 km/h on general roads in Korea. In addition, the key point of ISO11270 is to determine both the vehicle stays in the lane and returns after leaving the road when entering the road while maintaining a constant velocity. Therefore, we decided that there was no problem in proceeding with the scenario only at 60 km/h. Scenario 1, shown in Figure 7a, assigns an initial heading angle of 3° to a vehicle traveling at a velocity of 60 km/h on a straight road. Scenario 2, shown in Figure 7b, assigns an initial heading angle of 3° and an additional steering angle of 2° to a vehicle traveling at a velocity of 60 km/h on a straight road. Scenario 3, shown in Figure 7c, assigns an initial heading angle of 3° to a vehicle traveling at a velocity of 60 km/h on a curved road. Scenario 4, as shown in Figure 7d, assigns an initial heading angle of 3° and an additional steering angle of 2° to a vehicle traveling at a velocity of 60 km/h on a curved road.
Figure 8a shows a straight road on Guji-myeon, Dalseong-gun, Daegu, where the tests were conducted, with coordinates 35.636047° N, 128.420734° E. Figure 8b shows a curved road on Daehap-myeon, Changnyeong-gun, Gyeongsangnam-do, where further tests were conducted, with coordinates 35.624108° N, 128.432737° E. Table 3 lists the conditions of the roads on which the tests were conducted.
To obtain objective data from the tests, the test scenarios were repeated. More specifically, for each scenario, the test equipment, personnel, and location were maintained constant, and the testing was performed three times.

4. Actual Vehicle Test Results

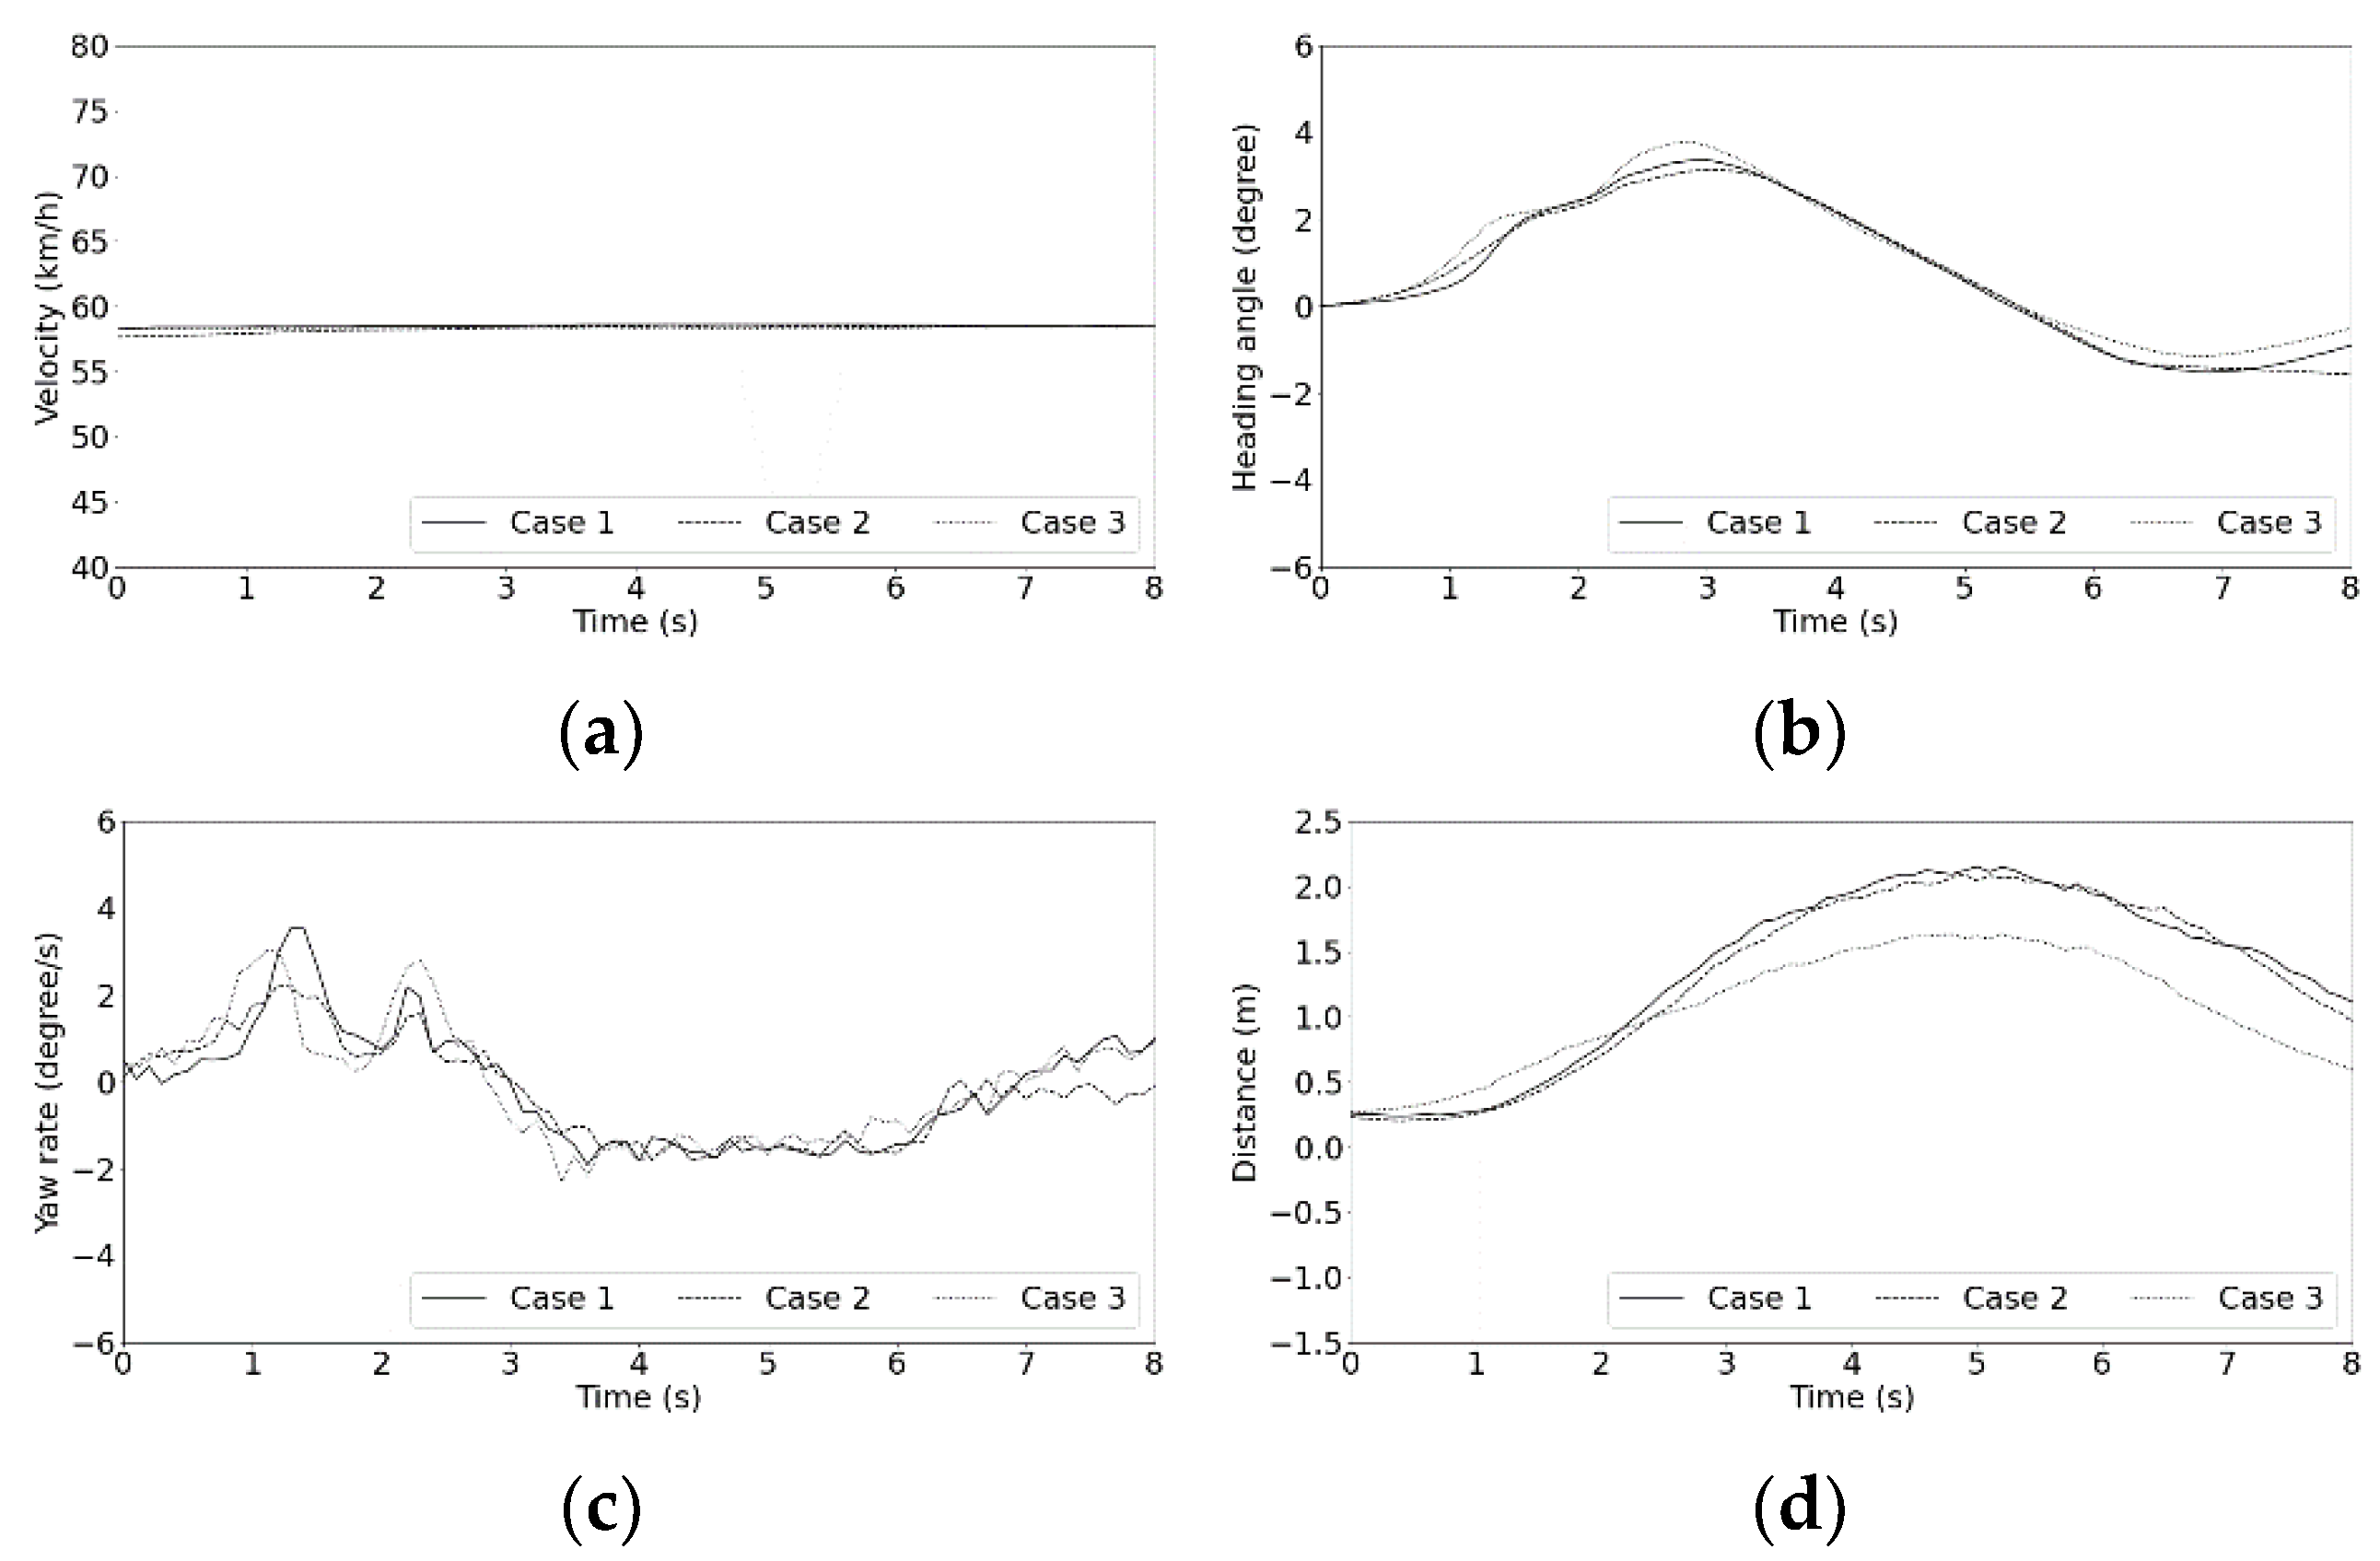
4.1. Measured Vehicle Test Data

The test results were obtained for when the vehicle started to depart from the lane until the vehicle returned to the lane. The duration of this process was 8 s. Figure 9, Figure 10, Figure 11 and Figure 12 show the measurement results for vehicle velocity, heading angle, yaw rate, and distance to the left lane for each of the scenarios.
Figure 9 shows the test results for Scenario 1, where the vehicle deviated from the straight road to the left lane. Figure 9a shows that the velocity is kept constant at 60 km/h. In Figure 9b, it can be confirmed that the experiment was conducted on a straight road through the convergence of the heading angle to 0°. In addition, it can be confirmed that the change caused by the artificially assigned heading angle converges again when lane return is completed. In Figure 9c, it can be seen that the heading angle is artificially given at 1 s. Figure 9d is the distance from the front wheel to the left lane, and shows the value until the vehicle departs from the left lane returns to the driving lane. As a result, it can be judged that the three cases in Scenario 1 have a similar tendency, and that the repeated experiment to obtain reliability has been performed normally. On average, the heading angle was obtained in approximately 0.5 s, and the vehicle returned to its driving lane in approximately 6 s.
Figure 10 shows the test results for Scenario 2, where the vehicle deviated from the straight road to the right lane. Figure 10a shows that the velocity is kept constant at 60 km/h. In Figure 10b, it can be confirmed that the experiment was conducted on a straight road through the convergence of the heading angle to 0°. In addition, in cases 1 and 3, it was confirmed that the heading angle converges as the lane return is completed. In case 2, the final value of the heading angle shows a value of −1.5°, which is a result of the vehicle approaching the left lane after returning to the driving lane. In Figure 10c, it can be seen that the heading angle was artificially given at 1 and 2 s, respectively. Figure 10d is the distance from the front wheel to the left lane, and shows the results until the vehicle departing from the right lane returns to the driving lane. Case 3 has a similar tendency to other cases, but the degree of deviation from the lane is small. The reason is thought to be that the lane was recognized more quickly because there were no shadows on the road at the time of the experiment. As a result, it can be judged that the three cases in Scenario 2 have a similar tendency, and that the repeated experiment to obtain reliability has been performed normally. On average, the heading angle was obtained in approximately 1 s, and the vehicle returned to its driving lane in approximately 7 s.
Figure 11 shows the test results for Scenario 3, where the vehicle deviated from the left-turn curve to the right lane. In Figure 11a, case 1 has a higher velocity than other cases due to the initial acceleration, but all three cases finally converge to 60 km/h. In Figure 11b, it can be confirmed that the experiment was conducted on a curved road through constant change except for the 2.5 s point where the heading angle was given. In Figure 11c, it can be seen that the heading angle was artificially given at 2.5 s. Figure 11d is the distance from the front wheel to the left lane, and shows the results until the vehicle departing from the right lane returns to the driving lane. As a result, it can be concluded that three cases of Scenario 3 have a similar tendency, and that the repeated experiment to obtain reliability has been performed normally. On average, the heading angle was obtained in approximately 1.5 s, and the vehicle returned to its driving lane in approximately 6 s.
Figure 12 shows the test results for Scenario 4, where the vehicle deviated from the right-hand curve to the right lane. Figure 12a shows that the velocity is kept constant at 60 km/h. In Figure 12b, it can be confirmed that the experiment was conducted on a curved road through constant changes except for the point around 4 s where the heading angle was given. In Figure 12c, it can be seen that the heading angle was artificially given at 1.5 s and 3.5 s, respectively. Figure 12d is the distance from the front wheel to the left lane, and shows the results until the vehicle departing from the right lane returns to the driving lane. There is a difference in the initial value of the distance to the lane of the three cases, and case 2 and case 3, which have the largest difference, have a difference of 64 cm. However, as the experiment progresses, the values converge and show a similar trend. As a result, it can be concluded that the three cases in Scenario 4 have a similar tendency, and that the repeated experiment to obtain reliability has been performed normally. On average, the heading angle was obtained in approximately 1 s, and the vehicle returned to its driving lane in approximately 7 s.

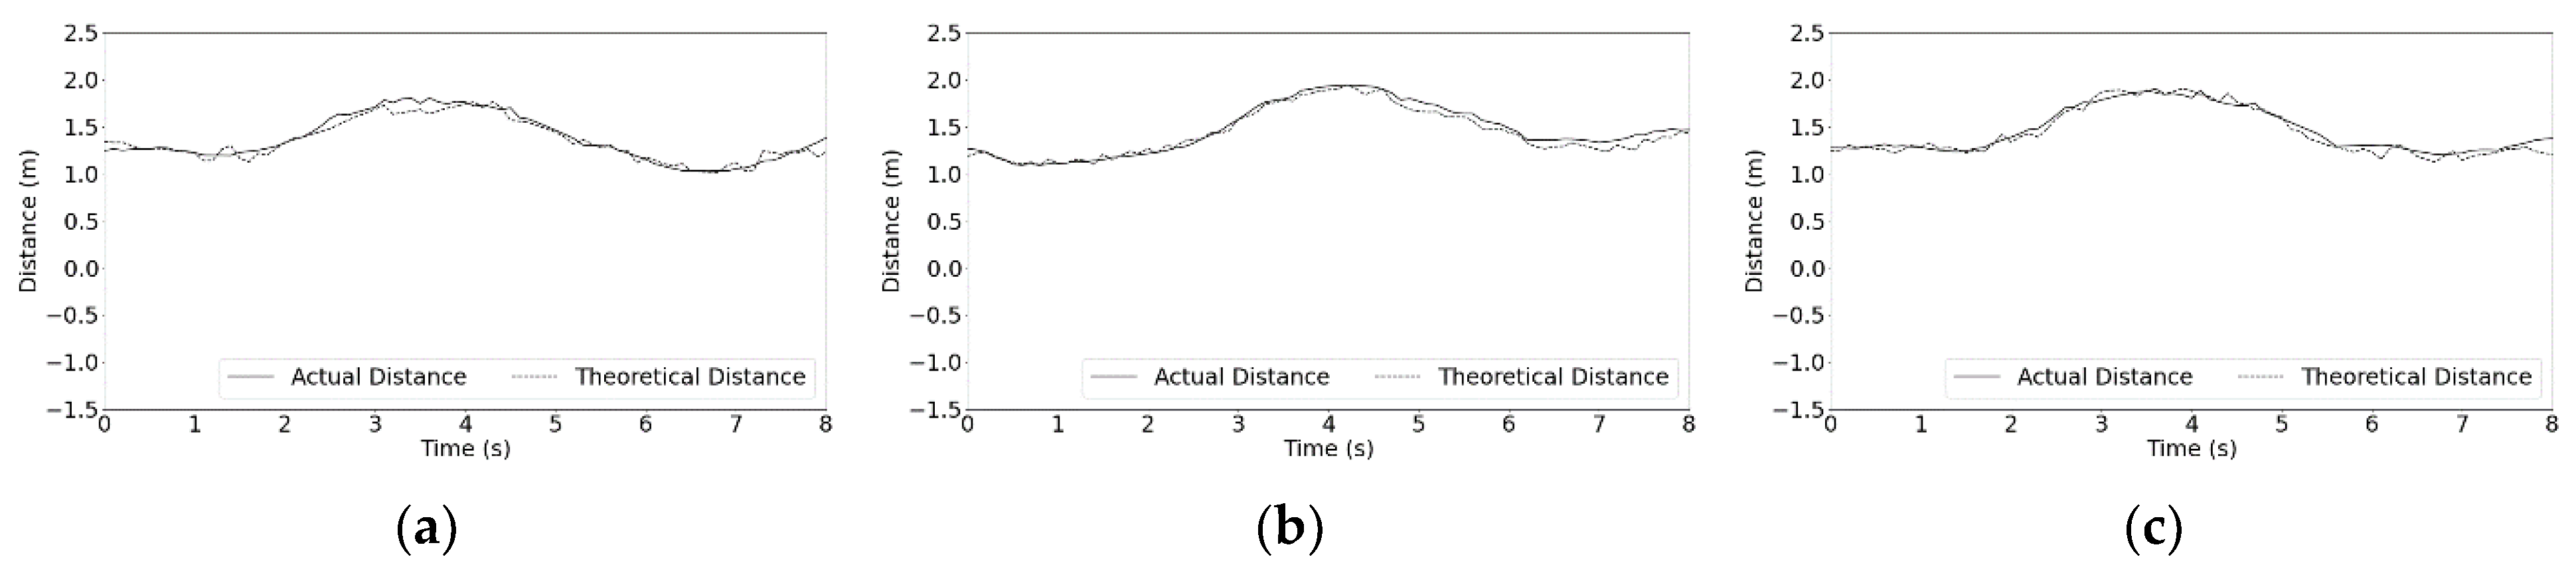
4.2. Comparative Analysis of Theoretical and Measured Values

In the actual vehicle test, the theoretical distance to the left lane was calculated using the dual cameras and the proposed equation. To verify the theoretical distance, the actual distance is required. Kim et al. [29] calculated the distance from the wheel to the lane using a side camera. This method was tested until the maximum value of the vehicle velocity was 110 km/h and the maximum value of the distance to the lane was 2 m. Since the maximum error was within 5 cm, it was judged that it could be used as an actual value for verification. Additionally, In the case of side cameras, depending on the installation location, only the lane can be photographed, and when leaving the driving lane, it is not possible to photograph the lane with only one. For that reason, two side cameras were installed on the left and right sides of the vehicle.
In the actual vehicle test, a camera was installed on the side of the vehicle so that the front wheel and vanishing line were captured by the camera. The physical distance was then mapped to the image. To increase the reliability of the actual distance for verification, the lane detection, and tracking algorithm was not used. Instead, we directly calculated the pixel corresponding to the lane and wheel positions.
Figure 13, Figure 14, Figure 15 and Figure 16 compare the theoretical and actual values of the distance to the lane obtained using the dual cameras for each of the scenarios. Table 4 lists the values for when the maximum error occurred for each scenario.
The maximum deviation for Scenario 1 occurred at 7.8 s, which was the return point for Case 1, with a value of −0.14 m. On the other hand, the maximum deviation for Scenario 2 occurred at 7.3 s, which was the return point for Case 1, with a value of −0.14 m. The deviation of the actual value from the theoretical value was inferred to increase during the process of vehicle stabilization after the vehicle returns to the driving lane.
The maximum deviation for Scenario 3 occurred at 3.6 s, which was the departure point for Case 1, with a value of −0.17 m. On the other hand, the maximum deviation for Scenario 4 occurred at 5.8 s, which was the departure point for Case 2, with a value of −0.15 m. The difference between the detected lane and actual lane was inferred to increase because of the difficulty of detecting the lane when a vehicle on a curved road deviates from its driving lane.

5. Conclusions

In this study, a theoretical equation for the safety evaluation of the LKAS using dual cameras was proposed, and an actual vehicle test was conducted for verification. The main contents of this study are summarized as follows.
  • Through the use of the optimal position of the dual cameras, image correction, focal length correction method, and lane detection algorithm proposed in a previous study, the values of the variables required by the theoretical equation were determined.
  • A theoretical equation for calculating the distance from the front wheel of the vehicle to the lane was proposed. For this method, the variables obtained from the image captured by the camera and the geometric composition of the vehicle on the road were used.
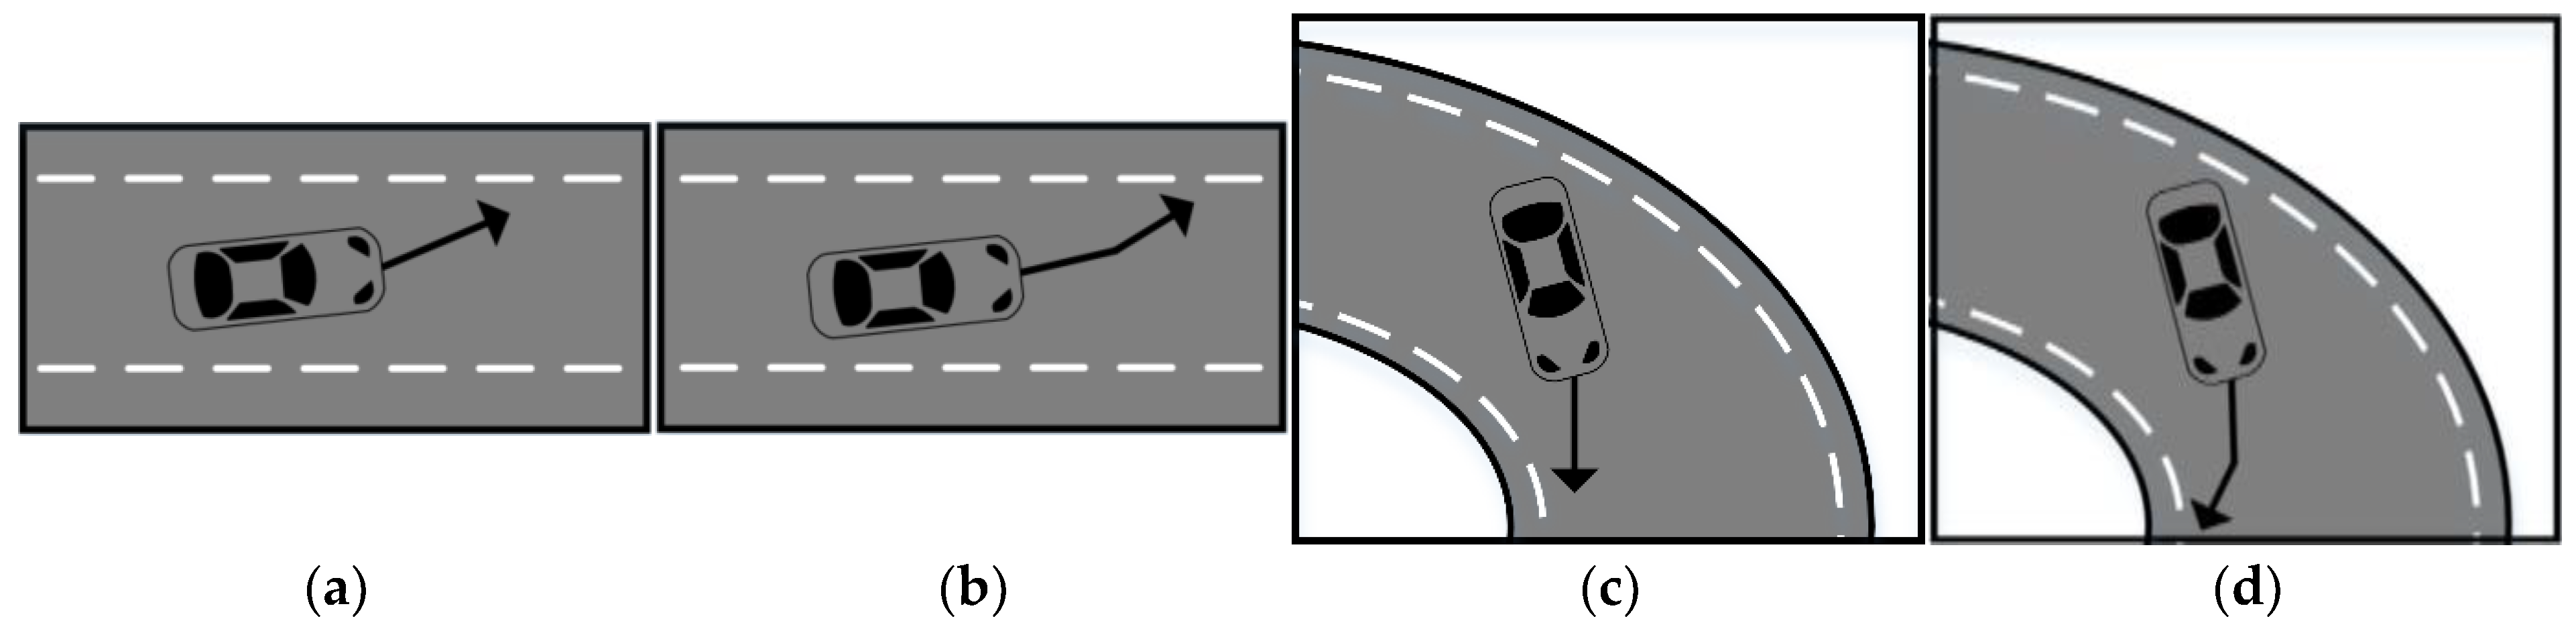
  • To verify the theoretical equation, tests were conducted based on four LKAS test-and-evaluation scenarios proposed in previous studies. For each scenario, the test was conducted three times under the same conditions to obtain objective data.
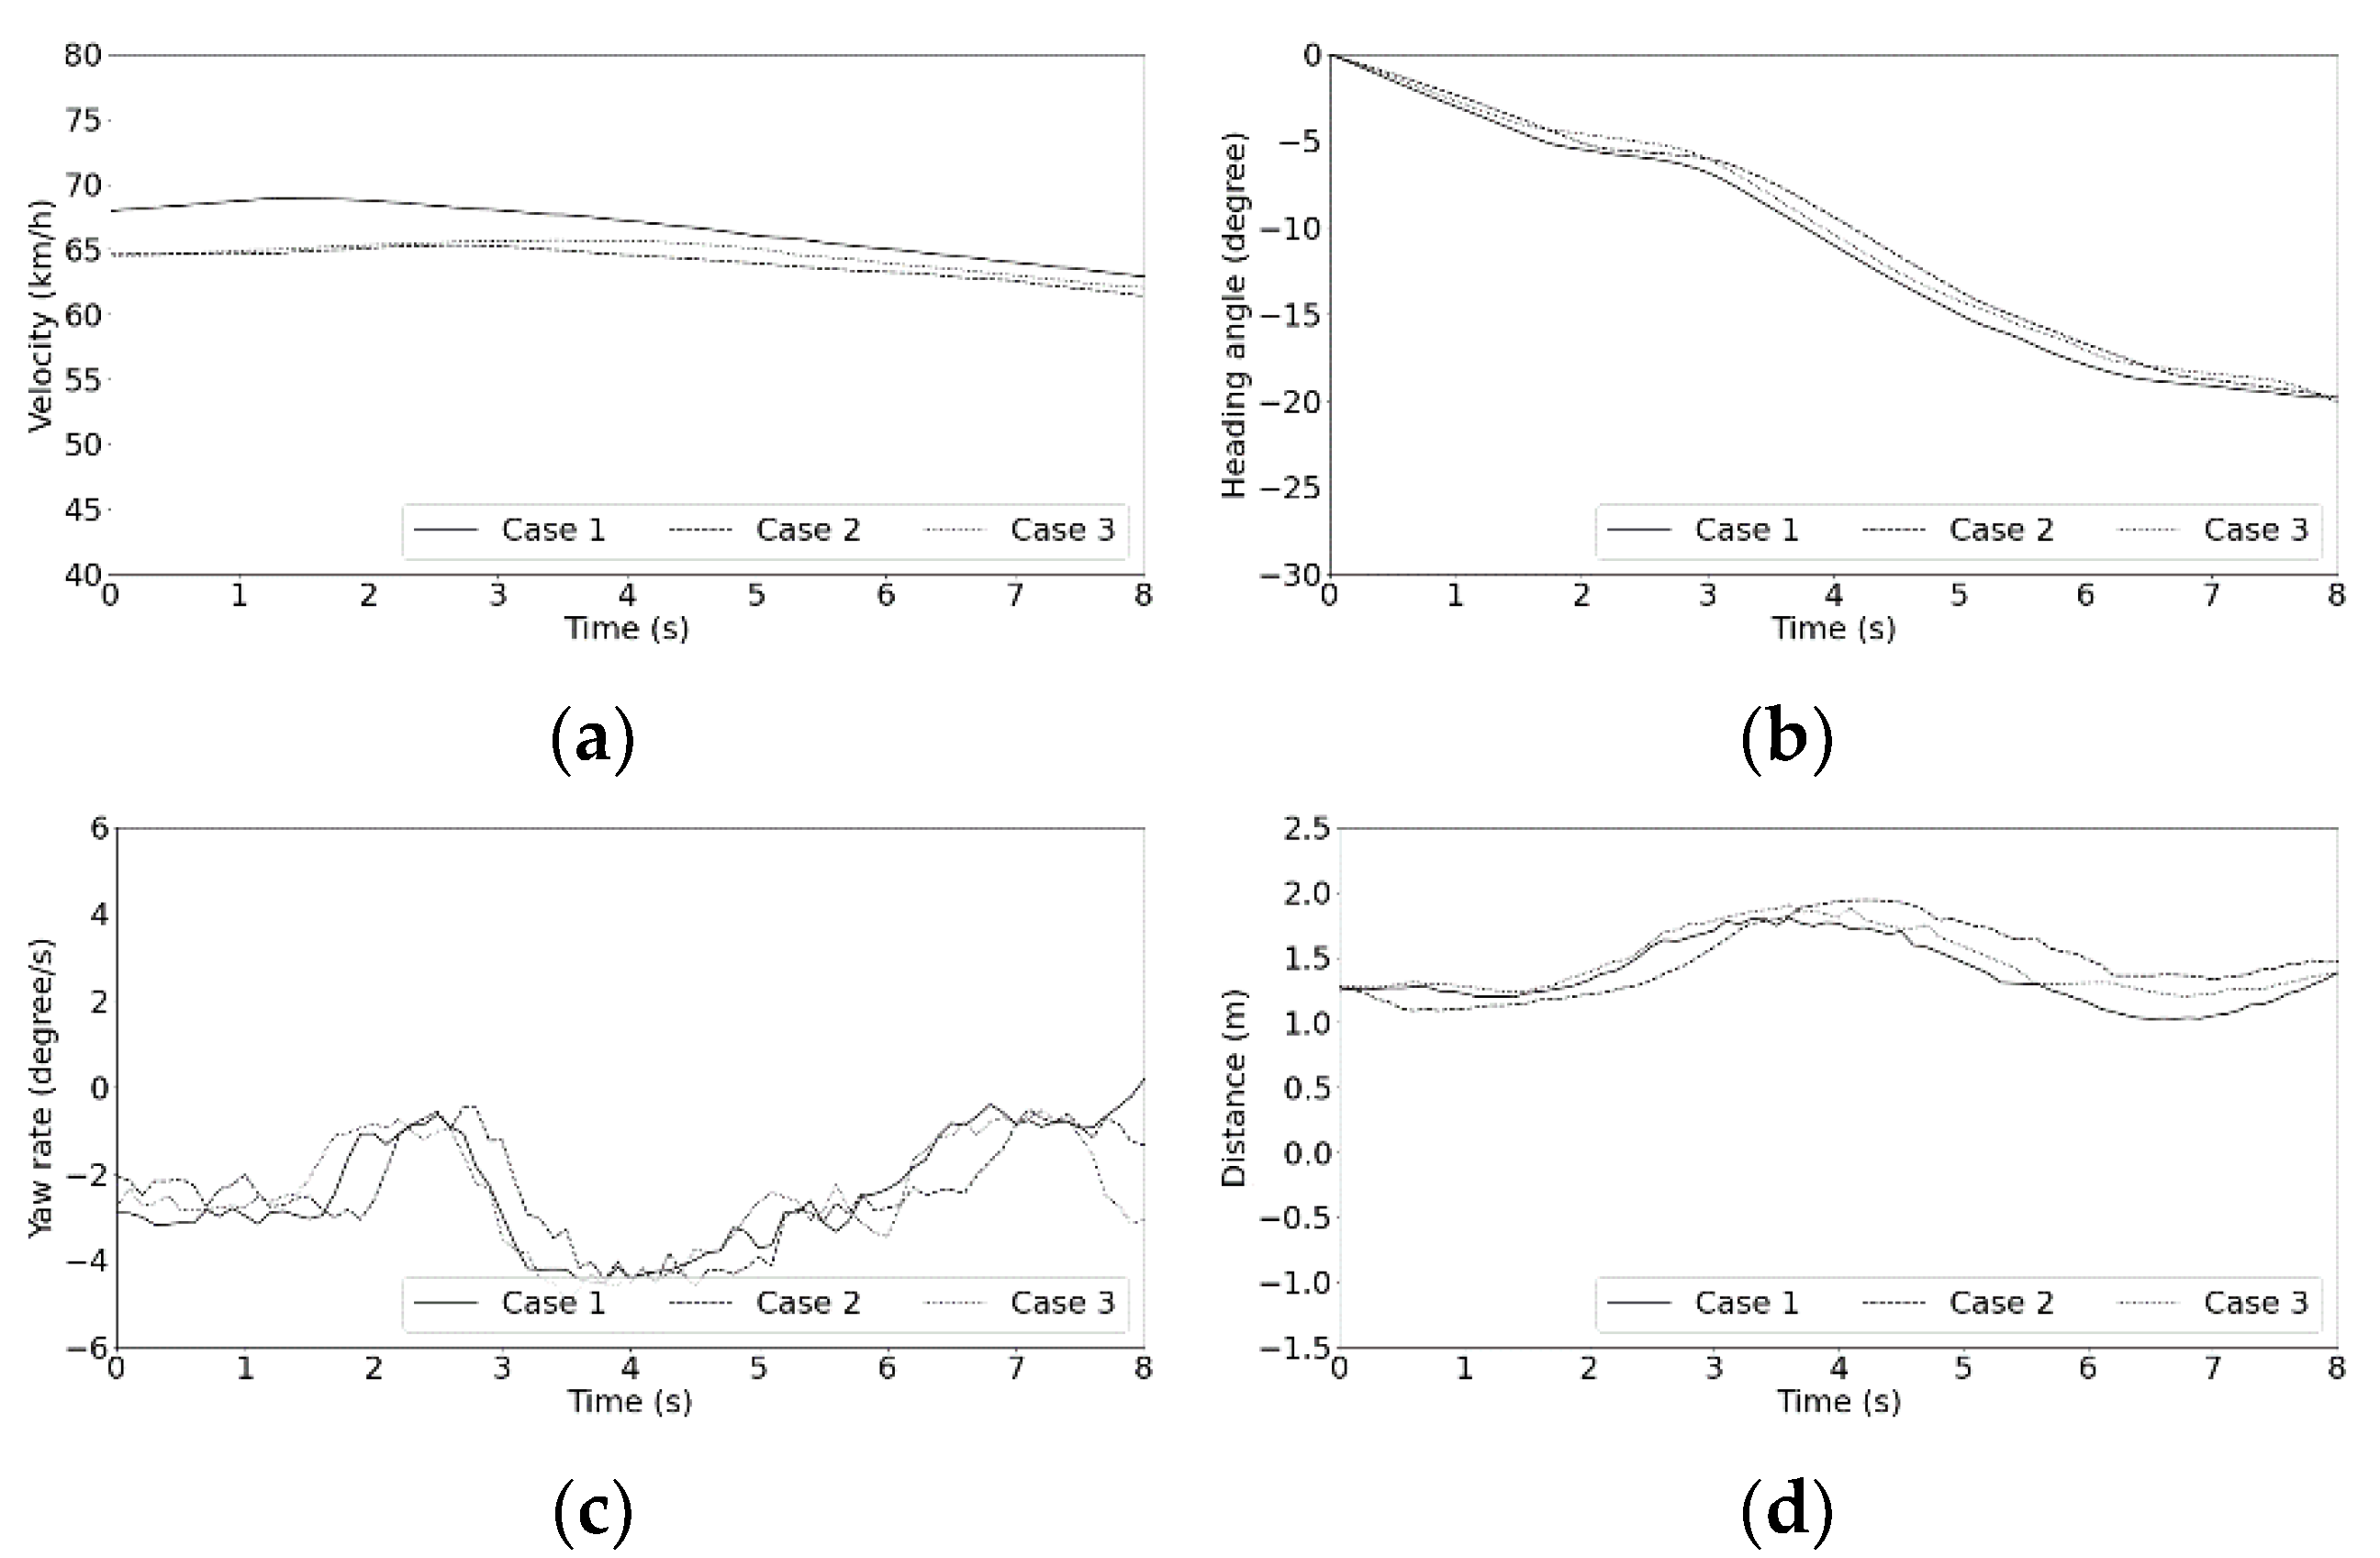
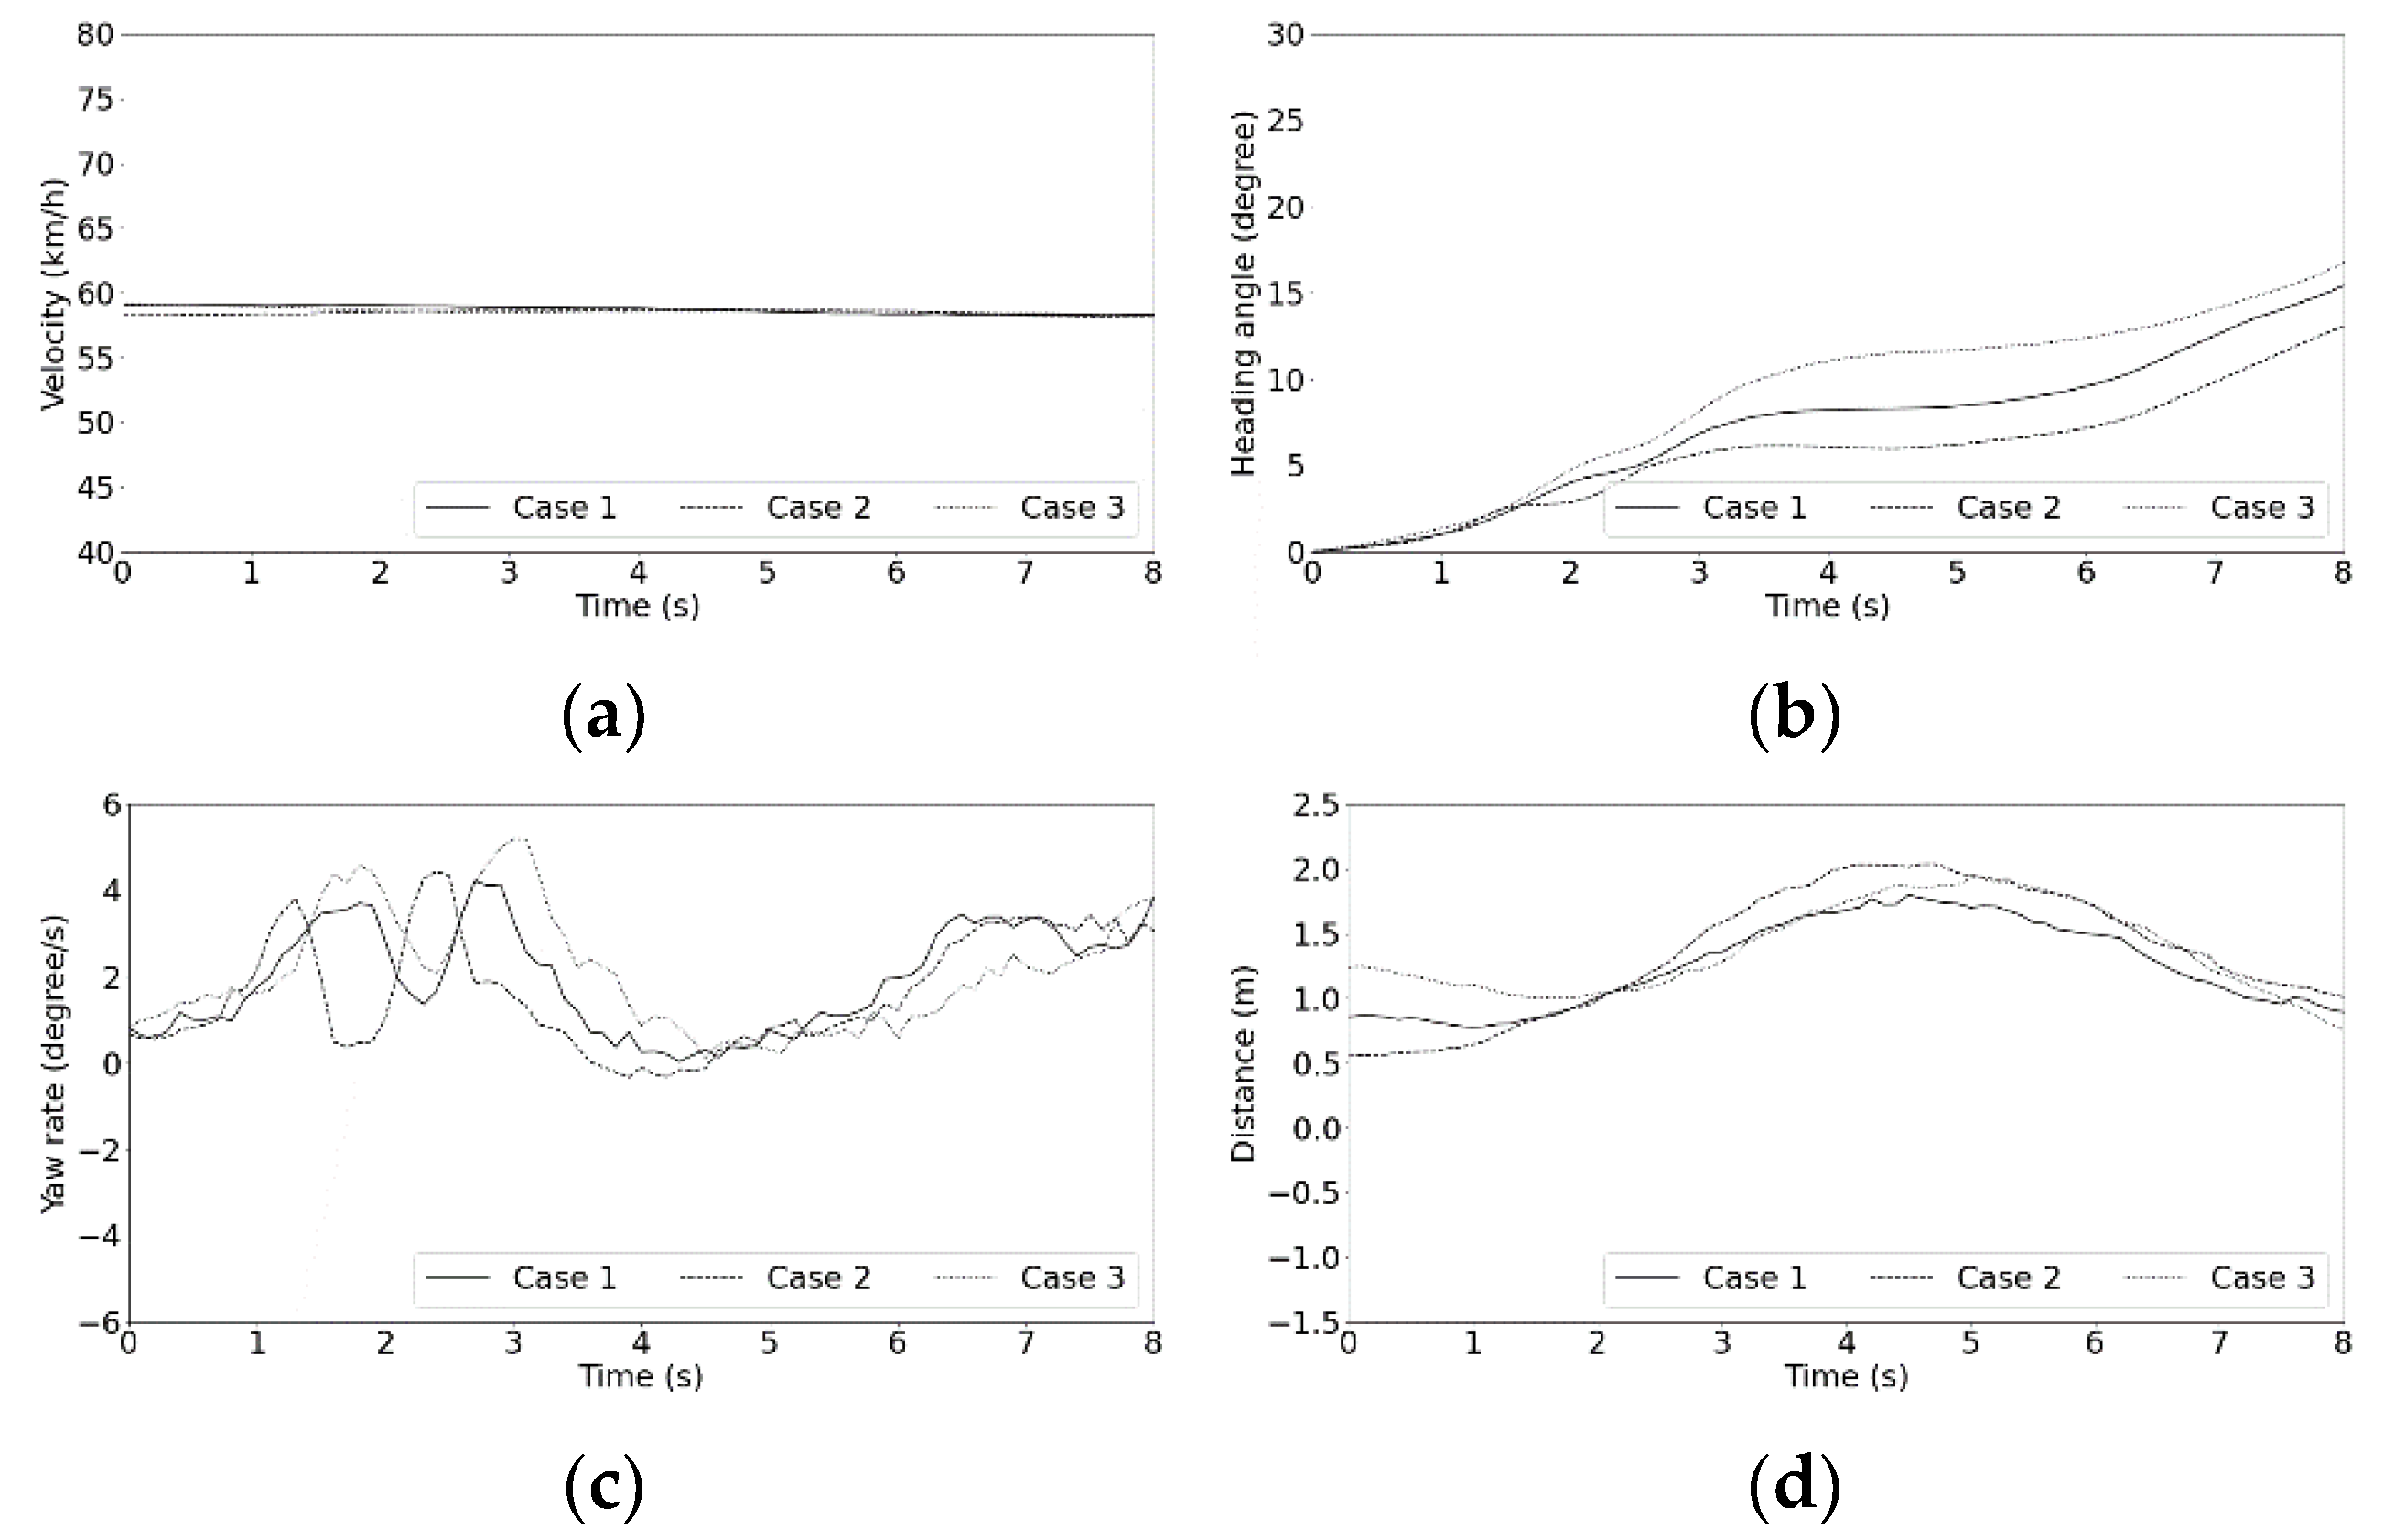
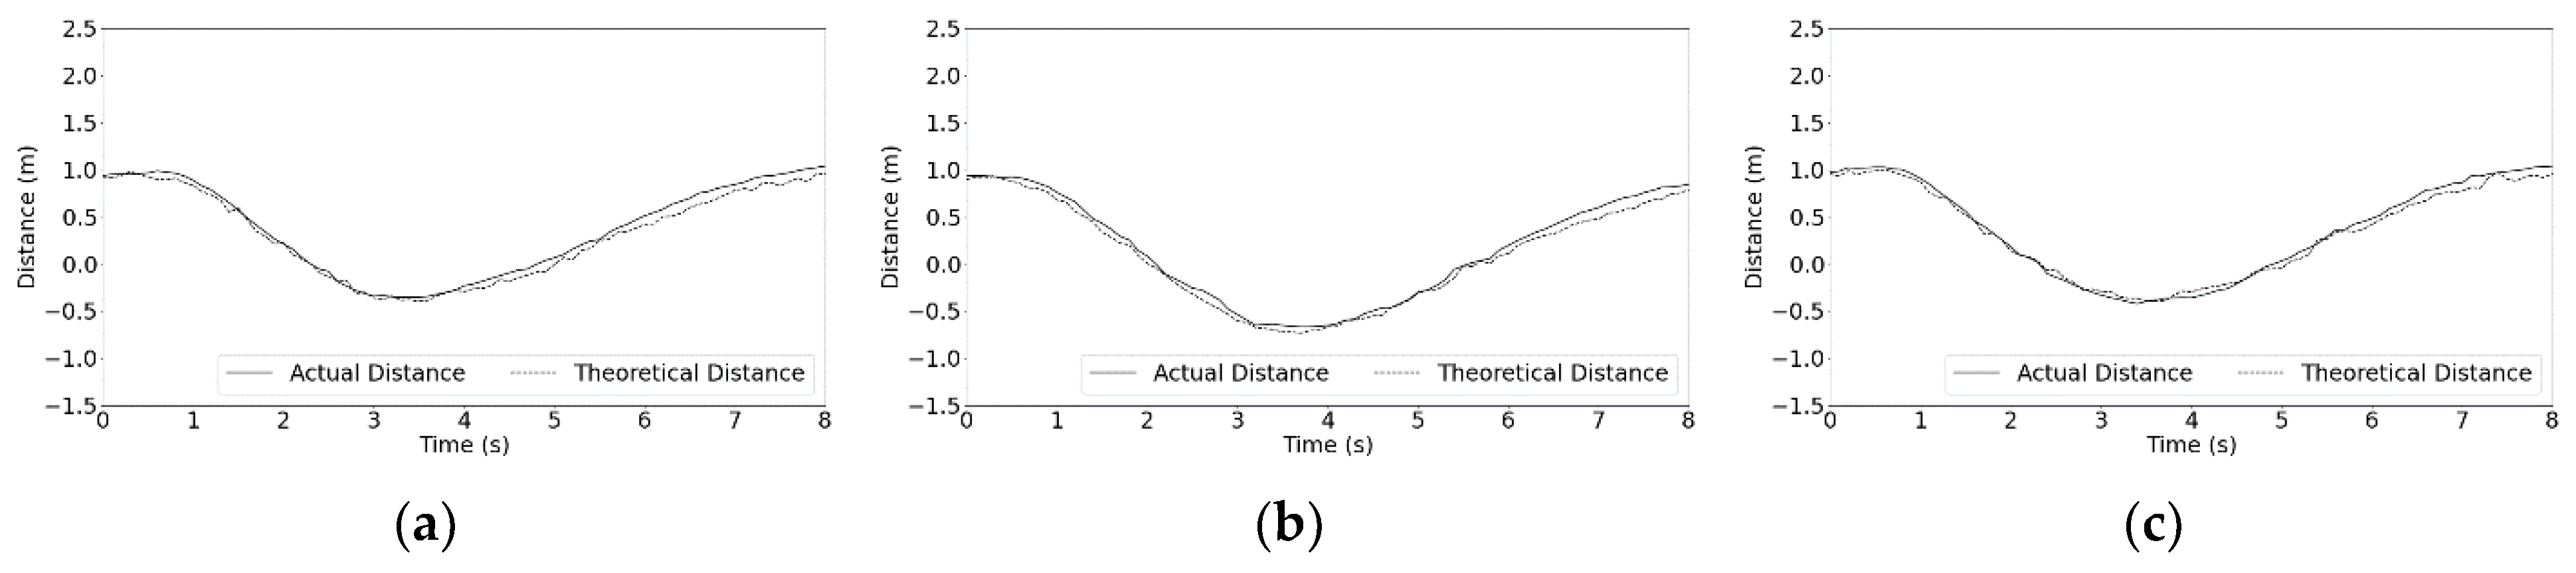
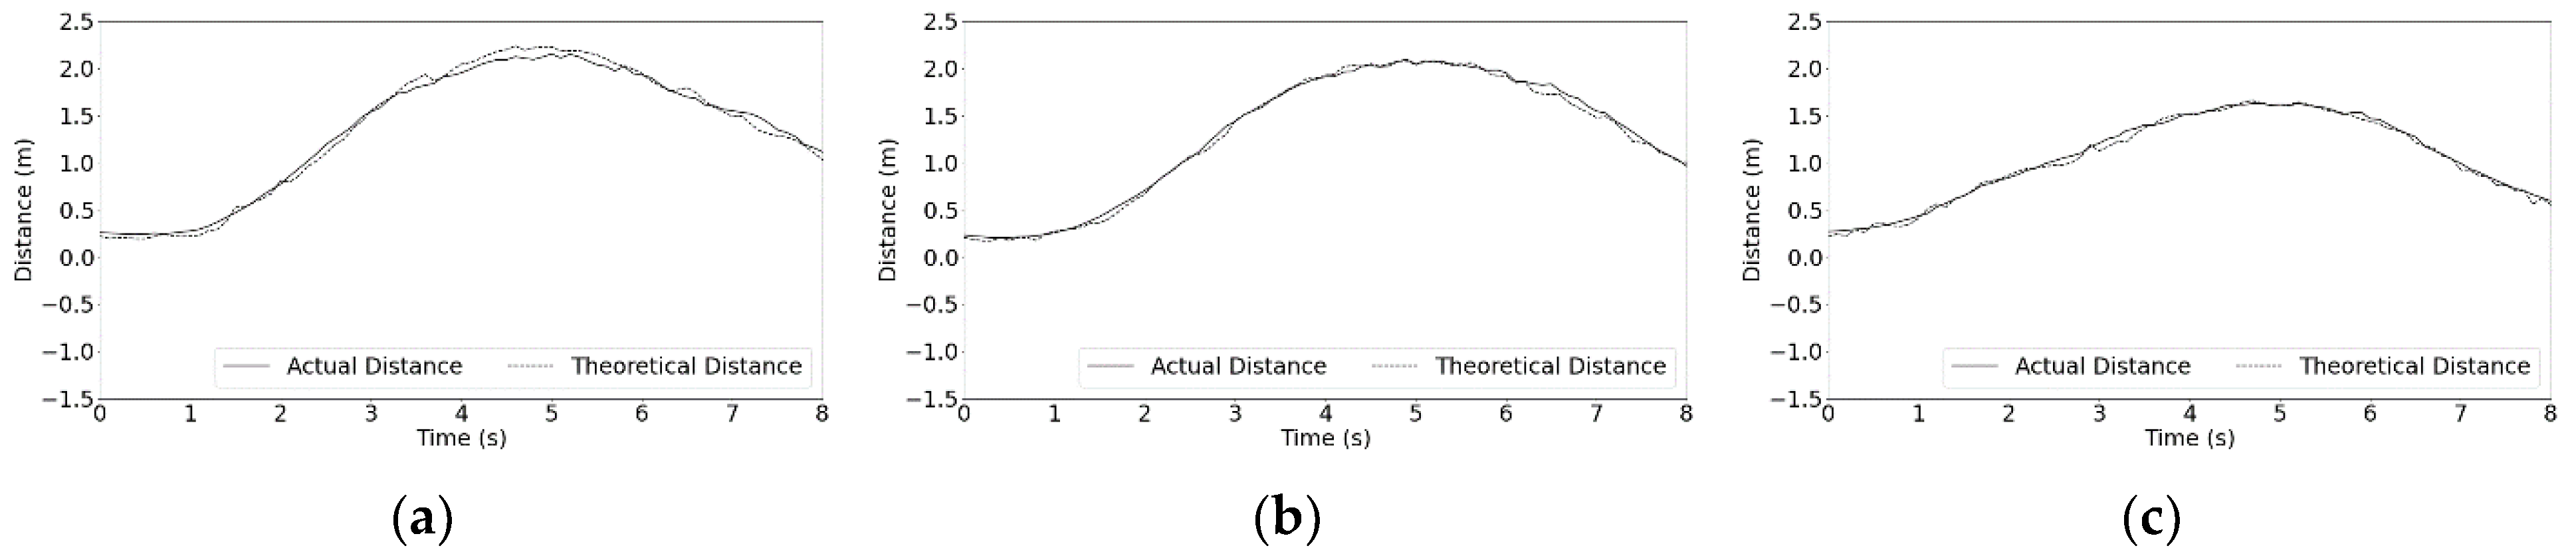
  • Each theoretical value was calculated based on the image obtained using the dual cameras mounted on the vehicle, whereas the corresponding actual value was calculated based on the image obtained using the side camera. For each scenario, the dynamic characteristics of the vehicle were confirmed using experimental equipment installed on the actual vehicle.
  • In the actual vehicle test conducted to verify the study, the velocity, heading angle, and yaw rate data obtained through specialized equipment were analyzed. In addition, it was confirmed that four LKAS scenarios for safety evaluation were properly per-formed. In addition, in order to verify the proposed theoretical equation, the actual value obtained from the side cameras installed on the left and right sides of the vehicle and the theoretical value obtained from the front dual camera were compared and analyzed. The maximum deviation in the whole scenario is 0.17 m, which is similar to the width of a general lane, so the proposed method was judged to be reliable.
Lane detection in this study cited the image processing method and mounting position of the dual camera used in the previous study, and lanes were effectively detected even in general camera specifications. In addition, the theoretical equation proposed in this study is not affected by the resolution of the camera. As a result, compared to the classic single camera solution, it is less affected by the state of the camera and can be applied to the safety evaluation. Through the proposed method, it is expected that inexpensive universal webcams for dual cameras components can be used in the dual cameras component developed for ADAS. As a result, it is possible to reduce the use of expensive professional equipment required for safety evaluation, professional manpower for equipment operation, and time and cost required. In addition, the proposed method can be applied under the conditions presented in this study, and it is expected that the proposed method can be applied in adverse conditions such as bad weather or poor road environment where actual vehicle testing is possible through theoretical verification. In future work, the actual vehicle test can be carried out in high-velocity driving scenarios such as Highway Driving Assistance (HDA) and on roads where lane detection is difficult.

Author Contributions

Conceptualization, S.-B.L.; methodology, S.-B.L.; actual vehicle test, S.-H.L. and S.-B.L.; data analysis, S.-H.L. and S.-B.L.; formal analysis, S.-B.L.; investigation, S.-H.L.; writing—original draft preparation, S.-H.L. and S.-B.L.; writing—review and editing, S.-H.L. and S.-B.L. All authors have read and agreed to the published version of the manuscript.

Funding

This work was supported by Korea Institute for Advancement of Technology (KIAT) grant funded by the Korea Government (MOTIE). This work was also supported by Korea Electronics Association (KEA) and Center for Automotive Mechatronics Parts (CAMP) at Keimyung University. (N0002428, The Competency Development Program for Industry Specialist).

Institutional Review Board Statement

Not applicable.

Informed Consent Statement

Not applicable.

Data Availability Statement

Data is contained within the article.

Acknowledgments

This work was supported by Korea Institute for Advancement of Technology (KIAT) grant funded by the Korea Government (MOTIE). This work was also supported by Korea Electronics Association(KEA) and Center for Automotive Mechatronics Parts (CAMP) at Keimyung University. (N0002428, The Competency Development Program for Industry Specialist).

Conflicts of Interest

The authors declare no conflict of interest.

References

  1. SAE Levels of Driving Automation™ Refined for Clarity and International Audience. Available online: https://www.sae.org/blog/sae-j3016-update (accessed on 18 August 2021).
  2. Shin, H.C.; Kang, K.P.; Park, S.Y. Transport Innovation Prospects and Challenges—Focusing on autonomous vehicle and UAM. Mon. KOTI Mag. Transp. 2021, 4, 6–10. [Google Scholar]
  3. TAAS Traffic Accident Detailed Statistics. Available online: http://taas.koroad.or.kr/web/shp/sbm/initUnityAnalsSys.do?menuId=WEB_KMP_OVT_UAS (accessed on 18 August 2021).
  4. Jo, Y.; Oh, C. Lane Keeping Assist System (LKAS) Effect Analysis Using Meta-Analysis. In Proceedings of the KOR-KST Conference, Seongnam, Korea, 16–17 February 2017. [Google Scholar]
  5. An, X.; Shang, E.; Song, J.; Li, J.; He, H. Real-time Lane Departure Warning System Based on a Single FPGA. EURASIP J. Image Video Process. 2013, 2013, 38. [Google Scholar] [CrossRef] [Green Version]
  6. Kim, H.; Park, S. LSTM Based LKAS Yaw Rate Prediction Model Using Lane Information and Steering Angle. Trans. Korean Soc. Automot. Eng. 2018, 26, 279–287. [Google Scholar] [CrossRef] [Green Version]
  7. Nguyen, V.; Kim, H.; Jun, S.; Boo, K. A Study on Real-Time Detection Method of Lane and Vehicle for Lane Change Assistant System Using Vision System on Highway. Eng. Sci. Technol. Int. J. 2018, 21, 822–833. [Google Scholar] [CrossRef]
  8. Shin, K.; Choi, J.; Huh, K. Study on the Automated Lane Change Algorithm Using Vision Sensor and Pseudo-lane. Trans. Korean Soc. Automot. Eng. 2019, 27, 925–932. [Google Scholar] [CrossRef]
  9. Em, P.P.; Hossen, J.; Fitrian, I.; Wong, E.K. Vision-Based Lane Departure Warning Framework. Heliyon 2019, 5, e02169. [Google Scholar] [CrossRef] [Green Version]
  10. Bian, Y.; Ding, J.; Hu, M.; Xu, Q.; Wang, J.; Li, K. An Advanced Lane-Keeping Assistance System With Switchable Assistance Modes. IEEE Trans. Intell. Transp. Syst. 2020, 21, 385–396. [Google Scholar] [CrossRef]
  11. Chen, W.; Zhao, L.; Wang, H.; Huang, Y. Parallel Distributed Compensation /H∞ Control of Lane-keeping System Based on the Takagi-Sugeno Fuzzy Model. Chin. J. Mech. Eng. 2020, 33, 61. [Google Scholar] [CrossRef]
  12. Yoo, J.; Kim, D. Graph Model-Based Lane-Marking Feature Extraction for Lane Detection. Sensors 2021, 21, 4428. [Google Scholar] [CrossRef]
  13. Meng, Q.; Zhao, X.; Hu, C.; Sun, Z.-Y. High Velocity Lane Keeping Control Method Based on the Non-Smooth Finite-Time Control for Electric Vehicle Driven by Four Wheels Independently. Electronics 2021, 10, 760. [Google Scholar] [CrossRef]
  14. Xu, X.; Grizzle, J.W.; Tabuada, P.; Ames, A.D. Correctness Guarantees for the Composition of Lane Keeping and Adaptive Cruise Control. IEEE Trans. Autom. Sci. Eng. 2018, 15, 1216–1229. [Google Scholar] [CrossRef] [Green Version]
  15. Péter, G.; Kiss, B.; Tihanyi, V. Vision and odometry based autonomous vehicle lane changing. ICT Express 2019, 5, 219–226. [Google Scholar] [CrossRef]
  16. Kővári, B.; Hegedüs, F.; Bécsi, T. Design of a Reinforcement Learning-Based Lane Keeping Planning Agent for Automated Vehicles. Appl. Sci. 2020, 10, 7171. [Google Scholar] [CrossRef]
  17. Gaikwad, V.; Lokhande, S. Lane Departure Identification for Advanced Driver Assistance. IEEE Trans. Intell. Transp. Syst. 2015, 16, 910–918. [Google Scholar] [CrossRef]
  18. Xu, S.; Peng, H.; Lu, P.; Zhu, M.; Tang, Y. Design and Experiments of Safeguard Protected Preview Lane Keeping Control for Autonomous Vehicles. IEEE Access 2020, 8, 29944–29953. [Google Scholar] [CrossRef]
  19. Yang, J.; Kim, S.; Huh, K. Development of a Unified Lane-Keeping and Collision Avoidance System for Semi-Trailer Truck. IEEE Access 2020, 8, 149751–149763. [Google Scholar] [CrossRef]
  20. Woo, H.; Yong, B.; Kim, K. Performance Evaluation of Lane Keeping Assistance System. J. Auto-Veh. Saf. Assoc. 2014, 6, 29–35. [Google Scholar] [CrossRef]
  21. Yoon, P.; Lee, S. A Study on Evaluation Method of the LKAS Test in Domestic Road Environment. J. Korea Acad.-Ind. Coop. Soc. 2017, 18, 628–637. [Google Scholar] [CrossRef]
  22. Bae, G.H.; Lee, S.B. A Study on the Simulation Modeling Method of LKAS Test Evaluation. J. Korea Acad.-Ind. Coop. Soc. 2020, 21, 57–64. [Google Scholar] [CrossRef]
  23. Reddy, N.; Farah, H.; Huang, Y.; Dekker, T.; Arem, B.V. Operational Design Domain Requirements for Improved Performance of Lane Assistance Systems: A Field Test Study in The Netherlands. IEEE Open J. Intell. Transp. Syst. 2020, 1, 237–252. [Google Scholar] [CrossRef]
  24. Jiang, B.; Li, X.; Zeng, Y.; Liu, D. A Maneuver Evaluation Algorithm for Lane-Change Assistance System. Electronics 2021, 10, 774. [Google Scholar] [CrossRef]
  25. Lee, K.; Li, S.E.; Kum, D. Synthesis of Robust Lane Keeping Systems: Impact of Controller and Design Parameters on System Performance. IEEE Trans. Intell. Transp. Syst. 2019, 20, 3129–3141. [Google Scholar] [CrossRef]
  26. Hwang, J.; Huh, K.; Na, H.; Jung, H.; Kang, H.; Yoon, P. Evaluation of Lane Keeping Assistance Controllers in HIL Simulations. In Proceedings of the 17th IFAC World Congress, Seoul, Korea, 6–11 July 2008. [Google Scholar] [CrossRef] [Green Version]
  27. Bae, G.H.; Lee, S.B. A Study on the Test Evaluation Method of LKAS Using a Monocular Camera. J. Auto-Veh. Saf. Assoc. 2020, 12, 34–42. [Google Scholar] [CrossRef]
  28. Lee, S.-H.; Kim, B.-J.; Lee, S.-B. Study on Image Correction and Optimization of Mounting Positions of Dual Cameras for Vehicle Test. Energies 2021, 14, 4857. [Google Scholar] [CrossRef]
  29. Kim, J.; Jun, I. Development of an Evaluation System for a Lane Keeping Assistance System using the Real-time Image. In Proceedings of the KSAE 2019 Annual Autumn Conference & Exhibition, Goyang, Korea, 19–22 November 2014. [Google Scholar]
  30. Yoon, P.; Lee, S. A Study on Safety Evaluation Method of LKAS in Actual Road. J. Auto-Veh. Saf. Assoc. 2019, 10, 33–39. [Google Scholar] [CrossRef]
Figure 1. Vanishing point image obtained from detected lanes.
Machines 09 00310 g001
Figure 2. Extension line image obtained from detected lanes.
Machines 09 00310 g002
Figure 3. Shortest distance to the ground that can be detected in the image.
Machines 09 00310 g003
Figure 4. Geometric composition of the vehicle on the road.
Machines 09 00310 g004
Figure 5. Test vehicle (Genesis G90).
Machines 09 00310 g005
Figure 6. Test devices: (a) RT3002; (b) DS-CAN2; (c) camera.
Machines 09 00310 g006
Figure 7. Test scenarios: (a) Scenario 1; (b) Scenario 2; (c) Scenario 3; (d) Scenario 4.
Machines 09 00310 g007
Figure 8. Vehicle test road: (a) Straight road; (b) curved road.
Machines 09 00310 g008
Figure 9. Test results (Scenario 1): (a) Velocity; (b) heading angle; (c) yaw rate; (d) distance to left lane.
Machines 09 00310 g009
Figure 10. Test results (Scenario 2): (a) Velocity; (b) heading angle; (c) yaw rate; (d) distance to left lane.
Machines 09 00310 g010
Figure 11. Test results (Scenario 3): (a) Velocity; (b) heading angle; (c) yaw rate; (d) distance to left lane.
Machines 09 00310 g011
Figure 12. Test results (Scenario 4): (a) Velocity; (b) heading angle; (c) yaw rate; (d) distance to left lane.
Machines 09 00310 g012
Figure 13. Comparison of actual distance and theoretical distance (Scenario 1): (a) Case 1; (b) Case 2; (c) Case 3.
Machines 09 00310 g013
Figure 14. Comparison of actual distance and theoretical distance (Scenario 2): (a) Case 1; (b) Case 2; (c) Case 3.
Machines 09 00310 g014
Figure 15. Comparison of actual distance and theoretical distance (Scenario 3): (a) Case 1; (b) Case 2; (c) Case 3.
Machines 09 00310 g015
Figure 16. Comparison of actual distance and theoretical distance (Scenario 4): (a) Case 1; (b) Case 2; (c) Case 3.
Machines 09 00310 g016
Table 1. Test vehicle specifications.
NameSpecification
Genesis G90Overall length: 5205 mm;
Overall width: 1915 mm;
Overall height: 1495 mm;
Wheel base: 3160 mm;
Drive type: all-wheel drive
Table 2. Test device specifications.
NameSpecification
RT3002L1/L2 Kinematic GPS with positioning accuracy to 2 cm RMS;
Single-antenna model;
Velocity accuracy: 0.05 km/h RMS;
Roll, pitch: 0.03°;
Heading: 0.1°;
GPS accuracy: 2 cm RMS
DS-CAN2Interface data rate: up to 1 bit/s;
Sampling rate: >10 kHz per channel software selectable
CameraFocal length: 3.67 mm;
Diagonal field of view: 70.42°;
Horizontal field of view: 43.3°;
Diagonal field of view: 78°;
Max frame rate: 1080 p@30 fps;
Optical resolution: 3 megapixels;
Table 3. Test road conditions.
NameCurvature (m)Width (m)Length (m)Condition
Straight road03.1300 mDry and flat asphalt
Curved road5003.1350 mDry and flat asphalt
Table 4. Comparison of actual distance and theoretical distance.
ScenarioCaseActual Distance (m)Theoretical Distance (m)Deviation (m)Error (%)
111.010.87−0.1413.9
20.670.54−0.1319.4
30.930.80−0.1214.0
211.481.34−0.149.5
21.831.72−0.116.0
31.341.22−0.139.0
311.801.63−0.179.4
21.411.25−0.1611.3
31.381.21−0.1712.3
411.731.880.158.7
21.791.64−0.158.4
31.571.44−0.138.3
Publisher’s Note: MDPI stays neutral with regard to jurisdictional claims in published maps and institutional affiliations.

